Recent Advances in Vibrations Analysis Part 6 docx
Bạn đang xem bản rút gọn của tài liệu. Xem và tải ngay bản đầy đủ của tài liệu tại đây (2.75 MB, 20 trang )
Maintenance of Reducers with
an Unbalanced Load Through Vibration and Oil Analysis Predictive Techniques
89
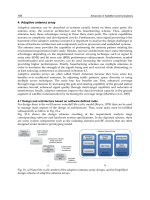
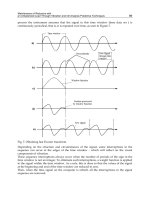
process the instrument assumes that the signal in this time window (time data set ) is
continuously periodical, that is, it is repeated over time, as seen in Figure 7.
Fig. 7. Obtaining fast Fourier transform.
Depending on the structure and circumstances of the signal, some interruptions in the
sequence can occur at the edges of the time window - which will reflect on the visual
components of vibration.
These sequence interruptions always occur when the number of periods of the sign in the
time window is not an integer. To eliminate such interruptions, a weight function is applied
to the signal within the time window. As a rule, this is done so that the values of the signal
at the beginning and end of the time window are reduced to zero.
Then, when the time signal on the computer is rebuilt, all the interruptions in the signal
sequence are removed.
Recent Advances in Vibrations Analysis
90
Evidently, because of this "manipulation", the machine’s original vibration signal is
distorted. To correct this, the results of the transformation are multiplied by a correction
factor so that the exact values of magnitude are maintained, after processing.
3.3 Vibration analysis by global levels
In the case of application for predictive maintenance, the international technical standards,
including the ISO, define two criteria for the adoption of a global value. One method
assesses the severity of vibration by absolute measurement of non-rotating parts. The other
one assesses conditions of the machine by direct measurement of oscillation of the shaft.
(Gonçalves et all, 2007).
According to NBR 10082 a rating of acceptable levels of vibration severity for similar
machines is established and grouped into classes. Table 3 shows the guidance offered by this
standard, where:
Class I - Small machines activated by directly coupled electric motor, maximum power of 15
kW.
Class II – Mid-sized machines, class I type, with power greater than 15 kW, up to 75 kW.
Motors or machines rigidly mounted up to 300 KW.
Class III - Large driving machines and other large machines (> 75 kW) with rotating masses
mounted on rigid and heavy foundations, which are relatively rigid in the measuring of
vibration.
Class IV - Machines of the Class III type, mounted on relatively flexible foundations in the
measuring of vibration, for example, a set of turbogenerators.
Range of vibration severity Avaliation of quality for differents machine classes
Range Velocity in limits
(mm/s)
Class I
Class II
Class III
Class IV
0.28 0.28 A A A A
0.45 0.45 A A A A
0.71 0.71 A A A A
1.12 1.12
B A A A
1.8 1.8 B B A A
2.8 2.8
C B B A
4.5 4.5 C C B B
7.1 7.1
D C C B
11.2 11.2 D D C C
18 18 D D D C
28 28
D D D D
45 45 D D D D
71 upper 45
D D D D
Table 3. Classification and assessment of machines by vibration severity levels.
Where:
A = Proper conditions;
B = Acceptable for continued operation;
C = Tolerable Limit;
D = Non-permissible.
Maintenance of Reducers with
an Unbalanced Load Through Vibration and Oil Analysis Predictive Techniques
91
For rotating machines with rotation speeds in the range of 600 to 12,000 rpm (10 to 200 Hz),
ISO norm 2372, VDI Richiline 2056, and in Brazil by NBR 10082, take the value of effective
vibration speed, known as rms speed of the signal, as the unit of measure for identifying the
severity of vibration (Arato, 2004).
The parameter to be measured is the absolute velocity of vibration on the machine parts,
preferably the bearings. In this case, the global value chosen as the unit of measure to
indicate the vibration severity, the effective value, or simply RMS speed (V
ef
) is not
represented by a single scale of values. This is due to the great diversity of forms, mass,
assembly and operational conditions of the equipment, which results in the RMS speed
values for different levels of acceptable severity, (Gonçalves et all , 2007).
3.4 Demodulation
In more complex situations, where there is a combination of more than one source of
excitement added to the noise transmitted through the support and foundations of the
machines, the obtained spectrum of frequencies can present difficulties in the analysis
(Arato, 2004).
In cases like this it is necessary to use other more dedicated techniques, such as the
technique of demodulation, which enables identifying noise sources responsible for the
excitation of resonant responses in the structure, hence allowing to monitor defects that are
responsible for impacts of the repeated excitation type, in addition to others that produce
modulator signals, even if the level of energy of the source does not allow a direct
identification of its frequency in the general spectrum, as it generates amplitudes of minor
significance, which remain hidden in the level of background noise.
Taking into consideration, by generalization, that the modulation in magnitude of a signal is
defined as the multiplication of one sign for another, a nonlinear inherent process that
creates new frequencies are not present in any of the signals involved. The identification of
the noise source associated with the defect requires identifying the frequency of the
modulating signal, (Arato, 2004).
The process of identifying the modulating frequency of a modulated signal is known as
demodulation, and includes the following steps, (Arato, 2004):
a. Filtering of the signal by band-pass filter for the frequency range identified as
modulated;
b. Detection of the modulator signal;
c. Spectral analysis of this detected modulator signal.
For the detection of the modulator signal there are several techniques. Application of the
Hilbert transform that can be obtained from X (f), which is the Fourier transform of the
filtered signal x(t) , according to the equations below.
2
0
() Re 2 ( )
ift
re
xt Xfe df
(5)
ift
im
xt Xfe df
2
0
() Im 2 ( )
(6)
Obtaining the signals x
re
(t) and x
im
(t) from which an analytical signal z(t) = x
re
(t) + ix
im
(t)
(Bendat(1986) can be constructed, (apud Arato & Silva, 2000), which can be represented by
Recent Advances in Vibrations Analysis
92
Equation 7, where A(t) is the envelope and (t) is the instantaneous phase of the signal x(t),
according to Equations 8 and 9.
)(
)()(
ti
etAtz
(7)
)()()(
2
1
2
txtxtA
(8)
)(
)(
)(
1
1
tx
tx
tgt
(9)
4. Materials and methods
In this work, to verify the effectiveness of the techniques studied, a reducer of the worn
drive type was monitored. For this monitoring a test bench was built, where the reducer,
coupled with its entry shaft to an electric motor, by means of an elastic coupling, had a load
of an unbalanced mass in its output shaft.
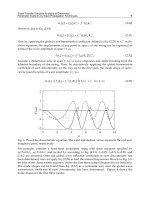
A photograph of the bench is shown below in Figure 8. The electric motor used is a WEG,
220 V, 60 Hz, three-phase power with 0.5 CV power and 1720 rpm.
Fig. 8. Test bench for verification of the studied techniques.
The reducer used was a Macopema, ZM reducer, worn thread, with a reduction of 1:30, 0.53
CV at the entry and 0.31 CV at the output, with oil capacity of 0.25 liters.
Rolling element bearing (www.skf.com)
Shaft rotation
Engagement
Model 6008 6204
f
i
p
197 Hz 142 Hz exit entry
28.67 Hz
f
e
p
147 Hz 87.5 Hz
0.95 Hz
28.67 Hz
f
r
p
191 Hz 114 Hz
f
gp
13.2 Hz 11 Hz
Table 4. Preferred vibration frequencies of the reducer.
Maintenance of Reducers with
an Unbalanced Load Through Vibration and Oil Analysis Predictive Techniques
93
At the output of the reducer a bearing was attached and after the bearing a 7.5 kg mass with
a 195 mm arm.
The preferred vibration frequencies of the reducer analyzed were calculated, as illustrated in
Table 4.
Where:
f
ip
= defect frequency of inner race.
f
ep
= defect frequency of outer race.
f
rp
= defect frequency of rolling bearing elements.
f
gp
= defect frequency of cage.
The tests were conducted after a running period of 168 hours, for four weeks, and each week
(168 hours) oil samples were collected.
Oil recommended by the manufacturer was used; beyond oil with several percentages of
liquid contamination and oil with various percentages of solid contamination.
This work presents results obtained from the first four weeks of testing, with ISO 320 oil that
was recommended by the manufacturer of the reducer.
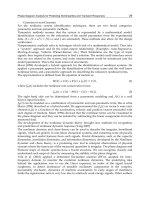
The vibration measurements were collected in the three directions of the reducer. Analyses
were performed in time and frequency in order to determine the beginning and severity of
the active wear where the sensors were placed for collection of the vibration signs. Figure 9
shows the points along the reducer where the sensors were placed for collection of the
vibration signs.
Fig. 9. Collection points of vibration signals.
According to the norms the bearings should be monitored first, thus points 3 and 7 were
chosen. Points 2 and 5 represent the other two directions. These points contain all the
information provided by points 1, 4, 6 and 8.
The time vibration signals were obtained by measuring the vibration speed of the reducer.
For such measures piezoelectric accelerometers, a 4-channel Conditioner/ Amplifier, data
acquisition system DaqBooK and a Notebook were used. The sampling frequencies were of
500 Hz, 1 kHz, 5 kHz and 10 kHz, and the corresponding analog filters were of 141 Hz, 281
Hz, 2250 Hz and 4500 kHz. For each frequency 10 samples were taken out of 2048 points.
The time vibration signals obtained were processed using the algorithm FFT (Fast Fourier
Transform), and analyzed in the laboratory through the “software” DASYlab.
Recent Advances in Vibrations Analysis
94
As the accelerometer measures the vibration speed of the reducer, using a reading indicator,
the measured value of greatness is obtained directly, that is, the value of the effective
vibration speed for each distinct sampling frequency. The value of the vibration severity
however, is obtained when a vibration signal of a sampling frequency of 5000Hz is read, but
subjected to a high-passed filter of 10 Hz and a low-passed of 1000 Hz. Both the effective
value of the vibration speed and the severity of vibration were obtained using the
“software” DASYlab, which contains numerous tools as: reading indicators, filters, etc.
The vibration analysis was achieved by spectral analysis, analysis by demodulation and the
values of the effective vibration speed and vibration severity.
For demodulation of the signal it was necessary to use a computational routine on the
Matlab platform called DEMOD, created by Arato (2004) and responsible for the calculation
of Hilbert transformed.
Only the time signals obtained in points 2 and 5, when subjected to high frequencies of
sampling were demodulated, due to the fact they are the only signals demonstrating
frequencies that can be resonant. After demodulation the signal was processed to obtain the
spectrum of the demodulated signal.
Oil samples were prepared in the rotary particle depositor (RPD), and then examined and
photographed using the optical microscope Neophot 21 with adapted light transmitted. In
the RPD lamina the particles are arranged in three separate rings, depending on the size of
the particle, due to this, it was necessary to capture the images by observing these three
rings separately.
Using the automatic monitor of ferrous particles, the PQ index of the samples was obtained.
Also the viscosity, water content, the acidity index and atomic absorption of the oil samples
were obtained at the end of each test.
5. Results and discussions
5.1 Analysis of lubricant
Initially, the inner elements of the reducer were photographed for a subsequent comparison
and verification of wearing.
Fig. 10. Inner elements of the reducer. On the left is the worn screw and on the right the
crown gear.
Figure 11 shows the photographs after the first week of the experiment.
In the figure above it can be seen severe wear particles (1
A
), bronze particles (2
A
), laminar
particles (3
A
) and cutting particles (4
A
).
Figure 12 shows the photos obtained after the second week of the experiment.
Maintenance of Reducers with
an Unbalanced Load Through Vibration and Oil Analysis Predictive Techniques
95
Fig. 11. Wear particles generated in the first week of the first experiment with transmitted
and reflected light. First picture: inner ring of the RPD. Second photo: outer ring. Other
photos: intermediary ring.
Fig. 12. Wear particles generated in the second week of the first experiment with reflected
light and in the inner ring of RPD. The three photos are from the same field of vision but
with different focal heights.
By Figure 12 the visual difficulty of the laminar particles can be perceived.
Figure 13 illustrates the photos obtained after the third week of the experiment.
Through Figure 14 the presence of oxide (1
A
), laminar particles (2
A
), bronze detained
between the ferrous particles (3A) and parts difficult to focus can be seen (4
A
and 5
A
). The
last two figures also show the need to vary the type of light in the verification of the
particles.
Table 5 presents the tests values of TAN, viscosity at 40
0
C and 100
0
C, after the end of the last
week of the first experiment. Table 6 shows the result of the atomic absorption at the end of
this experiment. Table 7 shows the figures obtained in the direct ferrography during the
experiments, represented by the PQ index of the magnetic particles counter. Figure 15
shows the state of the reducer after the experiments.
Recent Advances in Vibrations Analysis
96
Fig. 13. Wear particles generated in the third week of the first experiment with reflected and
transmitted light in the intermediary ring of RPD.
Through the figure above the severe wear particles represented by striation (1
A
) and the
particles overlapping the others (2
A
) can be seen.
In Figure 14 the photos obtained after the fourth week of the experiment are shown.
Fig. 14. Wear particles generated in the fourth week of the first experiment The first photo is
of the inner ring of RPD observed with transmitted and reflected light. The second photo is
of the outer ring with the same lights. The third one is the intermediary ring with the same
lights. The last two are also of the intermediary ring; the second to last is with transmitted
and reflected light and the last one with only transmitted light.
Water TAN Viscosity at 40
0
C Viscosity at 100
0
C
ASTM D 95 ASTM D 664 ASTM D445 ASTM D 445
(%) mg KOH/g cSt cSt
0.00 1.17 295 42
Table 5. Tests conducted on the oil at the end of the experiment.
Maintenance of Reducers with
an Unbalanced Load Through Vibration and Oil Analysis Predictive Techniques
97
Atomic absorption
Cu Si Al Fe Pb Cr Ni
Ppm ppm ppm ppm ppm ppm ppm
580 18 4 142 0 0 7
Table 6. Atomic Absorption conducted on the oil at the end of the experiment. Atomic
absorption
Test A
1
st
Sample 2
nd
Sample 3
nd
Sample 4
nd
Sample
670 1680 3050 4000
Table 7. PQ Rates obtained on the particle monitor.
Fig. 15. Inner elements of the reducer after the first test.
Through Table 5 it was noticed that the viscosity at 100
0
C increased from allowable range
(27.9-33.3), according to the specifications of the new oil, to 42.03. This means an alert since
the 10% of the permissible range was exceeded. This may be an indication of oxidation of
the oil.
In Table 6 large amounts of Cu was noticed in the bronze of the crown and Fe in the alloy
steel from which the pinion is manufactured. The Si is an indicator of external
contamination.
In Table 7 the gradual wear of the pinion can be seen. As the samples were not changed
during the first experiment, the quantity of metallic particles accumulated during the weeks
of this first experiment.
5.2 Analysis of vibrations
Several vibration measures were taken at various points of the reducer. In the following
Figures some measures taken at some points are presented. Table 8 shows the effective
value and the severity value of the vibration velocities.
Vibration effective value (mm/s) Vibration Severity
500Hz 5000Hz 10KHz NBR 10082
Point 2 0.27 0.71 0.99 0.64
Point 3 0.34 0.43 0.54 0.51
Point 5 0.37 0.44 1.09 0.42
Point 7 0.51 0.64 0.68 0.61
Table 8. Effective value of vibration speeds (mm/s) and severity values of vibration by the
NBR 10082 norm, (10 to 1000Hz), at the end of the last week of the first experiment.
Recent Advances in Vibrations Analysis
98
Fig. 16. Vibration spectra obtained at point 2, for sampling frequencies of 500, 1000, 5000 and
10000 Hz with analog filters of 141, 281, 2250 and 4500 Hz respectively, at the last week of
the first experiment.
Fig. 17. Vibration spectra obtained at point 5, for sampling frequencies of 500, 1000, 5000 and
10000 Hz with analog filters of 141, 281, 2250 and 4500 Hz, respectively, after the last week
of the first experiment.
Figure 18 presents a graph showing the trend of the values obtained in the four weeks of the
first test for points 2, 3, 5 and 7.
Maintenance of Reducers with
an Unbalanced Load Through Vibration and Oil Analysis Predictive Techniques
99
Fig. 18. Evolution of the vibration severity in accordance with the NBR 10082 norm.
Considering that our experiment fits in Class I of the NBR 10082 norm, we found that all the
values are within the range considered to be in good conditions, that is, within the range A
of Table 3.
Resonant frequencies were found in points 2 and 5 of the reducer. These were demodulated
when subjected to a sampling frequency of 10kHz.
Figure 19 shows Point 2 with a cutoff frequency of 250 and 450Hz, where demodulation was
performed on the sampling signal of 10 KHz at the end of the first experiment.
Fig. 19. Filtered time signal around the resonance frequency using a cutoff frequency of 250
Hz and 450 after demodulation by the program DEMOD followed by its spectrum.
Figure 20 shows Point 5 with a cutoff frequency of 2900 and 3300Hz, where demodulation
was done on the sampling signal of 10 KHz at the end of the first experiment.
Recent Advances in Vibrations Analysis
100
Fig. 20. Filtered time signal around the resonance frequency using a cutoff frequencies of
2900 and 3300 Hz, after demodulation by the program DEMOD followed by its spectrum.
Through demodulation of the signal it was observed that these frequencies are not related to
bearing defects.
6. Conclusions
The type of reducer used, worn drive, is difficult to analyze because in this case there is a
low rotation shaft (exit of the crown, which in our case is of 0.95 Hz) and the engagement
frequency coincides with the rotation shaft frequency, given that the worn screw has a
single entry.
In the studied reducer the oil analysis showed a certain advantage, given that since from the
beginning this operation demonstrated the reducer’s improper operation, while the
vibration analysis was difficult to use given that the rotation shaft and engagement
coincided.
The experiments also demonstrated that if in a system an abnormal occurrence takes place,
for example an extra load during a certain period of time, the subsequent vibration analysis
may not perceive what took place if no permanent damage occurred, however the oil
analysis will acknowledge that there was such a problem during the operation.
No bearing defects were found in the spectra and neither in the demodulation.
After disassembling the reducer it was found that the axis bearings of the worn screw were
loose. The literature shows that the loose bearings are represented by the frequency of the
spin axis and its harmonics, which is the same case as the wear. This fact was difficult to
check because of the coincidence of such frequencies.
One of the simplest tests, the counting of particles through the automatic monitor of PQA
particles, showed a high generation of magnetic particles from the first sample.
The atomic absorption performed at the end of each test also provided important
information about the tribological condition of the system, where a large amount of copper
particles can be noted from the crown and iron resulting from the pinion.
The reducer’s incorrect operation can also be verified by a visual inspection of the particles.
Most of the photos demonstrate the presence of many ferrous particles and some copper
particles. We also found many wear particles by friction (laminar particles) and severe wear
particles by sliding, which are particles with striation.
Maintenance of Reducers with
an Unbalanced Load Through Vibration and Oil Analysis Predictive Techniques
101
7. Acknowledgment
For Continuos Funding and support, I thank:
FUNDUNESP - Unesp Development Foundation;
FAPESP- State of Sao Paulo Research Foundation;
CNPq – National Counciul for Scientific and Technological Development;
FINEP – National Fund for Studies and Projects.
8. References
Anderson A, Sweeney A, Willians G.(1999). How to make decisions. In: ___ Quantitative
approaches to decision making. 9.ed. South Western: College Publishing, 1999.
p.666-671.
Arato, A.(2004). Manutenção preditiva usando análise de vibrações. Barueri: Manole, 2004.
190 p.
ASSOCIAÇÃO BRASILEIRA DE NORMAS TÉCNICAS – ABNT. NBR 10082: vibração
mecânica de máquinas com velocidades de operação de (600 a 12000) rpm – bases
para especificação e padrões de avaliação, 1987.
Azovtev, A.; Barkov, A.(1998). “Development of Condition Diagnostics in Russia Using
Vibration”, Vibro Acoustical Systems and Technologies, Inc. (VAST), Saint
Petersburg, Russsia, 16p., 1998.
Barraclough T G, Sperring T P, Roylance, B J, Nowell, T.(1999). Generic-based wear debris
identification –on the first step towards morphological classification. In:
PROCEEDING OF THE INTERNATIONAL CONFERENCE ON CONDITION
MONITORING, 1999, Swansea. Proceedings Oxford: Coxmore Publishing, 1999.
p.525-538.
Bendat, Julio & Pierson, Allan G.(1986). “Randon data: Analysis and Measurment
Procedures”, John Wiley, EUA, 1986.
Diana, G.; Chelif, F.(1999). “Vibration Mechanics”, SFM: Société Française des Mécaniciens,
Acoustical and Vibratory Surveillance Methods and Diagnostic Techniques, Senlis,
France, p.475-486, 10-12 October, 1999, vol 2/2.
Gonçalves A C, Lago D F, Cunha R C. (2007). Vibration and wear Particles Analysis in a test
Stand. Industrial Lubrication and Tribology. Vol 59, issue 5, 2007, ISSN: 0036-8792
Gonçalves, A. C. ; Campos-Silva, J.B.(2011). Predictive Maintenance of a Reducer with
Contaminated oil Under an Excentrical Load Throug Vibration and Oil Analysis.
Journal of the Brazilian Society of Mechanical Sciences and Engineering (Impresso),
v. XXXIII, p. 1/1-7, 2011.
Gonçalves, A. C. ; Padovese, L. R.(2010) . Vibration and oil analysis for monitoring problems
related to water contamination in rolling bearing. In: First International Brazilian
Conference on Tribology - TriboBR 2010, 2010, Rio de Janeiro. First International
Brazilian Conference on Tribology - TriboBR 2010 and ITS - IFTo MM 2010 - 2nd
International Tribology Symposium of IFToMM, 2010.
Grenn A. (2003). “The study of the failure modes of a spur gear using vibration an particle
analysis techniques” JAMES COOK UNIVERSITY School of engineering, 2003
Hutchings, I. M.(1992). Tribology: friction and wear of engineering materials. Londres:
Edward, 1992.
Recent Advances in Vibrations Analysis
102
Kato K.; Adachi K. Wear mechanisms.(2001) In: BHUSHAN, B. (Ed.). Modern tribology
handbook: principles of tribology. Boca Raton: CRC Press, 2001.
Kimura, R. K. ; Gonçalves, A. C.(2009) . Análysis of biodiesel type and contamination level
on lubricant properties of diesel stationary enginees. In: 20th International
Congress of Mechanical Engineering, 2009, Gramado. 20th International Congress
of Mechanical Engineering -COBEM2009, 2009.
Lockwood F E, Dalley R. Lubricant analysis. (1992). In: HENRY, S. D. et al. (Ed.). ASM
Handbook: friction, lubrication, and wear technology. Metals Park: The Materials
Information Society, 1992. v.18, p.299-312.
Mirshawha, V. (1991). “Manutenção Preditiva: Caminho para Zero Defeitos”, São Paulo,
Makron, McGraw-Hill, 1991, 317p.
Modern Tribology Handbook, Vol. I ("Principles of Tribology"), Edited by Bharat Bhushan,
CRC Press, 2001
Parker.(2000). The handbook of hydraulic filtration. Metamora: Parker, 2000. p 12-19.
POA. (2002). “Practicing Oil Analysis”, November – December, 2002, p. 46 – 50.
Rabinowicz, E.(1995). Friction and wear of materials. 2. ed. New York: John Willey and Sons,
1995.
Wang, H.; Williams, K.(1995). “The Vibrational Analysis and Experimental Verification of a
Plane Electrical Machine Stator Model”, Mechanical Systems and Signal Processing,
p.429- 438, 1995.
0
Probabilistic Vibration Models in the Diagnosis of
Power Transformers
Pablo H. Ibargüengoytia
1
, Roberto Liñan
1
, Alberth Pascacio
1
and Enrique Betancourt
2
1
Instituto de Investigaciones Electricas
2
Prolec General Electric
Mexico
1. Introduction
Power transformers are some o f the most important equipment for the transmission and
distribution of electric power. A single failure in a transformer causes disturbances in the
electric network and may cause severe conflicts in hospitals, banks, industrial installations or
urban areas in general.
In Mexico, the transmission network is composed by 350 power substations and 2,580
power transformers. The capacities of these transformers are typically 375, 225 and
100 MegaVoltAmpere (MVAS), with a nominal tension of 400 kV, 230 kV and lower.
Approximately 27% of these transformers have more than 30 years in operation. For this
reason, it is important to o bserve and register the amount and type of failures that have
presented the transformers in the country.
Table 1 shows the type of transformer failures from 1997 to 2007 (CFE, 2010).
Failure 1997 1998 1999 2000 2001 2002 2003 2004 2005 2006 2007 Total
winding insulation 116510529465669
core
00000000002 2
bushing
3253131157536
on load tap changer
2022221123118
explosion with fire
1300202030011
other failures
1010241200011
TOTAL 18 11 13 15 12 11 14 8 16 15 14 147
Table 1. Type of failures in transformers since 1997.
Notice that the highest percentage of failures corresponds to isolation in the windings.
Problems with insulation represent 80% of the f ailures f or contamination, aging and co re
insulation. Other causes can be overvoltage or short circuits. The insulation failures can be
slow degradation, while overvoltage and short circuits represent instantaneous failures. The
Mexican case is not unique. Failures in transformers in United States and Russia show similar
results.
All these common failures can be considered as mechanical failures, in contrast to other
chemical based failures. Consequently, mechanical failures cause vibration.
6
2 Vibration Analysis
Literature reports different methods for the diagnosis of power transformers. Among the most
important are the following:
• dissolved gas analysis: analyzes the chemical composition of the isolating oil. Percentages
of different gases are found and tables provide a relation between these percentages and
the status of the transformer. It is widely used to detect all the faults related with oil.
• frequency response analysis: analyzes the transformer response given a voltage or current
excitation. The response is analyzed in the domain of frequency in magnitude and phase.
Later, this response is compared with known reference responses and then, a difference
from the correct operation can be detected. Also, a signature of certain faults can be
obtained and compared.
• partial discharge: utilizes acoustic sensors to detect the location of partial discharges
occurrence inside the transformer. A partial discharge is a transient electric discharge that
bridges the isolation gap between two conductors. It is then possible to detect deficiencies
in the transformer isolation.
An alternative method for detecting failures in transformers is the analysis of the vibration
produced inside the transformer due to its operation. Normally, the transformer produces
vibrations in the windings and the core, and these vibrations vary according to certain
operative conditions. Also, in the presence of mechanical failures, the vibration pattern is
different than in normal conditions. One advantage of this alternative method for detecting
failures, with respect to the mentioned methods is that it is possible to design an on-line
diagnosis system. This implies that the detection of the incipient failures can be achieved
at all times, while the transformer is working.
This chapter presents the development of a probabilistic model of the vibrations in a
transformer given all the possible combinations of operating conditions. The probabilistic
models are Bayesian networks (BN). The BN are directed acyclic graphs that represent the
probabilistic relation between the variables in a domain. In this case, we obtain a Bayesian
network that codifies the re lation between the vibration signals with all the variables that
conform the operative conditions. The model is obtained using automatic learning algorithms
applied to historical data of the transformer working at different conditions. The BN is used
to calculate the probability of a failure, given the evidence from the operative conditions.
The next section establishes the central problem in this p roject, namely the vi brations in a
power transformer. Also, section 2 reviews reviews some of the related work reported in the
literature.
2. Power transformers
The transformer is an electrical device without moving parts, that is used to transfer energy
from one circuit to another through a common magnetic field, with no direct electrical
connection between the two circuits, (Harlow, 2007).
Basically consists of two or more windings (coils) and a common core of steel. When a voltage
is applied in the exciting coil, the coils exchange energy via magnetic induction that occurs
when an electric current variation in time is passed in one of them.
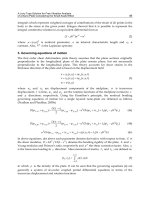
Figure 1 shows the idealized model of a two windings transformer with steel core. When
applied an alternating voltage (V1) to the exciting winding, a current (I1) flows and generates
a magnetic flux (φ). The flux circulates in the steel core so that the voltage (V2) is induced
104
Recent Advances in Vibrations Analysis
Probabilistic Vibration Models in the Diagnosis of Power Transformers 3
in the second winding. The ratio of applied voltage and i n duced voltage ideally depends
on the number of turns of e ach coil. For example, if the num ber of tur n s in the primary
winding is twice that of the secondary winding, then the voltage V2 induced in the secondary
is half of V1. This considering that almost 100% of the flow is driven by the core. In power
transformers is commonly used steel laminated core for high capacity that has to drive the
magnetic flux (steel core laminated from very thin sheets, such as .23 mm for reduced eddy
and hysteresis losses). The ability of a material to conduct magnetic flux is called permeability.
Currently, there are electrical steels for power applications with permeability in the order of
1,500 compared with 1.0 for air.
Fig. 1. Ideal transformer: two coils applied on steel core.
Transformers can be classified according to their application, construction or power
capabilities. In the electricity transmission process, the utilized power transformers are
characterized by the high levels of voltage and current that they handle. Power transmission
requires power transformers to transmit energy from voltage production centers over long
distances to consumption areas. Here, power transformers decrement the voltage down again
for distribution to consumers. The distribution process requires transformers with less voltage
and current. They are called distribution transformers.
For t he design and construction of power transformers, regardless of size and power, various
materials are used such as:
• Thin magnetic steel plates in the core.
• Copper or aluminum as conductor material in the coils (see Fig. 2).
• Cellulose products like high density paper and pressboard as solid insulation material.
• Mineral oil a s liquid insulating material, which also functions as a coolant.
• Steel for the tank.
Additionally, the transformer has several external accessories such as (see Fig. 3):
• Radiators, fans and oil circulating pumps for the cooling function.
• Bushings as an insulating structure, for connection of windings to the outside.
• Oil temperature indicators.
• Oil Level Indicator
105
Probabilistic Vibration Models in the Diagnosis of Power Transformers
4 Vibration Analysis
Fig. 2. Inner part of the transformer. The core and coils assembly is shown at the
manufacturing s tage. (Courtesy of Prolec GE ).
• Pressure relief devices.
• Winding temperature indicator.
• Sudden pressure relay.
• Desiccant breathers.
• Liquid preservation systems.
2.1 Vibration in transformers
Transformers a lways vibrate while operating. Vibration can be detected at different
frequencies, in different places of the transformer and caused by different sources. According
to the literature, vibration below 100 Hz. is caused by cooling fans and oil pumps. Vibrations
above 1000 Hz. are caused by small elements not related to the state of the core or
winding (Golubev et al., 1999). Thus, the vibration frequency range of interest in transformer
diagnosis is between the power frequency of 60 Hz (50 in Europe) and multiples of this up to
960 Hz.
In normal operating conditions, the main sources of vibration are the core and the winding
of the power transformers. This vibration is transmitted to the transformer tank through the
106
Recent Advances in Vibrations Analysis
Probabilistic Vibration Models in the Diagnosis of Power Transformers 5
Fig. 3. Power transformer at the electrical substation. (Courtesy of Prolec GE ).
cooling oil and through the solid structure. Different levels of vibration can be measured at
different locations of the transformer.
Vibration in the winding is caused by Lorenz forces that depend on the current density
and the leakage flux density. Since the leakage flux and the current density have different
directions, the winding force density has components in the r adial and axial directions. Also,
both components are a function of loading current, so the total Lorenz forces are quadratic
functions of the current. It is worth to mention that the vibration caused by the winding is not
too significant under normal operating conditions, but it is significant under several kinds of
failures.
Vibrations at the core are caused by the magnetostriction process. It consists of changes
of the dimension of core laminations, made by ferromagnetic materials, d ue to changes of
orientation of the material cr ystals for magnetic fields. Thus, magnetostrictive effects are
function of the magnitude of the applied field. Also, it is known that these magnetostrictive
forces have a fundamental frequency of 120 Hz. i.e., twice the exciting frequency. Other source
of core vibration is the air gap produced by the magnetic repulsion among laminations. This
repulsion forces are mostly present at the corner joints of the core legs with the jokes, and it
has also a fundamental frequency of 120 Hz (Lavalle, 1986).
In case of a failure like a short circuit, the mechanical integrity of the transformer can be
altered. Certain changes, such as loss of winding clamping pressure, will lead to insulation
107
Probabilistic Vibration Models in the Diagnosis of Power Transformers
6 Vibration Analysis
deterioration, and therefore, the vibrational response will be altered. In general, most of the
failures occurring in the transformer, produce mechanical deformations in the winding, and
hence, a change in the vibrational signature of the transformer. Typical failures occurring
at the transformer core are caused by short circuits between core laminations or between
the core and the tank. Since the tank is grounded, if several contact points between core
and tank e xist, a current will flow and temperature will rise. Also with laminations short
circuits, the temperature increases. I n general, temperature changes will produce changes
in the insulation system that will produce mechanical changes that provoke changes in the
vibrational signature of the transformer.
Summarizing, most of the failures in the winding and core of the transformer, will produce
mechanical changes and will turn out in changes in the vibration pattern of the transformers.
2.2 Related work in transformers diagnosis by vibrations
Several technical groups have worked in the study of vibrations for identifying and
diagnosing mechanical faults. The basic approach followed by all the research groups is
the development of a model that represents the behavior of the transformer under different
conditions. Later, when new readings are obtained, the model estimates or predicts the
behavior of the transformer and a comparison with the current behavior can identify abnormal
events. The key question here is how can this model be defined?. This question has been answered
differently by some research groups.
The Electrical Engineering and Computer Science Department at the Massachusetts Institute
of Technology (MIT) elaborated a series of Master of Science thesis devoted to the
development of vibration models for f aults identification in transformers ( Crowley, 1990;
Lavalle, 1986; McCarthy, 1987). First, they utilized an analytical model that relates the
harmonic c ontent of one input (square of the current) to one output (the vibration i n the
winding). The bas ic model has the form y
= Cu where y is a vector whose components
are the amplitude of the vibrations discomposed at frequencies multiple of 120Hz. u is the
current squared vector at the some frequencies and C is the matrix with parameters that relate
them. The elements c
ij
of C are estimated in a set of experiments made to a transformer free
of faults at different conditions of load. For a given load condition, and for each frequency,
several measurements were averaged and related with a Least-Squares algorithm to define
the c
ij
parameters. Other experiments were made to relate effects of the temperature in the
same structure of measures. A third set of experiments was carried out in presence of a fault:
a loosened up the windings. Other experiments consider the effects of the core vibrations
in the winding vibrations. When both the winding and the core are excited simultaneously,
the sources of vibration may have phase differences. They proposed a model that includes
linear compensation for winding temperature, weighted by the harmonic amplitudes of the
loading current squared, and linear compensation terms for core temperature and excitation
voltage. Summarizing, the MIT theses propose a model that requires the acquisition of certain
parameters from experiments implemented off-line. Later, these parameters are compared
with the on-line parameters to detect changes in the normal behavior of the t ransformer.
Spanish Unión Fenosa proposes a model that is also based on vibrations (García et al.,
2006a;b). They measure vibrations at the tank of the transformer, claiming that the vibrations
are transmitted to the tank from two sources: the winding and the core. Thus, the vibration at
the tank results from the vibration of the windings plus the vibration of the core, multiplied
by a coefficient of transmission. The winding vibration is proportional to the square of the
108
Recent Advances in Vibrations Analysis