Risk Management in Environment Production and Economy Part 5 pptx
Bạn đang xem bản rút gọn của tài liệu. Xem và tải ngay bản đầy đủ của tài liệu tại đây (1.84 MB, 20 trang )
Generation of Added Values Products Supporting Risk Analysis
69
influence the distribution of future eruptive products (namely lava flows) and need to be
carefully mapped and measured for the assessment of the hazard from future eruptions.
The new distribution of ash and lava flow have been evaluated by means of spectral
classification using supervised and unsupervised technique. Beside this surface
classification an evaluation of the thickness of eruptive products will be carried out in the
field, using hand-held GPS to create a model of the new, post-eruptive surface morphology
in areas affected by the eruptive activity. GPS is the instrument most suitable for obtaining a
high quantity of data at a resolution comparable to that of the satellite images used for the
project This new morphology will be superimposed on the pre-eruptive morphology to
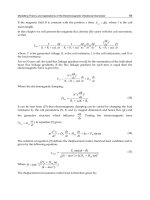
reveal the approximate (±5 m) thickness of the new products in any site, and obtain volume
estimates (Fig. 7).
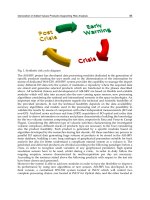
Fig. 7. Example of post eruptive lava distribution map product generated and delivered by
means of dedicated gateway
5.3.1 Multiparametric analysis
All the above mentioned early-warning products have been used to verify the capability of
dedicated statistical model to support the monitoring activities. ASI-SRV project has
implemented a well-known model called Bayesian Event Tree – Eruption Forecast (BET-EF)
(Marzocchi et al., 2009) which is an already developed algorithm for the eruption model,
and has been adapt, as it is, to the ASI-SRV needs. The BET-EF model represents a flexible
tool to provide probabilities of any specific event at which we are interested in, by merging
any kind of available and relevant information, such as theoretical models, a priori beliefs,
monitoring measures, and real time and past data. It is mainly based on a Bayesian
Risk Management in Environment, Production and Economy
70
procedure and it relies on the fuzzy approach to manage monitoring data. The method deals
with short- and long-term forecasting, therefore it can be useful in many practical aspects, as
land use planning, and during volcanic emergencies. Besides BET-EF a multivariate analysis
allows to perform multiple comparisons in order to have a first idea of which variables are
largely preferentially or rather rarely distributed, also considering their geographic
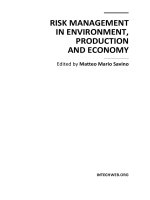
localization, and then a cross correlation will allow to define the weight of each product that
will be used as input in the BET-EF model (Fig. 8).
Fig. 8. Example of ASH map product generated and delivered by means of dedicated
gateway
6. Conclusion
Technologies and services provided by ASI-SRV are developed for provide added value
information in case of Volcanoes eruption, but also during the pre-event (early warning)
phase and post-event enabling an improved support for risk management and assessment.
In order to let remote sensed data available to the core processes as soon as they are received
selected processors operating in un-supervised mode generate advanced L1 data.
The processing chains has been delocalized ensuring the fastest updating rate for the newest
generated products. The processing chain for radar data has been located and operated at
IREA premises and the processing results will be transferred to the main system via ftp
connection as soon as they are generated. This choice is justified essentially its high
complexity, the algorithm must be supervised during the whole processing phase by an
expert operator who is also responsible for setting a number of important parameters that
Generation of Added Values Products Supporting Risk Analysis
71
affect the quality of the final result: Expert personnel operate the module throughout the
project lifetime.
The processing chain dedicated to the develop of product by optical remote sensed data has
been located and operated at INGV premises and the processing results are transferred to
the project gateway by means of dedicated procedure for validation and dissemination as
soon as they are generated.
The availability of a set of instrument dedicated to the harmonization and pre-processing of
EO data represents an important tool for a complex system as ASI-SRV is. A well structured
production chain, that manage the ingestion, pre processing, processing and publication of
EO derived product in a semi-automatic process, allow to compare a wide volume of data
using the same standard. All the validated ASI-SRV products produced by processing
modules and data processor software are stored in the ASI-SRV main database, in order to
be published by Web-GIS and then made available to the end-user.
SRV project has finished the development of architectural design of modules and interfaces
and it is now ready to operate according the User’s request.
7. Acknowledgment
This study was supported by Agenzia Spaziale Italiana Progetto Sistema Rischio Vulcanico
project (ASI-SRV ref ASI I/091/06/0). The active contribute of the Italian DPC has been very
important in order to meet the requirement requested especially regarding the delivery time
of the products in the Crisis Phase.
8. References
Azzaro R. (1999) Earthquake surface faulting at Mount Etna volcano (Sicily) and
implications for active tectonics. J. Geodyn., 28, 193-213.
Berardino, P., Fornaro, G., Lanari, R., and Sansosti, E. (2002), A new Algorithm for Surface
Deformation Monitoring based on Small Baseline Differential SAR Interferograms,
IEEE Transactions on Geoscience and Remote Sensing, 40, 11, 2375-2383.
Berk A., Bernstein L.S. e Robertson D.C ( 1989) MODTRAN: a moderate resolution model
for Lowtran7, GL-TR-89-0122, AFG Lab., Hanscom Air Force Base, MA 01731-5000,
USA.
Branca S. (2003) Geological and geomorphologic evolution of the Etna volcano NE flank and
relationships between lava flow invasions and erosional processes in the Alcantara
Valley (Italy). Geomorphology, 53, 247-261.
Branca S., Coltelli M., De Beni E., Wijbrans J. (2008) Geological evolution of Mount Etna
volcano (Italy) from earliest products until the first central volcanism (between 500
and 100 ka ago) inferred from geochronological and stratigraphic data. Intern. J.
Earth Sci., 97:135–152
Branca S., Coltelli M., Groppelli G. (2004) Geological evolution of Etna volcano. In: “Etna
Volcano Laboratory” Bonaccorso, Calvari, Coltelli, Del Negro, Falsaperla (Eds),
AGU (Geophysical monograph) 143, pp 49-63.
Caltabiano T., Romano R., Budetta G., (1994). SO2 flux measurements at Mount Etna (Sicily).
Jour. Geoph. Res., 99, D6, 12.809-12.819
Risk Management in Environment, Production and Economy
72
Calvari S., Neri M., Pompilio M., Scribano V., (1994). Etna: Eruptive activity. In: "Data
related to eruptive activity, unrest phenomena and other observations on the Italian
active volcanoes - 1992", L. Villari (Ed.), Acta Vulcanol., 6, 1-3
Calvari, S., Tanner, L.H., Groppelli, G., Norini, G. (2004) A comprehensive model for the
opening of the Valle del Bove depression and hazard evaluation for the eastern
flank of Etna volcano. In: “Etna Volcano Laboratory” Bonaccorso, Calvari, Coltelli,
Del Negro, Falsaperla (Eds), AGU (Geophysical monograph) 143, pp 65-75.
Coltelli M., Del Carlo P., Vezzoli L. (2000) Stratigraphic constrains for explosive activity in
the last 100 ka at Etna volcano. Italy. Inter. J. Earth Sciences 89: 665-677.
Coltelli, M., Del Carlo, P., Vezzoli, L. (1998) The discovery of a Plinian basaltic eruption of
Roman age at Etna volcano, Italy. Geology, 26, 1095-1098.
Flynn LP, Harris AJL, Rothery DA, Oppenheimer C (2000) High-Spatial resolution thermal
remote sensing of active volcanic features using Landsat and hyperspectral data.
Remote Sensing of Active Volcanism AGU Geophysical Monograph Series 116: 161-
177.
Flynn, L., P. Mouginis-Mark, J. Gradie, and P. Lucey, (1993) Radiative Temperature
Measurements at Kupaianaha Lava Lake, Kilauea Volcano, Hawaii, J. Geophys.
Res.,98, 6461 - 6476
Gillespie, A., Rokugawa, S., Matsunaga, T., Cothern, J.S., Hook, S. And Kahle, A. (1998): A
temperature and emissivity separation algorithm for Advanced Spaceborne
Thermal Emission and Reflection Radiometer (ASTER) images, IEEE Trans. Geosci.
Remote Sensing, 36 (4),1113-1126
Gillespie, A.R. (1985): Lithologic mapping of silicate rocks using TIMS, in The TIMS Data
User’s Workshop, JPL Publication 86-38, Jet Propulsion Lab., Pasadena, CA, 29-44
Harris, A.J.L., Flynn, L.P., Keszthelyi, L., Mouginis-Mark, P.J., Rowland, S.K., Resing, J.A.,
(1998). Calculation of lava effusion rates from Landsat TM data, Bull. Vucanol. 60,
52-71.
Isaia R., M. D'Antonio, F. Dell'Erba, M.A. Di Vito and G. Orsi, (2004) The Astroni volcano:
the only example of close eruptions within the same vent area in the recent history
of the Campi Flegrei caldera (Italy), Journal of Volcanology and Geothermal
Research 133, pp. 171–192.
Kaufman Y.J., Tanre' D., Remer L.A., Vermote E.F., Chu A., Holben B.N., (1997). Operational
remote sensing of tropospheric aerosol over land from EOS moderate resolution
imaging spectroradiometer. Journal of Geophysical Research, Vol. 102, No. D14, pp.
17,051-17,067, July 27.
Kaufman, Y. J. (1993) “Measurements of the aerosol optical thickness and the path radiance
- Implications on aerosol remote sensing and atmospheric corrections”, Journal of
Geophysical Research, 98, 2677-2692, (b)
Kaufman, Y.J. Wald, A.E. Remer, L.A. Bo-Cai Gao Rong-Rong Li Flynn, L. (1997) The
MODIS 2.1-μm channel-correlation with visible reflectancefor use in remote
sensing of aerosol Geoscience and Remote Sensing, IEEE Transactions
onPublication Date: Sep Volume: 35, Issue: 5
Lanari, R., De Natale, G., Berardino, P., Sansosti, E., Ricciardi, G. P., Borgstrom, S., Capuano,
P., Pingue, F., and Troise, C. (2002), Evidence for a peculiar style of ground
deformation inferred at Vesuvius volcano, Geophysical Research Letters, 29
Generation of Added Values Products Supporting Risk Analysis
73
Lanari, R., Lundgren, P., Manzo, M., and Casu, F., (2004b), Satellite radar interferometry
time series analysis of surface deformation for Los Angeles, California, Geophysical
Research Letters, 31, L23613, doi:10.1029/2004GL021294.
Lentini F., Carbone S., Catalano S., Grasso, M. (1996) Elementi per la ricostruzione del
quadro strutturale della Sicilia orientale. Mem. Soc. Geol. It., 51, 179-195.
Li, Z., Becker, F., Stoll, M. And Wan, Z. (1999): Evaluation of six methods for extracting
relative emissivity spectra from thermal infrared images, Remote Sens. of Env., 69,
197-214.
Lundgren, P., Casu, F., Manzo, M., Pepe, A., Berardino, P., Sansosti, E., and Lanari, R. (2004),
Gravity and magma induced spreading of Mount Etna volcano revealed by satellite
radar interferometry, Geophysical Research Letters, 31, L04602,
doi:10.1029/2003GL018736
Manzo M., Ricciardi, G. P., Casu, F., Ventura, G., Zeni, G., Borgström, S., Berardino, P., Del
Gaudio, C. and Lanari, R. (2006), Surface deformation analysis in the Ischia island
(Italy) based on spaceborne radar interferometry, Journal of Volcanology and
Geothermal Research, 151, 399–416, doi:10.1016/j.jvolgeores.2005.09.010.
Marzocchi,W., Sandri, L., Selva J., (2009) BET_EF: a probabilistic tool for long- and short
term eruption forecasting , Bull. Volcanol. , doi:10.1007/s00445-007-0157-y,
Massonet D., K. Feigl, (1998) Radar Interferometry and its application to changes in the
Earth’s surface, Reviews of Geophysics, 36, 4 / November 1998, pag. 441-500,
Oppenheimer, C., (1991). Lava flow cooling estimated from Landsat Thematic Mapper
infrared data: The Lonquimay eruption (Chile, 1989), Journal of Geophysical
Research 96, 21865-21878.
Pepe, A., E. Sansosti, P. Berardino and R. Lanari (2005), On the Generation of
ERS/ENVISAT DinSAR Time-Series via the SBAS technique, IEEE Geoscience and
Remote Sensing Letters, 2, 3, pp. 265-269.
Pieri, D.C., Glaze, L.S., Abrams, M.J., (1990). Thermal radiance observation of an active lava
flow during th June 1984 eruption of Mt. Etna, Geology, v.18, 1018-1022
Prata A. J., I. J. Barton, (1989) “Detection and discrimination of volcanic clouds by infrared
radiometry – I:theory”, Proc. of the first international symposium on Volcanic ash
and aviation safety, 305-311.
Pugnaghi S., Gangale G., Corradini S., Buongiorno M.F. (2006), Mt. Etna sulfur dioxide flux
monitoring using ASTER-TIR data and atmospheric observations, Journal of
Volcanology and Geothermal Research, 152, 74–90.
Pugnaghi, S., Teggi, S., Corradini, S., Buongiorno, M.F., Merucci, L., Bogliolo, M.P., (2002).
Estimation of SO 2 abundance in the eruption plume of Mt. Etna using two MIVIS
thermal infrared channels: a case study from the Sicily-1997 Campaign. Bull
Volcanol 64, 328-337.
Realmuto, V.J. (1990): Separating the effects of temperature and emissivity: emissivity
spectrum normalization, in Proc. 2nd TIMS Workshop, JPL Publication, 90-55, Jet
Propulsion Lab., Pasadena, CA.
Realmuto, VJ, AJ Sutton and T Elias (1997) Multispectral thermal infrared mapping of sulfur
dioxide plumes - a case study from the East Rift Zone of Kilauea volcano, Hawaii,
Jour. Geophys. Res., 102: 15057-15072
Remer, L. A. Kaufman, Y. J. Tanrè, D. Mattoo, S. Chu, D. A. Martins, J. V. Li, R R. Ichoku, C.
Levy, R. C. Kleidman, R. G. Eck, T. F. Vermote E. and Holben, B. N. (2005) “The
Risk Management in Environment, Production and Economy
74
MODIS Aerosol Algorithm, Products and Validation”, Journal of Atmospheric
Science, Special Section, 62, 947-973.
Remitti M., Pugnaghi S., Teggi S., Parmiggiani F., (2006). Retrieval of tropospheric ash
clouds of mt. etna from AVHRR data Quaderni di Geofisica n. 43.
Spinetti C. and M.F. Buongiorno, (2007). Volcanic Aerosol Optical Characteristics of Mt.
Etna Tropospheric Plume Retrieved by Means of Airborne Multispectral Images.
Journal of Atmospheric and Solar-Terrestrial Physics Volume 69, Issue 9, pp. 981-
994 doi:10.1016/j.jastp.2007.03.014.
Spinetti C., Buongiorno M.F., Lombardo V., Merucci L. (2003) - Aerosol optical thickness of
Mt. Etna volcanic plume retrieved by means of the Airborne Multispectral Imaging
Spectrometer MIVIS. Annals of Geophysics, 46 (2).
Spinetti, C. Buongiorno, M.F. Volcanic water vapour abundance retrieved using
hyperspectral data Geoscience and Remote Sensing Symposium,. IGARSS '04.
Proceedings. (2004) 2004 IEEE International Publication Date: 20-24 Sept. 2004
Volume: 2, On page(s): 1487- 1490 vol.2
Synthetic Aperture Radar Computer Compatible Tape Format Specifications”, (CEOS SAR
CCT Iss/Rev: 2/1) by CEOS WGD on SAR data Standards, March 1989, revision 1
January 1992
Teggi. S., Bogliolo MP, Buongiorno MF, Pugnaghi S., Sterni A. (1999), Evaluation of SO2
emission from Mount Etna using diurnal and nocturnal IR and visibile imaging
spectrometer thermal IR remote sensing images and radiative transfer models,
Journal of Geophysical Research, vol. 104, n. B9, pp. 20069-20079
Tizzani, P., P. Berardino, F. Casu, P. Euillades, M. Manzo, G. P. Ricciardi, G. Zeni and R.
Lanari (2007), Surface deformation of Long Valley caldera and Mono Basin,
California, investigated with the SBAS-InSAR approach, Remote Sensing of
Environment, doi: 10.1016/j.rse.2006.11.015e.
Vermote E., D. Tanre´, J. L. Deuze´, M. Herman, and J. J. Morcrette.( 1997) “Second
simulation of the satellite signal in the solar spectrum, 6S: an overview,” IEEE
Trans. Geosci. Remote Sens. 35, pp. 675–686
Wen S., W. I. Rose, (1994) “Retrieval of sizes and total masses of particles in volcanic clouds
using AVHRR bands 4 and 5”, J. of Geoph. Res., 99, D3, 5421-5431
Wright R., Rothery, D.A., Blake, S., Pieri, D.C., (2000). Improved remote sensing estimates of
lava flow cooling: a case study of the 1991-1993 Mount Etna eruption, Journal of
Geophysical Research, 105, B10, 23,681-23,694.
Zebker, H.A. Goldstein, R.M. (1986) Topographic mapping from interferometric SAR
observations, J. Geophys. Res., 91 4993– 5001.
Part 2
Production
4
Food Safety Risk Management
Elena Carrasco, Antonio Valero, Fernando Pérez-Rodríguez,
Rosa María García-Gimeno and Gonzalo Zurera
University of Cordoba
Spain
1. Introduction
It is a principal aim of governments to assure the safety of societies in all sectors. In the food
field, safety has been dealt with for a long time by making decisions in an empirical manner.
Recently, risk management has been appointed as the formal scientific-based approach to
address food safety issues.
From a global perspective, food safety risk management can be described “as the process of
weighting control alternatives by government (and international standard-setting bodies) in
consultation with interested stakeholders, taking into account scientific information on risks to
consumers as well as other relevant inputs (e.g. economics, technical feasibility, societal preferences),
and choosing and implementing food safety measures as appropriate” (Food Agriculture
Organization/World Health Organization [FAO/WHO], 2006b). Indeed, governments must
make decisions, whose effects are especially noted during food crises. Nevertheless, other
stakeholders should also manage food risks, for example, at manufacture or consumer level.
Nowadays, manufacturers and other operators involved in the food chain are aware of the
importance of producing and assuring food safety, as well as the devastating consequences
of supplying contaminated food products. However, at consumer level, the relevance of
consumer´s hygiene practices in the home may not always be evident in order to avoid
foodborne conditions.
Food safety risk management should be based on risk assessment, as proposed by the
Regulation (EC) No. 178/2002 of 28 January 2002, laying down the general principles and
requirements of food law, establishing the European Food Safety Authority and laying down
procedures in matters of food safety. Currently, risk assessment is being gradually introduced at
governmental level as a systematic practice. In the case of manufacturers and other food
business operators, only big food enterprises have adopted risk assessment procedures; risk
management in medium and small food companies is based on the implementation of
Hazard Analysis and Critical Control Point (HACCP) systems, which is in fact compulsory.
Hygiene practices in homes are out of the control of Health Authorities; nevertheless, for
example, a risk management option mandated by governments may consist of developing
educational programs which could enhance a positive attitude among consumers towards a
more hygienic preparation of foods.
Food safety risk management has been proved to be useful in making science-based decisions.
In this chapter, food safety risk management is addressed from various perspectives, together
with management metrics to facilitate its implementation. Also, a review of risk assessment is
included. A promising future can be envisaged for food safety risk management activities.
Risk Management in Environment, Production and Economy
78
2. Perception of risk
Any attempt to manage risk begs the question: 'What is risk?' The dominant conception
views risk as 'the chance of injury, damage, or loss' (Webster, 1983). The probabilities and
consequences of adverse events are assumed to be produced by physical and natural
processes in ways that can be objectively quantified by risk assessment. Much social science
analysis rejects this notion, arguing instead that risk is inherently subjective (Pidgeon et al.,
1992; Slovic, 1992; Wynne, 1992). In this view, risk does not exist "out there', independent of
our minds and cultures, waiting to be measured. Instead, human beings have invented the
concept risk to help them understand and cope with the dangers and uncertainties of life.
Although these dangers are real, there is no such thing as 'real risk' or 'objective risk'. The
nuclear engineer's probabilistic risk estimate for a nuclear accident or the toxicologist's
quantitative estimate of a chemical's carcinogenic risk are both based on theoretical models,
whose structure is subjective and assumption-laden, and whose inputs are dependent on
judgment. As we shall see, nonscientists have their own models, assumptions, and
subjective assessment techniques (intuitive risk assessments), which are sometimes very
different from the scientists' models.
Acceptability of risk
More if: Less if:
Voluntary
Natural
Familiar
Fair
No dread
Trustworthy sources
Good process
Involuntary
Artificial
Unfamiliar
Unfair
Dreaded
Untrustworthy
Poor process
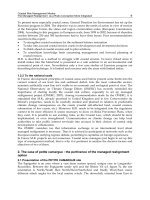
Table 1. The acceptability of risk varies depending on features that affect our perception of
risk. (Trautman, 2001).
Not only are there differences in people, in the way they approach risks, but there are also
dramatic differences in risks. Table 1 lists some perceptual features of risk that reflect a
risk´s acceptability. Risks are more likely to be accepted if they have more of the features
shown on the left in Table 1, e.g. if they are voluntary or familiar. So driving a car or even
smoking cigarettes are readily accepted risks. Increased controversy surrounds those risks
that have more features on the right, perhaps genetically modified foods or hormones in
beef. It is probable that the communication gap between scientists and the public is only
accentuated when several of these right-side features are in play.
Recently, the European Commission et al. (2010) has published a special Eurobarometer 354
report called “Food-related risks”. The European Food Safety Authority (EFSA) surveyed
consumers across Europe about how their views on food-related risks have evolved since an
earlier survey carried out in 2005 (European Commission et al., 2005, as cited in European
Commission et al., 2010). It was conducted through face-to-face interviews with consumers
in their mother tongue from 9 to 30 June 2010. With regards to the public perception of food
and food-related risks the survey shows that the majority of respondents associate food and
eating with pleasure, such as selecting fresh and tasty foods (58%) and with enjoyment of
meals with friends and family (54%). Food safety (37%) is less commonly associated with
Food Safety Risk Management
79
food and eating as such. Similarly, in the context of other potential risks which are likely to
affect them personally, the economic crisis (20%) and environmental pollution (18%) are
viewed by more respondents as risks that are much more likely to affect their lives than
food-related problems (11%). When it comes to public concerns about food-related risks, the
survey shows that there is no single, widespread concern mentioned spontaneously by a
majority of respondents; 19% of citizens spontaneously cite chemicals, pesticides and other
substances as their major concern. This concern is confirmed by prompted responses: when
offered a list of possible issues associated with food, 3 out of 10 Europeans mention
chemical residues from pesticides (31%), antibiotics (30%) and pollutants such as mercury
and dioxins (29%), together with cloning animals for food products (30%), as risks to be
“very worried” about; fewer citizens are “very worried” about health and nutrition risks
like putting on weight (15%) or not having a healthy / balanced diet (15%). In terms of
personal effectiveness to avoid food-related risks, EFSA found that EU citizens feel the most
confident about being able to personally take steps to avoid diet and health-related issues
(e.g. high fat intakes and heart disease) and bacterial contamination (e.g. salmonella in
eggs); a more divided opinion is found with regard to possible risks from animal infections
or diseases which could be transmitted to humans, as a larger proportion of respondents
(52%) claims not to be confident in avoiding these risks; citizens feel less confident in being
able to personally deal with possible problems of chemical contamination (<40%) and new
technologies (<30%). With this information, one could relate these numbers with the facts
showed in Table 1. For instance, campylobacteriosis is the most commonly reported
zoonosis in the European Union, with 198,252 confirmed human cases in 2009 (European
Food Safety Authority [EFSA] & European Centre for Disease Prevention and Control
[ECDC], 2011). At the same level, the harmful consumption of alcohol is estimated to be
responsible for approximately 195.000 deaths a year in the EU due to e.g. accidents, liver
disease, cancers, etc. However, the harmful consumption of alcohol, which is a voluntary act
and perceived as not dreaded probably due to its popularity, is underestimated by the
general population, and in fact, is not included as a food-related risk in the above survey.
Slovic (1998) supported the contexualist conception of risk, which is conceived as a game.
Games have time limits, rules of play, opponents, criteria for winning or losing, and so on,
but none of these attributes is essential to the concept of a game, nor are any of them
characteristic of all games. Similarly, a contextualist view of risk assumes that risks are
characterized by some combination of attributes such as voluntariness, probability,
intentionality, or equity, but that none of these attributes are essential. The bottom line is
that, just as there is no universal set of rules for games, there is no universal set of
characteristics for describing risk. The characterization must depend on which risk game is
being played.
Often referred to as a risk management options assessment, this is the process by which
different options for controlling a hazard to an “appropriate level of protection” (ALOP) are
evaluated and compared. This is typically done by developing a risk assessment model that
establishes mathematically the various factors that contribute to the current level of risk
associated with a product/pathogen pair. Once this model is established, the model is
augmented with additional parameters representing the different control strategies being
considered (Buchanan, 2002).
To make decisions wisely, individuals need to understand the risks and the benefits
associated with alternative courses of action. They also need to understand the limits to their
Risk Management in Environment, Production and Economy
80
own knowledge and the limits to the advice proffered by various experts (Fischhoff et al.,
1993). Some of the key questions that have to be asked when considering an optimal risk
management option are: to whom it is optimal and what criteria are used to make that
determination. Buchanan (2002) illustrated this with a hypothetical example. Let’s consider
an instance where is it necessary to achieve a reduction of pathogens on the surface of citrus
fruit. In an industrialized country where labor costs are high, the use of advanced, high-
speed steam surface pasteurization technologies may be the optimal system for achieving
the desired reduction. However, in a developing country where labor costs are low but
capital costs are high, it may be more effective to hand wash the fruit in an appropriate
sanitizing solution. Thus, if the criterion for what constitutes optimal is minimal labor cost
and speed then the former is optimal whereas if the criterion were minimization of capital
expenditures and full employment, then the latter would be the desired approach.
“Optimal”, like beauty, is in the eyes of the beholder. Buchanan (2002) conceived risk
assessment options assessments as a combination of two processes: risk management and
assessment. Risk managers have a general idea of the degree of public health protection they
are trying to achieve. Risk assessors then examine the impacts of different control options
and approaches, providing the risk managers with data that allows them to more objectively
evaluate proposed options. The risk managers then provide alternative management options
to be evaluated. This iterative process continues until one or more risk management options
achieving the desired level of protection are identified.
Risk perception and risk communication are strongly related, the former being markedly
influenced by the latter. Risk communication should always have an objective, i.e. an
expected attitude by the public. Usually, such an objective is set by risk managers. Some of
the key points for successful risk communication are as follows (Trautman, 2001):
Early inclusion of major stakeholders in the risk evaluation process is best. It helps
avoid the appearance of trying to hide something, provides transparency, and may help
identify potential pitfalls.
Being open, honest, sincere and appreciative of other views.
Recognizing biases and differences that are not likely to change (or only slowly), but
must be expressed as part of the process.
Finally, enlisting professional help for risk communication techniques.
3. Producer´s and consumer´s risk
Food producers and wholesalers/retailers´ efforts are focused on earning money by selling
their products, primarily. There are many factors which can influence the volume of sales:
the dependence of quality/quantity of the product on weather, governmental policy such as
economic support or marketing of a food sector, diet fashion, complying with new
legislation (e.g. on emerging risks) or food crisis.
Nowadays, consumers expect high quality from a food (frequently associated with
freshness), pleasure, convenience, good price-quality balance, reasonable consume-by-date
margins, and of course, safety. Usually, the safety of a product on the market is taken for
granted, and in fact, consumers do not usually make their choice based on safety, but rather
on other issues. In fact, the EU survey mentioned previously (European Commission et al.,
2010) revealed that the majority of respondents associate food and eating with pleasure,
such as selecting fresh and tasty foods (58%) and with enjoyment of meals with friends and
family (54%); food safety (37%) was less commonly associated with food and eating as such.
Food Safety Risk Management
81
Nevertheless, both producers and wholesalers/retailers do know that the safety of a food
product is basic, and the consequences of unsafe food in the market could be devastating,
consumers being the most-harmed stakeholders.
Todd (1989) estimated the economic impact of the acute bacterial food-borne disease in
Canada and United States. Medical costs and lost income were easier to determine than
losses to food companies, legal awards and settlements, value of lost leisure time, pain,
grief, suffering and death. The evaluation of costs at the national level for Canada and the
United States based on all available costs for 61 incidents showed that company losses and
legal action are much higher than medical/hospitalization expenses, lost income or
investigational costs. It was reckoned that on an annual basis an estimated 1 million cases of
acute bacterial food-borne illness in Canada cost nearly after $1.1 billion and 5.5 million
cases in the United States cost nearly $7 billion. The value of deaths was a major contributor
to the overall costs especially for diseases like listeriosis, salmonellosis, Vibrio infections, and
haemorrhagic colitis. Nowadays, food companies are responsible for the safety of their
products in accordance to food hygiene legislation, irrespective of the official inspection.
This means that, when an outbreak or an individual case is reported, legal responsibility
inevitably falls on food companies.
In food microbiology, producer´s and consumer´s risks are those derived from sampling
lots. It is not feasible to analyze all units of a lot (by destructive analysis techniques), so a
sampling scheme must necessarily be designed for all hazards indentified in a food.
Microbiological criteria applied for different foods and hazards should include a sampling
plan. For example, the EC Regulation No. 2073/2005 on microbiological criteria for foodstuffs,
establishes for Salmonella in different meat products a sampling plan consisting of analyzing
5 samples, from which none may exceed the microbiological limit established. When a lot is
sampled, a probability of accepting “good” or “bad” lots is associated. What is more, a
probability of accepting a lot when it is actually “bad” and a probability of rejecting a lot
when it is actually “good” is also associated. These probabilities are the so-called
consumer´s risk and producer´s risk, respectively. Table 2 shows the different sampling-
based decisions.
In general, risk management at consumer level includes important issues such as good
hygiene practices at home, proper heating of foods or adequate refrigerated storage of
chilled foods. Risk management at producer/wholesaler/retailer´s level include a wide
range of aspects such us the application of Good Manufacturing Practices, Good Hygiene
Practices or the correct implementation of Hazard Analysis and Critical Control Point
systems.
Hygiene quality of a lot
“Good” “Bad”
H
yg
iene qualit
y
detected at
sampling
“Good”
Acceptance of a lot: right
decision
Acceptance of a lot: wrong
decision (consumer´s risk)
“Bad”
Rejection of a lot: wrong
decision (producer´s risk)
Rejection of a lot: right decision
Table 2. Decisions made at sampling of food lots.
Risk Management in Environment, Production and Economy
82
4. Management measures to reduce risks throughout the food chain
Optimization of food control measures in terms of efficiency, effectiveness, technological
feasibility and practicality at selected points throughout the food chain is the generalized
goal of food businesses.
Food safety and its management has been a matter of concern to humans since the dawn of
history. FAO/WHO (n.d.) described the traces of the development of the food control from
Ancient History, the Middle Ages and the Industrial Revolution until the 19th and 20th
centuries. Many rules and recommendations advocated in religious or historical texts are
evidence of the concern to protect people against food-borne diseases and food adulteration.
Modern countries have traditionally attempted to improve food safety by setting
microbiological criteria for raw or for finished processed products. However, the frequency
and extent of sampling used in traditional food testing programs may not provide a high
degree of consumer protection.
In the 1960s, the United States Army and the United States National Aeronautics and Space
Administration (NASA) developed a system to guarantee the safety of the foods that
astronauts would consume in space based on prevention and not on end-product inspection
and testing, from which emerged the Hazard Analysis Critical Control Points (HACCP)
concept. HACCP emphasizes the control of the process as early as possible in the processing
system by using operator control and/or continuous monitoring techniques at critical
control points. The HACCP system can be applied throughout the food chain, from the
primary producer to final consumer. The use of HACCP principles in the promulgation of
regulations for low-acid canned food was completed in 1974 by the United States Food and
Drug Administration (US-FDA). In the early 1980s, the HACCP approach was adopted by
other major food companies and the experiences gained indicate that application of HACCP
systems leads to more efficient prevention of food-borne diseases (International
Commission of Microbiological Specifications for Foods [ICMSF], 1988).
Recognizing the importance of HACCP to food control, the US-FDA published a guidelines
for Hazard Analysis Critical and Critical Control Point Principles and Application (US-FDA,
1997) defining HACCP as “a scientific, rational and systematic approach to the
identification, evaluation, and control of food safety hazards”. With this system, food safety
control is integrated into the design of the process rather than the ineffective system of end-
product testing. Therefore, it provides a preventive and thus a cost-effective approach to
food safety. While it was originally developed to ensure microbiological safety of foodstuffs,
it has been further broadened to include chemical and physical hazards in foods.
(FAO/WHO, 1997a).
Sometimes a level of microbiological criteria stricter than the international level for foods in
trade (based on Codex recommendations) imposed by national governments for different
foods have been viewed by other countries as barriers to international trade. Because of this,
more than 100 countries have signed the General Agreement on Tariffs and Trade (GATT),
and “Sanitary and Phytosanitary Agreement” (SPS Agreement) of the World Trade
Organization (WTO). This agreement states that, although each country has the sovereign
right to decide on the degree of protection it wishes for its citizens, levels of criteria
demanded for imported food must be based on scientific evidence, consideration of risk and
societal issues. It also established that a country must not ask for a higher degree of safety
for goods than it does for goods produced in its own country. The work of Codex through
its standards, guidelines and recommendations, is recognized as the reference or ‘yard stick’
Food Safety Risk Management
83
for national requirements in food safety and has played an important role in facilitating
international trade. (FAO/WHO, 1997a).
In Europe, the Regulation (EC) No. 178/2002, laying down the general principles and
requirements of food law, establishing the European Food Safety Authority and laying down
procedures in matters of food safety, incorporated Risk Analysis as a tool to provide a
systematic methodology for the determination of effective, proportionate and targeted
measures or other actions to protect health. Also, several Regulations force the
implementation of HACCP system by food business operators, based on Risk Analysis
criteria, and the adequate establishment of official control systems (Regulation (EC) No.
852/2004; Regulation (EC) No. 853/2004; Regulation (EC) No. 854/2004; Regulation (EC)
No. 2074/2005).
The HACCP concept has provided great improvements in the production of safe foods. The
goal of HACCP is to focus on the hazards in a particular food commodity that are
reasonably likely to affect public health if left uncontrolled, and to design food products,
processing, commercialization, preparation and use conditions that control those hazards.
HACCP involves an assessment of hazards in a particular production sequence and defines
steps where control measures that are critical for the safety of a product should be taken.
Also, it states limits, monitoring procedures and corrective actions. To be successful,
HACCP needs to build on a prerequisite programs and good practices such as good
agricultural practices (GAPs), good manufacturing practices (GMPs) and good hygienic
practices (GHPs), which minimize the occurrence of hazards in the product and the
production environment (ICMSF, 2005). The main elements of the HACCP system are: a)
identify potential hazards; b) determine the Critical Control Points (CCPs); c) establish the
criteria that must be met to ensure that a CCP is under control; d) establish a monitoring
system; e) establish the corrective action when CCP is out of control; f) establish procedures
for verification; and g) establish documentation and record-keeping.
An ongoing assessment following the implementation of a HACCP system can be achieved
at two levels; with internal audits carried out by those responsible for the system or by
independent external audits. In HACCP and food safety there are several standards from a
variety of sources such as legislative standards, national or international standards like
International Organization for Standardization (ISO), or standards from customer–driven
expert groups or food industry sectors. When standards are verified by a professional
external audit and certification, the effectiveness of food safety programs can be
demonstrated. Within certification, we can mention as examples the British Retail
Consortium Global Standard (BRC), Global Food Safety Initiative (GFSI), ISO 22000:2005
“Food Safety Management Systems- Requirements for any organization in the food chain”
and Dutch HACCP–code (Wallace et al., 2011).
Risk Management can be defined as the process of weighing policy alternatives in the light
of the results of risk assessment and, if required, selecting and implementing appropriate
control options, including regulatory measures. The report elaborated by FAO/WHO
(1997b) considers 8 general principles of food safety risk management. The first principle
states that risk management should follow a structured approach which is: risk assessment,
risk management option assessment, implementation of management decision, and
monitoring and review. The second principles highlights that the protection of human
health should be the primary consideration in risk management decisions and arbitrary or
unjustified differences in the risk levels should be avoided. The third principle deals with
Risk Management in Environment, Production and Economy
84
risk management decisions and points out that practices should be transparent, that is to
say, they should include the identification and systematic documentation of all elements of
the risk management process including decision-making, so that the rationale is transparent
to all interested parties. The fourth principle states that the determination of risk assessment
policy should be included as a specific component of risk management. The fifth principle
underlines the functional separating of risk management and risk assessment which ensures
the scientific integrity. The sixth principle reminds us to take into account the uncertainty of
the risk assessment in decision-making. The seventh principle states that risk management
should include clear, interactive communication with consumers and other interested
parties in all aspects of the process. The last principle proposes that risk management should
be a continuing process that includes all newly generated data in the evaluation and review
of risk management decisions. Monitoring and other activities will likely be necessary to
carry out the review effectively.
Almost all the progress in the development of HACCP and other standards like effective
food safety management programs and their global acceptance and use has been
accomplished by the voluntary efforts of global food companies. Involvement of all
stakeholders in food safety issues is crucial in order to assure food safety in our rapidly
changing global food market. We need more knowledge throughout the food chain,
common standards and science-based regulations, and a global infrastructure to provide
global strategy and oversight (Wallace et al., 2011).
5. Risk assessment in foods
In the food safety field, the performance of Microbiological Risk Assessment (MRA)
methodology has been developed as a standardized approach to integrate and evaluate
information from diverse sources concerning the origin and fate of pathogens in the food
chain and to determine the magnitude of public health risks. The SPS Agreement of the
WTO recognized the necessity of scientific basis for evaluating food safety. Based on this
consideration, principles and guidelines for food safety risk analysis were defined by the
Codex Committee on Food Hygiene (FAO/WHO, 1995).
5.1 General principles for conducting MRA
The principles and guidelines for the conduct of MRA are described in Codex Alimentarius
(Codex Alimentarius Commission [CAC], 1999). A formal MRA consists of four steps:
i. Hazard identification;
ii. Hazard characterization;
iii. Exposure assessment; and
iv. Risk characterization.
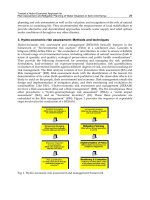
The definition of each step as well as their relationships are described in Figure 1.
The general principles for the conduct of MRA (CAC, 1999) can be summarized as follows:
MRA should be soundly based upon science.
There should be a functional separation between risk assessment and risk management.
MRA should be conducted according to a structured approach that includes hazard
identification, hazard characterization, exposure assessment, and risk characterization.
MRA should clearly state the purpose of the exercise, including the form of risk
estimate that will be the output.
Food Safety Risk Management
85
The conduct of MRA should be transparent.
Any constraints that impact on the risk assessment such as cost, resources or time,
should be identified and their possible consequences described.
The risk estimate should contain a description of uncertainty and where the uncertainty
arose during the risk assessment process.
Data should be such that uncertainty in the risk estimate can be determined; data and
data collection systems should, as far as possible, be of sufficient quality and precision
that uncertainty in the risk estimate is minimized.
MRA should explicitly consider the dynamics of microbiological growth, survival, and
death in foods and the complexity of the interaction (including sequelae) between
human and agent following consumption as well as the potential for further spread.
Wherever possible, risk estimates should be reassessed over time by comparison with
independent human illness data.
MRA may need reevaluation, as new relevant information becomes available.
Fig. 1. Scheme of the four steps of MRA. Adapted from FAO/WHO (2006a).
HAZARD
IDENTIFICATION
The identification of biolo
g
ical,
chemical and physical agents capable
of causing adverse health effects and
which may be present in a particular
food or group of foods.
The qualitative and/or quantitative
evaluation of the nature of the adverse
health effects associated with
biological, chemical and physical
agents, which may be present in food.
For biological or physical agents, a
dose-response assessment should be
p
erformed if data are available.
HAZARD
CHARACTERIZATION
EXPOSURE
ASSESSMENT
RISK
CHARACTERIZATION
The qualitative and/or quantitative estimation, includin
g
attendant uncertainties, of the probability of occurrence
and severity of known or potential adverse health effects
in a given population based on hazard identification,
hazard characterizatio
n
and ex
p
osure assessment.
The qualitative and/or quantitative
evaluation of the likely intake of
biological, chemical and physical
agents via food, as well as exposures
from other sources if relevant.
Risk Management in Environment, Production and Economy
86
These principles highlight the importance of developing a systematic and scientific
methodology in order to serve as main guidance for decision-making process in the food
safety field.
5.2 Uses of risk assessment outputs
Some of the final uses of risk assessment outputs are:
Characterization of the most important factors influencing the risk of hazards identified
in the food chain.
Identification of strategies for risk mitigation.
Establishment of guidelines for ranking priorities to be addressed in public health and
food safety programs.
With regard to this, it is worth mentioning that risk assessment of foods is part of the risk
analysis framework. The Regulation (EC) No. 178/2002 laying down the general principles and
requirements of food law, establishing the European Food Safety Authority and laying down
procedures in matters of food safety states in its Article 17 that “Where food law is aimed at the
reduction, elimination or avoidance of a risk to health, the three interconnected components of risk
analysis — risk assessment, risk management, and risk communication — provide a systematic
methodology for the determination of effective, proportionate and targeted measures or other actions
to protect health.”.
For risk assessment issues, the World Health Organization (WHO) and the Food and
Agricultural Organization of the United Nations (FAO) are coordinated by the
establishment of the Joint Expert Meetings on Microbiological Risk Assessment. This group
has initiated a process to produce guidelines on four steps of the MRA process and has
produced several international risk assessments, based mainly on a combination of modules
developed for national risk assessments. Since the mid-90s, several MRA have been
developed for different food/risk combinations. Some of the main purposes of conducting
MRA are focused on providing a response to questions such as:
Which foods pose a higher risk for the selected pathogen?
Which interventions can effectively control the pathogen?
How can corrective measures be implemented in food industries?
Which is the effectiveness of testing and sanitation of food contact surfaces on
mitigating product contamination and reducing the subsequent risk of illness?
How effective are alternative pre- and post-processing interventions in mitigating
product contamination and reducing the subsequent risk of illness?
The most important significance of MRA (even more than the estimation of the human
health risk) is that it allows an “a priori” assessment of the effect of intervention measures
throughout the whole food chain, or combinations of intervention measures, on public
health (Havelaar et al., 2008). Thus, risk managers can request the development of MRA in
order to provide a clear scientific methodology to support decisions regarding food safety
and apply control measures with, as ultimate objective, food safety assurance. In this sense,
it is important to be sure that a clear mandate is transmitted to risk assessors and that the
MRA satisfies the risk manager actual needs. Once established, the MRA should be further
examined by the scientific community and, if necessary, by the general public.
The results obtained in the MRA may be well described for their utilization by risk
managers in order to adequately select the most convenient options to improve food safety.
In fact, risk assessment may also involve judgments and choices that are not entirely
Food Safety Risk Management
87
scientific, and risk managers need a sound understanding of scientific approaches used by
risk assessors.
5.3 Risk profiles and quantitative approaches in MRA
A scientific-structured MRA often needs a large number of data and time. However, this fact
mainly depends on the complexity of the questions proposed and the degree of certainty
required. If the question is simple (such as establishing a risk ranking for different food
matrices and microbiological risks) a point-estimate approach will suffice (Ross & Sumner,
2002).
To better understand the MRA process, the Australian Food Safety Centre of Excellence
developed a semi-quantitative spreadsheet (Risk Ranger) in which the user can introduce
some information organized in three modules:
A. Susceptibility of the host and severity of the hazard.
B. Probability of exposure to contaminated food.
C. Probability that a given food contains an infectious dose.
As a result, the spreadsheet calculates the risk ranking derived from the inputs introduced
within each item (A-C) ranging from 0 (low risk) to 100 (high risk). Later on, the tool was
applied to selected food commodities like seafood (Sumner & Ross, 2002) or meat products
(Sumner et al., 2005).
Risk ranking tools were further developed by the US-FDA (US-FDA, 2009), which has been
recently working on fresh produce commodities. A semi-quantitative tool was created to
identify priority pathogen-produce commodity combinations based on explicit data-driven
risk criteria. The epidemiological information available was used to prioritize risk
combinations in four dimensions: strength of the epidemiological association between the
pathogen and the commodity; severity of disease; pathogen characteristics that affect
disease, risk or severity; and food characteristics that affect pathogen prevalence, pathogen
behavior, and likelihood of exposure by the consumers.
The main results of the model revealed that the combination leafy greens-
enterohemorrhagic Escherichia coli O157:H7 (EHEC) consistently ranked first, followed by
tomatoes–Salmonella enterica.
The New Zealand Food Safety Authority (NZFSA) has focused on the development of risk
profiles in soft cheeses for Listeria monocytogenes (NZFSA, 2005a). The purpose of a risk
profile is to provide contextual and background information relevant to a food/hazard
combination so that risk managers can make decisions and, if necessary, take further action.
In this document, MRA was conducted based on epidemiologic information, prevalence and
concentration of pathogens, consumption data and dose-response relationships. A similar
approach was performed for L. monocytogenes in ready-to-eat (RTE) salads (NZFSA, 2005b).
Risk profiles have been also determined for pork and poultry products (Mataragas et al.,
2008). According to Codex Alimentarius (CAC, 2007), the main information to be included
in a risk profile should cover these aspects:
Define the food-pathogen combinations that could be more important to be
investigated.
Description of the public health concern (biological hazard, illness symptoms,
epidemiology of the disease, economical costs etc.).
Production, dispatch and consumption of foods (a formal description of the farm-to-
fork chain, a summary of the risk management measures and their efficacy on the food
production control etc.).
Risk Management in Environment, Production and Economy
88
Risk assessment needs and questions for risk assessors.
Available information and data gaps (include other previous related MRA and
additional information sources to be considered in the new MRA).
A simplified deterministic MRA was addressed by Evers & Chardon (2010) for all
combinations of Campylobacter spp. and Salmonella spp. with chicken fillet, filet americain
(raw minced beef with mayonnaise) and table eggs in order to compare the magnitude of
risks associated to each combination. The predicted risk was highest for Salmonella spp. in
table eggs and Campylobacter spp. in chicken fillet. These kinds of instruments can assist to
quickly determine the relative risks associated to specific food hazards, thus making
decisions more efficiently. Nevertheless, when applying a simplified model, the resulting
public health risk in terms of number of human cases must be interpreted in a relative sense,
that is, comparing it with a reference study or other simplified pathogen–product
calculations. It is advisable not to use simplified models when trying to produce an
estimation of the number of cases due to the ingestion of a pathogen present in a food.
When economics is taken into consideration, a cost-utility analysis can be performed
(Mangen et al., 2007). In this way, quantitative risk assessments have the additional
advantage of being able to model the effects of different interventions and their associated
costs.
Inclusion of variability and uncertainty in quantitative risk assessments is crucial for a more
accurate determination and interpretation of risk outputs. Despite this, it should be
highlighted that estimation of uncertainty is, in many cases, very difficult or even
impossible when the model is complex and when a notorious lack of data is detected.
One of the earliest quantitative MRA performed at international scale was published by
FAO/WHO (2002b,) which proposed MRA of Salmonella spp. in egg and broiler chickens.
The main observations in broiler chickens were that a 50 % reduction in prevalence of
contaminated flocks influenced the reduction in the final risk of Salmonella spp. per serving
until reaching 99.75 % risk reduction. Another MRA was extended to Campylobacter spp. in
broiler chickens and Vibrio parahaemolyticus and V. vulnificus in shellfish (FAO/WHO,
2002c).
The risk assessment developed in 2003 by the US-FDA and the Food Safety Inspection
Service (FSIS) regarding Listeria monocytogenes in different Ready-to-Eat food categories,
identified deli meats as the most risky products in relation to food-borne listeriosis in the
USA. It is interesting to note that high population risks can be related to consumption of
high-risk foods (e.g. pâté and meat spreads) but also to high consumption of foods with
relatively low risks per serving (e.g. pasteurized milk).
FAO/WHO (2004) has also performed a MRA for L. monocytogenes in RTE foods: ice cream,
fermented meats, cold-smoked and vacuum-packed fish. Risk estimates ranged from 1 case
per 20 million servings for smoked fish to 0.4 cases per 1 million servings for fermented
meats. An important finding of the risk assessment was that, based on the predictions of the
models developed, nearly all cases of listeriosis resulted from the consumption of high
numbers of the pathogen. Conversely, the models predicted that the consumption of low
numbers of L. monocytogenes had a low probability of causing illness.
Risk estimation of Salmonella enteritidis in shell eggs and Salmonella spp. in egg products
(liquid pasteurized egg) was performed by USDA-FSIS in two different MRA (USDA-FSIS,
1998; USDA-FSIS, 2005). Pasteurization was predicted to be effective for reducing illnesses
from S. enteritidis in shell
eggs and from Salmonella spp. in egg products. If all eggs produced
in the US were pasteurized for 3 log
10
units reduction of S. enteritidis, the annual number of