Supply Chain Management New Perspectives Part 6 docx
Bạn đang xem bản rút gọn của tài liệu. Xem và tải ngay bản đầy đủ của tài liệu tại đây (1.01 MB, 40 trang )
Supply Chain Management - New Perspectives
188
Kevin Lane, 2006). In the past, retailers have used a large number of suppliers and they were
competing against each other for individual order. The current trend is to reduce the
number of suppliers and to develop long-term relationships with a small number of them.
Each supplier has different capabilities and retailer select them based on a supplier selection
software package. They follow some of assessment criteria in four main areas, together with
the kind indicators that would determine the likelihood of a supplier meeting these criteria
(Varley, 2003) such as:
product range and quality with the quality and variety of products available, where the
retailer assesses the supplier’s production specialisation and flexibility, design
capability, technical capability, etc.,
prices of products and discounts available for large quantities and for rapid payment,
where the retailer assesses the supplier’s financial stability, willingness to negotiate,
scale economies, etc.,
delivery in accordance with the retailer’s specification in terms of timing, quantities and
product variety,
service by which a supplier is adding value to the retailer, where the retailer assess the
supplier’s speed of new product introduction, its handling of queries and complaints,
etc.
Introducing a supplier rating system for measuring mentioned criteria, a retailer has the
opportunity to rationale its supply base. Furthermore, a retailer facilitates communication
and develops closer relationships with suppliers. They tend to retain their autonomy yet
move the business together by forming supply “partnership”. Table 1 summarizes the
transactional vs the partnership approach characteristics in retail supply.
Transactional approach Partnerships approach
short term or one-off
many suppliers and buyers
disloyalty and lack of commitment
low switching costs, little or no investment
made in relationships
loose or no procedures
exchange centred on single person in firm
changes in customer/supplier make little
difference
long term and on-going
few suppliers and buyers
loyalty and commitment
high switching costs, significant investments
will have been made in the partnership
strict procedural guidelines
many people and departments involved in
exchanges
change in customer/supplier causes
disruption
Table 1. Transactional vs partnership approach (Varley, 2003)
A time progresses, those partnerships lead to collaboration and to higher level of
operational efficiency. In this new collaborative environment each supplier gains a share of
the total orders based on their ability to deliver the order on time and to specifications
(Mangan, 2008). However, rather than searching for new suppliers, retailers are more likely
to increase business with the existing supply base, which has already made some changes in
order to adapt their products and services to retailers. Some initiatives that will improve
retailer-supplier relationships are shown in Table 2.
Companies that want to build holistic relationships with selected suppliers across the chain
raise their revenue and lower costs (Booz & Company, 2009). There is a wide spectrum of
Vertical Collaboration in the Supply Chain
189
possible collaborative measures that can improve efficiency, raise revenues, and cut costs for
both retailers and their suppliers (Table 3).
The supplier’s understanding of the retailer’s target customer and the brand image
that the retailer is trying to build.
Detailed feedback on sales from the retailer to the supplier.
Co-operation and co-ordination in marketing activities.
Sharing of information on relevant consumer and product/market trends.
Commitment of businesses to one another, including combined forward planning,
store space dedicated to supplier’s ranges, provision of point of purchase materials
and fixtures for the retailer, retailer involvement in product development.
System integration to facilitate information sharing, including sales data, stock and
delivery information.
An understanding of the retailer’s quality standard requirements, including product
quality and compliance on delivery and administration.
Table 2. What can improve relationships between retailer and its supplier? (Varley, 2003)
Revenue/margin enhancement Process improvement Cost reduction
Increasing penetration of
core products
Building multiyear
strategies to grow/build the
category
Managing/reallocating
shelf space and products
Driving consumer
convenience and impulse
shopping
Collaborating more closely
with private labels
Launching new
products
collaboratively
Improving
effectiveness of
marketing efforts
Jointly improving
promotion planning
and management
Practicing life-cycle
management
Utilizing POS data
and improving on-
shelf availability
Improving demand
forecasting
Decreasing shortage
Enhancing distribution
efficiency
Redesigning display
operating model
Optimizing the role of
merchandisers
Reducing returns
Improving efficiency
through supply chain
improvements
Table 3. Collaboration levers for enhanced profitability (Booz & Company, 2009).
5. Limitations to vertical supply chain collaboration
Supply chain collaboration has proven difficult to implement (Sabath & Fontanella, 2002)
due to a number of elements necessary to support collaboration such as (Barratt, 2004):
Trust –defined as a willingness to rely on an exchange partner in whom one has
confidence (Moorman et al., 1992). Trend of private labels and raising retailers’ ability
to manage them may cause the lack of trust between the manufacturer and the retailer,
because premium-brand manufacturers introducing new products and concepts are
Supply Chain Management - New Perspectives
190
afraid that their ideas will be taken over and used by retailers for their private-label
products (Deloitte, 2008).
Mutuality –reflected through mutual benefits and risk sharing among chain members.
Information sharing - relied on the transparency and quality of information flows
between buyers and suppliers. However, there has been an over-reliance on technology
in trying to implement it (McCarthy & Golocic, 2002).
Communication and understanding – related to the importance of clear and broad lines
of communication in the whole chain that will contribute to faster information sharing
between supply chain partners.
Openness and honesty – resulted in high level of trust, respect and commitment.
Collaboration is not just about developing closer relationships between supply chain
members, but also needs to identify with whom to collaborate with. Sabath and Fontanella
(2002) suggest that the problem in the efficient implementation of supply chain collaboration
is a great failure to differentiate between whom to collaborate with. Therefore, another
problem in the collaboration appears and is related to a lack of trust between trading
partners (Ireland & Bruce, 2000). Gattorna (2003) propose “segmentation” approach in the
context of successful collaboration. This segmentation approach should be conducted on the
downstream as well as on the upstream side of the supply chain. Namely, company has to
segment its suppliers and customers and to intensify its relationships with a small number
of strategically important customers and suppliers. Barratt (2004) argue that if customers can
be segmented by way of their buying behaviour and service needs, then separate supply
chains can be designed to meet the specific needs of the various customer segments.
Moreover, suppliers could be segmented according to their abilities and requirements to
service the segmented supply chain (Barratt, 2004). Additionally, one of these segments may
be appropriate for a collaborative approach, whereas more distinctive approach may be
suitable for other segments.
Booz and Company (2009) found main limitations of retailer-supplier partnerships and
collaboration in the traditional retailers’ tension to view their value purely as a means of
extracting lower prices or promotional support from their suppliers. It should be noted that
such maintaining of relationships often caused low in-store availability. Restricted
communication like that eliminates the possibility of partnerships which can put the
negotiation level and to add value to the whole supply chain.
Friedman and Belkin (2003) point out that order forecasts are the key preconditions for the
integration and the coordination of supply chain processes of partners in the chain, but also
that sharing demand forecasts alone cannot optimize manufacturing flexibility or enable a
make-to-order manufacturing process.
6. The research on the level of vertical collaboration in the supply chain
For the purpose of this chapter, a research study examining the level of collaboration
between retailers and their suppliers, tools necessary to establish successful relationship
between them, benefits and/or problems raised from the partnership between those two
sides, years of the partnership between retailers and their major suppliers, etc. on the
Croatian market was conducted. But for the purpose of better understanding of the
environment where the research was carried out, the main characteristics of Croatian
retailing should be presented.
Vertical Collaboration in the Supply Chain
191
6.1 An outline of retailing in Croatia
The retail industry is a significant part of the Croatian national economy. It generates EUR
15,329 mil. in revenue and employs 145,472 persons which accounts for almost 10% of the
total active workforce (own calculation based on data in RCCBS First release, 23rd
September, 2009.) Croatian market is dominated by a limited number of multiple-outlet
retailers. The Croatian retailing counts 37,353 outlets of various formats (RCCBS First
release, 23rd September, 2009). Nowadays, among the main characteristics of Croatian
retailing are concentration, internationalization and consolidation, with 71.4% of the market
held by 15 retailers (compared to 16.6% of the market held by 10 retailers in 2002). On the
first place, with 25.8 per cent market share domestic retailer, Konzum is the market leader.
It has been followed by international chain stores such as: Schwartz Group (Germany) with
Kaufland stores and Lidl stores; Rewe Group (Germany) with Billa stores; Spar (Austria);
Ipercoop (Italy) and Mercator (Slovenia). Renko (2008) and Knezevic (2003) note that
international retailers have introduced new standards and know-how to the domestic
market, including new technology, a more customer-focused orientation, and an
environment-friendly approach.
6.2 Questionnaire design
The questionnaire consisted of three parts. Part I relates to the domain of the strategic
integration construct, dependence, flexibility, relationship quality, continuity expectation,
and supply chain collaboration tools. 31 items are created based on Cassivi (2006), Johnson
(1999) and Morgan and Hunt (1994). The respondents indicated their level of agreement on
a 5-point Likert scale with strongly disagree (1) and strongly agree (5) as the anchors.
Part II of the questionnaire consists of 6 statements related to performance of the company.
Statements were adopted from the study of Johnson (1999). A 7-point Likert format
(1=much poorer than expected and 7= much better than expected) was used to assess the
level of commitments of retail managers to the statements relating to effects of partnerships
with suppliers. Here, respondents were asked to evaluate their firm’s performance on sales,
information flows, customer’s satisfaction level, time reduction, business flexibility and
inventory level which arose as the result of the supply chain collaboration. Part III of the
questionnaire required some information on the companies in the sample, such as
assortment, number of employees, number of suppliers, number of key suppliers, the length
of the cooperation with key suppliers, etc.
6.3 Sampling procedure
50 Croatian retailers with different assortment were included in the sample. There were no
special criteria in selecting the retailer, but the respondents were chosen based on their
specialized knowledge of and experience with supply chain relationships, and their role in
the procurement or sales activities carried out in the supply chain. The method used in this
study was an e-mail based structured questionnaire. The companies chosen were retail
companies dealing with food and non-food assortment. Similar to Coltman (2007) pre-
survey telephone calls were made at each participant to identify whether they would be
prepared to participate in the survey or whether they could provide contact details for the
most appropriate person in the firm. The research was conducted in the period February –
March 2011.
A total of 50 completed questionnaires were received, but three questionnaires were
eliminated due to a large number of unanswered questions. The collected data were
analyzed using SPSS. Except from descriptive statistics calculations, testing the reliability
Supply Chain Management - New Perspectives
192
with Cronbach's Alpha coefficient was conducted. Before using items for further analysis,
the reliability testing was conducted. The value of 0.81 for statements related to relationship
quality, supply chain collaboration tools, dependence, etc. and the value of 0.86 for
statements related to the performance of the company as the result of the collaboration with
key suppliers suggested very good internal consistency reliability for all scales used in this
research (the recommended standard of 0.7 has been suggested by Nunnally (1978) and 1.00
respresents perferct reliability). Since data were not normally distributed, a significance of
the findings and the level of collaboration between retailers and their suppliers were was
explored using Spearman correlation coefficient.
6.4 The findings
The structure of the sample cannot indicate a satisfactory level of representativeness as the
majority of responding firms are large companies with more than 500 employees (32.1 per
cent of the sample) and small companies with 10-50 employees (21.4 per cent of the sample).
There are mostly retail companies (57.1%), but the rest of the sample consists of companies
that are involved in retail and wholesale business (42.9 per cent of responding firms). The
analysis of the number of suppliers reveals that half of the sample operates with more than
200 suppliers. Among them, the largest percentage of the sample (35.7 per cent) has got 5-10
key suppliers on average and 10-20 years of relationships with their key suppliers (67.9 per
cent of the sample).
The mean scores for the degree of collaboration items (from 4.25 to 4.50) are very high (on
the scale from 1 to 5) suggesting that respondents are aware of the importance of
collaborating with their major suppliers. The largest percentage of respondents (49 per cent)
identified direct procurement (forwarding of purchase orders to pre-qualified suppliers) as
the most important supply chain collaboration tool. Mean scores for the collaboration
planning items (from 3.90 to 4.36) suggest that respondents highly evaluate the possibility to
exchange the forecast information provided by the supplier and to improve innovativeness.
Table 4 reveals main benefits of the collaboration between retailers and the suppliers. Table
4 shows that the positive impact on output measures, such as sale, has the highest average
score.
Item Mean St.dev.
the collaboration has a positive impact on resource measures
the collaboration has a positive impact on output measures
the collaboration has a positive impact on on flexibility measures
the collaboration has a positive impact on the firm's market share
the collaboration has a positive impact on the market share of major
supplier's products
4.18
4.39
4.11
3.86
4.36
0.819
0.951
0.737
0.832
1.079
Table 4. Vertical collaboration main advantages
However, the mean scores for flexibility and dependence are moderate to low. Dependence
and flexibility scales were adopted from Johnson (1999). Dependence was measured with
items based on replaceability, for example “if we could not buy our stock from our present
major supplier, we would likely be purchasing from some other major supplier“. Flexibility
was measured with items wich assessed the retailers' perceptions of the degree to which
they behaved flexibly in the relationships, such as „in our relationship with our major
supplier, we are willing to make adjustments for any reasonable change as needed“. The
Vertical Collaboration in the Supply Chain
193
results point out high level of dependence and low level of flexibility in the case of the
Croatian retailers. Namely, they are not ready to easily replace their product line with a
similar line from another company (64.3 per cent of the sample) and to purchase from some
other major supplier (64.3 per cent of the sample). Additionaly, they are not willing to put
aside contractual terms to work through problems raised by their major supplier (71.4 per
cent of the sample) and to make adjustments for any reasonable change as needed (92.9 per
cent of the sample).
As trust, and relationship commitment were recognized as the major supporting elements of
collaboration in general (Barratt, 2004), respondents were asked about their perception of
the importance and the quality level of the relationships with their suppliers. The mean
scores for relationship commitment and trust (from 3.86 to 4.75) are very high suggesting
that Croatian retailers intend to maintain the relationship which they have with their major
supplier and that the relationship which they have with their major supplier is something
they are very commited to. Finally, there is a high level of trust between investigated
retailers and their major supplier.
In order to find out whether relationships between the retailer and its key suppliers may
significantly affect performance, six-item performance scale was developed. The items are
based on previous studies of Johnson (1999) and Morgan and Hunt (1994) and they are
focused on the economic performance of the firm and the supplier’s direct part in it.
Correlation analysis (Table 5 in Appendix A) shows only moderate (±0,6 ≤ r ≤ ±0,4)
associations (Dancey & Reidy, 2007).
As we can see, there is a moderate positive association between the vertical collaboration
(between retailer and its supplier) while developing strategy and improved inventory
visibility in the supply chain. In other words, the more retailers consider their key suppliers
in strategic decision making, the better is the visibility of inventories in the chain. Positive
association between the importance for retailer to maintain the relationship with major
supplier and inventory visibility is evident. Chi-square test suggests that all respondents
confirmed those findings (χ2 = 10,691, df=6, p=0,014). There is also, moderate positive
association between the direct procurement and capacity planning and inventory visibility.
It is interesting to mention positive association between the collaboration planning items
(reflected through the exchange of information between retailer and supplier and
forecasting based on those information) and the improvement in the level of services in the
supply chain and the inventory visibility as well. 32.1 per cent of the respondents
completely agreed that flow of information between them and their major suppliers
contributed to inventory visibility in the chain. Additionally, the collaboration has a positive
impact on output measures, information and inventory visibility. More than a half of the
sample (53.6 per cent and 53.5 per cent respectively) point out that the „supply“ partnership
led them to improved inventory visibility and to increased flexibility in doing business.
Moreover, it allows them to increase the service level and to reduce cycle time. Table 5 also
shows moderate positive association between the level of trust between retailer and its
major supplier and inventory visibility and cycle time reduction. Chi-square test suggests
that 78.5 per cent of respondents highly evaluated the impact of collaboration on their
economic performance (χ2 = 14,940, df=6, p=0,002). There is also moderate positive
association between retailer’s monitoring of every aspect of transactions with its major
supplier (to ensure that nothing inappropriate happen) and the improved inventory
visibility. 57.1 per cent of the sample answered that as more they monitor transactions with
major supplier, the more visible inventories are.
But, it is surprisingly that in the market situation when all business subjects are aware that
their customers are their most important value, study among Croatian retailers did not
Supply Chain Management - New Perspectives
194
confirm statistically significant relationship between all “basic” dimensions that portray the
sampled companies’ profile and improved end-customer satisfaction which resulted from
vertical collaboration in the supply chain. This finding does not correspond to previously
mention theoretical assumption of more satisfied customer as the greatest value derived
from better relationships between retailer and supplier. Namely, when chain members begin
to collaborate to solve possible problems and pitfalls in the chain, and to improve service,
the customer is the final winner.
As expected, correlation analysis showed strong positive association between some supply
collaboration performance outcomes and improved end-customer satisfaction. Namely,
improved information visibility and service levels (as the result of vertical collaboration) are
strongly correlated to end-customer satisfaction (r=0,702**, p=0,000 for information
visibility; and r=0,616**, p=0,000 for service levels). Logically, strong positive association
(r=0,690**, p=0,000) between increased flexibility in doing business which resulted from
supply chain collaboration and end-customer satisfaction is present. In other words, the
collaboration between retailers and their suppliers leads to efficient information flows and
to higher level of services. Accordingly, increased flexibility in doing business is present.
Finally, this win-win supplier-retailer relationship has got large positive effect on end-
customers. In such a way, successful vertical collaboration can result in win-win-win
situation for all chain members.
7. Conclusion
This paper is an attempt to reveal the importance of the collaboration between retailer and
their suppliers in the supply chain. The fact is that today’s competitive pressure to improve
efficiency and to deliver added value for customers, forced all members of the supply chain
to change the way of their business relationships. As major players in the supply chain, both
retailers and their suppliers have recognized benefits of their closer relationships and the
need to transfer from the traditional relationship which has experienced a high level of
conflict between chain members. Some of well-known initiatives of suppliers and retailers
have included Efficient Consumer Response (ECR), and Collaborative Planning,
Forecasting, and Replenishment (CPFR) (Booz & Company, 2009), but in the praxis, a broad-
based strategic collaboration remains a rarity, and most retailers still do not consider
building collaborative value a core activity.
It is widely accepted that collaboration improves performance, but collaboration between
retailers and suppliers is still relatively limited (Deloitte, 2008). Today’s situation
characterizes many retailers with their own labels. Therefore, they are increasingly coming
into direct competition with suppliers: they are competing both for physical access to
consumers and for consumers’ brand loyalty (which is limited) (Deloitte, 2008). In such a
situation, there are objective conflicts of interest between vertical participants in supply
chains. Everyone in the chain is seeking to appropriate value for themselves from
participation and, assuming economically rational behaviour, must wish to appropriate
more of the value for themselves if they are able to do so (Cox, 1999). The literature review
suggests partnering between firms as an increasingly common way for firms to find and
maintain competitive advantage (Mentzer et al., 2000) and to reduce inventory and other
logistics costs for both retailer and its supplier. The study conducted in the case of the
European country in transition, confirmed that Croatian retailers recognized the importance
and benefits of the collaboration with their suppliers. They pointed out positive impact of
vertical collaboration on their output measures and improved information and inventory
visibility.
Vertical Collaboration in the Supply Chain
195
Given this, it seems clear that managers on both sides, on the retailer's and supplier's side as
well, require a proper understanding how to select supplier partners and to share the
benefits and costs of their joint initiative. Achieving effectively collaboration is not a one-
size-fits-all process and requires improved level of negotiation and more holistic
relationships between chain members.
8. Appendix A
Item
Spearman
correlation
coefficient
When developin
g
our firm's strate
gy
, we
consider our major supplier as a large part
of the picture
Suppl
y
chain collaboration improved
inventory visibility
0,505**
It is ver
y
important for our compan
y
to
maintain the relationship with our major
supplier
Suppl
y
chain collaboration improved
inventory visibility
0,569**
Direct procurement (formards purchase
orders to pre-qualified suppliers)
Suppl
y
chain collaboration improved
inventory visibility
0,533**
Forecastin
g
– exchan
g
es the forecast
information provided by the supplier
Suppl
y
chain collaboration improved
service levels
Supply chain collaboration improved
inventory visibility
0,479**
0,536**
Capacit
y
plannin
g
–
determines the amount
of capacity required to produce
Suppl
y
chain collaboration improved
inventory visibility
0,596**
The collaboration has a positive impact on
output measures
Suppl
y
chain collaboration improved
information visibility
Supply chain collaboration improved
inventory visibility
Supply chain collaboration reduced
cycle time
0,512**
0,552**
0,500**
The relationship that m
y
firm has with our
major supplier is something we are very
commited to
Suppl
y
chain collaboration improved
service levels
Supply chain collaboration improved
inventory visibility
Supply chain collaboration increased
flexibility in doing business
Supply chain collaboration reduced
cycle time
0,585**
0,556**
0,548**
0,508**
There is a hi
g
h level of trust between us
and our major supplier
Suppl
y
chain collaboration improved
inventory visibility
Supply chain collaboration reduced
cycle time
0,507**
0,558**
We monitor ever
y
aspect of transactions
with our major supplier to ensure that
nothing inappropriate happen
Suppl
y
chain collaboration improved
inventory visibility
Supply chain collaboration reduced
cycle time
0,633**
0,488**
** Correlation is significant at the 0.01 level (2-tailed)
Table 5. The effect of collaboration on performance
Supply Chain Management - New Perspectives
196
9. References
Anthony, T. (2000), Supply chain collaboration: success in the new internet economy,
Achieving Supply Chain Excellence through Technology, Montgomery Research Inc.,
San Francisco, pp. 41-44.
Ayers, J.B. (2006), Handbook of Supply Chain Management, 2
nd
ed. Taylor & Francis Group,
ISBN: 978-0849331602, Boca Raton, USA
Ayers, J.B. & Odegaard, M.A. (2008), Retail Supply Chain Management, Auerbach
Publications, Taylor & Francis Group, ISBN: 978-0-8493-9052-4, Boca Raton, USA
Barratt, M. (2004) Understanding the meaning of collaboration in the supply chain, Supply
Chain Management: An International Journal, vol. 9, no. 1, pp 30-42, ISSN: 1359-8546.
Booz & Company (2009) The Collaboration Game Building Value in the Retail Supply
Chain, USA, accessed 20 March 2011, available from: www.booz.com
Cassivi, L. (2006), Collaboration planning in a supply chain, Supply Chain Management: An
International Journal, vol. 11, no. 3, pp. 249-258, ISSN: 1359-8546.
Christopher, M. (1996) Emerging Issues in Supply Chain Management, Proceedings of
the Logistics Academic Network Inaugural Workshop, Warwick, in: Waters,
(2003), pp 34
Coltman, T., (2007), Why build a customer relationship management capability?, Journal of
Strategic Information Systems, 16, pp. 301-320.
Cox, A. (1999), Power, value and supply chain management, Supply Chain Management: An
International Journal, vo 4, no. 4, pp. 167-175, ISSN: 1359-8546.
Dancey, C.P. & Reidy, J. (2007) Statistics Without Maths for Psychology, Pearson Education
Ltd., ISBN: 978-0-132-05160-6, London.
Deloitte (2008) Supplier/retailer relationships: A growing need for collaboration on both
sides, accessed 20 March 2011, available from:
/>business/3ab35915531fb110VgnVCM100000ba42f00aRCRD.htm
Dyckhoff, H., Lackes, R. & Reese, J. (2004) Supply Chain Management and Reverse
Logistics, Springer – Verlag Berlin – Heidelberg, ISBN: 978-3-642-07346-5,
Heidelberg, Germany.
Esper, T.L. & Williams, L.R. (2003), The Value of Collaborative Transportation Management
(CTM); Its Relationship to CPFR and Information Technology, Transportation
Journal, Summer, pp. 55-65.
Friedman, T.H. & Belkin, G. (2003) Major Trends in North American CPFR Adoption,
CPFR in North America, in Seifert, D. (2003), Collaborative Planning,
Forecasting and Replenishment: How to create a Supply Chain Advantage,
AMACOM
, pp. 95-110.
Gattorna, J. (2003), Gower Handbook of Supply Chain Management, Gower Publishing
Company, ISBN: 978-0-566-08511-6, Burlington, USA.
Gilbert, D. (2003) Retail Marketing Management, Pearson Education Limited, 2
nd
ed., ISBN:
978-0273-655114, Glasgow
Johnson, J.L. (1999), Strategic Integration in Industrial Distribution Channels; Managing the
Interfirm Relationship as a Strategic Asset, Journal of the Academy of Marketing
Science, vol. 27, no. 1, pp. 4-18
Vertical Collaboration in the Supply Chain
197
Knezevic, B. (2003), Globalization and Croatian Retail Industry, Proceedings of 5th
International Conference on Enterprise in Transition, University of Split, Split-Tucepi,
May 22-24, 2003; Faculty of Economics nad Business Split, pp. 226-237
Kotler, P. & Kevin Lane, L. (2006), Marketing Management, Pearson Education, Inc., ISBN
978-0131457577, Upper Saddle River, New Jersey.
Ireland, R. & Bruce, R. (2000) CPFR: only the beginning of collaboration, Supply Chain
Management Review, September/October, pp 80-88.
Lapide, L., Derome, J. & Radjou, N. (2002) Analysts’ panel discussion, Supply Chain World
North America : Extending Collaboration to End-to-End Synchronization, April
2002, in: Ayers, J.B. (2006), Handbook of Supply Chain Management, 2
nd
ed. Taylor &
Francis Group, ISBN: 978-0849331602, Boca Raton, USA. pp 96.
McCarthy, S. & Golocic, S. (2002) Implementing collaborative planning to improve supply
chain performance, International Journal of Physical Distribution & Logistics
Management, vol. 32, no. 6, pp 431-454.
Mangan, J., Lalwani, C. & Butcher, T. (2008) Global Logistics and Supply Chain
Management, John Wiley & Sons, Ltd, ISBN: 978-0-470-06634-8, Chichester, West
Sussex, Great Britain.
Mehrjerdi, Y.Z. (2009) The collaborative supply chain, Assembly Automation, vol. 29, no. 2,
pp. 127-136.
Mentzer, J.T., Foggin, J. & Golicic, S. (2000), Collaboration: The Enablers, Impediments, and
Benefits, Supply Chain Management Review, September/October, pp. 52-58.
Mentzer, J.T. , Min, S. & Zacharia, Z.G. (2000) The Nature of Interfirm Partnering in Supply
Chain Management, Journal of Retailing, vol. 76, no. 4, pp. 549-568.
Moorman, C., Zaltman, G. & Deshpandé, R. (1992) Relationships Between Providers and
Users of Market Research: The Dynamics of Trust Within and Between
Organizations, Journal of Marketing Research, vol. 29 (August), pp. 314-329.
Morgan, R.M. & Hunt, S.D. (1994), The Commitment-Trust Theory of Relationship
Marketing, Journal of Marketing, vol. 58 (July), pp. 20-38
Pooler, V.H., Pooler, D.J. & Farney, S.D. (2004), Global Purchasing and Supply
Management: Fulfill the Vision, 2
nd
ed., Kluwer Academic Publishers, ISBN: 1-
4020-7816-1, USA
RCCBS First Release, no. 4.1. 2/3, Republic of Croatia Central Bureau of Statistics, 23rd
September 2009
Reese, J. (2004) Optimal Maintenance in the Supply Chain, in: Dyckhoff et al., (2004), pp.
371-385.
Renko, S. (2008), How to Process of Internationalization enhances the Sustainability of the
Croatian Retailing, World Journal of Retail Business Management, Vol. 2. Issue 4, pp.3-
10, ISSN: 1994-2915
Sabath, R. & Fontanella, J. (2002) The unfulfilled promise of supply chain collaboration,
Supply Chain Management Review, July/August, pp 24-29.
Seifert, D. (2003), Collaborative Planning, Forecasting and Replenishment: How to create a Supply
Chain Advantage, AMACOM, ISBN: 978-0814471821, New York.
Simchi-Levi, D., Kaminsky, P. & Simchi-Levi, E. (2004), Managing the Supply Chain: The
Definitive Guide for Business Professional, McGraw-Hill, New York.
Supply Chain Management - New Perspectives
198
Spekman , R., Kamauff, J. & Myhr, N. (1998) An empirical investigation into supply chain
management: a perspective on partnerships, Supply Chain Management, 3 (2), pp
53-67.
Varley, R. (2003), Retail Production Management: buying and merchandising, Routledge, Taylor
& Francis Group, ISBN-10: 9780415327152; ISBN-13: 978-0415327152, London
Waters, D. (2003), Logistics: An Introduction to Supply Chain Management, Palgrave Macmillan
ltd, ISBN: 0-333-96369-5, Great Britain.
9
Collaboration in the Design-Manufacturing
Chain: A Key to Improve Product Quality
Yanmei Zhu
1
, Robert Alard
2
, Jianxin You
1
and Paul Schönsleben
2
1
School of Economics & Management, Chinese Academy of Science &
Technology Management, Tongji University, Shanghai
2
Center for Enterprise Sciences (BWI), Swiss Federal
Institute of Technology Zurich (ETHZ),Zurich
1
China
2
Switzerland
1. Introduction
Supply china management (SCM) is a well-established discipline that involves the
coordination of an organization’s internal planning, designing, manufacturing, and
procurement efforts with those of its external partners (i.e. designer, manufacturer, supplier,
retailers, etc.). To reduce inefficiencies in a supply chain, organizations are increasingly
using information systems to integrate the systems and processes throughout their supply
chain. Effective supply chain integration and synchronization among partners can eliminate
excess inventory, reduce lead times, improve customer satisfaction, reduce cost and increase
sales (Mclaren et al, 2002).
Collaboration is a trend in SCM that focuses on joint planning, joint designing, coordination,
and process integration between suppliers, customers, and other partners in a supply chain.
Its competitive benefits in include cost reductions and increased return on assets, and
increased reliability and responsiveness to market needs. During the past 10 years there has
been a significant trend of companies externalizing a wide range of functions that formerly
might have been carried out in-house. There are many reasons for this trend, including
increasing global competition, more rapid technical advance and the need for faster
development of products with higher quality and reliability. It is almost impossible for any
one firm to possess all of knowledge and technological capability needed to develop a
complex product. This means that organisation has to focus on their core competencies and
draw on the best expertise available world-wide to access specialties outside that core
competence (Jagdev & Thoben 2001, Chung et al. 2004). Increasingly, companies are
concentrating on core businesses and outsourcing other non-core activities. Consequently,
quality management should be carried out across the supply chain, instead of only within
the company. It is vital for companies to make the best of external resources and to
cooperate with their partners on the supply chain in order to enhance their end-product
quality (Wang et al. 2006). In leading-edge firms, management of the supply chain is
regarded as one important way to gain a competitive advantage. Major American
corporations such as Whirlpool, Boeing and Chrysler have shifted many of their design
activities to key suppliers (Hartley 1997, Utterback 1974). To be effective, supply chain
Supply Chain Management - New Perspectives
200
quality improvement must start from the design stage because design specifications have a
major effect on a product’s performance, quality and cost.
Currently, as a result of the fragmented global value chain, technology also has become an
independent commodity (Guo 2006). Quality management in design and manufacturing
phases are normally not implemented in the same company, but from the perspective of the
whole supply chain. In increasingly competitive global markets, enterprises must maintain
core competitiveness by shortening time-to-market, reducing costs, improving quality and
integrating the resources of other partners on the supply chain (Chung et al. 2004).
Strengthening product design capability is therefore becoming a key target of various
companies(Lyu & Chang 2007).
To a great extent, product quality depends on design and manufacturing processes,
therefore studying how to improve product quality through collaboration between
designing and manufacturing companies is quite significant, from both theoretical and
practical perspectives. This is one of the objectives of the, Design Chain-Supply Chain-
Management (DC-SC-M) project, focusing on the coordination issues between western
designers and Chinese manufacturers (suppliers). To be successful in highly competitive
global marketplaces where product quality is a vital criterion, the designer and
manufacturer should improve the end-product quality cooperatively.
The major purpose of this study is to analyze the impact of design and manufacturing on
final product quality, and to measure the importance of design quality in product quality.
The design-manufacture chain model is illustrated since it is a decisive phase for
determining product quality in many industries. Finally, we developed conceptual
framework and formula for our Quality Relationship Model (QRM) to identify and elucidate
the relationships between design quality, manufacturing quality and product quality.
2. Literature review
2.1 Product quality
Quality has emerged as a strategic factor, making quality management a necessity for
overall operational effectiveness and global competence (Desai 2008). Quality is defined to
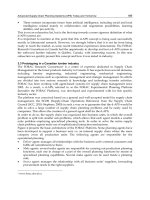
be conformance to requirements (Crosby 1984). Previous research shows that, while product
design may account for only 5 per cent of the product cost, it has a critical influence on 75
per cent or even more of manufacturing costs, and influences up to 80 per cent of product
quality (Huthwaite 1988). Some have asserted that more than 40 per cent of all quality
problems can be directly traced back to inferior product design (Leonard et al. 1982, Raia
1989). Moreover, the product design phase drives 70 to 80 per cent of the final production
cost, 70 per cent of life cycle cost of product, and 80 per cent of product quality (Dowlatshahi
1992) (Figure.1).
The fact that quality must be designed into the product – as well as being “built-in” by
downstream operations – has added to the recent emphasis on the new product
development (NPD) process. According to the NDP concept product design, which drives a
product's “innate” quality, is the key to overall product quality, and the design phase of the
design-manufacturing chain (D-MC) is the most important phase in enhancing quality and
reducing cost.
Increasing competitive parity in the areas of cost and quality has forced global
manufacturers to seek other sources of competitive advantage with new product
development rapidly becoming the focal point in the quest for sustained growth and
Collaboration in the Design-Manufacturing Chain: A Key to Improve Product Quality
201
profitability. The implementation of the integrated product development (IPD) process has
come to depend on the use of multi-functional teams (Birou & Fawcett 1994). Manufacturing
management indicates what is possible in terms of manufacturability and works to combine
the shortest possible response time with a high degree of quality and dependability. Getting
these management functions to work together to develop superior products and reduce
concept-to-market time remains a challenge for many organisations (Hayes et al. 1988).
‘Soft’ technical skills such as JIT,TQM, Management methods and level of collaboration have
been found to be more influential in developing products and increasing supplier
collaboration than ‘hard’ or technically complex capabilities (O’Sullivan 2003, Von Corswant
& Tuna’lv 2002). Well trained technical liaison staff, administrative standards and
collaboration will lead to greater levels of supplier involvement in design coupled with
increased motivation to make larger investments in the design process (McIvor et al, 2006).
Fig. 1. Incline of Quality (Source: Dowlatshahi 1992)
2.2 Design chain
Firms in many industries are facing increased global competition and are operating in
markets that demand more frequent innovation and higher quality. These firms are looking
for ways to improve quality and reduce product cost. A large body of literature now exists
which has identified new product development as a core process that has a major role to
play in achieving success in the global economy (McIvor, Humphreys & Cadden 2006, Taps
& Steger-Jensen 2007). A number of studies have identified a wide range of variables critical
to successful product development.
The design chain is defined as the collection of business activities associated with all phases
of product engineering, including research and development (Wognum et al. 2002). The
design chain includes four stages: specification, concept design, detailed design, and
production design (Hartley et al. 1997). The members in a design chain can aim to optimize
the mechanical functions of a product, minimize the total production costs or achieve other
settled targets (Lee & Gilleard 2002, McIvor & Humphreys 2004, Baglieri & Secchi 2007).
70~80%
of Product
Quality
Design
Process
Production
Process
Time
Transportation,
After-sale services,
etc.
Total
Product
Quality
Quality
Supply Chain Management - New Perspectives
202
Design chain management is the management of the participants, both internal and external
to a focal firm, that contribute the capabilities (knowledge and expertise) necessary for the
design and development of a product which, on completion, will enable full-scale
manufacture to commence (Twigg 1997). Thus, the design chain involves participants
throughout the product development process, from concept, detail engineering, process
engineering, prototype manufacturing, through to post-launch activities.
As operations become leaner (Lamming 1993), the focus of quality management will
necessarily shift to earlier phases in the product development process, and especially to
design relationships that a company forges with its outside suppliers. Each relationship may
be considered part of a design chain (Clark & Starkey 1988, Twigg 1997) within a network of
firms. Under total quality management (TQM) systems, product design efforts have two
primary objectives: to design easily manufacturable products (Kitapci & Sezen 2007) and to
design better quality products while minimizing costs.
2.3 Early supplier involvement
In many industries, firms are seeking to improve quality, reduce the cost of products and
facilitate the smooth launch of new products. Early supplier involvement is a key
coordinating process in supply chain design, product design and process design.
Researchers have found that a number of benefits are attained though Early Supplier
Involvement (ESI) in the product development process. Incorporating suppliers into project
teams enhances the information and expertise regarding new ideas and technology (Smith &
Reinertsen 1991, McIvor R. Humphreys P. & Huang, G., 2000.). In addition, it allows early
identification of potential problems, thus improving the quality of the final product,
eliminating rework and reducing costs (Dowlatshahi 1997, Meyer 1993, Handfield 1994).
ESI refers to customers and suppliers providing their ideas and resources in the early stages
of the new product development process. It consists of two parts - early supplier
involvement and early customer involvement. Many firms are also aware of the importance
of the key suppliers in the early stages of their product development processes and in
shortening the time-to-market. An earlier work has reviewed the involvement of suppliers
in the earlier stages of a company's product development process to reduce considerably the
lead-time and manufacturing costs. Today, manufacturers commonly strive for early
supplier involvement in product development. Effective integration of suppliers into the
product value chain is a key factor in the improving competitiveness of many
manufacturers. Early involvement can occur in any of the stages of product development, as
summarized in Table 1 (Dowlatshahi 1997, Hartley et al. 1997, Twigg 1998, Lyu & Chang.
2007).
Increasingly, suppliers are becoming involved much earlier (Appleby & Twigg 1988; O’Neal
1993, Sleigh 1993, Twigg 1998, Liker et al. 1996). Today, outside suppliers represent
increasingly important members of the new product development team. Supplier
involvement promotes better resource utilization, the development and sharing of
technological expertise, and network effectiveness (Birou & Fawcett 1994, Wadhwa &
Saxena 2007).
There is evidence that the early involvement of suppliers in product development is
instrumental in reducing lead time and avoiding costly downstream production problems
(Clark& Fujimoto 1991). Japanese supplier management methods involve intense and
frequent communication during the product development cycle, particularly in the early
stages when the product is being defined (Dyer & Ouchi 1993). This includes the in-depth
Collaboration in the Design-Manufacturing Chain: A Key to Improve Product Quality
203
and regular sharing of technical information to improve performance and reduce cost. The
suppliers send 'guest engineers' to work full-time for extended periods in their customer's
design offices along side the customer's design engineers (Dyer & Ouchi 1993, Liker et al.
1996).
Design
stages
Concept design Specification Detailed design Production
design
ESI
Target markets
Key product and
process technologies
Product architecture
Contribute key
ideas/concepts/
critical components
Establish interfaces
between product
subsystem
Establish
specification
Avoid ambiguity
and information
distortion
Identify early
changes
Identify key
components
required
Selection of
proprietary parts and
components
Tolerance design
Prototype testing and
demonstration
Design for
manufacturability
Materials selection
Process design
Tooling design
Design for
Manufacturabil
ity
Quality control
and assurance
Raw materials
Table 1. Early Supplier Involvement in various design stages
3. Design-Manufacturing Chain(D-MC)
Competitive pressures are forcing companies to design new products - or new versions of
products - better, faster and cheaper. It is now generally understood that this can be
accomplished through Concurrent Engineering (CE) (Schönsleben 2003) of the product and
the manufacturing processes that make the product. From the emergence of market demand
to finished-product delivery to the end consumer, the product goes through several phases
including design, manufacturing, transportation, distribution and so on. The, design phase
includes product planning, concept design, design specification and revision, while
manufacturing includes prototyping, testing, production planning, and full-scale
production. A Design-Manufacturing Chain (D-MC) (Zhu & Alard 2005, Zhu et al. 2006, Zhu
2007, Zhu & You 2009) is a chain or network made up of design and manufacturing
companies, in which the final product is designed and produced within different
companies. The simplest D-MC consists of only two companies: the designer / designing
company (e.g. an Original Equipment Manufacturer, OEM) and the manufacturing
company.
Manufacturers are included in the development process because they frequently possess
design and technology expertise which designers usually do not know very well. Therefore,
product time-to-market reduction and substantial cost savings from higher productivity,
lower maintenance and fewer recalls are possible benefits of early supplier (or
manufacturer) involvement in product design and development stages. A common method
for accomplishing this is through cross-functional teams that bring product developers into
direct communication with manufacturing engineers, marketing executives, and others
whose input is important to the product development effort (Liker et al. 1996).
Supply Chain Management - New Perspectives
204
The essence of today′s product development strategies is simultaneous development of the
new product – also known as CE and/or design for manufacturability – such as product
quality improvement, cost reduction, and lead-time shortening. CE carried out in the early
stages of product and system design can bring out a series of benefits, by considering and
including various product design attributes such as maintainability, marketability,
manufacturability, safety, reliability and transportability.
As Design-Manufacturing Chain (D-MC) (Figure.2) shows, manufacturing process can start
prototyping and tooling from the detailed design stage, not waiting until the whole design
phase is completely finished.
Fig. 2. Design-Manufacturing Chain(D-MC)
The philosophy of D-MC quality management is to control product quality from its roots
and emphasizes early supplier (manufacturer) involvement in the process of product design
and development, which may accelerate product innovation and optimize product quality.
D-MC quality management is also based on win-win relationship of supply chain partners.
Partners in D-MC should focus on quality information/resource sharing and on exchanges
of manufacturing and testing information, rather than on bargaining.
There are many opportunities for manufacturers to be involved in major stages of the
product development process. At the concept design phase, manufacturers help to identify
up-to-date technologies to be incorporated into a new product. In the detailed design
process, manufacturers can provide solutions for component or sub-assembly design and
the selection of most suitable materials and components. Manufacturers have capabilities or
know-how to provide the most effective tooling, fixtures and equipment. Throughout the
product design and development processes, manufacturers may be involved in design
Collaboration in the Design-Manufacturing Chain: A Key to Improve Product Quality
205
teams to achieve DFM (Design for Manufacturability) and ensure the product will be
delivered effectively and efficiently.
It is necessary to develop a methodology for better supplier involvement in the new product
design and development process through a prototype web-based platform on the
internet/intranets using web technology. A web-based framework can promote and
facilitate early manufacturer involvement in the design stage, in practice.
4. Design-Manufacturing Chain Quality
According to the definition of quality, “quality of design process” means that design
specifications should conform to the requirements of customers, and “quality of
manufacturing process” means that manufacturing should conform to the design
specifications. Although product quality is related to product delivery, after-sales service,
maintenance, recyclability, etc., it is mainly shaped in the design and manufacturing
processes, i.e., product quality depends on D-MC quality.
Based on a review of the literature and on interviews with expert partners from design,
production and logistics departements as part of a research project with eight European
industrial companies that cooperate on an international level, we will demonstrate the key
determining factors for the final product quality . According to our research there are two
primary factors influencing the final product quality: the design process of the product and
the manufacturing process. Therefore, to a great extent, final-product quality lies on the
quality of Design-Manufacturing Chain. Design-Manufacturing Chain Quality(D-
MCQ)includes two parts, design quality and manufacturing quality. Design quality means
that design requirements reflect the Voice of Customer (VoC) or the demands of market.
Manufacturing quality means that the end-product conforms to the product design
requirement and specification, where it is the conformance to quality. If design does not
reflect the market requirements, the product can not meet the demands of market even
though manufacturing conforms to the design completely, and if manufacturing does not
conform to the design specifications, the finished product has poor quality and can not
satisfy customers' needs.
Design-Manufacturing Chain Quality Management (D-MCQM) indicates supervision and
control the quality of all activities on D-MC. D-MCQM can be depicted by three simple
definitions that follow:
Design-Manufacturing Chain (D-MC) is defined as the chain or network made up of design
and manufacturing companies and processes;
Quality (Q) means conformance to requirements;
Management (M) refers to the activities for design and manufacturing quality improvement.
Poor quality of D-MC includes poor quality of design and poor quality of manufacturing.
Poor quality of design means that design requirements do not reflect the demands of
customer adequately at the right cost, and/or at the right time. Poor quality of
manufacturing means that manufacturing has not completely conformed to the design
requirements/ specifications so that the final product can not meet market demands at the
right cost and at the right time. Designs with technological deficiencies lead to inferior
products, as do late stage design changes such as products that need to be recalled or re-
manufactured. All of those are examples of poor quality.
Technological deficiencies in design, which is “innate” deficiency of product quality, may
result in huge quality costs in many areas such as quality-related maintenance, warranty
repairs and severe exterior (e.g. product safety liability, product returns, retail channel loss)
Supply Chain Management - New Perspectives
206
loss (Guo 2003). Manufacturing quality control usually can not solve the problems which are
rooted in design deficiency. Therefore, design quality is decisive to product quality, so in
order to create more customer value it is crucial to manage quality starting from the design
process instead of focusing on the manufacturing process only.
Fig. 3. Poor Quality of D-MC
An overwhelming majority of product failure costs and design iterations come from the
ignorance of noise factors during the early design stage. The noise factors which crop up one
by one in the subsequent product delivery stages cause costly failures. The Taguchi Method
(TM) presented by Taguchi G. (1989) may help designers to select appropriate controllable
factors so that the deviation from the ideal value is minimized at a low cost. Variation
reduction is universally recognized as a key to quality reliability and improvement in D-MC.
Product design decisions are affected by many controllable and uncontrollable factors
including technological, environmental and organisational issues.The number of
controllable factors and noise factors for quality reliability change upstream (design process)
and downstream (manufacturing process) in the D-MC (Figure.4). Generally, uncontrollable
noise factors increase and controllable factors decrease along the D-MC. Accordingly,
quality control from start or upstream is more efficient than downstream.
Fig. 4. Controllable Factors and Noise Factors on D-MC
Number
of
Factors
Processes
of D-MC
……
Concept
Design
Full-scale
Production
Controllable
Factors
Noise
Factors
Collaboration in the Design-Manufacturing Chain: A Key to Improve Product Quality
207
5. Quality Relationship Model (QRM)
Therefore, the impact of design on product quality is much stronger than that
of manufacturing. The Quality Relationship Model (QRM) can be illustrated with the
leverage relationships between design quality, manufacturing quality and product quality
(Figure.5).
Fig. 5. Quality Relationship Model (QRM)
The followed formula expresses the leverage relationship of QRM in Figure 5.
11 22 nn
WFa Fa Fa
(1)
where:
W denotes final product quality, the bigger W the better the final product quality;
1
F : Design quality;
2
F : Manufacturing quality;
3
F
n
F : The quality of every other process, e.g. delivery, after-sales service, etc.
If
3
F
n
F are all of the processes influencing product quality, then
12
1
n
aa a
(2)
1
a : The impact factor of design quality on final product quality. According to Figure 1, the
product design phase drives 70 to 80 percent of the product quality (Huthwaite 1988,
Dowlatshahi 1992), so design influences 70 to 80 percent of the product quality (repetitive),
and the impact factor of design quality is between 0.70 and 0.80,
1
0.70 0.80a
(3)
Supply Chain Management - New Perspectives
208
2
a : The impact factor of manufacturing quality on final product quality. If the impact factor
of design quality is represented in formula 2, then
2
00.30a
(4)
Larger numerical values of
1
a ,
2
a shows stronger impacts of the process on final product
quality.
Certainly, the quality of other processes other than design and manufacturing, i.e.
3 n
FF ,
also has an influence on product quality. Their impact factors are
3 n
aa respectively.
11
Fa and
22
Fa respectively express the influence of design quality and manufacturing
quality on product quality.
Based on an analysis of the formulae, in order to improve product quality, it is imperative to
enhance design quality (
1
F ). A collection of tools for design engineering (e.g. QFD, DFMA,
Tolerance Analysis, Robust Design, DOE, etc.) should be implemented in the product
development process in order to avoid huge costs for re-design after a new product has
launched. To avoid the expensive re-design activities and improve the manufacturability of
the design, it is necessary to establish cross-functional teams to facilitate early supplier
or/and manufacturer involvement to initiate the product research and development. The
cross-functional team is made up of representatives from such groups as engineering,
manufacturing and marketing. Meanwhile, it is also necessary to control manufacturing
quality (
2
F ) to avoid manufacturing defects that arise from a manufacturer’s negligence.
This chapter advocates supplier involvement in the early phases of product design and
development in a concurrent engineering environment. Early manufacturer involvement
efforts will lead to better manufacturability, easier assembly and better quality.
6. Two cases from the toy and automobile industries
The Toy industry is a good case for a study of design and manufacturing quality because
many “Made in China” toys are designed by foreign companies (brand owners, such as
Mattel Inc.) but are manufactured by overseas suppliers, and especially by Chinese factories.
Design problem would result in a poor-quality or unsafe toy irrespective of where the toy
was manufactured. On the other hand, a manufacturing defect arises due to manufacturer
errors or negligence. Toy manufacturers produce toys according to design specifications
from toy designers; if the design itself has defects, the toys will definitely be faulty.
The recall of an estimated 20 million Chinese-made toys by Mattel on August 14, 2007
shocked the world. To explore the essence of this event, we have to examine deeply what
the problems are and where they arose. The fault may occur due to design or due to
manufacturing. The distinction between design and manufacturing is particularly important
in the context of the toy industry because the design of toys is performed by toy brand
owners whereas manufacturing is done by overseas manufacturers. Therefore, the effort to
improve product quality and avoid recalls should be targeted at where the problems exist.
Table 2 clearly shows that the number of toy recalls by flaw type over the last two decades
(1988–2007) and the causes of recalls (Bapuji & Beamish 2007).
A design problem would result in a poor-quality or unsafe toy irrespective of where it was
manufactured. On the other hand, a manufacturing defect arises from a manufacturer’s
Collaboration in the Design-Manufacturing Chain: A Key to Improve Product Quality
209
negligence. Toy companies develop designs and then send them to the manufacturers in
China along with specifications. If a toy’s design is good, it does not necessarily mean that
the final toy product will be good. By contrast, if the design is poor, the final toy product
will definitely not be good. In other words, only toy companies can prevent problems
associated with design. On the other hand, manufacturing defects can be prevented by both
manufacturers and by toy designers (brand owners).
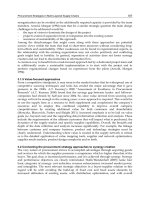
Therefore, as Table 2 shows, the recalls of toys over the last two decades (1988~2007) are
analyzed to examine if the number of recalls had systematically increased and what kind of
problems resulted in recalls (Bapuji & Beamish 2007).
Year
Total Number
of Recalls
Number of Recalls
due to Design Flaws
Number of Recalls due to
Manufacturing Flaws
1988 29 25 2
1989 52 42 2
1990 31 25 3
1991 31 29 1
1992 25 16 0
1993 20 15 1
1994 29 21 4
1995 35 32 0
1996 26 15 5
1997 22 17 1
1998 29 23 1
1999 20 15 2
2000 31 25 2
2001 23 15 4
2002 25 20 3
2003 15 14 0
2004 15 8 4
2005 19 14 3
2006 33 23 6
2007 40 26 10
Total 550 420 54
Percentage 100% 76% 10%
Table 2. Toy Recalls by Flaw Type (1988 – 2007) (Source: Bapuji & Beamish 2007)
Of the 550 recalls from 1988 to 2007, 420 of that (76 per cent) were caused by design flaws, in
contrast, only 54 recalls (10 per cent) were due to manufacturing flaws. Therefore only 14
per cent of recalls stem from other reasons, e.g. transportation, storage. In other words, the
majority of recalls were due to design-related problems, not manufacturing. Certainly, it is
true that the percent of recalls by manufacturing flaws sequentially rose over the last three
years, and Chinese manufacturers should consider this seriously, although this is not the
topic of this chapter. Of the 550 recalls from 1988 to 2007, 76 per cent were caused by design
flaws, in contrast, only 10 per cent by manufacturing flaws. Then other 14 per cent of recalls
stem from other causes, e.g. transportation, storage.
Supply Chain Management - New Perspectives
210
1988
1989
1990
1991
1992
1993
1994
1995
1996
1997
1998
1999
2000
2001
2002
2003
2004
2005
2006
2007
T otal Number of Recalls
Number of Recalls due to Design Flaws
Number of Recalls due to Manufacturing Flaws
Fig. 6. Recalls by Flaw Type (1988-2007)
Applying the formula of the Quality-Relationship Model to the toy industry, if the impact
factors
1
a
and
2
a can be evaluated. If
T
W shows the quality of toy, then the formula of QRM
is as follows:
11 22 1 2
0.76 0.10
TTTTT nTnTT T nTnT
WFa Fa Fa F F Fa (5)
1
0.70 0.76 0.80
T
a
(6)
2
0 0.10 0.30
T
a
(7)
The formulae (6) and (7) validate the formulae (3) and (4), and accurately value the impact
factors in the toy industry.
Figure.6 shows that design flaws are the crucial factor in toy recalls in the last two decades
which caused severe injuries to child end-users. Toy companies must learn lesson and focus
their efforts on improving the design quality. The analysis reveals that design flaws resulted
in the overwhelmingly majority of toy recalls over the last two decades. Not only have
design problems been more numerous but they also seriously damaged consumers. An
overwhelming majority of the recalls could have been avoided with better design, and it is
important to focus our efforts on learning from the recalls that occurred in the past and
minimize their recurrence.
The second D-MC case is taken from the automobile industry. A survey from Mckinsey,
named
The Roadmap of Chinese Automobile Companies Going Global (Gao 2008), shows that the
quality problems in assembly accounts for about 10 percent of the quality problems of all
stages of automobile production. Most of quality problems originate in design. For example,
Collaboration in the Design-Manufacturing Chain: A Key to Improve Product Quality
211
one assembly company found that the excessive noise in brakes resulted from brake
material which had been selected during the design stage. Some quality problems stem from
process design or from design specifications. As a whole, out of the top 50 defects
mentioned by the assembly company, 85 per cent were introduced prior to the assembly
process (Figure.7).
According to Figure.1, about 80 per cent the quality problems of suppliers are derived from
problems with component design. So, out of the “Suppliers” section in Figure.4, 80 per cent
of quality problems of suppliers, i.e.36 per cent (80% multiplied by 45%) of final product
problems, are derived from design. Then, in total, 76 percent (40% plus 36%) of the
problems come from the whole vehicle design and the component design. This figure (76%)
exactly coincides with the percentage observed in the toy industry. Certainly, it is a mere
coincidence between these two different industries, but at least, these two cases indicate that
the impact factors in the Quality Relationship Model (QRM) are reasonable.
Fig. 7. Total Quality Control in Automobile Production
7. Conclusion
Compared with others phases of production, design has a crucial influence on final-product
quality; in other words, the quality of design is more important than that of other quality
issues on the supply chain. This study presents a formula showing a leverage relationship
among design quality, manufacturing quality and final product quality, which shows
clearly that improving the design process is the most effective path to improving final
product quality. Based on the QRM formula and the case studies of two different industries