Six Sigma Projects and Personal Experiences Part 9 pptx
Bạn đang xem bản rút gọn của tài liệu. Xem và tải ngay bản đầy đủ của tài liệu tại đây (888.34 KB, 15 trang )
Successful Projects from the Application of Six Sigma Methodology
111
Measure: The record sheet is a simple, graphical method for collection of the occurrences of
events. Each mark represents an occurrence and the operator can quickly tabulate the count
of the occurrences. Table 14 shows the record sheet for the defects of the binder.
Defect Count Subtotal
Feeder x x x x x x x x x x x x x x x 14
Maintenance x x 2
Vinyl Problem x 1
RF Problem x 1
Load and
unload problem
x x x x x x x x 8
Total 26
Table 13. Record Sheet for the location of problem appearance
The Pareto Chart helps focus the most important causes; Figure 20 shows the main flaws in
the area of folders and the damage, The most common defect is the damage in the BC
holder, that is the major contributor with 60% of the problems of the BC.
Fig. 20. Pareto Chart for the Type of Damage
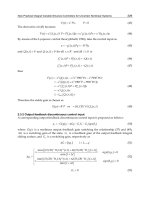
Analysis: To illustrate where the damage occurs see Figure 21, that shows an overview of
the “Hang”machine, as the station is loaded with subassemblies that will rivet the ring (the
operator decides what amount to place), station load and the movement of the conveyor.
Rotary Table 4 (R4) machine is similar to the rotaries 5 & 6, except that here the BC is sealed
to the bag. The R4 makes a good seal with the appropriate parameters, but it has the
disadvantage of producing an average 20 pieces of scrap per shift. This is where our
problem lies, because if the surplus is not cut or partially cut. This can damage other
subsequent subassemblies in the riveting process. A Cause and Effect diagram shows the
supposed relationship between a problem and their potential causes. Figure 22 shows the
possible causes of variation in the cutting of vinyl for BC, the machine where it is cut like a
giant guillotine, caused flash after the sealing operation around the vinyl bag.
Six Sigma Projects and Personal Experiences
112
Fig. 21. Hang Machine where the Loadingand Unloading problem Ocurrs
Methods
Materials
Measurment
Man
SOP's
Planning
Setups
Why?
Inspection Criteria
Trining
Visual Checks
Why?
Operator
Availability
Communication
Boards
Quality
Training
Vynil
Learning Curve
Binder
Process
Variation
Problem Statement
Mother Nature
Machines
Generator
Board Feeder
Hole Puncher
Temperature
Humidity
5 S
Why?
Pick & Place
Fig. 22. Cause and Effect Diagram for the Assembly Binder Process
Improvement: A possible solution was changing the design of the BC, shown in Figure 23.
This modification was to replace the vinyl bag with 4 cuts at 45 degrees (this design is used
in another model of folders). This option would reduce the cost by not using clear vinyl for
BC, by eliminating the cutting and sealing operations; by doing so, additionally, completely
eliminates the damage caused by the flash of BC.
Marketing rejected this proposed BC bag, arguing that the folder was submitted and that the
update of the catalogs on the Internet had been just published. Therefore it can be able to
modify it until next year. This option was rejected, and then team decided to build a die cut
(36 holes), with exact measurements of the size of BC bag in order to avoid the variation in
the BC gap (see Figure 24 and 25).
Successful Projects from the Application of Six Sigma Methodology
113
Fig. 23. BC Bags Actual and Proposed for Reducing the Scrap
Fig. 24. Press Machine that cuts the BC Bags
Fig. 25. New Die Design with Smaller Tolerance in the BC Bag Dimensions
Six Sigma Projects and Personal Experiences
114
Another improvement was to change the dishes where the BC is placed to be sealed with the
bag; a frame of Delrin was used with the exact size of BC, to serve as a protector.
Consequently, the BC does not move until it passes the sealing operation. The results of the
changes made were remarkable. BC cutting was accurate and there was not any flash (see
Figure 26).
Fig. 26. Product before and after the Improvement
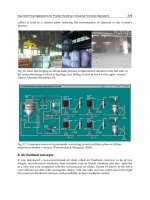
Control: The use of the fixture was supervised being mandatory its use, it was used to
comply with the exact dimensions and assure that the measure of the BC is correct (see
Figure 27). The reduction of defects was from 90 pieces to 3. These 3 defects occurred
because the vinyl was misaligned.
Fig. 27. Fixture to check the correct dimension of BC
Successful Projects from the Application of Six Sigma Methodology
115
6. Conclusions
The implementation of these projects has been considered to be a success, since in the
project of manufacture of circuits the based line of the project was 3.35 sigma level and the
gain 0.37 of sigma. Which represent the elimination of 1.88% of nonconforming units or
18,788 PPM´s. The second project speaker manufacturing, the initial Cpk was .35 and after
the project implementation the resulting Cpk is 2.69. The binder manufacturing process was
improved from 90 to 3 defects in a shift.
The key factors in these implementations were; team work, multidisciplinary of the team,
management commitment, team training and knowledge, communication and project
management (Antony & Banuelas, 2002; Byrne, 2003; Henderson & Evans, 2000). Also, the
maintenance preventive program was modified to achieve the goal stated at the beginning
of the project 2. It is important to mention that organizations management was very
supportive and encouraging with the project teams. The Six sigma implementation can be
helpful in reducing the nonconforming units or improving the organization quality and
personal development. The conclusion of these projects has helped establish the objective to
go forward with others Six Sigma implementations. This results show that DMAIC
methodology is a systematic tool that ensures the success out of a project. In addition to the
statistical tools that factual information is easier to understand and to show evidence about
the veracity of the results, because many of them are very familiar.
7. References
Antony, J. & Banuelas, R. (2002). Key Ingredients for the effective Implementation of six
Sigma Programs. Measuring Business Exellence. Vol. 6, No. 4, pp. 20-27, ISSN
1368-3047
Byrne, G. (2003). Ensuring Optimal Success with Six sigma Implementations. Journal of
Organizational Excellence. Vol. 22, No. 2, (Spring 20003), pp. 43-50, ISSN 1531-
6653
Henderson, K. M. & Evans, J. R. (2000). Successful Implementation of Six Sigma:
Benchmarking General Electric Company. Benchmarking: An International Journal.
Vol. 7, No. 4, pp. 260-281, ISSN 1463-5771
Pande, P. S.; Neuman, R. P & Canavagh, R. R. (2002). The Six Sigma Way Team Fieldbook, Mc
Graw Hill, ISBN 0-07-137314-4, New York, USA.
Pyzdek, T. (2003). The Six Sigma Handbook. Mc Graw Hill, ISBN 0-07-141015-5, New York,
USA.
Stephens, M. A. (1974). EDF Statistics for Goodness of Fit and Some Comparisons. Journal of
the American Statistical Association. Vol. 69, No. 347, (September), pp. 730–737, ISSN
0162-1459
Valles, A.; Noriega, S. & Sanchez, J. (2009). Application of Lean Sigma in a Manufacture
Process of Binders. International Journal of Industrial Engineering,
Special Issue-Anaheim Conference, (December 2009), pp. 412-419, ISSN 1072-
4761
Valles, A.; Noriega, S.; Sanchez, J.; Martinez, E. & Salinas, J. (2009). Six Sigma
Improvement Project for Automotive Speakers in an Assembly Process.
Six Sigma Projects and Personal Experiences
116
International Journal of Industrial Engineering, Vol.16, No.3, (December 2009), pp.
182-190, ISSN 1943-670X
Valles, A.; Sanchez, J.; Noriega, S. & Gomez, B. (2009). Implementation of Six Sigma in a
Manufacturing Process: A Case Study. International Journal of Industrial Engineering,
Vol.16, No.3, (December 2009), pp. 171-181, ISSN 1943-670X
6
Applying Six Sigma Concepts, Techniques and
Method for Service Management: Business and
IT Service Management (BSM & ITSM)
Rajesh Radhakrishnan
International Business Machines (IBM), Global Services
USA
1. Introduction
Six Sigma methods and techniques are applied in business & IT projects for product (Goods
and Services) & process design (Define, Measure, Analyze, Design and Verify or DMADV)
and improvements (Define, Measure, Analyze, Improve and Control or DMAIC). Six sigma
methodologies have been applied within the IT Service Management disciplines primarily
for Service and Process Improvement and Optimization.
Six Sigma methods and techniques have a relatively rich history with the manufacturing
industry and tangible products vis-à-vis intangible and perishable services. As the services
industries look forward to the advent of productization of services or service products, there
is an attempt to minimize variations in service quality via service design and service
improvement projects. The focus of these projects range from service definition to service
systems to service automation (i.e. making service less labour intensive). As such, six sigma
methods and techniques have a major role to play in both design and improvement of
services and service management processes.
Even though Six Sigma concepts & techniques can be applied for most if not all IT Service
management processes (see ITIL v3 for taxonomy of Service Management processes mapped
to the Service Life Cycle), they will primarily relate to Service Quality Management
processes such as:
Service Availability Management
Service Capacity Management
Service Performance Management
Service Continuity Management
Service Security Management
(Service) Event Management
(Service) Incident Management and
(Service) Problem Management
This paper discusses six sigma methods (both DMAIDV and DMAIC) and techniques as
they apply to the fives stages of Process Maturity (or Service Management Maturity)
Ad hoc
Defined
Measured
Six Sigma Projects and Personal Experiences
118
Matured &
Optimized
Note: Some of the techniques discussed here are generally used within the Six Sigma and
Quality Control and Management context and projects, but are also used in several non six
sigma projects and context.
Note: Design for Six Sigma (DFSS) has not only been applied to Service Management
processes but also for sub-processes such as Root Cause Analysis (RCA) as a sub-process
within problem management or Incident Reporting (IR) as a sub-process within incident
management.
IT Service Management Process Improvement relates to IT Service Management Maturity
and the Continuous Process Improvement or CPI program. Service Quality is a function of
(or depends on) People, Processes, Information and Technology and the maturity level of
Service Quality Management as an IT process domain. Service Quality Management
processes as IT processes play a critical role in understanding and achieving service quality
objectives and targets.
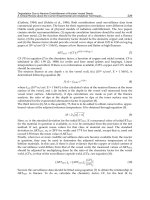
Service Management as a practice has five maturity levels and each service management
domain or IT process can be at different levels of maturity at a given time (see figure 1
below for the five different maturity levels and the corresponding process capabilities /
features). Process maturity (and higher ratings of process maturity level) is attained via
incremental process improvement projects. It is important to note that processes can only be
improved from one maturity level to another sequentially. It is extremely difficult to skip
maturity levels.
Fig. 1. IT Service Management (ITSM) Process Maturity Levels
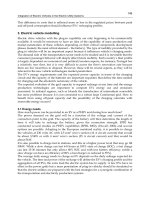
Six Sigma DMADV – Define (Process), Measure, Analyze, Design and Verify methodology
is relevant for moving from level 1 to level 2 i.e. essentially developing an enterprise wide
definition of an IT process and gathering requirements as part of the process design work.
Six Sigma DMAIC – Define (Process Improvement Problem), Measure, Analyze, Improve
and Control as a methodology is relevant for growing the process from maturity level 2 to
maturity level 3, 4 and 5.
Ad Hoc: Processes are not documented or measured (ineffective); processes are not repeatable; support requirements
are not defined; no support or improvement plan exists. Quality is dependant on who performs the activity. There is
either a lack of process quality or significant variation in process quality.
1
Aware (Defined): Processes are defined and documented. There is an effort to vet process documentation and
develop an enterprise wide consistent view of the Process. Process improvements have begun, although some
operational problems require action; customer requirements are understood.
2
Capable (Measured): Significant progress has been made so that the processes meet customer needs in an
effective manner; the process goals are aligned with business goals. Process metrics and measurement systems
are in place. Process requirements, performance and capabilities are traced, measured and reported.
3
Mature (Improved): Process data is analyzed and Process is managed. Processes are competitive and
adaptable to new technology & changing business requirements. Highly automated & efficient (i.e. technology
enabled). Process boundaries cross management domains (i.e. multiple working process interfaces).
4
Optimal (Controlled): Process management is focused on strategic direction of customers, optimization
of process and process interfaces across all management domains, and continuous process improvement
(CPI). Process control systems are in place to manage deviations and fine tune process capabilities.
5
Ad Hoc: Processes are not documented or measured (ineffective); processes are not repeatable; support requirements
are not defined; no support or improvement plan exists. Quality is dependant on who performs the activity. There is
either a lack of process quality or significant variation in process quality.
1
Aware (Defined): Processes are defined and documented. There is an effort to vet process documentation and
develop an enterprise wide consistent view of the Process. Process improvements have begun, although some
operational problems require action; customer requirements are understood.
2
Aware (Defined): Processes are defined and documented. There is an effort to vet process documentation and
develop an enterprise wide consistent view of the Process. Process improvements have begun, although some
operational problems require action; customer requirements are understood.
2
Capable (Measured): Significant progress has been made so that the processes meet customer needs in an
effective manner; the process goals are aligned with business goals. Process metrics and measurement systems
are in place. Process requirements, performance and capabilities are traced, measured and reported.
3
Mature (Improved): Process data is analyzed and Process is managed. Processes are competitive and
adaptable to new technology & changing business requirements. Highly automated & efficient (i.e. technology
enabled). Process boundaries cross management domains (i.e. multiple working process interfaces).
4
Optimal (Controlled): Process management is focused on strategic direction of customers, optimization
of process and process interfaces across all management domains, and continuous process improvement
(CPI). Process control systems are in place to manage deviations and fine tune process capabilities.
5
Applying Six Sigma Concepts, Techniques and Method
for Service Management: Business and IT Service Management (BSM & ITSM)
119
See figure 2 below.
Fig. 2. Six Sigma and IT Service Management (ITSM) Process Maturity Levels
2. Process maturity levels
Ad Hoc (Level 1 )
A process is at maturity level 1, when the enterprise does NOT have an enterprise wide
consistent view of the process i.e. the process is NOT defined via documentation and
published to spread process awareness within the extended enterprise. It is likely that
certain process activities are defined and implemented in certain silos in the enterprise such
as a business unit or a domain team (e.g. an enterprise network team).
Application of six sigma example: several lean six sigma concepts such as reducing or
eliminating process waste can be applied during this stage of process maturity.
Defined and Aware (Level 2)
Level 2 maturity implies the process has been well defined; the process definition
documents have been vetted among the process community and approved by key process
stakeholders as well as published enterprise wide. This implies that the enterprise has a
consistent view of the process and the different organizations are aware of the process,
current process capabilities (activities, interfaces, tools, organization, among others). Process
interfaces are also defined. There can be several qualitative process improvement projects
(type 1 process improvement projects – see section below for a discussion on Type 1 and
Type 2 projects) at this level of maturity as the process metrics (critical success factors, key
goal indicators, key performance indicators, among others) are understood and
documented. At this stage of process maturity, the process management team should be
focused on managing the process with Management by Objective (MBO) principle.
Application of six sigma example: development of smart process metrics that align with the
process principles, policies and guidelines. A process principle can map to multiple process
policies and a process policy can map to multiple process guidelines (detailed guidelines)
and rules. SMART metrics can directly map to guidelines. The principles to policies to
guidelines (rules) heirarchy can provide guidance to automate the process and certain
process activities.
Fishbone or Ishikawa diagrams can be used help define process and process scope. As an
example: Faulty components impacting service availability is a service availability
management process issue while a denial of service attack impacting service availability is a
security management process issue.
DMADV method directly related to process maturity level 2.
Capable and Measured (Level 3)
Six Sigma Projects and Personal Experiences
120
Level 3 maturity implies that the qualitative process improvement projects initiated and
completed at Level 2 have improved the process capabilities. The process management
team has the capability to implement all relevant process activities, process interfaces and
process related projects. More importantly, the process management is now focused on
managing the process with Management by Metrics (MbM) principles. This implies that
there is a robust and reliable measurement system in place to collect data on the SMART
(Specific, Measurable, Attainable, Relevant and Time bound) process metrics. At this stage,
the process management can initiate type 2 process improvement projects for those process
metrics which already have an appropriate measurement system. The six sigma DMAIC
method directly relates to process maturity levels 3, 4 and 5.
Application of six sigma example: development of a measurement system to gather data on
specific SMART process metrics that align with the process principles, policies and guidelines.
Improved and Mature (Level 4)
At this level of maturity, the process management team is actively engaged in analyzing the
process data and managing the process based on the results of the analysis. The process
should be performing relatively well on most relevant process Key Performance Indicators
(KPIs) based on the results of the improvement projects initiated at Level 2 and Level 3. The
process and process capabilities are competitive as several of them have been technology
enabled. Process is significantly technology enabled and as such is adaptable to changing
business needs and requirements. Process Interfaces are not only defined, but also
implemented and relatively mature. Process interfaces with other Business and IT Processes
and Services are implemented, mature and efficient. Most process improvement projects are
type 2 projects.
Note: Very few IT organizations reach maturity level 4 and 5.
Application of six sigma example: six sigma process improvement projects focused on a
specific quantifiable process improvement problem that improves the process along one or
more key process metric (SMART metric). Optimized and Controlled (Level 5)
Very few organizations in the world have reached this level of maturity for process
management. At this level of maturity, process management is focused on process
efficiency, optimization and control as well as the strategic direction of the customer
(business), and improving alignment with business, optimization of the process, process
activities and process interfaces via a set of Type 2 process improvement projects. The
process management team has also established a process control system to manage process
deviations (outliers, drift, among others) i.e. a process exception handling system and
sustain the process performance at the improved level.
Application of six sigma example: six sigma process improvement project focused on the
development of one or more control systems focused on specific Process related KPIs. ITSM
Process specific control systems are being developed by leading IT companies, as a case in
point, an intelligent scaling engine or ISE (patented by author) can use real time service and
resource data to make analytics based decisions to scale up or down specific services, service
components and infrastructure resources that enable the service. ISE is specifically
applicable to the performance and capacity management as an IT process.
3. Type 1 process improvement projects i.e. quantitative improvement
projects
These projects occur when the process has reached level 3 or higher levels of maturity (i.e.
Process measurement systems are in place with process metrics and data for those metrics)
Applying Six Sigma Concepts, Techniques and Method
for Service Management: Business and IT Service Management (BSM & ITSM)
121
and the improvement projects are focused on improving the process performance with
regard to specific process metric or process related metrics (SMART objectives – Specific,
Measurable, Attainable, Relevant and Time-Bound Objectives). Six Sigma as a process
improvement method which leverages the define (define a process improvement problem /
opportunity) , measure, analyze, improve and control or DMAIC method, is very relevant
for these types of process improvement projects.
The process and process related metrics can be metrics associated with the process inputs,
actual processing (process activities), process outputs as well as process outcomes. In
general, it is a good practice to focus Type 1 process improvement projects on metrics
associated with the process outcomes (which are, generally, of more interest to business &
process stakeholders). The process could focus on improving a measure of central tendency
(such as mean – example mean time to recover/restore service) or a measure of variation
(such as standard deviation – variation associated with the time to recover/restore service
by service incident).
An example would be a six sigma project to improve average and variation (standard
deviation) associated with the time to restore service via service recovery plans (which
focus on fast recovery and restore technologies and updated service and component
recovery plans and procedures for a set of services). The average time to restore service
after a service incident can be measured before and after the project was implemented to
study the impact of the six sigma project.
4. Type 2 process improvement projects i.e. qualitative improvement projects
These projects can occur at any level of process maturity and do NOT have quantitative
process or process related metrics associated with them.
An example would be a documentation project to define the process conceptually and
logically and bring about a consistent enterprise wide view of the process and process
objectives, scope, activities, among others. This would typically be done when a process is
at level 1 in a process maturity scale.
Another example would be designing and building measurement systems to collect data
around process metrics. This would typically be done when a process is at level 3 in a
process maturity scale and aims to achieve the next level of process maturity.
In a purely technical sense, type 1 process improvement projects are the true process
improvement projects and relate to the technical definition of improvement (shown below).
Definition of Improvement:
Improvements are Outcomes that when compared to the ‘before’ state, show a measurable
increase in a desirable metric or decrease in an undesirable metric
5. Salient characteristics of six sigma for service management
Some of the key characteristics of six sigma methods and tools that are relevant for Business
and IT service management and service quality management are discussed below:
Customer Centered (Customer or End User Centricity)
Several six sigma concepts such as Voice of the Customer (VOC) and Critical Customer
Requirements are relevant for the service quality or non functional requirements gathering
and documentation process.
Six Sigma Projects and Personal Experiences
122
Process Focused
Extraordinary Process for Ordinary People
ITIL v3 and other IT operating models focus on multiple IT process domains. Service
Quality Management itself is a set of processes in the service design phase of the service life
cycle but has implications for the entire service life cycle. Six sigma takes a process approach
to quality management & quality improvement (both product/service as well as process
quality) and as such can be applied to
1. IT enabled Business Service Quality & IT Service Quality as well as
2. Quality Management as a process domain in Business Service Management and IT
Service Management models.
Data Driven
Six sigma projects are data driven and depend on data and analysis of data for quality
improvements. Service and process quality data is generated from multiple tools, including
monitoring and management tools. IT organizations can and do maintain historical and
current service and process quality data which are relevant for applying six sigma projects.
Follows a structured method & roadmap
DMAIC and DMAIDV are two methods applied for
Product (such as Hardware) and Service (such as messaging) design
Product / Service Improvements
Process Design (such as Service Incident Management) and
Process Improvements
Oriented toward Business results.
The primary objectives of Business Service Management (BSM) and IT Service Management
(ITSM) focus on business outcomes and aligning business and IT, as such six sigma’s focus
on business results maps to service management focus on business objectives.
6. Six sigma tools for service management
In general the tools and techniques discussed here can be used for both process design and
process improvement projects, however, few of them are more applicable for process
definition and design while others are more applicable for process improvement and control
projects.
7. QFD and NFR Framework
Quality Function Deployment and the House of Quality are critical tools for identifying,
gathering, prioritizing, implementing and tracing service quality or non-functional
requirements (both IT service and IT process requirements). IT processes are generally
automated and implemented with a set of ITSM tools and technologies – hence QFD and
HOQ can be applied to these tooling requirements also.
In my Non Functional (or Service Quality) Requirements (NFR) framework paper (The
Open Group White Papers 2009 – see references), I discuss how service quality objectives
such as service availability, or service continuity or service usability objectives can be
documented as funded requirements (business, customer and end user centric), which then
can be translated to design specifications and configuration parameters for service run time
environment. I have also argued that we can develop enterprise specific and enterprise
Applying Six Sigma Concepts, Techniques and Method
for Service Management: Business and IT Service Management (BSM & ITSM)
123
level service quality models, that document these objectives, requirements, specifications,
parameters and metrics (measurable) to allow for reuse (do not have to reinvent the wheel
with every service and every business unit) and traceability of service quality requirements.
8. DPMO for ITSM processes and services
Defects Per Million Opportunities (DPMO) is a relatively simple concept and is applied
using a simple approach for the manufacturing industry engaged in producing tangible
products. However, DPMO can be applied in the service industries engaged in producing
intangible, inseparable (production & consumption), perishable and more variable services
using a different approach.
Specifically for the IT services and IT enabled business services, we can take two
simultaneous approaches toward DPMO, i.e. a) DPMO associated with the service systems
or systems that enable the service and b) DPMO associated with the customer experience or
parts of the customer experience. Here we elaborate DPMO associated with the customer
experience.
DPMO can be applied to each instance of customer interaction (example: Browsing an
ecommerce site dedicated for the travel industry – hotels, rental cars, flights among others)
i.e. treating each interaction as an opportunity.
DPMO can be applied to each instance of customer transaction (example: request and
purchase of an online e-ticket) i.e. treating each customer transaction (or request for a
transaction) as an opportunity.
DPMO can be applied to each instance of customer consumption (service provider
production) – (example: The acts of checking in & choosing seat, boarding, taking an airline
seat, experiencing air travel and off-boarding an airplane) i.e. treating each act of
consumption as an opportunity.
DPMO can be applied to each instance of the customer experience (example: all of the three
above, plus post sales service etc) i.e. treating the individual customer experience as an
opportunity.
There fore, TCI, TCT, TCC and TCE (Total Customer Interaction, Transactions,
Consumption and Experience can all be related to total opportunities (TO) and are relevant
for determining defects per million opportunities.
The CRM, CIM and CEM (Customer Relationship Management, Customer Interaction
Management and Customer Experience Management) software suites as well as Interactive
Intelligence (Customer Interactive Intelligence) software and tools help service providers
collect data to support objectives and metrics around defects per million opportunities
(DPMO). In other words, these tools provide data for these measurements related to service
DPMOs. This is true for IT enabled business services and IT services as well as IT enabled
business processes and IT processes.
9. Critical to Quality (CTQ) and Vital Business Functions (VBFs)
CTQ tree maps Customer Key Goal Indicators or Broad Customer / End User related
Objectives to more specific customer related performance indicators or KPIs using such
approaches as VOC or Voice of the Customer. When CTQ is applied in the context of IT
enabled Business Services we get vital business functions (within a Business Service), which
is an ITSM term. Therefore CTQ provides a means to arrive at VBFs.
Six Sigma Projects and Personal Experiences
124
Note: Key Goal Indicators (KGIs) and Key Performance Indicators (KPIs) are commonly
used by CIO Offices and IT management and are also part of such IT frameworks as
COBIT (Control Objectives for Information and related Technologies) and ITIL (IT
Information Library). However, CTQs focus on broad customer objectives (KGI) and
translating the same to more specific customer requirements (and metrics or KPIs
associated with them).
10. Objectives (KGI) and SMART metrics (KPI)
Process KGI or Process Objectives are critical for Management by Objectives or MBO
particularly at process maturity levels of 1 and 2. As the process measurement system is
designed and implemented at the maturity level 3, MBM or Management by Metrics can
be initiated to reach maturity level 4 and above. SMART (Specific, Measurable,
Achievable, Relevant and Time Bound) Process Metrics and Process Analytics play a key
role for MBM.
11. Process analytics
Both statistical and non-statistical analytical techniques propagated via the six sigma
methods, particularly during the analyze phase of six sigma project have great relevance
for service management process analytics. As an example: Event Tree Analysis, Fault
Tree Analysis and Decision Tree Analysis, a set of related non-statistical analytical
techniques (used in six sigma projects) have direct relevance for event, incident and
problem management (three operational processes in service management) and indirect
relevance for availability, continuity, performance & capacity, and security management
(four design processes in service management). Most, if not all, analytical techniques
covered by the six sigma methods are either directly relevant or indirectly relevant for one
or more of service management processes.
12. Fishbone or ishikawa analysis
Fishbone diagrams can be useful to identify and analyze potential causes for Service Quality
issues. In this case we are using fishbone diagrams to better understand service availability
issues. Fishbone analysis and diagrams can be useful tools to identify and analyze potential
causes for Service Unavailability. Overall service availability and service unavailability are
a function of multiple capabilities (see Fishbone One):
Technology Capabilities (see Fishbone Two)
Process Capabilities (see Fishbone Three)
Organizational Capabilities and
Information Capabilities
The fishbone diagrams are generic diagrams and can be used to for multiple purposes
including conceptualizing service availability models. The diagrams below depict the Y is
Fn of x (x1, x2, x3 ….) model. You can further decompose these models by making each of
the x (or independent variable) a Y or dependent variable. These models can and need to be
customized for each service. The x or independent variables impact overall service
availability can also change with time. Fishbone diagrams can also be used as input for
problem management.
Applying Six Sigma Concepts, Techniques and Method
for Service Management: Business and IT Service Management (BSM & ITSM)
125
Fishbone Diagrams for Understanding Service Availability:
Fig. 3. Fishbone One for Overall Service Availability
Fig. 4. Fishbone Two for Technology Factors