New South Wales Auditor-General’s Report Financial Audit Volume Seven 2011 Focusing on Law, Order and Emergency Services_part2 doc
Bạn đang xem bản rút gọn của tài liệu. Xem và tải ngay bản đầy đủ của tài liệu tại đây (167.04 KB, 10 trang )
9
NSW Auditor-General's Report
Volume Seven 2011
EMERGENCY SERVICES
OVERVIEW
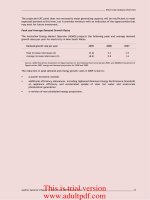
The total contribution amount is determined by the Minister for Police and Emergency
Services and is subject to the Treasurer’s agreement. Total contributions are based on the
agencies’ estimated expenditure. A summary of contributions over the last five years appears
in the graph below:
Source: New South Wales Fire Brigades, NSW Rural Fire Service and State Emergency Service.
Funding excludes costs incurred by the agencies relating to natural disasters. These costs are
reimbursed through relief arrangements between the State and the Australian Government.
In total, the emergency services agencies incurred costs of $45.7 million in 2010–11
($107 million in 2009–10) on natural disasters. The $61.3 million reduction was primarily a
result of a quieter fire season.
Natural Disasters
The following natural disasters were declared:
Year ended 30 June
No. of Declarations
No. of Local Government Areas (LGA)
affected
2011
2010
2011
2010
Bushfires
24
57
Flood and storm
2
45
Floods
5
13
83
55
Storms
1
5
9
9
Dust storm
1
1
Total
8
43
137
122
Source: Ministry of Police and Emergency Services (unaudited). Note if a LGA was declared twice during the year, the LGA was only reported
once in the table above.
-
100
200
300
400
500
600
700
2007
2008
2009
2010
2011
$m
Year ended 30 June
Total Funding of Emergency Services
FRNSW
RFS
SES
The $61.3 million
reduction in costs
was primarily a
result of a quieter
fire season
This is trial version
www.adultpdf.com
10
NSW Auditor-General's Report
Volume Seven 2011
EMERGENCY SERVICES
OVERVIEW
There were fewer individual flood events in 2010-11, but the impact of these affected more
Local Government Areas (LGA). On two occasions ‘Flood and Storm’ disasters were
declared, affecting 45 LGAs in NSW. Conversely, the 2010–11 bush fire season was one of
the most dormant in many years with no bush fire emergency declarations made under the
Rural Fires Act 1997.
Natural disasters are declared when damage to public assets and associated disaster
recovery costs exceed $240,000. The declaration of a localised ‘State of Emergency’,
amongst other things, allows the emergency services agencies to recover costs incurred on
the natural disaster from the Crown Entity. These costs are then recovered from the
Australian Government.
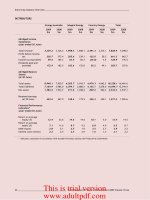
International and Interstate Disaster Deployment
The 2010–11 year saw a range of devastating large scale natural disasters both nationally
and internationally, that required deployment of all three emergency services’ staff and
apparatus. Taskforces were deployed to the disaster ravaged areas shown in the graph below
to provide relief, medical support, body recovery, hazmat, aerial and ground support and to
carry out swift water and other rescues.
The following table summarises the deployment and relief costs incurred:
0.0
0.2
0.4
0.6
0.8
1.0
1.2
1.4
Christchurch
earthquake
Japanese tsunami
Locust assistance
QLD flood and
cyclone Yasi
Victorian floods
$m
Disaster/Event - year ended 30 June 2011
Deployment Costs
FRNSW
RFS
SES
The 2010–11
bush fire season
was one of the
most dormant in
many years
This is trial version
www.adultpdf.com
11
NSW Auditor-General's Report
Volume Seven 2011
EMERGENCY SERVICES
OVERVIEW
Staffing and Volunteering Arrangements (Repeat Issue)
Recommendation
I again recommend emergency services agencies continue to develop and implement
comprehensive volunteer workforce management plans to ensure they have the right
volunteer resources.
The agencies use a range of human resources to achieve their objectives.
Year ended 30 June
Full-time
Retained (part-time)
Volunteers
2011
2010
2011
2010
2011
2010
FRNSW
3,930
3,927
3,382
3,429
7,140
6,070
RFS
884
785
70,448
70,552
SES
251
204
10,828
10,000
Source: Fire and Rescue NSW, NSW Rural Fire Service and State Emergency Service (unaudited).
Volunteers are a key resource, but emergency services agencies do not currently have
detailed volunteer workforce plans in place. Without effective plans to manage their volunteer
bases, the agencies risk not having the appropriate resources to achieve their objectives.
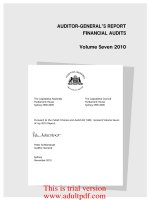
The graph below shows volunteer hours in 2009–10 and 2010–11:
Overall volunteer hours decreased by 41 per cent since 2009–10, primarily due to the decline
in natural disaster events declared in 2010–11. The services face challenges recruiting and
maintaining volunteers because of the ageing population, changes in work patterns with
increased shift work and people moving to larger centres, all of which deter people from
volunteering.
The SES experienced a 35 per cent increase in volunteer hours since 2009–10 as a result of
the increase in major flood and storm events in 2010–11, which saw 540 flood rescue
responses taking over 3,526 volunteer hours to complete.
-
100,000
200,000
300,000
400,000
500,000
600,000
700,000
800,000
Storm
Community
activities
Other
incidents
Flood and
flood
rescue
Land
search
Bushfire
support
Road crash
rescue
Other
rescue
events
Hours
Volunteer Hours
2011 - Total 801,143 hrs
2010 - Total 1,356,870 hrs
This is trial version
www.adultpdf.com
12
NSW Auditor-General's Report
Volume Seven 2011
EMERGENCY SERVICES
OVERVIEW
Other Emergency Services Entities
A range of other entities are involved in ensuring coordinated and effective emergency
services in New South Wales. High level information on these entities appears below. For
further information, refer to www.emergency.nsw.gov.au.
Ministry for Police and Emergency Services
The Ministry brings together the functions of the former Security and Recovery Coordination
Branch and Law Enforcement Policy Branch of the Department of Premier and Cabinet, the
Disaster Welfare section, the Department of Human Services and Emergency Management
NSW.
The Ministry’s role is wide ranging, spanning policy development, ministerial support,
operational coordination, crisis management, grants administration, delivery of training and
control of several websites and public communications platforms.
Throughout 2010–11, the Ministry was responsible for the centralised billing and collection of
funding contributions on behalf of the FRNSW, RFS and SES.
State Emergency Management Committee
The State Emergency Management Committee was established under the State Emergency
and Rescue Management Act 1989 to ensure that New South Wales has a system to cope
with the range of emergencies which are experienced in New South Wales. Its functions
include:
continually reviewing the effectiveness of the State Disaster Plan and related plans
advising the minister on changes to these plans
creating and distributing educational material on managing emergencies planning for the
emergency management aspects of terrorist threats and critical infrastructure.
State Rescue Board
The State Emergency and Rescue Management Act 1989 provides for the establishment of
the State Rescue Board of New South Wales with a structure and system for management of
rescue at State, district and local levels.
The principal function of the Board is to ensure the maintenance of efficient and effective
rescue services throughout New South Wales.
Bush Fire Co-ordinating Committee
The Committee provides a forum through which a broad cross-section of government and
non-government organisations with an interest in the prevention, mitigation and suppression
of bushfires can come together to develop and progress policies and procedures aimed at
ensuring a coordinated, agreed approach to major issues.
The Committee has key responsibilities under the Rural Fires Act 1997, which encompass the
following responsibilities:
planning for bush fire prevention and coordinated bush fire fighting, and
advising the Commissioner on bush fire prevention, mitigation and coordinated bush fire
suppression.
This is trial version
www.adultpdf.com
13
NSW Auditor-General's Report
Volume Seven 2011
LAW AND ORDER OVERVIEW
Law and Order Services
The following government agencies provide, facilitate and regulate the State’s law and order
services. The operations of these agencies are closely interrelated and initiatives in one
agency can have significant flow on effects for the other agencies. For example, increased
policing and investigative activities increase case loads in the court system, which in turn
increase the number of offenders managed by the corrective system.
Agencies
Department of Attorney General and Justice (including Corrective Services NSW and
Juvenile Justice NSW divisions)
New South Wales Crime Commission
Independent Commission Against Corruption
Judicial Commission of New South Wales
Legal Aid Commission of New South Wales
NSW Police Force
Office of the Director of Public Prosecutions
Police Integrity Commission.
From 1 April 2011, the functions of the former Juvenile Justice division (now called Juvenile
Justice NSW) and the Guardianship Tribunal were transferred to the Department of Attorney
General and Justice from the Department of Human Services, under the Public Sector
Employment and Management (Departments) Order 184/2011. On 31 December 2011, the
functions of Privacy NSW were transferred from the Department of Attorney General and
Justice to the Information and Privacy Commission.
Audit Opinions
The audits of the above agencies’ financial reports for the year ended 30 June 2011 resulted
in unmodified audit opinions within the Independent Auditor’s Reports.
Performance Information
NSW Police Force
Allocation of Police Officers
There is a shortfall between the actual full-time equivalent number of police officers and
authorised positions in all regions.
Total all regions
30 June
Authorised
FTE
Actual
FTE
Difference between
Authorised and
Actual
FTE
Total on Restricted
Duties or Absent
FTE
2011
12,378
12,181
(197)
1,680
2010
12,337
11,848
(489)
1,833
Source: NSW Police Force (unaudited)
* Includes police officers attached to Regions and Local Area Command and excludes officers who are part of
Specialist Operations and Other Non Region Commands.
FTE Full-time equivalent.
Of the 12,181 FTE officers, 1,680 (1,833) were on restricted duties or absent, which means
the shortfall is greater.
Further details are in my comment on the NSW Police Force within this volume.
Law and Order Overview
This is trial version
www.adultpdf.com
14
NSW Auditor-General's Report
Volume Seven 2011
LAW AND ORDER OVERVIEW
Death and Disability Scheme
The death and disability liability has grown significantly by $169 million or 147 per cent since
2007–08 and by 49 per cent in 2010-11. The partial and permanent incapacity (PPI) claims
paid, a component of the death and disability scheme, has increased by 47 per cent to 415
claims in 2010-11.
Year ended 30 June
2011
2010
2009
2008
Death and disability liability ($’000)
284,000
190,200
147,300
115,000
Total partial and permanent incapacity claim payments
($’000)
165,010
118,992
47,053
40,930
Number of partial and permanent incapacity claims paid
415
282
116
108
Average claim size ($)
458,000
421,958
405,626
378,986
Source: Liability figures obtained from actuarial reports (audited). Remaining information obtained from NSW Police Force (unaudited).
The increase in the number of claims is undesirable, not only from a financial perspective, but
also from the impacts on the NSW Police Force more generally.
On 3 November 2011, the Minister for Police announced that the current death and disability
scheme will be replaced with a new commercial insurance arrangement.
In 2008, I conducted a performance audit on managing injured police. The Force advises it
has implemented most of my recommendations. A full copy of this report can be found at:
www.audit.nsw.gov.au/publications/reports/performance/performance_reports.htm.
Rates of Crime
Data in the following sections on rates of crime, crime investigations and crime rejection came
from the Australian Bureau of Statistics. The bureau acknowledges that not all crimes are
reported to or recorded by the police in the various jurisdictions and this impacts comparability
of recorded crime levels between states. For example, New South Wales may record some
incidents as crimes that other jurisdictions may not.
Death and
disability liabilities
increased by
49 per cent in
2010-11
Actions taken to
address the
unfavourable
trend in claims
have had no
impact to date
This is trial version
www.adultpdf.com
15
NSW Auditor-General's Report
Volume Seven 2011
LAW AND ORDER OVERVIEW
The table below compares trends in crime rates against people in New South Wales to
national totals.
Year ended 31 December
Trend
%* inc/(dec)
since 2006
2010
2009
2008
2007
2006
Crime Numbers
NSW
Murder
(27.5)
74
86
78
94
102
Attempted murder
(40.8)
42
50
65
60
71
Manslaughter
120.0
11
9
9
9
5
Assault
(10.6)
73,969
75,928
79,847
84,850
82,771
Sexual assault
(3.5)
6,436
7,210
7,140
6,787
6,667
Kidnapping/abduction***
(27.1)
329
384
539
449
451
Robbery
(29.9)
6,567
6,768
8,089
9,346
9,242
Unlawful entry with intent
(21.6)
68,652
70,693
80,433
84,761
87,539
Motor vehicle theft
(30.6)
19,409
22,400
25,654
26,481
27,959
Other theft
(15.0)
133,682
144,931
144,458
151,374
157,360
National
Murder
(18.5)
229
263
260
253
281
Attempted murder
(19.3)
197
237
231
245
244
Manslaughter
(22.5)
31
30
30
29
40
Assault**
Sexual assault
(9.2)
17,757
18,807
19,992
19,954
19,555
Kidnapping/abduction***
(17.5)
599
564
782
730
726
Robbery
(16.1)
14,582
15,238
16,508
17,988
17,375
Unlawful entry with intent
(17.0)
216,886
222,664
241,690
248,423
262,005
Motor vehicle theft
(27.0)
54,736
59,649
68,270
70,650
75,377
Other theft
(11.0)
461,169
478,807
496,697
492,222
518,734
Source: Australian Bureau of Statistics (unaudited).
* Percentage change between 2005–06 and 2009–10.
** Data on assaults not available for national.
*** Kidnapping/abduction statistics for New South Wales include ‘deprivation of liberty’ offences, which are not
included for other jurisdictions. Management also advises that New South Wales encourages the reporting of all
incidents, even if no investigation takes place. This information is used for intelligence purposes.
Key: Trending up, Trending down, ~ No trend.
The New South Wales trend in all categories except manslaughter is consistent with the
national trends. The downward percentage trend for New South Wales, except manslaughter
and sexual assault, is better than the national figures.
This is trial version
www.adultpdf.com
16
NSW Auditor-General's Report
Volume Seven 2011
LAW AND ORDER OVERVIEW
Crime Investigations
Police effectiveness in this area is measured by the proportion of investigations finalised
within 30 days of the offence becoming known. Analysis of the Force’s performance in this
area is illustrated in the following table.
Crime
% of investigations
finalised in 30 days
% of investigations
finalised in 30 days involving
proceedings against offenders
NSW
National
Average
NSW
Ranking*
NSW
Ranking*
NSW
National
Average
NSW
Ranking*
NSW
Ranking*
Year ended 30 June
2010
2010
2010
2009
2010
2010
2010
2009
Homicide
68.3
76.3
4/6
6/6
100.0
98.5
1/6
**
Robbery
24.2
37.2
7/8
7/8
80.8
84.2
6/8
5/8
Unlawful entry with
intent
7.4
12.3
7/8
7/8
60.5
83.8
8/8
7/8
Motor vehicle theft
7.6
15.7
7/8
7/8
58.0
77.9
8/8
8/8
Other theft
14.3
18.1
7/8
7/8
69.2
78.9
7/8
7/8
Source: Australian Bureau of Statistics (unaudited).
* Information not available for all States/Territories for all categories. The rankings range from one to eight (highest
to lowest).
** In 2009, information not available for publication in relation to homicide cases where there were proceedings
against offenders.
Overall clearance rates in New South Wales remain well below national averages. The Force
advises the rankings are impacted by New South Wales being more likely to record incidents,
even when there is no evidence available for investigation. It advises a project undertaken in
cooperation with the Bureau of Statistics concluded a lack of recording standards was the
primary cause for differences in apparent crime rates.
The Force also advises this benchmark does not factor delays experienced in sourcing
forensic examination results, which are generally not known until well after the 30 day
benchmark.
Crime Rejection
The Force records the status of incidents as either accepted or rejected. An incident may only
be rejected when there is evidence it did not occur. The Force advises its local area
commands actively monitor rejection rates for most categories of crime. The Force’s
Performance Improvement and Planning Division continually perform quarterly reviews where
rejection rates exceed five per cent across the local area commands.
The table below shows the crime categories where rejection rates are equal to or greater than
five per cent.
Year ended 30 June
2011
2010
Crime Categories
Crimes
Rejected
Total Crimes
Reported
Percentage
Rejected
(%)
Crimes
Rejected
Total Crimes
Reported
Percentage
Rejected
(%)
Robbery
375
5,490
6.8
398
6,197
6.4
Sexual assault
314
4,714
6.7
255
4,739
5.4
Steal from dwelling
452
8,961
5.0
569
9,381
6.1
Stolen vehicle
1,087
21,870
5.0
1,026
23,901
4.3
Source: NSW Police Force (unaudited).
This is trial version
www.adultpdf.com
17
NSW Auditor-General's Report
Volume Seven 2011
LAW AND ORDER OVERVIEW
Court Processes
Court Clearance Rates
Clearance rates for the NSW Supreme Court’s civil jurisdiction have improved, with a
clearance rate of 122 per cent (105 per cent), which is the highest of all States and Territories.
Similarly, the NSW District Criminal and Civil courts have cleared some of their backlog.
The backlog of cases is deteriorating for both civil and criminal matters in NSW local courts.
The NSW local court clearance rate is the lowest for civil matters compared to all other States
and Territories and one of the lowest for criminal matters.
A clearance rate above 100 per cent indicates a court is clearing its backlog of cases,
whereas a percentage below 100 per cent indicates the backlog is increasing.
Year ended 30 June
2010 Clearance Rate
NSW
%
Vic
%
Qld
%
WA
SA
%
Tas
%
ACT
%
NT
%
Criminal
Local/Magistrates courts
97
110
102
104
112
96
103
97
District/County courts
101
93
98
109
101
na
na
na
Supreme/Federal courts
93
99
94
95
107
96
82
94
Civil
Local/Magistrates courts
89
101
113
104
107
103
109
93
District/County courts
101
91
94
113
94
na
na
na
Supreme/Federal courts
122
113
95
97
107
118
116
108
Source: Productivity Commission’s Report on Government Services 2011 (unaudited).
na not applicable as there are no district/county courts in these areas.
Case Completion Times
The backlog measures a court’s pending case load against agreed time standards. An
indicator of a backlog is the percentage of cases pending for more than twelve months.
The civil non-appeal backlog in the Supreme Court of New South Wales increased from
25 per cent to 29 per cent during the year. The case mix in New South Wales for criminal
matters includes a greater proportion of complex and time consuming murder and
manslaughter cases than other States.
The backlog of criminal matters for local and district courts have been significantly lower than
most other States and Territories for the past few years.
This is trial version
www.adultpdf.com
18
NSW Auditor-General's Report
Volume Seven 2011
LAW AND ORDER OVERVIEW
The table below shows the percentage of non-appeal pending cases older than 12 months.
Year ended 30 June
2010 Backlog
NSW
%
Vic
%
Qld
%
WA
%
SA
%
Tas
%
ACT
%
NT
%
Criminal
Local/Magistrates courts
2
8
14
8
12
15
7
30
District/County courts
6
26
16
6
24
na
na
na
Supreme/Federal courts
16
31
17
6
14
12
38
8
Civil
Local/Magistrates courts
N/A
14
8
6
9
11
16
8
District/County courts
17
25
20
25
45
na
na
na
Supreme/Federal courts
29
27
24
28
31
38
51
49
Source: Productivity Commission’s Report on Government Services 2011(unaudited).
N/A not available.
na not applicable.
Average Cost per Case Finalised
The average net administration costs per matter for all courts in New South Wales were below
the national average. The average net cost for District and Supreme Courts has increased,
but by a lesser amount than the national average.
The table below shows the average net cost per finalisation (civil and criminal) in 2009-10
(latest available data).
Year ended 30 June
Court Costs per Finalisation
(average net cost per case finalised)
2010*
2009**
NSW
$
National
Average
$
NSW
$
National
Average
$
Local
366
484
368
338
District
4,253
5,444
4,034
4,981
Supreme
4,163
7,255
3,290
5,515
* Source: Department of Attorney General and Justice Annual Report 2011 (unaudited).
** Source: Productivity Commission’s Report on Government Services 2010 (unaudited).
Adult Custody
Imprisonment Rates
Year ended 30 June
2010
2009
2008
NSW
National
NSW
National
NSW
National
Rate per 100,000 adult population
Imprisonment
186
169
185
166
180
163
Rate for Indigenous per 100,000 adult indigenous population
Imprisonment
2,455
2,325
2,391
2,212
2,351
2,157
Source: Productivity Commission’s Report on Government Services 2011 (unaudited).
The table shows that in 2010 the proportion of the general adult population that were
imprisoned remained relatively stable, while the proportion of the indigenous adult population
that were imprisoned increased by 2.7 per cent.
This is trial version
www.adultpdf.com