New South Wales Auditor-General’s Report Financial Audit Volume Seven 2011 Focusing on Law, Order and Emergency Services_part3 pptx
Bạn đang xem bản rút gọn của tài liệu. Xem và tải ngay bản đầy đủ của tài liệu tại đây (209.17 KB, 10 trang )
19
NSW Auditor-General's Report
Volume Seven 2011
LAW AND ORDER OVERVIEW
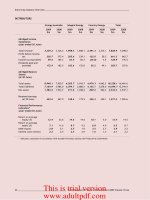
Of the total prison population at 30 June 2010, 20.9 per cent of male and 26.3 per cent of
female offenders were indigenous.
Rate of Return to Prison or Community Correction
The table below shows the percentage of prisoners returning to prison and corrective services
within two years of release. The State’s rate of return continues to be higher than that of most
other Australian jurisdictions.
Year ended 30 June
2010
2009
2008
NSW
%
National
%
NSW
%
National
%
NSW
%
National
%
Per cent of individuals returning to:
Prison
42
38
43
39
43
38
Corrective services*#
45
44
45
45
45
44
Source: Productivity Commission’s Report on Government Services 2011 (unaudited).
* Includes prison sentence or a community based order.
# Australian Capital Territory not provided.
Rate of return is a broader justice-wide outcome and is not only related to the activities of
Corrective Services NSW, but also to police, court and community activities. Rate of return is
counted as an individual’s return to prison or community corrections following conviction by a
court within two years of release from corrective services. It is a partial measure of the
performance of the justice system in improving public safety by reducing the incidence of
crime. The risk factors for returning to corrective services include criminal history, antisocial
behaviour, family factors and social achievement.
Prisoner Costs
Year ended 30 June
2010
2009
2008
Cost per Prisoner per Day
NSW
$
National
$
NSW
$
National
$
NSW
$
National
$
All prisons
198
207
206
210
211
207
Source: Productivity Commission’s Report on Government Services 2011, 2010 and 2009 (unaudited).
The figures include ongoing expenditure in the delivery of correctives services such as salaries and other operating
expenses. The costs are adjusted to eliminate jurisdictional differences.
* Information not available for the Northern Territory.
The cost per prisoner per day for all prisons reduced to $198 in 2010. Corrective Services
NSW advised this was because employee related costs have decreased and some custody
resources moved to community programs.
Offenders in Custody Compared to Capacity of Correctional Centres
At 30 June
Offenders in
custody
Capacity
Offenders in
custody
Capacity
2011*
2011*
2010**
2010**
Total correctional centres
9,916
11,269
10,258
11,011
Source: Corrective Services NSW (unaudited).
* at midnight 26 June 2011.
** at midnight 27 June 2010.
This is trial version
www.adultpdf.com
20
NSW Auditor-General's Report
Volume Seven 2011
LAW AND ORDER OVERVIEW
The occupancy rate at the end of June 2011 was 88.0 per cent (93.2 per cent).
Corrective Services NSW advise that the decrease is mainly due to a new Intensive
Correction Order (ICO) which started in October 2010. An ICO is an order of imprisonment for
not more than two years made by a court, which directs that the sentence is to be served by
way of intensive correction in the community. An ICO is served in the community under the
strict supervision of Corrective Services NSW rather than in full-time custody in a correctional
centre.
In response to the overcapacity, Corrective Services NSW closed the Parramatta, Kirkconnell
and Berrima Correctional Centres during October 2011. The inmates have been relocated,
and staff offered voluntary redundancy or redeployment.
Juvenile Justice
Juvenile Justice deals with young offenders who have committed, or alleged to have
committed, offences and are between the ages 10 and 18.
Statistics on the number of young people remanded in custody or sentenced to a control
order, youth justice conferences facilitated and community based orders supervised by
Juvenile Justice are shown in the table below.
Year ended 30 June
2011**
2010
2009*
2008*
2007*
Total number of youth justice
conferences facilitated
1,637
1,698
1,449
1,160
1,118
Total number of community based
supervision orders commenced
4,458
4,521
4,615
3,889
3,101
Total number of remand admissions in
custody
4,768
4,439
4,000
4,527
3,785
Total number of control admissions in
custody
575
634
712
667
601
Percentage of young people in contact
with Juvenile Justice throughout the
year who are indigenous:
Attending a youth justice
conference (%)
24
21.6
22.3
26.0
27.2
Remanded in custody (%)
38.5
38.8
36.4
39.6
37.9
Under community based
supervision (%)
41.5
40.1
38.6
39.9
41.9
On control orders (%)
51.7
49.8
49.9
51.6
56.3
Source: Department of Attorney General and Justice (unaudited).
* Responsibility of the former Department of Juvenile Justice.
** Responsibility of the Department of Family and Community Services up to 31 March 2011, and the Department
of Attorney General and Justice thereafter.
Young Indigenous people continue to be over-represented in the Juvenile Justice system.
Last year I reported that Juvenile Justice has specific programs in place to assist young
Indigenous people including an Aboriginal Strategic Plan to address the over-representation
issue. Despite these initiatives, the percentage of indigenous people under community based
supervision and on control orders increased when compared to 2009–10. Juvenile Justice
advised that it is too soon to see the impact of these initiatives.
The rise in the percentage of Indigenous people attending a youth justice conference
indicates a positive move to increase diversion of young people from the criminal system.
This is trial version
www.adultpdf.com
21
NSW Auditor-General's Report
Volume Seven 2011
LAW AND ORDER OVERVIEW
Costs
The table below shows the average daily cost for supervising and caring for young offenders
over the past four years.
Year ended 30 June
2011
$
2010
$
2009
$
2008
$
Average daily cost per juvenile in custody
652
589
543
541
Source: Department of Attorney General and Justice (unaudited).
Juvenile Justice advised that the average daily cost per juvenile in custody increased by
10.7 per cent due to the increase in funding from opening two new units at the Acmena and
Reiby Centres, coupled with a reduction in the average number of juveniles in custody over
the year.
Capacity in Juvenile Justice Centres
At 30 June
Offenders in
custody
2011
Capacity
2011
Offenders in
custody
2010
Capacity
2010
Juvenile Justice Centres Total
391
501
428
476
Source: Department of Attorney General and Justice (unaudited).
Whilst total capacity increased by 5.3 per cent, the total number of young offenders in custody
decreased by 8.6 per cent.
Victims Compensation
The Department had 21,646 pending claims for victims’ compensation at 30 June 2011
(18,118 in 2010), which it estimates will result in payments of $239 million ($222 million), or an
average payment per claim of $11,041 ($12,300). Based on the number of claims determined
during 2010-11, this backlog represents more than four years of claims and has more than
tripled since 2006.
Source: The Department of Justice and Attorney General (unaudited).
Victims Compensation Tribunal NSW – Chairpersons Report 2009–10 (unaudited).
In the last two years, I have recommended the Department pursue further initiatives to
address the backlog of victims compensation claims.
Further details on the victims compensation claims are in my comment on the Department of
Attorney General and Justice within this volume.
-
5,000
10,000
15,000
20,000
25,000
2006
2007
2008
2009
2010
2011
Number of Claims
Backlog in Victims Compensation Claims
Backlog at 30 June
Backlog of victims
compensation
claims have
tripled since 2006
to 21,464 claims
This is trial version
www.adultpdf.com
22
NSW Auditor-General's Report
Volume Seven 2011
LAW AND ORDER OVERVIEW
State Plan
The New South Wales Government released its plan –‘NSW 2021: A plan to make NSW
NUMBER ONE’ in September, 2011. It defines future strategies and priorities that law and
order organisations will need to address. These include:
prevent and reduce the level of crime
key target areas are:
reduce domestic violence
reduce alcohol related assaults
reduce other personal crime by ten per cent by 2015–16
reduce property crime by 15 per cent by 2015–16
increase confidence in police
prevent and reduce the level of re-offending
Targets include:
reduce juvenile and adult re-offending by five per cent by 2016
increase completion rates for key treatment and intervention programs
improve community confidence in the justice system
Priorities and strategies in this area include:
increasing community confidence through an efficient court system
Targets include:
in the Local Court: 90 per cent of pending criminal matters will be less than
6 months old
in the District Court: 75 per cent of pending civil matters will be less than
12 months old
increasing victims and community understanding of the justice system.
Other Information
Sentencing laws to be reviewed
On 23 September 2011, the NSW Attorney General requested the NSW Law Reform
Commission to consult with the Sentencing Council to review the Crimes (Sentencing
Procedure) Act 1999.
The review will examine:
current sentencing principles including those contained in the common law
the need to ensure sentencing courts are provided with adequate options and discretions
opportunities to simplify the law, whilst providing a framework that ensures transparency
and consistency
the operation of the standard minimum non-parole scheme.
The NSW Attorney General wants to encourage the use of more non-custodial and
community-based sentences as a viable alternative to full-time incarceration for less serious
offences. One aim is to break the cycle in which more than 40 per cent of all New South
Wales criminals reoffend after leaving prison.
The Commission's report is due in October 2012.
This is trial version
www.adultpdf.com
23
NSW Auditor-General's Report
Volume Seven 2011
LAW AND ORDER OVERVIEW
Review of Bail Laws
In the latest prison census, 2,504 people were in full time custody on remand awaiting trial or
sentence as at 30 June 2010, an increase of 69 per cent over ten years.
Over the same period:
the proportion of the prison population on remand increased from 20.4 per cent to
24.3 per cent
50 to 60 per cent of young people in detention centres are held on remand
85 per cent of admissions to detention centres are remand admissions
84 per cent of young people remanded in custody do not receive custodial sentences.
On 8 June 2011, the Attorney General asked the NSW Law Reform Commission to undertake
a review of bail laws and develop a legislative framework to provide access to bail in
appropriate cases having regard to questions such as:
whether the Bail Act 1978 should make a distinction between young offenders and adults
and, if so, what special provision should apply to young offenders
whether special provisions should apply to vulnerable people including:
Aboriginal people and Torres Strait Islanders
cognitively impaired people
those with a mental illness
the available responses to a breach of bail
what presumptions should apply to bail determinations and how they should apply.
The Attorney General has asked the Commission to report by 30 November 2011.
This is trial version
www.adultpdf.com
Section Two
Agencies with Individual Comments
Attorney General
Minister for Police and Emergency Services
Treasurer
This is trial version
www.adultpdf.com
26
NSW Auditor-General's Report
Volume Seven 2011
DEPARTMENT OF ATTORNEY
GENERAL AND JUSTICE
Audit Opinion
The audit of the Department of Attorney General and Justice’s financial statements for the
year ended 30 June 2011 resulted in an unmodified audit opinion within the Independent
Auditor’s Report.
Operational Snapshot
The Department delivers legal, court and supervision services to the people of New South
Wales by:
managing courts and justice services
implementing programs to reduce crime and re-offending
managing custodial and community-based correctional services
supervising and caring for young offenders in the community and in detention centres
advising on law reform and legal matters.
The net cost of the Department’s services for the year was $1.7 billion ($1.5 billion in
2009-10).
Key Issues
Integration of Policies, Operations and Systems between the Divisions
(Repeat Issue)
Recommendation
I again recommend the Department continue integrating policies, operations and systems
between its divisions and appoints a Chief Financial Officer.
The Department was created on 1 July 2009 by merging the former Department of Corrective
Services (DCS) and the former Attorney General’s Department (AGD).
From 1 April 2011, the functions of the former Juvenile Justice division (now called Juvenile
Justice NSW) and the Guardianship Tribunal were transferred to the Department under the
Public Sector Employment and Management (Departments) Order 184/2011, from the
Department of Human Services. On 31 December 2011, the functions of Privacy NSW were
transferred from the Department to the Information and Privacy Commission.
As I reported last year, progress on integrating policies, operations and systems of all entities
transferred into the Department was limited. The transfer-in of new divisions in 2010–11 has
compounded the issue. For example, the finance functions of each division are maintained on
separate systems, they apply different accounting policies, report separately and have
separate audit and risk committees and internal audit functions.
The Department has still not appointed a Chief Financial Officer with responsibility for the
financial operations of the whole Department. The Chief Financial Officers for the Attorney
General, Corrective Services NSW and Juvenile Justice NSW divisions continue to be
responsible for their respective divisions. They collaborated during the year to achieve overall
Departmental financial control and reporting.
The Department cannot provide information on additional costs associated with the
amalgamation, or cost savings it expects to achieve.
Department of Attorney General and
Justice
The Department
has not appointed
a Chief Financial
Officer
Progress on
integrating
policies,
operations and
systems since
Department was
restructured has
been limited
This is trial version
www.adultpdf.com
27
NSW Auditor-General's Report
Volume Seven 2011
DEPARTMENT OF ATTORNEY
GENERAL AND JUSTICE
Victims Compensation (Repeat Issue)
Backlog of victim’s compensation claims now represents more than four years of claims and
has more than tripled since 2006. Almost 60 per cent of all claims are more than one year old.
Of $289 million of restitution debts owing by offenders, only $18.8 million is likely to be
received.
Recommendation
I again recommend the Department pursue further initiatives to address the backlog of victim’s
compensation claims, which now represents more than four years of claims and has more
than tripled since 2006.
For the last two years, I have recommended the Department seek additional funding from the
Consolidated Fund to ensure the backlog of victims compensation claims is processed in a
reasonable timeframe. Instead, the Department continues to pursue what it believes are more
sustainable options to fund the scheme. These include restructuring the scheme to
significantly reduce its operating costs and increase the proportion of funds directly payable to
victims of crime.
The Department had 21,646 pending claims for victims’ compensation at 30 June 2011
(18,118), which it estimates will result in payments of $239 million ($222 million), or an
average payment per claim of $11,041 ($12,300). Based on the number of claims determined
during 2010–11, this backlog represents more than four years of claims and has more than
tripled since 2006 as shown in the graph below:
Source: The Department of Justice and Attorney General (unaudited).
Victims Compensation Tribunal NSW – Chairpersons Report 2009-10 (unaudited).
The number of new claims in 2010–11 decreased for the first time since 2006, but remains
higher than the number of claims finalised during the year, thus adding to the backlog. The
number of claims determined and paid remained at similar levels over the same period.
Claims are determined each year to the extent of the budget allocation, and claims in excess
of the allocation increase the projected future liability. The budget for 2011–12 is $69.3 million
compared to $68.1 million in 2010–11. This is unlikely to meet the liability for new claims,
much less reduce the backlog.
The Department advises that the average length of time to process a claim is 25 months. This
is because claims cannot be processed until all information has been received from relevant
parties or before other matters, such as workers compensation proceedings or clients seeking
adjournment, have been resolved.
-
5,000
10,000
15,000
20,000
25,000
2006
2007
2008
2009
2010
2011
Number of Claims
Victims Compensation Claims
New claims
Claims determined
Backlog at 30 June
Restitution orders made
Backlog of victims
compensation
claims have
tripled since 2006
to 21,646 claims
This is trial version
www.adultpdf.com
28
NSW Auditor-General's Report
Volume Seven 2011
DEPARTMENT OF ATTORNEY
GENERAL AND JUSTICE
Of all outstanding claims, 40.1 per cent are less than 1 year old and 2.3 per cent are more
than five years old. The oldest outstanding claim is from July 1997.
Victims of violent crime are entitled to receive compensation for injuries, even if the offender is
unknown or not convicted. Where offenders are convicted, restitution orders can be raised
against offenders to recover the compensation paid to victims.
Levies are collected from people convicted of crimes and paid into the scheme. Offenders not
convicted of an offence that carries a jail term are now also required to pay the levy. The
Department is currently developing proposals with the State Debt Recovery Office (SDRO) to
improve collection of restitution debt. The proposals include transferring the management and
enforcement of restitution debts to the SDRO.
Last year, the government announced further changes to the scheme. These included
expanding support for victims of violent crime who are not eligible for compensation because
their injuries do not reach the threshold for compensation. The number of support calls
increased from 48,021 to 63,201 in 2010–11.
During 2010-11, the Department awarded $63.4 million ($62.6 million) in compensation to
victims and only received $4.3 million ($4.3 million) in restitution from offenders. At
30 June 2011, $289 million ($289 million) was recorded as restitution debt, but only
$18.8 million ($18.7 million) of this is likely to be received.
The collection of restitution debts is complex as convicted offenders may have multiple debts
and may be co-offenders. The development of an electronic information system to help
manage, monitor and report on offenders’ debts has been challenging. Continuing
enhancements to the Victims Services CARES workflow database system and its interface
with the Department’s financial system are providing ongoing improvements to the financial
information necessary to determine a debtor’s compliance. Default letters are regularly sent to
debtors who have not complied with arrangements with the Director, Victim Services or orders
made by the Tribunal.
Property, Plant and Equipment (Repeat Issue) (Corrective Services)
Recommendation
I again recommend Corrective Services NSW ensures appropriate systems and controls are
in place to enable the efficient and effective management of assets.
Since 2008, I have reported that the level of detail in asset records did not facilitate efficient
and effective management of Corrective Services NSW assets. This situation remains
unchanged from the prior year. While acknowledging that ancillary procedures exist, some of
these procedures are not operating as intended. For example, I noted the following during my
audit:
the 2010–11 stocktake was incomplete with a number of stock take returns outstanding.
The differences identified in the stock take were not investigated or reflected in asset
records
the land and buildings revaluation was not completed early enough to enable Corrective
Services NSW to update their asset records for the result of the revaluation, or to fully
investigate differences between the valuation results and their asset records
four instances where correctional centre buildings were included in Corrective Services
NSW asset records, without the underlying land being included
a number of completed projects that were incorrectly included within work in progress.
The Department
has implemented
initiatives to
increase the
scheme's
revenue
The Department
only expects to
recover
$18.8 million of
the $289 million
payable by
offenders
The management
of Corrective
Service’s assets
requires
improvement
This is trial version
www.adultpdf.com