New South Wales Auditor-General’s Report Financial Audit Volume Seven 2011 Focusing on Law, Order and Emergency Services_part8 potx
Bạn đang xem bản rút gọn của tài liệu. Xem và tải ngay bản đầy đủ của tài liệu tại đây (185.67 KB, 10 trang )
69
NSW Auditor-General's Report
Volume Seven 2011
NSW RURAL FIRE SERVICE
Audit Opinion
The audit of the Service's financial statements for the year ended 30 June 2011 resulted in an
unmodified audit opinion within the Independent Auditor’s Report.
Operational Snapshot
The Service provides a community-based fire and emergency service to reduce risks to
people, property and the environment resulting from fire and other emergencies. The Service
is a volunteer based organisation whose net cost of services was $64.0 million in the 2010–11
financial year.
Performance information
Incidents
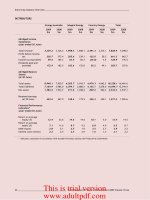
The following fire and related incidents were responded to by the Service:
Source: NSW Rural Fire Service (unaudited).
The number of incidents responded to by the Service has remained fairly stable over the past
three years. Bushfire incidents significantly decreased in 2010–11 due to a quieter than
normal bushfire season. In 2010–11, there were no emergency declarations related to
bushfires (50 in 2009–10) under Section 44 of the Rural Fires Act 1997.
Hazard reduction
In 2010–11, approximately 117,634 (175,000) hectares were subject to hazard reduction.
Almost 50 per cent of the hazard reduction occurred within National Parks. 2010–11 was
characterised by significant periods of wet weather, reducing the number of opportunities to
conduct hazard reduction burning. In 2010–11, New South Wales had a 46 per cent increase
in the amount of rainfall across the State, relative to the five year average, resulting in a
reduction of 11.5 per cent in available days for burning.
Hazard reduction activities are designed to minimise the threat of damage to life, property and
the environment by reducing or removing bushfire fuel. Hazard reduction will not completely
stop bushfires, but can assist the Service with containment strategies and property protection.
Burning is the most common form of hazard reduction used in New South Wales.
0
1,000
2,000
3,000
4,000
5,000
6,000
Other
incidents
Motor vehicle
accident
Bushfire
Grassfire
False alarms
Vehicle fire
Building fire
No.
Year ended 30 June
Number of Incidents
2011
2010
2009
NSW Rural Fire Service
Bushfire incidents
significantly
decreased in
2010–11 due to a
quieter than
normal bushfire
season
Wet weather,
reduced the
number of
opportunities to
conduct hazard
reduction burning
This is trial version
www.adultpdf.com
70
NSW Auditor-General's Report
Volume Seven 2011
NSW RURAL FIRE SERVICE
Hazard reduction is the responsibility of land owners and managers. This includes private
owners and government land management agencies, such as the National Parks and Wildlife
Service and Forestry Commission of New South Wales.
The Service offers advice and assistance on hazard reduction, and is responsible for ensuring
hazard reduction activities are carried out effectively. The Service can order land owners and
managers to conduct essential hazard reduction activities. During the year, hazard reduction
activities were carried out on 7,398 hectares of privately owned land.
Managing Bush Fire Prone Land
New building development in bush fire prone land is subject to development and planning
controls. New developments must comply with the requirements within the Service’s ‘Planning
for Bush Fire Protection 2006’ (PBP). The Service advises that it assessed 7,368 (8,200)
development applications across the State in 2010–11.
The requirements for building in bush fire prone areas do not apply to existing buildings. This
leaves existing assets within the community at risk from bush fires. To address this risk, the
Bush Fire Coordinating Committee (BFCC) establishes a Bush Fire Management Committee
for each area in New South Wales at risk of bush fires. Each of these committees must
prepare a five year Bush Fire Risk Management Plan (BFRMP) in accordance with BFCC
policy.
Committees are updating BFRMPs in accordance with policies issued by the BFCC in 2008.
The Service advises that the BFCC has approved 61 out of 68 (40 out of 68). BFRMPs are
used to determine such things as, where mechanical clearing or hazard reduction burns are
conducted, which areas require specialised fire protection, and which areas need to be
targeted for community education.
Land is identified as bush fire prone where it can support a bush fire or is likely to be subject
to bush fire attack.
Resources
The effectiveness and efficiency of the Service depends on the number of trained firefighters
and the quantity and types of firefighting equipment available. The Service provided the
following information about available resources:
Year ended 30 June
2011
2010
2009
2008
2007
Personnel
Unpaid volunteers (number)
70,448
70,552
70,701
70,159
71,441
Full time equivalent support and
coordinating staff* (number is inclusive
of mitigation crew members)
884
785
715
710
685
Active firefighters competent to bush
firefighter status or higher (%)
85
86
79
78
85
Trainers accredited in the year
(number)
339
257
282
261
47
Community based bush fire brigades
(number)
2,039
2,051
2,065
2,058
2,077
Tankers supplied or refurbished in the
year (number)
216
205
209
259
258
Source: NSW Rural Fire Service (unaudited).
* Excludes Ministry for Police and Emergency Services staff.
In response to the Victorian Royal Commission, the Service enhanced its State Mitigation
Support Services by employing a further 80 mitigation crew members who assist volunteer
brigades and vulnerable community members.
This is trial version
www.adultpdf.com
71
NSW Auditor-General's Report
Volume Seven 2011
NSW RURAL FIRE SERVICE
Other Information
Administrative Restructures
Emergency Management New South Wales was part of the NSW Rural Fire Service until
3 April 2011. The Public Sector Employment and Management (Department) Order 2011 of
3 April 2011 transferred Emergency Management to the Ministry for Police and Emergency
Services effective from 1 April 2011.
Litigation Arising from 2003 Australian Capital Territory Bush Fires
The Service is being sued by a number of parties for its involvement in the 2003 Australian
Capital Territory bush fires. The plaintiffs argue that the Service was negligent in its
management of fires that started in New South Wales.
The Australian Capital Territory Supreme Court is expected to consider:
whether the Service owed a legal duty of care to individuals
whether the Service is liable for action taken in the course of fighting fires.
The outcome of the proceedings could have financial implications for the New South Wales
Government and for the way government agencies respond to bush fires and similar threats.
The proceedings, which commenced in March 2010, are currently adjourned and are
scheduled to resume for verbal submissions on 14 November 2011.
Royal Commission into the Victorian ‘Black Saturday’ Bush Fires
In November 2010, the New South Wales response to the Royal Commission was announced
with a Bush Fire Protection Package of $106.9 million to be shared across the Service,
National Parks and Wildlife Service and the Forestry Commission of New South Wales. The
Service continued to build on the findings of the 2009 Commission throughout 2010–11.
Financial Information
Abridged Statement of Comprehensive Income
Year ended 30 June
2011
$’000
2010
$’000
Employee related expenses
93,327
80,876
Disaster relief expenses
17,676
85,668
Grants and subsidies
24,736
17,333
Local government firefighting and equipment costs
128,703
100,369
Depreciation and amortisation
4,815
4,469
Other expenses
38,213
27,365
Total Expenses
307,470
316,080
Contributions from insurers and local government
219,498
170,168
Disaster relief grants
5,937
74,390
Other revenue
18,011
10,060
Total Revenue
243,446
254,618
Net Cost Of Services
64,024
61,462
Government contributions
77,739
46,375
Surplus/(Deficit)
13,715
(15,087)
Other Comprehensive Income
Superannuation actuarial gains/(losses)
576
(2,566)
Total Comprehensive Income
14,291
(17,653)
This is trial version
www.adultpdf.com
72
NSW Auditor-General's Report
Volume Seven 2011
NSW RURAL FIRE SERVICE
The Service’s firefighting equipment is owned by local government councils. The Service
funds the costs of firefighting equipment purchased by local government and provides other
support to local government for bush firefighting. The increase in expenditure in 2010–11 is
mainly attributable to the delivery of defibrillators to all fire fighting vehicles in 2010–11 at a
cost of $12.2 million and an increase in the new and refurbished tankers paid for during 2010–
11 of $8.2 million.
The significant decrease in disaster relief expenses and revenue is due to there being no fire
related natural disaster events during 2010–11. Disaster relief expenditure is reimbursed by
the Crown Entity.
Increases in insurance company and local government contributions were primarily
attributable to a $36.0 million increase in the contributions to meet increase wage expenses
for normal operations, and to respond to the Victorian Royal Commission recommendations.
Abridged Statement of Financial Position
At 30 June
2011
$’000
2010
$’000
Current assets
44,922
34,167
Non-current assets
17,089
16,043
Total Assets
62,011
50,210
Current liabilities
36,916
26,697
Non-current liabilities
9,919
10,896
Total Liabilities
46,835
37,593
Net Assets
15,176
12,617
The increase in current assets is primary due to an increase in cash of $8.6 million. This is
primarily due to under expenditure of $7.5 million in supplementation funding received in
response to the Victoria Royal Commission Recommendations.
Current liabilities increased by $10.2 million primarily due to an increase in payables and
accruals of $9.1 million around year end. This is mainly attributable to timing differences.
Abridged Service Group Information
The Service’s net cost of services on a service group basis is detailed below:
Year ended 30 June
Net Cost of Services
Net Assets
2011
Budget
$’000
2011
Actual
$’000
2010
Actual
$’000
2011
Actual
$’000
2010
Actual
$’000
Community safety
20,788
6,184
4,992
114
(100)
Operations
177,160
227,356
179,805
5,580
3,891
Operational and administrative support
(164,516)
(180,645)
(135,431)
(30,213)
(22,055)
Emergency Management NSW
31,728
11,129
12,096
(152)
Not attributable
39,695
31,033
Total All Service Groups
65,160
64,024
61,462
15,176
12,617
The Service received additional funding of $36 million in response to the 2009 Victorian Fires
Royal Commission recommendations. This amount is not included in the budgeted figures.
The 2010–11 Budget included the provision of $32.2 million for the supply of new and
refurbished tankers, $17 million in maintenance grants and $16 million for the funding of
brigade stations and the installation of water tanks. An additional $13.1 million for the Natural
Disaster Resilience Program administered by Ministry for Police and Emergency Services was
also provided.
This is trial version
www.adultpdf.com
73
NSW Auditor-General's Report
Volume Seven 2011
NSW RURAL FIRE SERVICE
Service Activities
The Service is the leading agency for coordinated bush fire fighting and is responsible for fire
fighting in rural fire districts with 49 district offices and more than 2,000 brigades. The Service
also assists other emergency services organisations in emergency situations such as
transport accidents, flood and storm and search and rescue operations. The Service was
established by the Rural Fires Act 1997.
For further information on the Service, refer to www.rfs.nsw.gov.au.
This is trial version
www.adultpdf.com
74
NSW Auditor-General's Report
Volume Seven 2011
STATE EMERGENCY SERVICE
Audit Opinion
The audit of the State Emergency Service's financial statements for the year ended
30 June 2011 resulted in an unmodified audit opinion within the Independent Auditor’s Report.
Operational Snapshot
The Service incurred a net cost of $12.1 million in 2010–11 ($15.0 million in 2009–10) to
provide its services. It has the following service groups:
Performance Information
The Service’s volunteers contributed around 549,803 hours of operational and
non-operational support during 2010–11 (405,499; 2009-10). Assistance provided by the
Service during natural disaster events, including flooding on the far and mid-north coast of
New South Wales, Cyclone Yasi in Queensland and the Queensland and Victorian floods,
were the main contributors to the increase in hours of support provided. These hours are
broken down as follows.
Source: State Emergency Service (unaudited).
-
60,000
120,000
180,000
240,000
300,000
Storm
Community
activities
Other
incidents
Flood and
flood
rescue
Land
search
Bushfire
support
Road crash
rescue
Other
rescue
events
Hours
Year ended 30 June
Volunteer Hours by Activity
2011
2010
2009
State Emergency Service
Recruitment and
Training
Volunteer training to
national standards
Volunteer awareness in
flood and storms.
Volunteers equipped
with modern and
properly maintained
rescue equipment
Net Cost: $1.1 million
Operational
Readiness
Responding quickly to
requests for assistance
from the community.
Responding quickly to
requests for assistance
from other emergency
services.
Ensuring efficient flood,
storm and tsunami plans
are in place.
Net Cost: $10.6 million
Community
Education
Educational programs
and literature for
community awareness.
Effective advertising
campaigns and literature
for community safety and
awareness.
Direct community
training through schools
and community events.
Net Cost: $0.4 million
This is trial version
www.adultpdf.com
75
NSW Auditor-General's Report
Volume Seven 2011
STATE EMERGENCY SERVICE
Other Information
Operational Support
As I reported in 2009–10, the Service received an increase in their annual budget of
$5.0 million to fund 32 new positions and the regrading of five existing positions. Despite the
increase in the number of employees, the service had on average 87 vacant positions during
2010–11 compared to 17 in 2009–10. The Service advises that the increase in vacant
positions in 2010–11 did not impact on their ability to respond operationally during the year.
Financial Information
Abridged Statement of Comprehensive Income
Year ended 30 June
2011
$’000
2010
$’000
Employee related expenses
24,501
21,057
Disaster relief expenses
27,982
20,983
Grants and subsidies
8,518
9,310
Depreciation and amortisation
4,286
6,094
Other expenses
25,242
19,230
Total Expenses
90,529
76,674
Contributions from insurers and local government
50,778
41,742
Disaster relief grants
22,982
15,983
Other revenue
4,701
3,995
Total Revenue
78,461
61,720
Net Cost Of Services
12,068
14,954
Government contributions
14,573
8,660
Surplus/(Deficit)
2,505
(6,294)
Other Comprehensive Income
Total Comprehensive Income/Expense
2,505
(6,294)
The Service is funded through contributions from insurance companies (73.7 per cent), Local
government (11.7 per cent) and the State government (14.6 per cent). This is the same
funding structure as Fire and Rescue New South Wales and the New South Wales Rural Fire
Service.
The service received $1.3 million in supplementary funding for 27 new flood boats as well as
an additional $14.5 million for 3,400 Automatic External Defibrillators and 2,500 Emergency
Position Indicating radio beacons. Training in the use of defibrillators is currently being
introduced across the State.
There were fewer individual flood and storm events in 2010–11, but the impact of these
affected more Local Government Areas (LGA). On two occasions ‘Flood and Storm’ disasters
were declared affecting 45 LGAs in NSW. This increased expenditure and associated funding
related to Disaster Relief in 2010–11.
On two occasions
‘Flood and Storm’
disasters were
declared affecting
45 LGAs in NSW
This is trial version
www.adultpdf.com
76
NSW Auditor-General's Report
Volume Seven 2011
STATE EMERGENCY SERVICE
Abridged Statement of Financial Position
At 30 June
2011
$’000
2010
$’000
Current assets
21,219
12,711
Non-current assets
17,019
15,276
Total Assets
38,238
27,987
Current liabilities
12,899
5,154
Non-current liabilities
23
22
Total Liabilities
12,922
5,176
Net Assets
25,316
22,811
Assets comprise cash at bank, inventory and equipment used to respond to incidents.
Equipment excludes the Service’s operational fleet, which is owned by local government.
Current assets have increased due to a recoupment of National Disaster Relief funds late in
2010–11 from the Commonwealth Government and a receivable from Emergency
Management Queensland for assistance provided during Cyclone Yasi.
The increase in current liabilities is mainly attributable an increase of $7.5 million in creditors
due to a higher than normal number of operations late in the year and creditors of $2.9 million
associated with the Government Radio Network.
Abridged Service Group Information
The Service’s net cost of services on a service group basis is detailed below:
Year ended 30 June
Net Cost of Services
Net Assets
2011
Budget
$’000
2011
Actual
$’000
2010
Actual
$’000
2011
Actual
$’000
2010
Actual
$’000
Recruitment and training
1,069
1,065
1,489
44
167
Operational readiness
8,648
10,585
12,916
25,254
22,578
Community education
421
418
549
18
66
Total All Service Groups
10,138
12,068
14,954
25,316
22,811
Actual net costs of services exceeded budget and is attributable to additional expenditure of
$2.5 million for the Government Radio Network.
Service Activities
Using volunteers, the Service manages and responds to emergencies resulting from flood,
storm, tsunami and other incidents. Approximately 10,800 volunteers operating through 228
State Emergency Service units located throughout the State help with these activities.
The Service was established in accordance with the State Emergency Service Act 1989.
For further information on the Service, refer to www.ses.nsw.gov.au.
This is trial version
www.adultpdf.com
77
NSW Auditor-General's Report
Volume Seven 2011
CROWN ENTITY
Audit opinion
The audit of the Crown Entity’s (the Crown) financial statements for the year ended
30 June 2011 resulted in a qualified audit opinion within the Independent Auditor’s Report.
The Crown’s investment in Snowy Hydro Limited (Snowy Hydro), accounted for using the
equity method, is measured using the net assets reported in Snowy Hydro’s financial
statements. The accounting policies applied in determining Snowy Hydro’s net assets and the
share of profit attributable to the Crown are not wholly consistent with those applied by the
Crown. I am unable to obtain the evidence I require to determine whether adjustments to the
amounts reported in respect of the Crown’s investment in Snowy Hydro would be required,
had consistent accounting policies been applied.
Operational Snapshot
The Crown is a residual entity that administers government functions not the responsibility of
an individual agency. It recognises various State revenues and manages various State
liabilities.
Information on State revenue trends, including taxation, fines and regulatory fees,
Commonwealth grants and State liabilities, including superannuation obligations, is reported
in Volume Three of my 2011 Report to Parliament.
Key Issue
Impact of electricity reform
The Crown was not directly impacted by the government’s electricity reforms. However, the
reforms have impacted its assets, liabilities and surplus for 2010–11.
The Crown receives financial distributions from the commercial operations of New South
Wales government agencies. After selling their retail businesses, Ausgrid, Endeavour Energy
and Essential Energy remitted one off dividends totalling $3.4 billion to the Crown, which has
been invested with NSW Treasury Corporation.
Under the agreements with the private sector purchasers of the electricity generation trading
rights of some government owned power stations, the Crown accepted upfront security
deposits of $1.3 billion as the purchase consideration. The security deposits represent
amounts owing to the purchasers, which will reduce over the terms of the sale agreements.
After the sale of the power stations’ trading rights, the Crown assumed $1.2 billion of Eraring
Energy’s and Delta Electricity’s borrowings. These borrowings are owed to the NSW Treasury
Corporation.
More information on electricity reforms appears in Volume Four of my 2011 Report to
Parliament.
Crown Entity
I issued a
qualified opinion
due to the
Crown’s
inappropriate
application of
equity accounting
I am unable to
obtain evidence
required to
determine
whether
adjustments are
required to
amounts reported
in respect of the
investment in
Snowy Hydro
Limited
This is trial version
www.adultpdf.com
78
NSW Auditor-General's Report
Volume Seven 2011
CROWN ENTITY
Financial Information
Abridged Statements of Comprehensive Income
Year ended 30 June
2011
$’000
2010
$’000
Long service leave
684,103
583,391
Superannuation expenses
1,484,034
1,629,428
Finance costs
1,280,972
1,053,623
Grants and subsidies
434,814
1,000,580
Other expenses
575,452
507,815
Recurrent appropriations
45,134,354
41,271,453
Capital appropriations
2,957,450
5,826,041
Operating Expenses
52,551,179
51,872,331
Taxation, fines and regulatory fees
20,455,658
19,673,694
Commonwealth contributions
24,794,632
26,072,257
Financial distributions from other agencies
5,456,394
1,983,857
Royalties on minerals
1,240,328
985,271
Other revenues
1,091,481
973,012
Operating Revenue
53,038,493
49,688,091
Gain/(loss) on disposal of non-current assets
(7,904)
638,720
Gain from financial instruments
20,982
(2,652)
Surplus/(Deficit)
500,392
(1,548,172)
Other Comprehensive Income
Superannuation actuarial gains/(losses)
441,770
(2,908,004)
Other net increase in equity
(978)
Total Comprehensive Income/(Expense)
941,234
(4,456,176)
Finance costs increased in 2010–11 as a result of higher debt levels. Grants and subsidies
expense decreased mainly due to reduced First Home Owner Grant Scheme payments.
Movements in recurrent appropriation expense are determined mainly by government policy
decisions in respect of spending, as set out in Appropriation Acts. Total recurrent
appropriations for 2010–11 were higher than those for 2009-10.
Commonwealth contributions decreased in 2010–11 as a result of reductions in economic
stimulus funding. This also resulted in a decrease in capital appropriation expense. Financial
distributions increased mainly due to one-off transactions arising from the sale of electricity
retail businesses. Mining royalties increased due to increased export volumes.
Superannuation actuarial gains and losses have been subject to volatility, reflecting the
impact of investment market movements on actuarial assumptions.
This is trial version
www.adultpdf.com