báo cáo hóa học: " Immune response after experimental allergic encephalomyelitis in rats subjected to calorie restriction" pot
Bạn đang xem bản rút gọn của tài liệu. Xem và tải ngay bản đầy đủ của tài liệu tại đây (1.01 MB, 10 trang )
BioMed Central
Page 1 of 10
(page number not for citation purposes)
Journal of Neuroinflammation
Open Access
Research
Immune response after experimental allergic encephalomyelitis in
rats subjected to calorie restriction
Ana I Esquifino*
1
, Pilar Cano
1
, Vanessa Jimenez-Ortega
1
, María P Fernández-
Mateos
2
and Daniel P Cardinali
3
Address:
1
Departamento de Bioquímica y Biología Molecular III, Facultad de Medicina, Universidad Complutense, 28040 Madrid, Spain,
2
Departamento de Biología Celular, Facultad de Medicina, Universidad Complutense, 28040 Madrid, Spain and
3
Departamento de Fisiología,
Facultad de Medicina, Universidad de Buenos Aires, 1121 Buenos Aires, Argentina
Email: Ana I Esquifino* - ; Pilar Cano - ; Vanessa Jimenez-Ortega - ;
María P Fernández-Mateos - ; Daniel P Cardinali -
* Corresponding author
Abstract
Male Lewis rats (6 weeks-old) were submitted to a calorie restriction equivalent to 33% or 66% of
food restriction. Fifteen days later, groups of 7 animals were injected with complete Freund's
adjuvant plus spinal cord homogenate (SCH) to induce experimental allergic encephalomyelitis
(EAE) or with complete Freund's adjuvant alone. EAE was defined solely on clinical grounds. Rats
were assessed daily for clinical signs of EAE and were killed on day 15 after immunization. Both diet
and SCH injection diminished body weight significantly. In contrast to rats receiving a normal diet
or a 33% calorie-restricted diet, rats subjected to severe calorie restriction did not exhibit clinical
signs of EAE. Concomitantly with the lack of disease manifestation, 66% of calorie-restricted rats
injected with SCH showed significantly less splenic and lymph node mitogenic response to
concanavalin A (Con A) and a higher splenic response to lipopolysaccharide. Fewer splenic, lymph
node and thymic CD4
+
cells, greater numbers of splenic and lymph node CD8
+
and CD4
+
- CD8
+
cells, and fewer splenic T, B and T-B cells, and lymph node and thymic B and T-B cells were
observed. There was impaired interferon (IFN)-γ production occurred in the three examined
tissues. The results are compatible with the view that the acute phase of EAE can be curtailed by
severe calorie restriction, presumably through impaired IFN-γ production.
Background
Multiple sclerosis (MS) is an autoimmune disease that
results in demyelination of axonal tracts in the CNS caus-
ing a wide range of neurological symptoms [1]. Major his-
tocompatibility (MHC) class II-restricted CD4
+
T-cells that
recognize CNS components are the predominant patho-
genic mediators in MS and act by secreting inflammatory
cytokines such as IFN-γ. Epidemiological studies suggest
that unidentified environmental factors contribute to the
etiology of MS [2,3] and diet is a commonly postulated
factor because strong associations have been observed
between increased MS prevalence and diets high in meat
and dairy products and low in fish [1,4-6].
These epidemiological findings have provided a rationale
for a number of clinical trials aimed to establish beneficial
effect of dietary interventions in MS, with heterogeneous
results [1]. There have been reports indicating that a diet
Published: 25 January 2007
Journal of Neuroinflammation 2007, 4:6 doi:10.1186/1742-2094-4-6
Received: 22 December 2006
Accepted: 25 January 2007
This article is available from: />© 2007 Esquifino et al; licensee BioMed Central Ltd.
This is an Open Access article distributed under the terms of the Creative Commons Attribution License ( />),
which permits unrestricted use, distribution, and reproduction in any medium, provided the original work is properly cited.
Journal of Neuroinflammation 2007, 4:6 />Page 2 of 10
(page number not for citation purposes)
with a very low saturated fat content may provide long
term benefits for rates of mortality, relapse severity and
disability in MS, particularly if initiated during the earliest
stages of the disease [7,8].
While the nature of the event(s) in MS that lead to activa-
tion and proliferation of T-cells is unknown, a similar dis-
ease can be induced in rodents by subcutaneous (s.c.)
injection of either spinal cord homogenate (SCH) or CNS
antigens including myelin basic protein, myelin oli-
godendrocyte glycoprotein, or proteolipid protein; or
phenotypic peptides of these [9]. Besides different trigger-
ing mechanisms, experimental allergic encephalomyelitis
(EAE) animal models share many characteristics of MS
[10]. This includes an "activation phase" where antigen-
presenting cells process the immunized antigen, migrate
to the lymph nodes and present immunodominant pep-
tides to naïve T-cells; and an "effector phase" where CD4
+
T-cells that recognize antigen proliferate and cross the
blood-brain barrier to lead an inflammatory attack that
results in demyelinated lesions. In most models, the T
helper 1 (Th1) subset of T-cells has been implicated in the
induction of EAE.
In a previous study [11] we reported the inhibitory effect
of a severe caloric restriction (i.e., a 66 % reduction of cal-
orie intake) on the development of EAE in Lewis rats. Cal-
orie-restricted rats did not exhibit the augmented lymph
node mitogenic response to concanavalin A (Con A) fol-
lowing SCH immunization found in controls, nor the
increase in plasma ACTH and corticosterone found after
SCH immunization [11].
The present study was carried out to further examine the
immune responses after EAE in rats subjected to a severe
(i.e., 66 %) or a moderate (i.e. 33 %) calorie restriction.
The mitogenic responses and lymphocyte subset groups of
spleen, submaxillary lymph node (SmLN) and thymus
were assessed. The changes in immune parameters were
correlated with the release of interferon (IFN)-γ in vitro by
immunocompetent cells.
Materials and methods
Male Lewis rats (6 weeks old, 140–170 g) were purchased
from Charles River S.A., Spain, and were individually
housed in a standard animal facility. Rats were put in indi-
vidual cages to avoid cannibalism among calorie
restricted animals [12]. Control rats (n = 14) had free
access to an equilibrated diet (AIN-93G, Diets Inc., Penn-
sylvania, USA),) and water for 4 weeks. Severely calorie-
restricted rats (n = 14) had daily access to 7 g of an unbal-
anced AIN-93G diet enriched in proteins and low in fat
and carbohydrates [13] and water ad libitum for 4 weeks.
This calorie restriction was equivalent to a 66% food
restriction. A second group of 14 rats had daily access to
14 g of an unbalanced AIN-93G diet enriched in proteins
and low in fat and carbohydrates (33% calorie restric-
tion). The experiments were conducted in accordance
with the guidelines of the International Council for Labo-
ratory Animal Science (ICLAS). Protocols were approved
by the Institutional Animals Ethics Committee. Spinal
cord obtained from adult Wistar rats was homogenized in
PBS buffer at a concentration of 1 g/mL to serve as an
immunogen.
After 15 days of calorie restriction, each group of rats (con-
trol and moderate or severely calorie-restricted rats) were
divided in two subgroups as follows: a) animals receiving
complete Freund's adjuvant (n = 7); b) animals receiving
complete Freund's adjuvant plus SCH (n = 7). Rats were
immunized by the s.c. injection of a mixture of SCH and
complete Freund's adjuvant containing Mycobacterium
tuberculosis H37Ra (5 mg/mL; Difco Laboratories,
Detroit, Michigan) (v/v) in a final volume of 200 µl. Ani-
mals were assessed daily for clinical signs of EAE using the
following criteria: 0, normal; 0.5, loss of tonicity in distal
half of tail; 1, piloerection; 2, total loss of tail tonicity; 3,
hind leg paralysis; 4, paraplegia; and 5, moribund.
Animals were killed by decapitation on day 15 after
immunization (7 animals per group) and blood was col-
lected from the trunk wound in heparinized tubes and
was centrifuged at 1500 × g for 15 min. The spleen, SmLN
and thymus nodes were removed aseptically, weighed and
placed in Petri disks containing balanced salt solution; the
cells were then gently teased apart. After removing the
clumps by centrifugation, the cells were suspended in ster-
ile supplemented medium (RPMI 1640), containing 10%
heat-inactivated, fetal bovine serum, 20 mM L-glutamine,
0.02 mM 2-mercaptoethanol and gentamicin (50 mg/ml),
and were counted.
Mitogen assays were performed as described in detail else-
where [14]. Splenic, SmLN or thymic cells were used at a
final number of 5 × 10
4
cells per 0.1-ml well. Control and
experimental cultures were run in triplicate. Mitogens
were added to the cultures at final supramaximal concen-
trations of 5 µg/ml. The cultures were incubated in a
humidified 37°C incubator in an atmosphere of 5% CO
2
.
After a 48 h incubation,
3
H-thymidine (0.2 µCi) was
added to each well in a volume of 0.02 ml. Cells were har-
vested 5 h later using an automated sample harvester, and
the filters were counted in a liquid scintillation spectrom-
eter. The proliferation index was estimated as the ratio
between cells stimulated in the presence of mitogens and
controls. Results were expressed as proliferation index/
number of cells.
The relative size distributions of lymph cells in spleen,
SmLN and thymus were determined by FACS analysis, as
Journal of Neuroinflammation 2007, 4:6 />Page 3 of 10
(page number not for citation purposes)
previously described [15]. For these studies, we used the
following monoclonal antibodies: Anti-rat LCA (OX-33)
for B lymphocytes (Serotec, Oxford, UK), anti-rat TCR
alpha/beta (R7.3) for T lymphocytes (Serotec, Oxford,
UK), anti-rat CD4 (OX-35) which recognize a rat T helper
cell differentiation antigen (Pharmingen, San Diego, CA,
USA), and anti-rat CD8a (OX-8) which recognize the reac-
tive antigen expressed on rat T cytotoxic/suppressor cells
(Pharmingen, San Diego, CA, USA). Lymphocytes, iso-
lated as indicated above, were washed in cold PBS with
0.02% sodium azide and then incubated (3 × 10
5
cells/
tube) with appropriate primary antibodies for 30 min at
4°C. Following two washes, the cells were incubated with
1 ml of PBS-BSA 1%, during 5 min at 4°C, washed three
times, resuspended in 1% paraformaldehyde in PBS. Flu-
orescence intensity was analyzed by fluorescence-acti-
vated cell sorting (FACStarplus; Beckton Dickinson,
Mountain View, CA). Dead cells were excluded by gating
with propidium iodide.
For analyzing IFN-γ release, splenic, SmLN or thymic cells
(10
5
/100 µl) were incubated for 24 h, their media
removed and, after adding fresh media including all com-
ponents, they were incubated for 24 h more. Both media
were collected and pooled for IFN-γ measurement. The
incubations were performed in triplicates. Microscopical
examination of the cell preparations used indicated that >
95% were lymph node cells. Neither treatment affected
the viability of the cells. IFN-γ concentration in media cul-
ture was measured after centrifugation to remove adher-
ent cells. An ELISA commercial kit from Endogen
(Woburn, MA, USA), previously validated in our labora-
tory, was employed [16]. The assay was performed as fol-
lows: 100 µl of standards or unknown samples were
added to each antibody-coated well, and the plates were
incubated overnight at room temperature. The reaction
was stopped by washing thrice with wash buffer (2%
Tween 20 in 50 mM Tris, pH 3.6). The wells were incu-
bated with 100 µl of biotynilated detecting antibody at
the titter previously tested. After 1 h at room temperature
the reaction was stopped by washing thrice with wash
buffer. One hundred µl of streptavidin-HRP solution (in
Dulbecco's phosphate-buffered saline, pH 7.4) was then
added and the samples were incubated for 30 min. The
reaction was stopped by adding 100 µl of 0.18 M sulfuric
acid. The plates were read within 30 min in an ELISA
reader set at 450 nm and 550 nm. Values were obtained
by subtracting the reading at 550 nm from the reading at
450 nm, to correct for any optical defect of microtiter
plate. IFN-γ release was expressed as pg/mL/48 h incuba-
tion. Sensitivity of the assay was 100 pg/mL.
Statistical analysis of results was performed by a two-way
factorial analysis of variance (ANOVA) and a one-way
ANOVA followed by a Bonferroni's test. P values lower
than 0.05 were considered evidence for statistical signifi-
cance.
Results
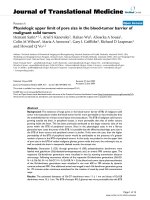
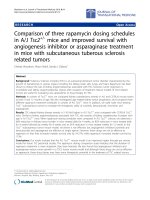
Figure 1 shows final body weight (upper panel) and the
evolution of the clinical scores of EAE in control and cal-
orie restricted rats (lower panel). When analyzed as main
factors in a factorial ANOVA, both calorie restriction and
SCH injection decreased body weight significantly (F
2,36
=
294, p < 0.00001 and F
1,36
= 15.7, p = 0.0003).
Rats subjected to the normal diet or to a 33% calorie
restriction exhibited clinical signs of the disease, starting
on day 12 after SCH injection whereas, a 66%-calorie
restriction effectively suppressed the course of EAE in
Lewis rats (Fig. 1, lower panel). Rats receiving complete
Freund's adjuvant alone and subjected to none, 33% or
66% calorie restriction did not exhibit any sign of disease
(results not shown).
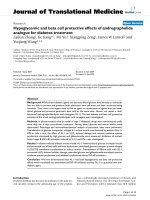
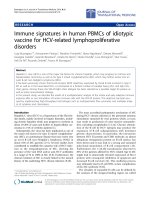
Figure 2 depicts the mitogenic responses to Con A and LPS
of cells derived from spleen or SmLN of control or calorie-
restricted rats. In the case of splenic Con A mitogenic
response, a significant interaction "diet x immunization"
was found in factorial ANOVA (F
2,36
= 3.48, p = 0.0415),
i.e., SCH injection augmented Con A response in control
and 33% calorie-restricted rats while decreased it under
severe caloric restriction (Fig 2, upper left panel). Splenic
cell response to LPS was higher in 66% calorie-restricted
rats (F
2,36
= 4.2, p = 0.0229, factorial ANOVA, Fig. 2, lower
left panel).
In SmLN, a significant depression of Con A mitogenic
activity was observed as a function of calorie restriction
(F
2,36
= 7.1, p = 0.0025, factorial ANOVA, Fig. 2, upper
right panel). The changes in lymph node LPS mitogenic
response (Fig. 2) or of mitogenic responses in thymic cells
were not significant (results not shown).
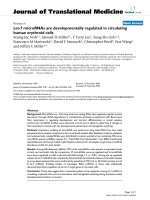
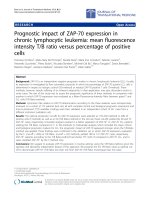
Figures 3 to 5 summarize the data on the different
immune cell populations in spleen, SmLN and thymus of
control and calorie restricted rats. A significant stimula-
tory effect of SCH immunization on splenic, lymph node
and thymic CD4
+
cell number was found (F
1,36
= 11.6, p =
0.0016; F
1,36
= 27.1, p < 0.001 and F
1,36
= 18.8, p < 0.001,
respectively, Fig. 3 to 5). A significant interaction "diet x
immunization" was detected in the case of spleen and
SmLN, SCH injection augmenting CD4
+
cell number in
control and moderately calorie-restricted, but not in
severely calorie-restricted animals (F
2,36
= 3.44. p = 0.0429
and F
2,36
= 6.17, p = 0.005, for spleen and SmLN, respec-
tively, factorial ANOVA, Fig. 3 and 4).
Calorie restriction depressed splenic and lymph node
CD8+ cell number (F2,36 = 98.2, p < 0.0001 and F2,36 =
Journal of Neuroinflammation 2007, 4:6 />Page 4 of 10
(page number not for citation purposes)
Body weight at sacrifice (upper panel) and clinical evolution of EAE in control and 33% and 66% calorie-restricted rats (lower panel)Figure 1
Body weight at sacrifice (upper panel) and clinical evolution of EAE in control and 33% and 66% calorie-restricted rats (lower
panel). Male Lewis rats were kept for 1 month under a control or restricted diet, as described in Materials and methods. On
day 15 the rats received complete Freund's adjuvant plus spinal cord homogenate (SCH) or complete Freund's adjuvant alone.
Rats were assessed daily for clinical signs of EAE using the clinical criteria described in Materials and methods. Data shown as
mean ± SEM. Upper panel: numbers designate the groups whose means differed significantly in a one-way ANOVA followed by
a Bonferroni's test, as follows:
a
p < 0.02 vs. all groups;
b
p < 0.03 vs. control rats injected with SCH.
c
p < 0.01 vs. control and
33% calorie-restricted rats. Dotted line: average weight of intact rats. Lower panel: * p < 0.05 vs. all time points; # p < 0.05 vs.
day 12 or day 13, one-way ANOVA followed by a Bonferroni's test. For further statistical analysis, see text.
Journal of Neuroinflammation 2007, 4:6 />Page 5 of 10
(page number not for citation purposes)
11.7, p = 0.0001, Fig. 3 and 4), with a significant interac-
tion "diet x immunization" in the case of spleen (F2,36 =
11.9, p = 0.0001), i.e., the decrease in CD8+ cell number
observed after SCH immunization in control and 33%
calorie restricted rats was no longer found in 66% calorie-
restricted animals (Fig. 3). Thymic CD8+ cells augmented
after SCH immunization (F1,36 = 10.2, p = 0.0029, facto-
rial ANOVA, Fig. 5). Consequently, CD4+/CD8+ ratios
increased after calorie restriction or SCH immunization in
spleen (F2,36 = 20.8, p < 0.0001 and F1,36 = 7.53, p =
0.0094) and SmLN (F2,36 = 4.77. p = 0.0145 and F1,36 =
26.5, p < 0.0001) (Fig. 3 and 4) and decreased after calorie
restriction in thymus (F2,36 = 9.02, p = 0.0007, Fig. 5).
Splenic double-labeled CD4+-CD8+ cells decreased after
calorie restriction (F2,36 = 6.99, p = 0.0027, factorial
ANOVA, Fig. 3).
In the spleen, T cell number decreased as a function of cal-
orie restriction and augmented after SCH immunization
(F
2,36
= 43, p < 0.0001 and F
1,36
= 11.8, p = 0.0015, facto-
rial ANOVA, Fig. 3). The decrease of lymph node T cells
seen in control following SCH immunization was not
longer observed after a moderate or a severe calorie restric-
tion (F
2,36
= 5.91, p = 0.006 for the interaction "diet x
immunization" in the factorial ANOVA, Fig. 4). Likewise,
a significant interaction "diet x immunization" occurred
for thymic T cell number, i.e., in contrast to the decrease
after immunization seen in control and 33% calorie-
Mitogenic responses to Con A and LPS in spleen (left panels) and SmLN (right panels) of control and calorie-restricted ratsFigure 2
Mitogenic responses to Con A and LPS in spleen (left panels) and SmLN (right panels) of control and calorie-restricted rats.
Data shown as mean ± SEM (n = 7 rats/group). Letters indicate the existence of significant differences between groups after a
one-way ANOVA followed by a Bonferroni's test, as follows:
a
p < 0.02 vs. control rats not injected with SCH;
b
p < 0.03 vs.
66% calorie-restricted rats. For further statistical analysis, see text.
Journal of Neuroinflammation 2007, 4:6 />Page 6 of 10
(page number not for citation purposes)
restricted rats there was an increase in 66% calorie-
restricted rats (F
2,36
= 9.91, p = 0.0004 for the interaction
"diet x immunization" in the factorial ANOVA, Fig. 5).
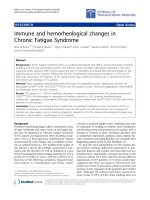
Splenic, lymph node and thymic B cell number decreased
after calorie restriction (F
2,36
= 22.3, 26.8 and 88, p <
0.0001) (Fig. 3 to 5). In the case of spleen and SmLN, sig-
nificant interactions "diet x immunization" occurred
(F
2,36
= 3.39, p = 0.0448 and F
2,36
= 8.16, p = 0.0012,
respectively), the stimulatory effect of SCH immunization
seen in controls being no longer observed in 33% or 66%
calorie-deprived rats (Fig. 3 and 4). As a consequence, a
significant interaction between diet and immunization
occurred for T/B ratio in every tissue, i.e., the decrease after
SCH injection taking place in controls disappeared or was
reversed in calorie-restricted rats. Double labeled T-B cells
in spleen and lymph nodes decreased markedly in
severely calorie-restricted rats (p < 0.0001, Fig. 3 and 4). A
significant interaction "diet x immunization" was
observed in the thymus (F
2,36
= 5.81, p = 0.0065), T-B cells
augmenting in 66% calorie restricted rats, but not in con-
trol or 33% calorie-restricted animals (Fig. 5).
The changes in IFN-γ production by splenic, lymph node
and thymic cells are depicted in Fig. 6. Factor analysis in
the factorial ANOVA indicated the existence of significant
interactions "diet x immunization" in the case of splenic
and lymph node cells. In contrast to the increase in
Relative size distributions of lymph cells in the spleen of control and calorie-restricted ratsFigure 3
Relative size distributions of lymph cells in the spleen of control and calorie-restricted rats. CD4
+
, CD8
+
, CD4
+
-CD8
+
, T, B
and T-B lymphocytes, as well as CD4
+
/CD8
+
and T/B ratios, were measured as described in Materials and methods. Data
shown as mean ± SEM (n = 7 rats/group). Letters indicate the existence of significant differences between groups after a one-
way ANOVA followed by a Bonferroni's test, as follows:
a
p < 0.05 vs. control and 33% calorie-restricted rats, neither injected
with SCH;
b
p < 0.02 vs. control and 33% calorie-restricted rats, neither injected with SCH;
c
p < 0.02 vs. 33% calorie-restricted
rats not injected with SCH;
d
p < 0.02 vs. control and 33% calorie-restricted rats regardless of SCH injection;
e
p < 0.02 vs. 66%
calorie-restricted rats not injected with SCH;
f
p < 0.01 vs. 66% calorie-restricted rats regardless of SCH injection;
g
p < 0.03
vs. control and 33% calorie-restricted rats, both injected with SCH;
h
p < 0.01 vs. all groups. For further statistical analysis, see
text.
Journal of Neuroinflammation 2007, 4:6 />Page 7 of 10
(page number not for citation purposes)
splenic IFN-γ production occurring in control and 33%
calorie-restricted rats after SCH immunization there was a
decrease in 66% calorie-restricted rats (F
2,36
= 8.93, p =
0.0007). A similar trend was observed for lymph node
IFN-γ production (F
2,36
= 3.37, p < 0.0455). Thymic IFN-γ
production was severely curtailed in 66% calorie-
restricted rats (F
2,36
= 13.5, p < 0.0001).
Discussion
The foregoing results indicate that, in contrast to rats
receiving a normal diet or a 33% calorie-restricted diet,
rats subjected to severe (66%) calorie restriction do not
exhibit clinical signs of EAE. The major immune findings
in severely calorie-restricted rats were: (i) impaired splenic
and lymph node mitogenic response to Con A and a
higher splenic response to LPS; (ii) less splenic, lymph
node and thymic CD4
+
, B and T-B cells, and splenic T
cells; (iii) increased numbers of splenic and lymph node
CD8
+
and CD4
+
- CD8
+
cells; (iv) impaired IFN-γ produc-
tion in the three examined tissues.
Malnutrition produced by low or absent proteins in diet is
linked to increased susceptibility to infection, often asso-
ciated with severe marasmus or kwashiorkor. In contrast,
calorie restriction of adult rodents by a diet enriched in
proteins and low in fat and carbohydrates significantly
increases immune responses [17-19]. Calorie restriction
inhibits age-related dysregulation of cytokines and pre-
vents, by enhancement of T cell apoptosis, accumulation
of non-replicative, non-functional, senescent T cells [20].
Relative size distributions of lymph cells in SmLN of control and calorie-restricted ratsFigure 4
Relative size distributions of lymph cells in SmLN of control and calorie-restricted rats. CD4
+
, CD8
+
, CD4
+
-CD8
+
, T, B and T-
B lymphocytes, as well as CD4
+
/CD8
+
and T/B ratios, were measured as described in Materials and methods. Data shown as
mean ± SEM (n = 7 rats/group). Letters indicate the existence of significant differences between groups after a one-way
ANOVA followed by a Bonferroni's test, as follows:
a
p < 0.02 vs. control and 33% calorie-restricted rats, both injected with
SCH;
b
p < 0.02 vs. 66% calorie-restricted rats regardless of SCH injection;
c
p < 0.05 vs. control rats not injected with SCH;
d
p < 0.05 vs. 33% and 66% calorie-restricted rats, both injected with SCH;
e
p < 0.04 vs. all groups;
f
p < 0.02 vs. control rats
injected or not injected with SCH and 33% calorie-restricted rats not injected with SCH;
g
p < 0.01 vs. control and 33% calorie-
restricted rats regardless of SCH injection;
h
p < 0.01 vs. control rats injected with SCH. For further statistical analysis, see
text.
Journal of Neuroinflammation 2007, 4:6 />Page 8 of 10
(page number not for citation purposes)
The effect of calorie restriction is also demonstrable in
young animals. For example, in young mice with experi-
mental colitis, caloric restriction to 60 % of daily require-
ment augmented natural killer (NK) cell number and
cytotoxicity and decreased IFN-γ release [21]. In a study
using peripubertal male Wistar rats submitted to a 66 %
calorie restriction diet similar to that employed herein for
4 weeks, we reported that calorie restriction modified 24
h rhythmicity of lymph node mitogenic responses to Con
A and LPS, and of T, T-B, CD4
+
and CD4
+
-CD8
+
lymph
node cell subsets. In addition, mean values of SmLN Con
A response and CD4
+
cell number increased whereas
those of B cell number and IFN-γ release decreased [22].
Collectively, the data are compatible with the view that T-
cell responses increase in growing rats fed with a calorie-
restricted diet enriched in proteins and low in fat and car-
bohydrates.
The proinflammatory cytokine IFN-γ, which is secreted by
activated T lymphocytes and natural killer cells, stimulates
the expression of MHC class I and II molecules on a wide
variety of cells and is involved in the activation of macro-
phages and microglia [23]. Evidence suggests that IFN-γ
plays a deleterious role in immune-mediated demyelinat-
ing disorders such as MS and EAE [24]. This cytokine,
which is not normally present within the CNS, is detecta-
ble during the symptomatic phase of these disorders, and
much of the pathology observed is consistent with IFN-γ
involvement. Moreover, the treatment of MS patients with
IFN-γ exacerbates the disease [25] and IFN-γ-secreting T
Relative size distributions of lymph cells in the thymus of control and calorie restricted ratsFigure 5
Relative size distributions of lymph cells in the thymus of control and calorie restricted rats. CD4
+
, CD8
+
, CD4
+
-CD8
+
, T, B
and T-B lymphocytes, as well as CD4
+
/CD8
+
and T/B ratios, were measured as described in Materials and methods. Data
shown as mean ± SEM (n = 7 rats/group). Letters indicate the existence of significant differences between groups after a one-
way ANOVA followed by a Bonferroni's test, as follows:
a
p < 0.03 vs. 66% calorie-restricted rats regardless of SCH injection;
b
p < 0.03 vs. control rats injected with SCH;
c
p < 0.01 vs. control rats not injected with SCH;
d
p < 0.04 vs. 33% calorie-
restricted rats regardless of SCH injection;
e
p < 0.01 vs. control and 33% calorie-restricted rats regardless of SCH injection;
f
p < 0.01 vs. all groups. For further statistical analysis, see text.
Journal of Neuroinflammation 2007, 4:6 />Page 9 of 10
(page number not for citation purposes)
cells can adoptively transfer EAE [26]. Transgenic mice
that ectopically express IFN-γ in the CNS display a tremo-
ring phenotype and myelin abnormalities [27] as well as
increased susceptibility to EAE [28].
The foregoing results indicate the occurrence of a signifi-
cant decrease in splenic, lymph node and thymus IFN-γ
production in severely calorie-restricted rats, thus agreeing
with observations indicating that, in autoimmune-prone
mice, calorie restriction lowers mRNA expression of this
cytokine [29], and that in young mice with experimental
colitis, caloric restriction augments NK cytotoxicity and
decreases IFN-γ levels [21].
It must be noted, however, that there is conflicting evi-
dence as to whether IFN-γ provides a disease-reducing role
in immune-mediated demyelinating disorders. The
administration of antibodies to IFN-γ enhances the sever-
ity of EAE, whereas treatment of mice experiencing EAE
with IFN-γ results in improved survival [30,31]. It has also
been shown that mice with a mutation in either the gene
encoding IFN-γ or its receptor are susceptible to EAE and
that mouse strains that are normally resistant to EAE
become susceptible when incapable of synthesizing or
responding to this cytokine [32,33]. Clearly, the role that
IFN-γ plays in demyelinating disorders is complex.
Summarizing, the present results are compatible with the
view that the acute phase of EAE can be significantly cur-
tailed by severe calorie restriction, presumably through an
impaired IFN-γ production. The immunological status of
rodents fed a calorie-restricted diet is superior to the
IFN-γ release from splenic, SmLN and thymic cells of control and calorie-restricted ratsFigure 6
IFN-γ release from splenic, SmLN and thymic cells of control and calorie-restricted rats. Data shown as mean ± SEM (n = 7
rats/group). Letters indicate the existence of significant differences between groups after a one-way ANOVA followed by a
Bonferroni's test, as follows:
a
p < 0.01 vs. control and 33 % calorie-restricted rats, both injected with SCH;
b
p < 0.02 vs. 33%
calorie-restricted rats injected with SCH;
c
p < 0.02 vs. control rats injected with SCH;
d
p < 0.01 vs. control and 33% calorie-
restricted rats regardless of SCH injection. For further statistical analysis, see text.
Journal of Neuroinflammation 2007, 4:6 />Page 10 of 10
(page number not for citation purposes)
immunological status of the non-restricted animals and
through this mechanism caloric restriction may retard
EAE development. Indeed, experimental calorie restric-
tion (e.g. 25–50 % reduction of caloric intake), without
deficiency in essential nutrients, may be a useful manipu-
lation in slowing MS evolution [1].
However, caution should be taken in extrapolating the
present experimental results to the clinical situation in
view of the fact that monophasic EAE, particularly in the
Lewis rat model, is a disease that shares only some aspects
of human MS. In addition, EAE is defined in the present
study on clinical grounds only and further histopatholog-
ical and immunological examination of the brain is
needed before a clear picture on what is happening in cal-
orie restricted rats during EAE is obtained.
Competing interests
The authors declare that they have no competing interests.
Authors' contributions
AIE, PC, VJ-O and MPF-M carried out the experiments.
DPC and AIE designed the experiments. Also, DPC per-
formed the statistical analysis and drafted the manuscript.
All authors read and approved the final manuscript.
Acknowledgements
This work was supported by grants from FISS Madrid, Spain, Agencia
Nacional de Promoción Científica y Tecnológica, Argentina (PICT 14087)
and the Universidad de Buenos Aires (ME 075). DPC is a Research Career
Awarded from the Argentine Research Council (CONICET).
References
1. Schwarz S, Leweling H: Multiple sclerosis and nutrition. Mult
Scler 2005, 11:24-32.
2. Poser CM: The epidemiology of multiple sclerosis: a general
overview. Ann Neurol 1994, 36(Suppl 2):S180-S193.
3. Lauer K: Diet and multiple sclerosis. Neurology 1997, 49:S55-S61.
4. Swank RL, Lerstad O, Strom A, Backer J: Multiple sclerosis in rural
Norway its geographic and occupational incidence in rela-
tion to nutrition. N Engl J Med 1952, 246:722-728.
5. Alter M, Yamoor M, Harshe M: Multiple sclerosis and nutrition.
Arch Neurol 1974, 31:267-272.
6. Lauer K: The risk of multiple sclerosis in the U.S.A. in relation
to sociogeographic features: a factor-analytic study. J Clin Epi-
demiol 1994, 47:43-48.
7. Swank RL, Goodwin J: Review of MS patient survival on a Swank
low saturated fat diet. Nutrition 2003, 19:161-162.
8. Swank RL, Goodwin JW: How saturated fats may be a causative
factor in multiple sclerosis and other diseases. Nutrition 2003,
19:478.
9. Coyle PK: The neuroimmunology of multiple sclerosis. Adv
Neuroimmunol 1996, 6:143-154.
10. Wekerle H, Kojima K, Lannes-Vieira J, Lassmann H, Linington C: Ani-
mal models. Ann Neurol 1994, 36(Suppl):S47-S53.
11. Esquifino AI, Cano P, Jimenez V, Cutrera RA, Cardinali DP: Experi-
mental allergic encephalomyelitis in male Lewis rats sub-
jected to calorie restriction. J Physiol Biochem 2004, 60:245-252.
12. Pugh TD, Klopp RG, Weindruch R: Controlling caloric consump-
tion: protocols for rodents and rhesus monkeys. Neurobiol
Aging 1999, 20:157-165.
13. Reeves PH, Nielsen FH, Fahey GC: AIN-93 purified diets for lab-
oratory Rodents: Final report of the American Institute of
Nutrition Ad Hoc Writing Committee on the Reformulation
of the AIN-76 Rodent diet. J Nutr 1993, 123:1939-1951.
14. Esquifino AI, Selgas L, Arce A, Della Maggiore V, Cardinali DP:
Twenty four hour rhythms in immune responses in rat sub-
maxillary lymph nodes and spleen. Effect of cyclosporine.
Brain Behav Immun 1996, 10:92-102.
15. Castrillon P, Esquifino AI, Varas A, Zapata A, Cutrera RA, Cardinali
DP: Effect of melatonin treatment on 24-hour variations in
responses to mitogens and lymphocyte subset populations in
rat submaxillary lymph nodes. J Neuroendocrinol 2000,
12:758-765.
16. Castrillon P, Cardinali DP, Arce A, Cutrera RA, Esquifino AI: Inter-
feron-gamma release in sympathetically-denervated rat sub-
maxillary lymph nodes. Neuroimmunomodulation 2000, 8:197-202.
17. Tian L, Cai Q, Bowen R, Wei H: Effects of caloric restriction on
age-related oxidative modifications of macromolecules and
lymphocyte proliferation in rats. Free Radic Biol Med 1995,
19:859-865.
18. Yu BP, Chung HY: Stress resistance by caloric restriction for
longevity. Ann N Y Acad Sci 2001, 928:39-47.
19. Pahlavani MA: Influence of Caloric Restriction on Aging
Immune System. J Nutr Health Aging 2004, 8:38-47.
20. Spaulding CC, Walford RL, Effros RB: The accumulation of non-
replicative, non-functional, senescent T cells with age is
avoided in calorically restricted mice by an enhancement of
T cell apoptosis. Mech Ageing Dev 1997, 93:25-33.
21. Shibolet O, Alper R, Avraham Y, Berry EM, Ilan Y: Immunomodu-
lation of experimental colitis via caloric restriction: role of
Nk1.1+ T cells. Clin Immunol 2002, 105:48-56.
22. Esquifino AI, Chacon F, Cano P, Marcos A, Cutrera RA, Cardinali DP:
24-Hour rhythms of mitogenic responses, lymphocyte sub-
set populations and amino acid content in submaxillary
lymph nodes of growin male rats subjected to calorie restric-
tion. Journal of Neuroimmunology 2004, 156:66-73.
23. Benveniste EN, Benos DJ: TNF-alpha- and IFN-gamma-medi-
ated signal transduction pathways: effects on glial cell gene
expression and function. FASEB J 1995, 9:1577-1584.
24. Popko B, Corbin JG, Baerwald KD, Dupree J, Garcia AM: The
effects of interferon-gamma on the central nervous system.
Mol Neurobiol 1997, 14:19-35.
25. Panitch HS: Interferons in multiple sclerosis. A review of the
evidence. Drugs 1992, 44:946-962.
26. Martin R, McFarland HF: Immunological aspects of experimen-
tal allergic encephalomyelitis and multiple sclerosis. Crit Rev
Clin Lab Sci 1995, 32:121-182.
27. Corbin JG, Kelly D, Rath EM, Baerwald KD, Suzuki K, Popko B: Tar-
geted CNS expression of interferon-gamma in transgenic
mice leads to hypomyelination, reactive gliosis, and abnor-
mal cerebellar development. Mol Cell Neurosci 1996, 7:354-370.
28. Renno T, Taupin V, Bourbonniere L, Verge G, Tran E, De Simone R,
Krakowski M, Rodriguez M, Peterson A, Owens T: Interferon-
gamma in progression to chronic demyelination and neuro-
logical deficit following acute EAE. Mol Cell Neurosci 1998,
12:376-389.
29. Muthukumar AR, Jolly CA, Zaman K, Fernandes G: Calorie restric-
tion decreases proinflammatory cytokines and polymeric Ig
receptor expression in the submandibular glands of autoim-
mune prone (NZB x NZW)F1 mice. J Clin Immunol 2000,
20:354-361.
30. Billiau A, Heremans H, Vandekerckhove F, Dijkmans R, Sobis H,
Meulepas E, Carton H: Enhancement of experimental allergic
encephalomyelitis in mice by antibodies against IFN-
gamma. J Immunol 1988, 140:1506-1510.
31. Duong TT, Finkelman FD, Singh B, Strejan GH: Effect of anti-inter-
feron-gamma monoclonal antibody treatment on the devel-
opment of experimental allergic encephalomyelitis in
resistant mouse strains. J Neuroimmunol 1994, 53:101-107.
32. Ferber IA, Brocke S, Taylor-Edwards C, Ridgway W, Dinisco C, Stein-
man L, Dalton D, Fathman CG: Mice with a disrupted IFN-
gamma gene are susceptible to the induction of experimen-
tal autoimmune encephalomyelitis (EAE). J Immunol 1996,
156:5-7.
33. Willenborg DO, Fordham S, Bernard CC, Cowden WB, Ramshaw IA:
IFN-gamma plays a critical down-regulatory role in the
induction and effector phase of myelin oligodendrocyte glyc-
oprotein-induced autoimmune encephalomyelitis. J Immunol
1996, 157:3223-3227.