Advanced Topics in Mass Transfer Part 3 docx
Bạn đang xem bản rút gọn của tài liệu. Xem và tải ngay bản đầy đủ của tài liệu tại đây (1.13 MB, 40 trang )
Application of Airborne Sound Waves for Mass Transfer Enhancement
69
It is generally recognized that there three types of acoustic streamings. They differ each
other by the spatial scale on which they can spread. The acoustic streaming of the first type
is generated in an unbounded body of fluid. In this case, the streaming is a steady flow
directed away from the sonic generator in the direction of wave oscillations. As its scale can
be larger compared to the sound wavelength, it is called large-scale streaming. It is generally
agreed that the large-scale streaming originates from the sound energy absorption briefly
considered above. Under some conditions, the velocity of this type of streaming can be as
high as several m/s (Lighthill, 1978).
The acoustic streamings of the second and third types are generated in the presence of solid
obstacles (walls, particulates, etc.) placed in an acoustic field. In this case, the attenuation
occurs because of frictional dissipation between an oscillating gas volumes and solid surface
within the resulting boundary layer. The acoustic streaming of the second type is generated
outside the boundaly layer. The scale of such an outer streaming is much smaller than that
of the first type, and is equal approximately to the wavelength. The acoustic streaming of
the third type is called inner small-scale streaming because it is induced within the bounday
layer, the dimension of which is much smaller than wavelength. The effective thickness of
the boundaly layer is about 5 times larger than that of acoustic boundaly layer which is
given by the following expression
δ = (ν/ω)
0.5
(17)
where ν is the kinematic viscosity of fluid, ω is the angular frequency of sound, ω=2πf
(Zarembo, 1971).
3. Combustion and environmental control applications.
3.1 Mechanisms of mass transfer enhancements
As pointed in the above section, application of acoustic oscillations can lead to the
occurrence of several phenomena responsible for improvements in the gas-phase mass
transfer characteristics. The persistence of the acoustic effects and their magnitude should
vary from process to process depending on the gas flow pattern inside the vessel, the
presence of solid or liquid particulates as well as their size, temperature and so on.
Numerous studies have shown that when acoustic oscillations are imposed on
homogeneous flames or gas jets, the mass transfer enhancement is achieved through an
intensification of turbulent mixing and improvement in entrainment characteristics of gas
flames and jets. When a process involves chemical reactions proceeding at the surfaces of
particulate or bulk materials of another phase, both the turbulent mixing in the gas bulk and
flow at the surfaces have been found to be important in enhancing the mass transfer.
Experimental difficulties, encountered in high-temperature measurements, have motivated
researchers to conduct cold model and numerical investigations. Other studies, although not
focusing specifically on high temperature processes, have attempted to clarify the effects of
acoustic oscillations on mass and heat transfer at room temperatures. The results of both
groups of studies are of great importance for elucidating the mechanisms of mass transfer
enhancement. Of special interest are studies that examine the mass transfer at curved
surfaces like spheres and cylinders.
Advanced Topics in Mass Transfer
70
In one of the earlier study (Larsen & Jensen, 1977), evaporation rate for single drops of
distilled water was measured under sound pressure of 132~152 dB and frequency of 82~734
Hz. The drops were suspended in dry air in upward motion and subjected to a horizontal
standing wave sound field. The range of drop diameter was 0.8~2 mm. The authors used
two dimensionless numbers, the drop diameter based Reynolds number, Re and the
Strouhal number, S to correlate them with the experimentally determined Sherwood
numbers, Sh defined on the basis of drop diameter, d. The expressions for the dimensionless
numbers are given below.
0
Re
Vd
ν
=
(18)
0
d
S
ξ
= (19)
M
kd
Sh
D
=
(20)
Here, k
M
is mass transfer coefficient, D is the diffusion coefficient. The other notations are
the same as above. The Strouhal number is a dimensionless number describing the
oscillation flow around the sphere. At S < 1, Sherwood number was found to be increased
proportionally to the 0.75 power of Re/S. Since, if V
0
is kept constant, the displacement ξ
should increase with a decrease in frequency ω, these data suggest that lower frequencies
are preferable for the mass transfer enhancement at S < 1. However, as S > 1, Sherwood
number increased only with the 0.2 power of ReS
2
. This suggests that higher frequencies are
more desirable to enhance mass transfer rate at S > 1. The perhaps most interesting finding
of this work was that flow around the drops at S < 1 and S > 1 is different. In the first case,
gas flows completely around the sphere during a half-cycle of acoustic oscillation. If Re is
high enough, the gas oscillations result in separation of boundary layer followed by buildup
and shedding of eddy structures downstream of the separation points. It is assumed that
these phenomena are the main cause of the mass and transfer enhancement at S < 1. On the
other hand, when S > 1, the gas particles perform relatively small oscillations around drop
causing an acoustic streaming to occur at its surface.
In one of the recent investigations (Kawahara et al.,2000), a small glass sphere
(diam.1.6mm), covered by 0.4 to 0.6 mm thick layers of camphor or naphthalene, was
positioned at a pressure node of a ultrasonic standing wave field to determine a distribution
of the mass transfer rate over the sphere surface. Since the experiments were performed
under a very high frequency of 58 kHz, a strong acoustic streaming was generated around
the sphere that was found to be the main reason of the mass transfer enhancement. It was
shown that the mass transfer due to the acoustic streaming is a strong function of the
location on the surface being a maximum at the equator and a minimum at the poles. The
authors derived the following expression to calculate the averaged Sherwood number, Sh as
a function of the r.m.s. amplitude of gas particle velocity, B
rms
, ω and D.
1.336Re; Re
rms
B
Sh
D
ω
== (21)
Application of Airborne Sound Waves for Mass Transfer Enhancement
71
The other notations are the same as above. Notice that in their study the Reynolds number,
Re is based on the acoustic streaming velocity. Here the Strouhal number, when defined by
Eq.(19) , can be estimated to be much more than 1.
In another experimental study (Sung et al., 1994), the authors investigated mass transfer
from a circular cylinder of 25 mm in diameter positioned in a steady flow on which acoustic
pulsations were superimposed. The cylinder surface was precoated by a thin layer of
naphthalene. Contrary to the above mentioned paper (Larsen & Jensen, 1977), in this study
the directions of the steady and oscillatory flows were parallel to each other.
The pulsation
frequency was ranged from 10 to 40 Hz. The main conclusion from their results is that the
enhancement of mass transfer rate is more effective at larger pulsation amplitudes and
higher frequencies due the vortex shedding. Estimates show that the Strouhal number in
these experiments is more then 1.
A detailed analysis, both experimental and theoretical, of evaporation from acoustically
levitated droplets of various liquids was provided by Yarin et al. (Yarin et al., 1999). In their
investigation, the frequency was 56 kHz. Therefore, the Strouhal number was assumed to be
much more than unit. By plotting the Sherwood numbers against the Reynolds numbers, the
authors showed that all data fall well on a straight line that is in agreement with their
theoretical predictions. Both the Sherwood and Reynolds numbers were defined according
to Eqs.(21). It was concluded that the effect of the acoustic field on droplet evaporation
appears to be related to the acoustic streaming and squeezing of the drop by the acoustic
radiation pressure.
A great body of experimental studies has been performed regarding the effects of acoustic
oscillations on heat transfer from various geometries and surfaces. Taking into consideration
the analogy between heat and mass transfers, a brief mention of some results of these
studies will be made here. As before, our main interest is to clarify the effects of sound
intensity and frequency on the heat/mass transfer characteristics.
One of the earlier study (Fand & Cheng, 1962) examined the influence of sound on heat
transfer from a circular cylinder in the presence of a mean crossflow. In the experiments, air
was blown onto the surface of the cylinder having a diameter of 3/4 inch. Simultaneously,
the cylinder surface was exposed to high-intense acoustic oscillations at two frequencies,
1100 and 1500 Hz. The experimental data were presented as plots of α=Nu
v
/Nu
0
against the
crossflow Reynolds number, Re
cf
based on the cylinder diameter and crossflow velocity.
Here, Nu
v
and Nu
0
are the Nusselt numbers measured in the absence and presence of
acoustic oscillations, respectively. They are given as follows
0
0
v
v
hd hd
Nu Nu
λ
λ
==
(22)
where h
v
and h
0
are the heat transfer coefficients from the cylinder in the absence and
presence of acoustic oscillations, respectively, d is the cylinder diameter and λ is the thermal
conductivity. Although the authors did not mention the Strouhal number, S in their paper,
using the equations of the above sections, one can estimate S to be much more than 1.
The results of this study showed the following. At Re
cf
about 1000, which was the lowest
Re
cf
examined, a 20 per cent augmentation of α was obtained at a SPL of 146 dB regardless
of frequency. The augmentation mechanism was assumed to be an interaction similar to
thermoacoustic streaming. As Re
cf
increased to about 5000, α was reduced to 1. Then, α
increased again with Re
cf
reaching a maximum value at Re
cf
= 8000~9500 on frequency of
Advanced Topics in Mass Transfer
72
1100 Hz and at Re
cf
= 9000~11000 on frequency of 1500 Hz. In these ranges of Re
cf
, the
increase in heat transfer appears to be the result of two different interactions: (1) a resonance
interaction between the acoustic oscillations and the vortices shed from the cylinder; (2) a
modification of the flow in the laminar boundary layer on the upstream portion of the
cylinder similar to the effect of free stream turbulence. Here, the augmentation of α was
more pronounced for the case of lower frequency.
In a more recent heat transfer study (Gopinath & Harder, 2000), a preheated 5-mm cylinder
was exposed to acoustically imposed low-amplitude zero-mean oscillatory flows to
investigate the mechanisms of heat transfer from the cylinder at frequencies of 585 to 1213
Hz. Two distinct flow regimes were found to be important. The first one is the attached flow
regime which show the expected square root dependence of the Nusselt number, Nu on the
appropriate Reynolds number, Re. The second regime is predicted to be an unstable regime
in which vortex shedding is prevalent, contributing to higher transfer rates so that the Nu
number becomes proportional to Re
0.75
. These findings are in good agreement with those
reported in the above mass transfer studies.
The similar relationship between Nu and Re results has been obtained in another recent
study (Uhlenwinkel et al., 2000) on much higher frequencies, 10 and 20 kHz. The heat
transfer rate was determined by using cylindrical hot-film/wire probes positioned in the
acoustic field of strong standing waves. The Nusselt number was found to increase as the
0.65 power of the Reynolds numbers. The experiments revealed a 25-fold increase in the
heat transfer rate compared to that of free convection regardless of frequency in the range
examined. Because the authors used rather high displacement amplitudes of sound waves
and very small probes, the Strouhal number in their experiments should be more than unit
suggesting the above- mentioned vortex formation and shedding. This is assumed to be the
main reason of why the acoustic effect was so great in this study.
The above results can be summarized as follows. The amplitude of acoustic oscillations
plays a crucial role in the enhancement of mass transfer from objects like particles and
cylinders. That was the main reason why most of the above-mentioned effects were
observed under the resonance acoustic oscillations. The mass transfer coefficient is increased
in proportional to the 0.5~1.0 power of the velocity amplitude with a tendency for the power
to become close to 0.5 at larger Strouhal numbers (acoustic streaming controlling regime)
and to increase up to 1 at smaller Strouhal numbers (vortex shedding controlling regime).
The effect of frequency was less pronounced. Moreover, there is a lack of agreement in the
literature on the sign of this effect. There are reports showing increase, decrease and no
effect of frequency on the mass- heat transfer rates.
It is to be noted that all the above studies dealt with the objects which were fixed in position
in the acoustic fields. In actual practice, particles, no matter whether they are purposely
added or generated during a process, can be entrained in the flow of the surrounding gas.
Moreover, when the airborne particles are exposed to an acoustic field, they can be forced to
oscillate on the same frequency as the acoustic field. Both types of particle motion can affect
the mass transfer rate remarkably. However, because of the great experimental difficulties,
to the best of our knowledge there have not been any experimental studies in this area.
3.2 Improvements in fuel combustion efficiency
These above-mentioned and other findings have motivated extensive research on the
application of acoustic oscillations to improve the process performances in combustion,
environmental and waste treatment technologies. The results obtained have strongly
Application of Airborne Sound Waves for Mass Transfer Enhancement
73
suggested that acoustic oscillations offer very attractive possibilities for designing novel
processes with improved combustion efficiency and low pollutant emission. These findings
would be of considerable interest for experts dealing with such energy intensive industrial
processes as metallurgy, material recycling and waste treatment. Below is a brief survey of
some recent results presenting the acoustic effects on the combustion efficiency and
pollutant emission.
The results of one of the first study in this field (Kumagai & Isoda, 1955) revealed that an
imposition of sound vibrations on a steady air flow yields about 15% augmentation of a
single fuel droplet burning rate compared to the conventional one. The sound effects was
found to be independent of the vibration frequency. More recently, Blaszczyk (Blaszczyk,
1991) investigated combustion of acoustically distributed fuel droplets under various
frequencies. The conclusion was that about 14% increase in fuel combustion rate can be
achieved at the 120~300 Hz frequency range despite the sound intensity was relatively low,
100~115 dB.
The influence of acoustic field on the evaporation/combustion rates of a kerosene single fuel
droplet was investigated experimentally under standing wave conditions (Saito et al., 1994).
The authors concluded that the rate increased by 2~3 times when the droplet was fixed at a
velocity antinode position of the wave at frequencies < 100 Hz and relatively low sound
pressure levels of 100 ~110 dB.
Effects of acoustic oscillations on evaporation rate of methanol droplets (diam.50~150 μm) at
room temperatures were investigated in another study (Sujith et al., 2000). The authors
found that a 100% increase in the evaporation rate can be obtained only in the presence of a
high intense acoustic field at a SPL of 160 dB. There was a weak tendency toward an
increase of the effect with frequency ranging from 410 to 1240 Hz. It is to be note that most
of the above data support the mechanism in which the obtained enhancement of liquid fuel
combustion occurs due to a better mixing between the fuel vapor and oxidant at the droplet
interface.
Approximatelly the same effects of acoustics were found on the combustion of solid fuel
particles. Yavuzkurt et al. (Yavuzkurt et.al., 1991a) investigated the effect of an acoustic field
on the combustion of coal particles in a flame burner by injecting the particles of 20~70 μm
into the burning gas stream and by monitoring the light intensity emitted from the flame.
Averaged values of light intensity were 2.5~3.5 times higher at SPL of 145~150 dB and
frequency of 2000 Hz compared to those without sound application. Additionally, the
authors performed a numerical simulation of combustion phenomena of 100-μm coal
particles, the results of which revealed 15.7 and 30.2 percent decreases in the char burn-out
time at frequency of 2000 Hz and sound intensity levels of 160 and 170 dB, respectively
(Yavuzkurt et.al., 1991b). The main reason for the char burning enhancement is that the
high-intensity acoustic field induces an oscillating slip velocity over the coal particles which
augments the heat and mass transfer rates at the particle surface.
Four loudspeakers were used to apply an acoustic field to 125-μm black liquor solid
particles, injected into a reactor tube at a gas temperature of 550
O
C (Koepke & Zhu, 1998).
The intensity of the field was 151 dB, frequency was ranged from 300 to 1000 Hz. The results
revealed a 10 percent reduction of char yield compared with that obtained without acoustic
field application. Besides, significantly increased yields of product gases CO and CO
2
were
also observed with acoustic treatment. On the whole, the results revealed that the acoustic
effects were more pronounced for the initial period of particle heat-up. The above two
works (Yavuzkurt et.al., 1991a; Koepke & Zhu, 1998) also include brief overviews of earlier
publications on the acoustically improved fuel combustion.
Advanced Topics in Mass Transfer
74
3.3 Reduction of combustion-related pollutant emission
In parallel with the combustion enhancement, forced acoustic oscillations provide a way to
significantly reduce emission of such pollutions as NO
x
,CO and soot particulates. Especially,
a large body of literature has been published on suppressing the NO
x
formation due to
acoustically or mechanically imposed oscillations. Good reviews on this topic can be found
in the relevant literature, for example (Hardalupas & Selbach, 2002; Mcquay et al., 1998;
Delabroy et al., 1996). NO
x
reduction level was found to be strongly dependent on the
experimental conditions. The reported values are ranged from 100%( Delabroy et al.,1996) to
15% (Keller et al.,1994) decrease in NO
x
emission rate as compared with that for steady flow
conditions. The suppression mechanism has been well established. A sound wave, being
propagated through a gas, can be thought as turbulent flow fluctuations of certain scale and
amplitude which are governed by the wave frequency and intensity, respectively. Thus,
imposing acoustic oscillations on flame front enhances the turbulent mixing resulting in
reduced peak temperatures at the front that, in turn, is the reason of reduced emission of
thermal NO
x
. When acoustic field is imposed upon flame containing liquid/solid particles,
oscillations of gas around the particles provide an additional mechanism of the peak
temperature reduction due to convection. One more reason of low NO
x
emission is that high
amplitude acoustic oscillations induce a strong recirculation of flue gas inside the
combustion chamber. This results in entrainment of the already formed NO
x
into the flame
zone where NO
x
is reduced by hydrocarbon radicals homogeneously or heterogeneously on
the surface of carbonaceous solid particles.
The same mechanism causes lowering of emission of CO and other gaseous pollutants
although the literature on this subject is much less than that on the NO
x
emission control.
For example, a large decrease in NO and CO emissions was observed in the presence of
acoustic oscillations imposed to an ethanol flame in a Rujke tube pulse combustor (Mcquay
et al., 1998). Taking concentration values at steady conditions as a reference, the decreases
were 52 ~100% for NO and 53~90% for CO depending on SPL (136 to 146 dB), frequency(80
to 240 Hz) and excess air (10 to 50%). Another example is the work (Keller et al., 1994) the
authors of which obtained emissions levels of a premixed methane-air flame below 5 ppm
for NO
x
and CO.
Few studies
examined the effect of forced acoustics on soot emission from different types of
flame: a spray ethanol flame of a Rijke tube combustor (Mcquay et al., 1998), acetylene (Saito
et al.,1998) and methane diffusion flames (Demare & Baillot, 2004; Hertzberg, 1997). The
oscillation frequencies were also different: 200 Hz (Demare & Baillot, 2004
)
, 40~240 Hz
(Mcquay et al., 1998), < 100 Hz (Saito et al., 1998) and 40~1000 Hz (Hertzberg, 1997). In spite
of such different conditions, all the authors reported full disappearance of soot emission
from the flames with acoustic excitation. The results of these studies suggested that acoustic
oscillations enhance the mixing of fuel and ambient gas that causes a re-oxidation of soot
particles at the flame zone.
4. Pyrometallurgical applications
Another promising area of airborne sonoprocessing is pyrometallurgy. As has been
mentioned in the introductory section, several important chemical reactions in
pyrometallurgical processes occur at the interface between gas and molten bath under gas-
phase mass-transfer control. An important feature of these processes is that many of them
use a high speed gas jet to promote the chemical reactions between the gas and molten
Application of Airborne Sound Waves for Mass Transfer Enhancement
75
metal. Taken together, these features provide the basis for designing a low-cost and high-
performance method of sonoprocessing.
The first attempt to use the energy of sound waves for enhancing the rates of
pyrometallurgical processes was made in the former Soviet Union in the steelmaking
industry. High-intense acoustic oscillations were applied to a basic oxygen converter, that is
the most powerful and effective steelmaking process. For a better understanding of the
following discussion, the main features of converter process will be explained in more
details.
A schematic diagram of a converter process is shown in Figure 3. Iron-based solid scrap and
molten pig iron containing 4%C, 0.2~0.8%Si, minor amount of P and S, are charged into a
barrel-shaped vessel. Capacity of the vessel can be as large as 400 tons. Fluxes (burnt lime or
dolomite) are also fed into the vessel to form slag, which absorbs impurities of P and S from
scrap and iron. A supersonic jet of pure oxygen (1) is blown onto the molten bath (2)
through a water-cooled oxygen lance (3) to reduce the content of carbon, dissolved in the
molten metal, to a level of 0.3~0.6% depending on steel grade. For a high efficiency of the
process, the oxygen flow rate must be very high, several normal cubic meters per minute per
ton of steel. Impingement of such a high-speed jet upon the molten metal bath is attended
by deformation of its surface producing a pulsating crater in the molten metal and causing
splashing of the metal at the crater zone as schematically shown in Fig. 3. Typically, the
process takes about 20 minutes.
Fig. 3. A schematic representation of converter process.
The oxidation of carbon, which is often termed decarburization, is the main reaction in
converter process. The decarburization reaction can proceed in two possible ways. The first
one is the direct oxidation by gaseous oxygen according to
[C] + 0.5O
2
= CO (23)
The second way is the indirect oxidation via formation of iron oxide according to
[Fe] + 0.5O
2
= (FeO) (24)
(FeO) + [C] = [Fe] + CO (25)
Here, parentheses and square brackets denote matters dissolved in the slag and metal,
respectively. The reactions (23) occurs under the gas-phase mass transfer control. The
reaction (24) is controlled by mass transfer of oxygen in both the gas and liquid phases. The
Advanced Topics in Mass Transfer
76
decarburization reaction occurs with a vigorous evolution of CO gas. As a results the slag
is foamed and the lance tip becomes submerged into the metal-slag emulsion.
In an attempt to enhance the gas-phase mass transfer rate, an acoustically assisted converter
process has been tested. In the process, a pneumatic sonic generator of the Hartmann type
was built in the tip of a oxygen lance of a 10-t pilot converter (Blinov, 1991; Blinov &
Komarov, 1994). Hence, the sound waves (4) propagated to the molten bath through the gas
phase inside the converter as shown in Fig. 3. Design and operating principle of the
Hartmann generators was briefly described in our previous review (Komarov, 2005). For the
more details, the reader is referred to the earlier publications (Borisov, 1967; Blinov, 1991).
The working frequency of sonic generator was 10 kHz. The intensity measured at a distance
of 1 m from the generator was 150 dB.
Fig. 4. Dependence of decarburization rate on carbon content (a) and relationship between
actual and equilibrium content of phosphorus in the melt after completing the blowing
operation.
Figure 4(a) presents the decarburization rate as a function of carbon content for two oxygen
flow rates, 4(1,2) and 7(3,4) Nm
3
/min⋅t and two oxygen lances: 1,2 - conventional lance, 3,4 -
acoustic lance. The shape of the curves is typical for the decarburization rate in converter
process: at the beginning, the rate increased as the carbon content reduced, passed through a
maximum and then decreased. As can be seen from this figure, there is a significant effect of
the acoustic oscillations on the decarburization rate. This effect seems to be stronger in the
intermediate stage of the process while the carbon content is ranged from 0.5 to 2.5%. In the
first and final stages of oxygen blowing operation, the effect of acoustic oscillations becomes
less pronounced. The average enhancement of decarburization rate due to the acoustic lance
application was about 40% under the given test conditions.
It is interesting to note that, in parallel with the enhancement in decarburization rate, there
also has been a rise in the efficiency of phosphorus removal from the metal as well when the
acoustic oscillations are applied. This reaction can be expressed as follows (Oeters, 1994)
[P] + 2.5(FeO)+1.5(CaO) = 0.5Ca
3
(PO
4
)
2
+ 2.5[Fe] (26)
The controlling mechanism of this reaction is more complicated compared to the
decarburization reaction, however, it is well known that higher concentrations of FeO in
slag is promote the reaction (26). Figure 4(b) is a plot of actual phosphorus concentration,
Application of Airborne Sound Waves for Mass Transfer Enhancement
77
[P]
a
versus equilibrium one, [P]
e
for conventional and acoustically assisted process. The
values of [P]
a
were measured by analyzing metal samples taken at the end of oxygen blow.
The equilibrium values were determined according to the theory of regular solution based
on the measurements of slag composition at the final stage of the blowing operation (Ban-
Ya, 1993). Figure 4(b) shows that equilibrium for the phosphorous distribution between the
metal and slag is not attained in the conventional process. This implies that a considerable
amount of phosphorus remains in the metal. However, the use of the acoustic lance for
blowing operation makes the phosphorous distribution closer to the equilibrium state, as
can be seen from Fig. 4(b). Thus, acoustic oscillations were found to be capable of improving
the efficiency of both the decarburization and phosphorus removal reactions.
To elucidate possible mechanisms of these improvements, two sets of laboratory scale
experiments have been performed. In the first one, an effect of acoustic oscillations on the
generation of drops in the above-mentioned crater zone was investigated by using cold
models. The second set was aimed at clarifying the gas-phase mass transfer mechanism
when the free surface of a liquid is exposed to acoustic oscillations. Below is some details on
the experimental procedure and results.
4.1 Generation of drops
It has been known that the intensive drop formation occurs when a gas jet impacts with the
gas-liquid interface. To investigate the drop formation a number of lances was designed to
perform cold model experiments taking into consideration of the acoustic, aerodynamic and
hydrodynamic similarity. In the experiments, the lances were installed vertically at a 0.1-m
distance from the free surface of a 0.1-m depth water bath filled in a cylindrical vessel of 0.28
m in inner diameter. Air was blown onto the bath surface to cause a crater formation and
drop generation. The drops were detached from the crater surface and carried away from
the crater by the gas flow towards the vessel wall where they were trapped by a helical
spout. Acoustic oscillations were generated using a specially designed small-scale
pneumatic sonic generator of the Hartmann type operating at a frequency of 10 kHz. The
generator was positioned above the water bath surface at such a distance that to obtain
approximately the same sound pressure level at the crater as that during the pilot converter
tests. Magnitude and frequency of turbulent oscillations was measured by using hot wire
anemometry. The sensor was fixed close to the gas-liquid interface at the places free of the
drop generation. Besides, a small hydrophone was used to measure frequency of oscillations
generated in the water bath near the crater. The hydrophone was fixed in the water bath at a
depth of 5 cm from the undisturbed free surface. More details on the experimental setup,
procedure and results can be found in the following references (Blinov, 1991; Blinov &
Komarov, 1994). Below is a brief description of the experimental results.
Magnitude of turbulent oscillations, ε
t
was in direct proportion to the gas jet speed. The
generation of drops began as ε
t
reached a threshold value, irrespective of whether the
acoustic oscillations are applied or not. There was a tendency for the threshold value to
slightly reduce with the sound wave application. In either case, once begun, the drop
generation continues with the rate rising proportionally to ε
t
. On the whole, the application
of acoustic oscillations caused the drop generation rate to increase by 20~50% depending on
the lance design.
One possible explanation for the drop generation mechanism and the acoustic effect on it is
as follows. A gas flow reflected from the interface enhances the horizontal component of
flow velocity in the liquid near the impact zone. As the gas flow velocity is very high, a high
Advanced Topics in Mass Transfer
78
level of turbulent oscillations are generated in the flow. The turbulent oscillations disturb
the gas-liquid interface that results in the formation of capillary waves. The separation of a
drop happens at the instant at which the wave amplitude exceeds a threshold value, A
c
. This
is schematically shown in Figure 5, where A denotes the amplitude of the first largest crest
of the wave. This amplitude is the following function of kinematic viscosity, ν and wave
length, λ (Tal-Figiel, 1990)
4
A
f
ν
λ
= (27)
Note that here f is the frequency of oscillations generated in water.
The drop formation becomes possible at a threshold amplitude of capillary wave, A
c
(4~7)
C
A
A≥
(28)
The length of a capillary wave can be found from the following equation (Tal-Figiel, 1990)
1
3
2
2
f
πσ
λ
ρ
⎛⎞
=
⎜⎟
⎜⎟
⎝⎠
(29)
where σ is the surface tension of liquid. Substituting this expression into formula (27)
Eq.(30) can be obtained.
1
3
2.169A
f
ρ
ν
σ
⎛⎞
=
⎜⎟
⎝⎠
(30)
The frequency, f was measured by means of the above-mentioned hydrophone.
In the absence of acoustic oscillations, f varied over a wide spectrum from 12.5 to 230 Hz,
with the fundamental frequency ranging from 135 to 200 Hz. It was found that the
fundamental frequency increases twice and more under the application of acoustic
oscillations. This phenomenon is assumed to be the main reason for the observed
enhancement in drop generation rate due to acoustic oscillations.
Fig. 5. A shematical representation of gas jet impact.
Application of Airborne Sound Waves for Mass Transfer Enhancement
79
4.2 Mechanism of acoustically enhanced mass transfer
This section presents results of a cold model study concerning the possible effects of acoustic
oscillations on the mass transfer characteristics with special emphasis on the influences of
the oscillation frequency. In the experiments, the rates of the following gas-liquid absorption
reactions were measured under different experimental conditions
2NaOH(aq) + CO
2
= Na
2
CO
3
(aq) + H
2
O (31)
2Na
2
SO
3
(aq) + O
2
= 2Na
2
SO
4
(aq) (32)
O
2
= O
2
(aq) (33)
In these equations, aq denotes aqueous solution. A distinguishing characteristic of these
reaction is that they proceed under different controlling regimes. The controlling
mechanisms of these reactions were examined experimentally. The rate of the first reaction
was found to be controlled by the interface mass transfer in both the liquid and gas phases.
The second reaction proceeded under mixed control, the chemical reaction and interface
gas-phase mass transfer. The rate of the third reaction, physical absorption of O
2
by water,
was under the interface liquid-phase mass transfer control.
Figure 6 gives some details on the experimental setup used. This figure was reproduced
from our previous paper (Komarov et al., 2007). The above-mentioned aqueous solutions or
distilled water were filled into a cylindrical acrylic vessel 0.28 m in diameter and 0.47 m in
height covered with an acrylic lid. The depth of the liquid bath was 0.2 m through all
experiments. Gas, CO
2
-N
2
mixture (reaction 31), air-N
2
mixture (reaction 32) or pure oxygen
(reaction 33), was blown onto the liquid bath surface through a vertical tube (I.D.3 mm)
fixed at the lid so that the distances between the axis lines of vessel and tube, and between
the tube end and bath free surface was 0.02 and 0.13 m, respectively. The liquid bath was
agitated by a 6 blade rotary impeller. The impeller was installed vertically at the vessel axis
line. The flow rates of blown gas and the rotation speed of impeller were relatively low
throughout these experiments. Hence, no drop generation ocurred and the area of the free
surface of liquids was assumed to remain unchangeable regardless of the experimental
conditions.
Fig. 6. Experimental setup for investigation of the acoustic effects on the mass transfer
characteristics.
Advanced Topics in Mass Transfer
80
Sound waves were generated by using a powerful loudspeaker with the following
characteristics: frequency range 70 ~ 18000 Hz, maximum input electrical power 50 W. The
loudspeaker was fixed at the vessel lid so that the its vibrating diaphragm was inclined to
the liquid free surface at an angle of about 27° as shown in Fig.6. Two broken lines show
approximately the sound beam boundaries. The probe shown in the figure was used in
order to measure the rates of reactions (31), pH probe, and (33), DO probe. Details on the
measurement procedure can be found in our earlier publication (Komarov et al., 2007).
Exposing the gas-liquid interfaces to sound waves resulted in enhancement of the rates of all
the above reactions, however the effect was different depending on the sound frequency,
sound intensity, conditions of blowing gas and impeller rotation speed. For the reaction of
CO
2
absorption, there was a tendency for the decrease in effect of acoustic oscillations as the
velocity of blown gas increases and the rotation speed of impeller decreases. At the same gas
velocity and rotation speed, the effect of sound for this reaction at a higher frequency was
greater than that at a lower one. The largest enhancement in the mass transfer coefficient
was 1.8 times at frequency of 15 kHz and gas velocity of 5 m/s. However, the frequency
influence was rather complicated. There were frequencies at which the mass transfer
coefficient peaked. Additional measurements of sound pressure level in the working space
showed that the peaks originated from resonance phenomena occurring inside the vessel at
certain frequencies.
The rate of Na
2
SO
3
absorption was also enhanced with frequency. The measurements were
performed at those frequencies where no resonance phenomena was observed. A 70%
augmentation in the absorption rate was obtained within the frequency range of 0~7 kHz at
a relatively high velocity of blowing gas, U
g
=20 m/s. Therefore, the effect of sound
application on this reaction appears to be stronger than that on the CO
2
absorption reaction.
The effect of acoustic oscillations on reaction (33) was significantly smaller as compared to
those of reactions (31) and (32). The mass transfer coefficient rose appriximately by 20% as
the oscillation frequency increased from 0 to 3 kHz. Notice that such a small effect was
obtained at the velocity of blowing gas as low as 2.4 m/s.
Therefore, these three reactions can be arranged in order of increasing effect of sound on the
reaction rates in the following way: physical absorption of oxygen by water, CO
2
absorption
by NaOH aqueous solution and oxygen absorption by Na
2
SO
3
aqueous solution. Thus, the
above experimental results suggests definitely that the main reason of the increase in the
absorption rates is an acoustically enhanced gas-phase mass transfer.
An analogy between turbulent and acoustic oscillations is thought to provide the best
explanation for the mechanisms causing the observed mass transfer enhancement. Lighthill
(Lighthill, 2001) was one of the firsts who noticed this analogy. In turbulent flows, fluid
particles perform oscillations the amplitude and frequency of which are governed mainly by
the flow velocity and the surrounding geometry. Propagation of a sound wave in a fluid
medium causes fluctuations of the fluid particles too, with the only difference that they are
oscillated at frequencies and amplitudes which are governed by the sound frequency and
intensity (or pressure), respectively. This was confirmed by the following measurement
results. Figure 7 shows the results of Fourier analysis of turbulent fluctuations generated
near the air-water free surface exposed to a sound wave at a frequency of 880 Hz. This
figure was reproduced from our previous paper (Komarov et al., 2007). The results make it
clear that the fluctuation at the frequency of sound has much higher amplitude than
fluctuations at the other frequencies. The measurements were performed at a distance of 2
mm above the surface using a highly sensitive hot-wire anemometry.
Application of Airborne Sound Waves for Mass Transfer Enhancement
81
Fig. 7. Fourier analysis results of fluctuations imposed by a sound wave
Based on the above analogy, an attempt was made to explain the effects of sound frequency
and intensity using relationships obtained for turbulent fluctuations. Omitting the
intermediate transformations, the final expression for mass transfer coefficient, k can be
written as follows
2
11
3
24
a
kScV
ω
−
∝ (34)
where Sc is the Shmidt number (=ν/D), ν and D is the kinematic viscosity and diffusion
coefficient, respectively, V
a
is the average amplitude of velocity oscillations in acoustic
boundary layer and ω is the angular frequency (=2πf). The thickness of acoustic boundary
layer,δ is determined from Eq.(17). The underlying assumptions in deriving expression (34)
were that, firstly, a viscous dissipation of acoustic oscillations occurs within the acoustic
layer; secondly, the dissipation mechanism in gas phases at the gas-liquid interface is the
same as that at the gas-solid interface. Readers interested in more detals are referred to the
above-cited paper (Komarov et al., 2007)
Thus, expression (34) shows that the gas-phase mass transfer coefficient should increase
with the one-forth power of the sound frequency. When this prediction is compared with
the above experimental results, it becomes clear that the experiments show a little weaker
frequency dependence. For example, according to the experimental results, the absorption
rates of CO
2
and O
2
increased by 1.36 and 1.44 times within frequency ranges of 3 ~15 kHz
and 1~7 kHz, respectively. However, for these frequency ranges, relationship (34) predicts
enhancement in k by 1.5 and 1.63 times, respectively. The reason of why the experiments
show less enhancement effect as compared with the predictions is that the above two
reactions are controlled by the gas-phase mass transfer rate only in part as it has been
explained in the previous sections.
Also, relationship (34) reveals that mass-transfer coefficient is proportional to the square
root of oscillatory velocity amplitude, Va, that is considered to be a characteristic of sound
field pressure. However, experimental verification of this prediction presents a considerable
difficulty under the present experimental conditions. The reason is that, since sound waves
Advanced Topics in Mass Transfer
82
propagate inside the vessel, they experience multiple reflections from both the free surface
of liquid and vessel wall that causes resonance-like phenomena. This results in appearance
of the above-mentioned maximums of mass transfer coefficient at certain frequencies, and
makes it difficult to measure the sound pressure at the free surface of water bath.
As it has been briefly mentioned above, the effect of acoustic oscillations on mass transfer
rate reduces with increasing the velocity of gas blown onto the free surface. This tendency is
readily apparent from the finding that both the gas flows and sound waves produce
turbulent oscillations at the gas-liquid interface. In high temperature processes, which use
high velocity gas jets, the turbulence level in the gas phase should be very high. Under such
conditions, the acoustic effects should be weak. Therefore, it would be interesting to
estimate the threshold amplitudes of sound waves at which they are still effective in
enhancing the gas-phase mass transfer for a given magnitude of the gas turbulent
oscillations.
These estimates were made by considering two types of turbulent diffusion coefficients at
the gas-liquid interface: that which originates from natural turbulent fluctuations of high
speed gas flow, D
t
and that which results from imposed acoustic oscillations, D
a
. The
expressions for these coefficients have been derived in the following form (Komarov et al.,
2007)
3
2
0.4
t
t
v
Dz
ρ
σ
= (35)
2
0
0.8
a
DVkz= (36)
where ρ is the density of gas, σ is the surface tension of liquid, v
t
is the characteristic
turbulent velocity, V
0
is the amplitude of oscillation velocity, k is the wave number of sound
wave and z is the distance from the liquid surface.
By equating D
t
with D
a
, one can obtain a threshold velocity amplitude of sound wave,
*
0
V at
which the effects of natural turbulence and acoustically imposed oscillations on the gas
phase mass-transfer rate are equal.
3
*
0
2
t
v
V
k
ρ
σ
= (37)
This expression suggests the following. First, in high intensity turbulent flows, the sound
waves should have very high oscillation amplitudes in order to be effective. Second, the
threshold velocity amplitude decreases with increasing the sound frequency if the other
parameters are fixed. Recall that the wave number is proportional to sound frequency as
described in the section 2.1.
Using Eq.(37), one can estimate
*
0
V for conditions of the present cold model experiments
and pilot converter tests. The estimate results are shown in Fig. 8 as plots of
*
0
V versus v
t
for
the cold model at frequencies of 1 (line 1) and 10 kHz (line 2), and for the pilot converter at a
frequency of 10 kHz (line 3), respectively. Two right vertical axes indicate the sound
intensity level (SIL) in decibel units determined according to Eq.(5). This figure was
reproduced from our previous paper (Komarov et al., 2007).
The following values of the physical properties were used in the estimates: ρ = 1.2 kg/m
3
and σ = 0.07 N/m for air-water system at 20°C, and ρ = 0.18 kg/m3 and σ = 1.4 N/m for the
Application of Airborne Sound Waves for Mass Transfer Enhancement
83
converter process including a CO gas atmosphere and molten steel at 1600°C. The sonic
speeds were taken to be equal to 340 and 860 m/s for room and high temperatures,
respectively. The shaded areas indicate the approximate ranges of the variation in v
t
and
*
0
V
. The characteristic turbulent velocity was determined assuming a 5 % level of turbulence
relative to the gas velocity at the nozzle exit. For the cold model conditions, the values of SIL
were estimated to be 110~130 dB.
Fig. 8. A plot of V
0
versus v
t
: 1 and 2 – cold model, 3 – pilot converter
Estimates of
*
0
V
for the pilot converter process, assuming that v
t
is varied in the range of 10
to 35 m/s, suggest that the acoustic oscillations can be capable of enhancing the mass-
transfer rate at sound pressure levels of 145~160 dB and frequency of 10 kHz. These
estimates appear to be consistent with the above experimental observations.
Thus, the results presented in this section allow the following conclusions to be drawn.
Application of high-intense acoustic oscillations causes the rate of decarburization reaction
to enhance. A few mechanisms appear to exist that can result in this enhancement. The first
one is the acoustically enhanced generation of drops at the crater zone where the high speed
oxygen jet impact with the molten metal bath. The metal drops are oxidized by gaseous
oxygen to FeO when flying through the crater zone. The acoustically imposed oscillations
enhance the oxidation rate of drops through the above considered intensification of
turbulent fluctuations and acoustic streaming at the drop surface. When such oxidized
drops are delivered into the slag, its oxygen potential is assumed to become higher as
compared with conventional blowing operation. As a result, the rates of decarburization
and phosphor removal are enhanced.
4. Concluding remarks
Recently, considerable research efforts have been devoted to the investigation of acoustic
oscillations for improving the performance of processes involving high and elevated
temperatures. The research results have strongly suggested that the acoustic oscillations
have the potential to enhance the efficiency of those processes, the rate of which is
controlled by gas-phase mass transfer. Examples include, but not limited to, combustion of
liquid and solid fuels, treatment of high temperature exhaust gas, steelmaking converter and
Peirce–Smith converter for the refining of cooper. At higher temperatures, attractiveness of
Advanced Topics in Mass Transfer
84
sonic and ultrasonic waves is associated with its ability to propagate through gas, and thus
to transfer the acoustic energy from a gas or water cooled ultrasonic generator to a higher
temperature area for material processing. Furthermore, if the wave intensity is high enough,
its propagation initiates such non-linear phenomena as acoustic streaming, forced
turbulence and capillary waves which are the prime causes of acoustic effects, especially at
the gas-liquid or gas-solid interfaces.
A survey reveals that amplitude of acoustic oscillations plays a crucial role in the
enhancement of gas-phase mass transfer from objects like particles and drops, while the
effect of frequency is less pronounced. According the reported results, the mass transfer
coefficient is increased in proportional to the 0.5~1.0 power of the velocity amplitude. Two
controlling regimes were found to be important: 1- acoustic streaming controlling and 2 -
vortex shedding controlling regime.
Experimental results have showed that the high-intense acoustic oscillations are capable of
enhancing the rate of gas-phase mass transfer controlling reactions in steelmaking converter
process. The following two mechanisms were found to play an important role in this
enhancement: 1- acoustically enhanced generation of molten metal drops, 2 – acoustically
intensified turbulent fluctuations and acoustic streaming at the drop surface.
Industrial competitiveness of the ultrasonic-based technologies is reinforced by relatively
low cost of the power-generating equipment. In some special cases, the acoustic energy can
be produced without any additional energy consumption by means of a comparatively
simple device. An example is the pneumatic sonic generator applied to a process which uses
gas blowing or injection.
5. References
Abramov, O. V. (1998). High-Intensity Ultrasonics : Theory and Industrial Applications, Gordon
and Breach Science Publishers, ISBN : 9789056990411, Amsterdam.
Abramov, O. V; Khorbenko, S. G. & Shvelga, S. (1984).
Ultrasonic Processing of Materials,
Mashinostroenie, Moscow, [in Russian]
Bird, R. B.; Steart, W. E. & Lightfoot E.N. (2001).
Transport Phenomena, John Wiley & Sons,
Inc., ISBN 0-471-41077-2 , New York.
Blaszczyk, J. (1991). Acoustically disturbed fuel droplet combustion.
Fuel, Vol.70,No.9, 1023-
1025 , ISSN 0016-2361.
Blinov, K. A. (1991).
Application of Acoustic Oscillations for Steelmaking Processes, Metallurgia,
Chelyabinsk, Russia, [in Russian].
Blinov, K. A. & Komarov, S. V.(1994). Liquid dispersion and fine particle coagulation in
depevopment of metallurgical processes.
Proceeding of the Second International
Symposium on Metallurgical Processes for the Year 2000 and Beyond and the 1994 TMS
Extraction and Process Metallurgy Meeting
.pp.413-427, ISBN 10 0873392418, Sxan
Diego, California, September 20-23, TMS, Warrendale, Pa.
Borisov, Yu. Ya. (1967). Hartmann type gas-jet oscillators, In : Source of Power Ultrasound,
Rozenberg L.D. (Ed.), 7-110,Nauka,Moscow [in Russian].
Carlson, J & Martinsson, P. E.(2002). A Simple Scattering Model For Measuring Particle
Mass Fractions In Multiphase Flows.
Ultrasonics, Vo.39,585-590, ISSN 0041-624X
David, J & Cheeke, N. (2003).
Fundamentals and Applications of Ultrasonic Waves, CRC
Press,ISBN 9780849301308, Boca raton.
Application of Airborne Sound Waves for Mass Transfer Enhancement
85
Delabroy, O.; Lacas, F.; Poinsot, T.; Candel, S.; Hoffmann, T.; Hermann, J.; Gleis, S. &
Vortmeyer, D .(1996). A study of NOx reduction by acoustic excitation in a liquid
fueled burner.
Combustion Science and Technology, Vol.119, 397-408, ISSN 0010-2202.
Demare, D. & Baillot, F. (2004). Acoustic enhancement of combustion in lifted nonpremixed
jet flames.
Combustion and Flame, Vol.139,No.4, 312-328, ISSN 0010-2180.
Fand,R.M. & Cheng,P.(1962). The Influence of Sound on Heat Transfer from a Cylinder in
Crossflow.
Int.J.Heat Mass Transfer, Vo.6, 571-596, ISSN 0017-9310.
Gopinath,A. & Mills, A.F.(1994). Convective Heat Transfer Due to Acoustic Streaming Across
the Ends of Kundt Tube.
Journal of Heat Tranfer,Vo.116, 47-53, ISSN 1528-8943
Hamilton, M. F & Blackstock, D. T. (1998).
Nonlinear Acoustics, Theory and Applications,
Academic Press, ISBN : 0123218608 , California
Hardalupas, Y. & Selbach, A. (2002). Imposed oscillations and non-premixed flames, Prog
Energ Combust, Vol.28, 75-104, ISSN 0360-1285.
Hertzberg, J. (1997). Conditions for a Split Diffusion Flame.
Combustion and Flame, Vol.109,
314-322, ISSN 0010-2180.
Hueter, T. F. & Bolt, R. H. (1966).
Sonics, John & Sons, Inc., ISBN, New York
Kawahara, N.; Yarin, A. L.; Brenn, G.; Kastner, O. & Durst, F. (2000). Effect of acoustic
streaming on the mass transfer from a sublimating sphere.
Physics of Fluids,
Vo.12.,No.4 ,912-923, ISSN 1070-6631.
Keller, J. O.; Bramlette, T. T.; Barr P.K. & Alvarez J. R.(1994). NO
x
and CO emissions from a
pulse combustor operating in a lean premixed mode.
Combustion and Flame, Vol.99,
460-466, ISSN 0010-2180.
Koepke, S. A & Zhu, J. Y. (1998). Pyrolysis of Black Liquor in a High-intensity Acoustic
Field.
Combustion Science and Technology, Vol.140, 315-331, ISSN 0010-2202.
Komarov,S.V.; Kuwabara, M.& and Abramov, O.V. (2005). High Power Ultrasonics in
Pyrometallurgy: Current Status and Recent Developments.
ISIJ International, Vol.
45, 1765-1782, ISSN 0915-1559.
Komarov, S. V.; Noriki, N.; Osada, K.; Kuwabara, M. & Sano, M. (2007). Cold Model Study
on Mass-Transfer Enhancement at Gas-Liquid Interfaces Exposed to Sound Waves.
Metallurgical and Materials Transactions, Vol.38B, 809-818, ISSN 1073-5615
Kumagai, S. & Isoda, H. (1955). Combustion of Fuel Droplets in a Vibrating Air Field.
Proceeding the Fifth International Symposium on Combustion
, pp.129-132, Pittsburgh,
May 1955, Reinhold Publishing, New York.
Landau, L. D & Lifshits, E. M. (1986).
Fluid Mechanics, Nauka, Moscow,Russia [in Russian].
Larsen, P. S. & Jensen, J. W.(1977). Evaporation Rates of Drops in Forced Convection with
Superposed Transverse Sound Field.
Int.J.Heat Mass Transfer, Vo.21, 511-517, ISSN
0017-9310.
Leighton, T. G. (2004). From seas to surgeries, from babbling brooks to baby scans: The
acoustics of gas bubbles in liquids.
International Journal of Modern Physics B., Vol.18,
3267-3314, ISSN 0217-9792.
Lighthill, J. (1978),Acoustic Streaming.
Journal of Sound and Vibration, Vo.61, No.3, 391-418,
ISSN 0022-460X.Lighthill,J. (2001),
Waves in Fluids, Cambridge University Press,
ISBN 0-521-01045-4, Cambridge.
Loh, B. G. & Lee D. R. (2004). Heat Trabsfer Characteristics of Acoustic Streaming by
Longitudinal Ultrasonic Vibration.
J Thermophys Heat Tran, Vo.18, No.1, 94-99, ISSN
0887-8722
Advanced Topics in Mass Transfer
86
Makarov, S. & Ochmann, M. (1996). Non-linear and thermoviscous phenomena in acoustics.
Part I.
Acustica, Vol.82, 579-606, ISSN 00017884 .
Makarov, S. & Ochmann,M.(1997). Non-linear and thermoviscous phenomena in acoustics.
Part II.
Acustica, Vol.83, 197-222, ISSN 00017884.
Margulis, M.A. (1995).
Sonochemistry and Cavitation, Taylor & Francis, ISBN: 978-2881248498,
Amsterdam.
Mason, W. P. & Thurston, R. N. (1965).
Physical Acoustics, Vol.4, Part B, Academic Press Inc.,
New York.
Mcquay, M. Q.; Dubey, R. K. & Nazeer, W. A. (1998). An experimental study on the impact
of acoustics and spray quality on the emissions of CO and NO from an ethanol
spray flame.
Fuel, Vol.77, 425-435, ISSN 0016-2361.
Mednikov, E. P. (1965).
Acoustic coagulation and precipitation of aerosols (authorized translation
from the Russian by Chas V. Larrick), USSR Academy of Sciences Press, Moscow.
Oeters, F. (1994).
Metallurgy of Steelmaking. pp.47-54, Stahleisen, Dusseldorf
Rayleigh, J. W. S. (1945).
Theory of Sound, Vol.1,2. Dover Publications, N.Y.
Saito, M.; Sato, M. & Suzuki, I. (1994). Evaporation and combustion of a single fuel droplet
in acoustic fields.
Fuel, Vol.73, No.3, 349-353 , ISSN 0016-2361.
Saito, M.; Sato, M. & Nishimura, A. (1998). Soot suppression by acoustic oscillated
combustion.
Fuel, Vol.77, No.9-10, 973-978, ISSN 0016-2361.
Sujith, R. I.; Waldherr, G. A.; Jagoda, J. I. & Zinn, B. T. (2000). Experimental Investigation of
the Evaporation of Droplets in Axial Acoustic Fields,
Journal of Propulsion and Power,
Vo.16, 278-285, ISSN 0748-4658.
Sung, H. J.; Hwang, K. S. & Hyun, J.M. (1994). Experimental Stydy on Mass Transfer from a
Circular Cylinder in Pulsating Flow.
Int.J.Heat Mass Transfer, Vo.37, No.15, 2203-
2210, ISSN 0017-9310.
Tal-Figiel, B. (1990). Conditions for instability of the liquid-liquid interface in a ultrasoinc
field.
International Chemical Engineering, Vo.30, No.3, 526-534, ISSN 1385-8947.
Temkin, S.(1998).Sound propagation in dilute suspensions of rigid particles.
J. Acoust.
Soc.Am
, Vol.103, No.2,838-849, ISSN 0001-4966
Uhlenwinkel, V.; Meng, R. & Bauckhage, K. (2000). Investigation on heat transfer from
circular cylinders in high power 10 kHz and 20 kHz acoustic resonant fields.
Int.J.Therm.Sci., Vo.39, 771-779, ISSN 1290-0729.
Vainstein, P.; Fichman, M. & Gutfinger, C.(1995). Acoustic Enhancement of heat transfer
between two parallel plates.
Int.J.Heat Mass Transfer, Vo.38, No.10, 1893-1899, ISSN
0017-9310
Yarin, A. L.; Brenn, G.; Kastner, O.; Rensink, D. & Tropea, C. (1999). Evaporation of
acoustically levitated droplets.
J. Fluid Mech., Vol.399, 151-204, ISSN 0022-1120.
Yavuzkurt, S.; Ha, M. Y.; Koopman, K. & Scaroni, A. W. (1991,a). A Model of the
Enhancement of Coal Combustion Using High-Intensity Acoustic Fields.
Journal of
Energy Resources Technology
, Vol.113, No.4, 277-285, ISSN 0195-0738.
Yavuzkurt, S.; Ha, M. Y.; Reethof, G.; Koopmann, G. & Scaroni, A. W.(1991,b). Effect of an
acoustic field on the combustion of coal particles in a flat flame burner.
Journal of
Energy Resources Technology,
Vol.113, Vol.4, 286-293, ISSN 0195-0738.
Zarembo, L. K. (1971). Acoustic streaming. In :
High-Intensity Ultrasonic Fields, Rozenberg
L.D. (Ed.), 137-199, Plenum, New York.
5
Mass-transfer in the Dusty Plasma
as a Strongly Coupled Dissipative System:
Simulations and Experiments
Xeniya Koss, Olga Vaulina, Oleg Petrov and Vladimir Fortov
Institution of Russian Academy of Sciences
Joint Institute for High Temperatures RAS
Russia
1. Introduction
The problems associated with the mass-transfer processes in dissipative systems of
interacting particles are of great interest in various fields of science (plasma physics, medical
industry, physics and chemistry of polymers, etc.) (Frenkel, 1946; Cummins & Pike, 1974;
Balescu, 1975; March & Tosi, 1995; Ovchinnikov et al., 1989; Dodd et al., 1982; Thomas &
Morfill, 1996; Fortov et al., 1996; Fortov et al., 1999). Nevertheless, the hydrodynamic
approaches can successfully describe these processes only in the case of the short-range
interactions between particles. The main problem involved in studies of non-ideal systems is
associated with the absence of an analytical theory of liquid. To predict the transport
properties of non-ideal systems, the various empirical approaches and the computer
simulations of dynamics of the particles with the different models for potentials of their
interaction are used (Frenkel, 1946; Cummins & Pike, 1974; Balescu, 1975; March & Tosi,
1995; Ovchinnikov et al., 1989). The simulations of transport processes are commonly
performed by methods of molecular dynamics, which are based on solving of reversible
motion equations of particles, or Langevin equations taking into account the irreversibility
of the processes under study.
The diffusion is the basic mass-transfer process, which defines the losses of energy
(dissipation) in the system of particles and its dynamic features (such as the phase state, the
conditions of propagation of waves and the formation of instabilities). When the deviations
of the system from the statistical equilibrium are small, the kinetic coefficients of linear
dissipative processes (constants of diffusion, viscosity, thermal conductivity etc.) can be
found from Green-Kubo formulas that were established with the help of the theory of
Markovian stochastic processes under an assumption of the linear reaction of the statistical
system on its small perturbations. These formulas are the important results of the statistical
theory of irreversible processes. According to these formulas, the diffusion coefficient D can
be found from the following relationship:
0
(0) ( ) /DVVtdtm
∞
=
∫
. (1)
Advanced Topics in Mass Transfer
88
Here <V(0)V(t)> is the velocity autocorrelation function (VAF) of grains, t is the time, and m
is the dimension of the system. The diffusion coefficient can be also obtained from the
analysis of a thermal transfer of the grains through the unit area of the medium:
D =
lim
t→∞
<(Δl)
2
>/(2mt), (2)
where
Δl = Δl(t) is the displacement of an isolated particle from its initial position during the
time
t. In both equations (1), (2), the brackets < > denote the ensemble and time averaging
(the averaging over all time intervals with the duration
t). As the relationships (1)-(2) were
obtained without any assumptions on a nature of a thermal motion, they are valid for gases
as well as for liquids and solids in the case of the small deviations of the system from its
steady state condition. In the general case of non-ideal fluids, the analytical solutions of
Eqs.(1)-(2) are unavailable wich makes impossible to find the diffusion coefficient. The
simple solution,
D
≡ D
o
= T/(ν
fr
M), known as the Einstein relationship, exists only for the
non-interacting (“brownian”) particles; here
M and T are the mass and the temperature of a
grain, respectively, and
v
fr
is the friction coefficient.
Due to the existing level of experimental physics, it is necessary to go out of the bounds of
diffusion approximation, and modern methods of numerical simulation (based on the
theory of stochastic processes) allow one to make it. A description within the macroscopic
kinetics may be insufficient for the analysis of mass-transfer processes on physically small
time intervals. A study of the mass-transfer processes on short observation times is
especially important for investigation of fast processes (e.g. the propagation of shock waves
and impulse actions, or progression of front of chemical transformations in condensed
matter (Ovchinnikov et al., 1989; Dodd et al., 1982)), and also for the analysis of transport
properties of strongly dissipative media (such as colloidal solutions, plasma of combustion
products, nuclear-induced high-pressure dusty plasma (Cummins & Pike, 1974; Fortov et
al., 1996; Fortov et al., 1999)), where the long-term experiments should be carried out to
measure the diffusion coefficients correctly.
2. Mass-transfer processes in non-ideal media
Consider the particle motion in a homogeneous dissipative medium. One can find a
displacement of
j-th particle in this medium along one coordinate, x
j
= x
j
(t), under an action
of some potential
F and random F
ran
forces from the Langevin equation
2
2
jj
f
rran
dx dx
M
Mv F F
dt
dt
=− + +
. (3)
In a statistical equilibrium of system of particles (
M<(dx
j
/dt)
2
> = <MV
x
(t)
2
> ≡ T ) the mean
value of the random force is zero, <
F
ran
(t)> = 0, and its autocorrelation function
<
F
ran
(0)F
ran
(t)>= 2Вδ(t) corresponds to the delta-correlated Gaussian process, where δ(t) is
the delta-function, and
В = T
ν
fr
M (due to the fluctuation-dissipation theorem). Under these
assumptions the Eq.(1) describes the Markovian stochastic process.
To analyze a dependence of mass-transfer on the time
t, we introduce the following
functions:
D
G-K
(t) =
0
(0) ( )
t
xx
VVtdt
∫
(4a)
Mass-transfer in the Dusty Plasma
as a Strongly Coupled Dissipative System: Simulations and Experiments
89
D
msd
(t) =<( x
j
)
2
>/(2t) (4b)
where
V
x
(t)=dx
j
/dt is the velocity of a j-th particle. With the small deviations of the system
from the equilibrium state, both functions (
D
G-K
(t) and D
msd
(t)) with t → ∞ should tend to the
same constant
D = lim ( )
t
Dt
→∞
, which corresponds to the standard definition of diffusion
coefficient.
Neglecting the interparticle interaction (
F = 0: the case of “brownian” particles), one can find
the VAF, using the formal solution of Eq.(3) under assumption of <
F
ran
(t) V
x
(0)> = 0
(Cummins & Pike, 1974):
()
(0) ( ) exp
xx
f
r
T
VVt t
M
ν
=−
(5)
Then the mass-transfer evolution function D
G-K
(t), Eq.(4a), may be written as
(
)
(
)
0
() 1 exp
GK fr
DtD t
ν
−
=−−
(6a)
To find the mean-square displacement of a j-th particle, one should multiply Eq.(3) by x
j
.
Then, if there is no correlation between the slow particle motion and the “fast” stochastic
impact (<F
ran
x
j
>=0), the simultaneous solution of Eqs.(3), (4b) in a homogeneous medium
(M<(dx
j
/dt)
2
> ≡ T, <(Δl)
2
> = m<x
j
2
>) can be presented as (Ovchinnikov et al., 1989)
(
)
(
)
()/ 1 1 exp /
msd o
f
r
f
r
DtD t t
ν
ν
=− − −
(6b)
Thus, for the “brownian” case, when t → ∞ and v
fr
t » 1, we have D
G-K
(t) = D
msd
(t) → D
o
, and
on small time intervals (v
fr
t « 1) the motion of particles has a ballistic character:
<x
2
>≡<x
j
2
>≈T t
2
/М and D
msd
(t)= <x
2
>/(2t) ∝ t.
The analytical solution of Eq. (3) may be also obtained for an ideal crystal under assumption
that the restoring force F = - М
ω
с
2
x
j
acting on particles in lattice sites can be described by the
single characteristic frequency
ω
с
(the case of harmonic oscillator). In this case we will have
2
2
2
jj
f
rc
j
ran
dx dx
M
Mv M x F
dt
dt
ω
=− − +
(7)
After multiplying both parts of this equation by x = x
j
, rearranging and averaging, taking
into account that
0
ran
Fx
=
and M<(dx/dt)
2
> =2<V
x
(t)
2
>≡ T), we will obtain (Vaulina et al.,
2005b):
22 2
22
2
22
fr c
dx dx
M
Mv M x T
dt
dt
ω
=− − +
(8)
Then the simultaneous solution of Eq.(8) and Eq. (4b) can be written as
(
)
2
1 exp( /2) cosh( ) sinh( ) /{2 }
()
2
fr fr fr
msd
o
cfr
ttt
Dt
D
t
ν
νψ νψ ψ
ξν
−− +
=
(9)
where
ψ
=(1-8
ξ
c
2
)
1/2
/2, and
ξ
c
= ω
c
/
ν
fr
. In the case of (1-8
ξ
c
2
) < 0, the
ψ
value is imaginary:
ψ
= i
ψ
*
, where
ψ
*
= (8
ξ
c
2
-1)
1/2
/2. In this case, sinh(i
ψ
*
ν
fr
t)=isin(
ψ
*
ν
fr
t), cosh(i
ψ
*
ν
fr
t)=cos(
ψ
*
ν
fr
t),
Advanced Topics in Mass Transfer
90
and the expression for D
msd
(t) function will include the trigonometric functions instead of
the hyperbolic functions.
To define VAF,
(0) ( )
xx
VVt≡ () ( )
xo xo
VtVt
τ
+ , we will use the following designations:
0
()
xo
Vt V≡
,
()
xo
Vt V
τ
+
≡
,
()
o
Xt x
=
,
()
o
Xt x x
τ
+
≡+Δ
. The Eq.(7) can be presented as two
expressions at two various instants of time (t = t
o
and t= t
o
+
τ
). Then, we can multiply the
first of them by V, and the second by V
o
, respectively. The sum of these two expressions,
averaged on the particle’s ensemble for all time intervals with the duration t =
τ
(taking into
account, that <xΔx>=0,
()( ) ()( )
ran o o fr o o
FtVt MVtVt
τ
ντ
+= +
, ()()0
ran o o
Ft Vt
τ
+=
(Cummins & Pike, 1974; Ovchinnikov et al., 1989)), can be written as
2
2
o
fr o c
dx
dVV
vVV
dt dt
ω
=− − (10)
The solution of this equation is
<V
o
V>=
22
2
1
2
dx
dt
, (11)
and the Eq.(10) may be rewritten as
2
2
2
2
oo
fr c o
dVV dVV
vVV
dt
dt
ω
=− − . (12)
Thus, in this case of harmonic oscillator, we will have for VAF
()( )
(0) ( ) exp /2 cosh( ) sinh( ) /{2 }
x x fr fr fr
T
VVt t t t
M
ν
νψ νψ ψ
=− −
(13)
and the simultaneous solution of Eq.(13) and Eq.(4a) can be written as
(
)
()
0
exp 2
()
sinh
fr
GK
fr
t
Dt
t
D
ν
ν
ψ
ψ
−
−
=⋅
. (14)
When
ψ
is imaginary, the both expressions for VAF and D
msd
(t) functions (Eqs. (13), (14))
will include the trigonometric functions instead of the hyperbolic ones (see above).
The normalized VAF, f(t) = М <V
x
(0)V
x
(t)>/Т , and mass-transfer evolution functions (D
G-
K
(t)/D
o
, D
msd
(t)/D
o
) for various values of
ξ
c
are presented in Fig. 1, where the time is given
in units of inverse friction coefficient (v
fr
-1
). It is easy to see that for short observation times a
particle in a lattice site also has the ballistic character of motion (<x
2
> ≈ T t
2
/М, D
msd
(t)=
<x
2
>/(2t) ∝ t). With the increasing time (v
fr
t » 1) both evolution functions tend to zero: D
G-
K
(t) = D
msd
(t) → 0, because for the harmonic oscillator the mean-square declination <(Δl)
2
> is
constant: <(Δl)
2
> = mT/(M
ω
с
2
).
For liquid media, the exact analytic expression for <V
x
(0)V
x
(t)>, D
G-K
(t) and D
msd
(t) can’t be
obtained. Nevertheless, we should note some features referring to the relations between the
mentioned functions, both in the case of “brownian” particles (see Eqs. (5)-(6b)) and in the
case of harmonic oscillator (see Eq. (13)), which may take place for liquids:
Mass-transfer in the Dusty Plasma
as a Strongly Coupled Dissipative System: Simulations and Experiments
91
-0,2
0,0
0,2
0,4
0,6
0,8
1,0
0,01 0,10 1,00 10,00 100,00
f
v
fr
t
1
2
3
4
5
0.0
0.2
0.4
0.6
0.8
1.0
0.01 0.10 1.00 10.00 100.00
D
msd
/D
o
v
fr
t
1
2
3
4
5
(a) (b)
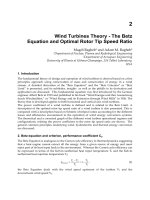
Fig. 1.
Functions f(tv
fr
) (a) and D
msd
(tv
fr
)/D
o
(b) for : 1 – ballistic mode (f(t)=1, D
msd
(t) ∝ t);
2 – “brownian” case (Eqs.(5), (6b)); and for harmonic oscillator (Eqs.(13), (9)) with the
different
ξ
с
: 3– 0.033; 4 – 0.38; 5 – 2.
D
G-K
(t) =
2
{()}
1
2
msd
dx
dtD t
dt dt
≡ , (15a)
<V
x
(0)V
x
(t)>=
22
2
22
{()}
1
2
msd
dx
dtD t
dt dt
≡ . (15b)
The mean-square displacement evolution D
msd
(t) was studied numerically in (Vaulina et al.,
2005b; Vaulina & Dranzhevski, 2006; Vaulina & Vladimirov, 2002) for non-ideal systems
with a screened Coulomb pair interaction potential (of Yukawa type):
U = (eZ)
2
exp(-r/
λ
)/r . (16)
Here r is a distance between two particles with a charge eZ, where e is an electron charge,
λ
is a screening length,
κ
= l
p
/
λ
, and l
р
is the mean interparticle distance, which is equal the
inverse square root from the surface density of particles for two-dimensional (2d-) systems,
and it is the inverse cubic root of their bulk concentration in three-dimensional (3d-) case. As
a result of numerical simulation, the characteristic frequencies for the body-centered cubic
(bcc-) lattice (
ω
с
=
ω
всс
≈ 2eZ exp(-
κ
/2)[(1+
κ
+
κ
2
/2)/( l
p
3
Mπ)]
1/2
) and for hexagonal lattice (
ω
с
=
ω
h
≈ 1.16
ω
всс
) were obtained (Vaulina et al., 2005b; Vaulina & Dranzhevski, 2006; Vaulina
& Vladimirov, 2002). It was also shown that these frequencies are responsible for the mean
time t
а
of “settled life” of particles in liquid-like systems and their values define the
evolution of mass-transfer for the observation times t < t
а
≈ 2/
ω
с
. Taking into account
Eqs.(15a)-(15b), it is easy to assume that the behavior of VAF and D
G-K
(t) for the mentioned
observation times in liquid-like Yukawa systems is also close to the behavior of these
functions for harmonic oscillator .
The dynamics of 3d- systems of particles with the various types of pair isotropic potentials
was numerically investigated in (Vaulina et al., 2004). Those potentials represented different
Advanced Topics in Mass Transfer
92
combinations of power-law and exponential functions, commonly used for simulation of
repulsion in kinetics of interacting particles (Ovchinnikov et al., 1989):
U = U
с
[b
1
exp(-
κ
1
r/l
p
)+ b
2
(l
p
/r)
n
exp(-
κ
2
r/l
p
)]. (17)
Here b
1(2)
,
κ
1(2)
= l
p
/
λ
1(2)
and n are variable parameters, and U
с
= (eZ)
2
/r is the Coulomb
potential. In the context of investigation of dusty plasma properties, the screened Coulomb
potential (16) (b
1
=1, b
2
=0,
κ
1
= l
p
/
λ
) is of particular interest. But it should be noted that the
simple model (16) agrees with numerical and experimental results in a complex plasma only
for short distances r <
λ
between two isolated macro-particles in a plasma (Konopka et al.,
1997; Daugherty et al., 1992; Allen, 1992; Montgomery et al., 1968). With increasing distance,
the effect of the screening weakens, and the asymptotic character of the potential U for large
distances r >>
λ
can follow the power-law dependence: U
∝
r
-2
(Allen, 1992) or U
∝
r
-3
(Montgomery et al., 1968); thus, the parameters of the potentials (17) will be
κ
1
= l
p
/
λ
;
κ
2
=0; n
=1-2; b
1
>>b
2
, respectively.
It was noticed that the mass-transfer processes and spatial correlation of macroparticles in
these 3d- systems are defined by the ratio of the second derivative U ” of a pair potential
U(r) in the point of the mean interparticle distance r = l
p
to the grains’ temperature T, if the
following empirical condition is met (Vaulina et al., 2004):
2π >⏐ U ’(l
p
)⏐l
p
/⏐U(l
p
)⏐> 1. (18)
In this case, the spatial correlation of particles didn’t depend on the friction (v
fr
) and was
defined by the value of effective coupling parameter Г
*
= Ml
p
2
U ”/(2T) in the range between
Γ
*
~10 and the point of crystallization of the system (Γ
*
~ 100), where for all considered cases
the formation of bcc- structure was observed with the characteristic oscillation frequency of
the grains (Vaulina et al., 2004):
ω
c
2
=
ω
всс
2
≡ 2⏐U”(l
p
)⏐/( πM). (19a)
It is to expect that the characteristic oscillation frequency in the hexagonal lattice for the
grains, interacting with the potentials (17), may be written similarly to the frequency found
for the quasi-2d- Yukawa systems (Vaulina et al., 2005b; Vaulina & Dranzhevski, 2006):
ω
c
2
=
ω
h
2
≡ 2.7⏐U ”(l
p
)⏐/( πM). (19b)
The behavior of VAFs and of the evolution functions, D
msd
(t), D
G-K
(t), are studied
numerically in the next part of this paper for quasi-2d- and 3d- non-ideal systems with the
different interaction potentials, which obey the Eqs.(17),(18).
3. Parameters of numerical simulation
The simulation was carried out by the Langevin molecular dynamics method based on the
solution of the system of differential equations with the stochastic force F
ran
, that takes into
account processes leading to the established equilibrium (stationary) temperature T of
macro-particles that characterizes kinetic energy of their random (thermal) motion. The
simulation technique is detailed in Refs. (Vaulina et al., 2005b; Vaulina & Dranzhevski, 2006;
Vaulina & Vladimirov, 2002; Vaulina et al., 2003). The considered system of N
p
motion
Mass-transfer in the Dusty Plasma
as a Strongly Coupled Dissipative System: Simulations and Experiments
93
equations (N
p
is a number of grains) included also the forces of pair interparticle interaction
F
int
and external forces F
ext
:
2
int
2
()
kj
kj
k
k
ext
f
rran
ll l
j
kj
ll
dl
dl
M
Fl F M F
dt
dt
ll
ν
=−
−
=+−+
−
∑
GG
G
G
G
G
G
G
GG
(20)
Here
()
int
U
Fl
l
∂
=−
∂
, and
k
j
lll
=
−
G
G
is the interparticle distance. To analyze the equilibrium
characteristics in the systems of particles interacting with potentials (17), the motion
equations (20) were solved with various values of effective parameters that are responsible
for the mass transfer and phase state in dissipative non-ideal systems. These parameters
were introduced by analogy with the parameters found in (Vaulina & Dranzhevski, 2006;
Vaulina & Vladimirov, 2002; Vaulina et al., 2004), namely the effective coupling parameter
Γ
*
= a
1
l
p
2
U”(l
p
)/(2T), (21)
and the scaling parameter
ξ
= ω
*
/v
fr
, where ω
*
=⏐ a
2
U”(l
p
)⏐
1/2
(2 πM)
-1/2
. (22)
Нere
a
1
= a
2
≡ 1 for 3d- systems, and a
1
= 1.5, a
2
= 2 for quasi-2d- case. The calculations were
carried out for a uniform 3d- system and for a quasi-2d- system simulating an extensive
dusty layer. The scaling parameter was varied from
ξ
≈ 0.04 to
ξ
≈ 3.6 in the range typical for
the laboratory dusty plasma in gas discharges; thus, the values of
Z were varied from 500 to
50000, the particle mass, M, was 10
-11
- 10
-8
g, and the l
p
values were ~100-1000 μm. The Г
*
value was varied from 10 to 120.
In the 3d- case the external forces were absent (
⏐F
ext
| ≡ 0), and the periodical boundary
conditions were used for all three directions
x, y and z. The greater part of calculations was
performed for 125 independent particles in a central calculated cell that was the cube with
the characteristic size
L. The length of the cell L (and the corresponding number of particles)
was chosen in accordance with the condition of a correct simulation of the system’s
dynamics:
L >> l
p
⏐U(l
p
)⏐/{⏐U ’(l
p
)⏐l
p
-⏐U(l
p
)⏐}, that satisfies the requirement of strong
reducing of the pair potential at the characteristic distance
L (Vaulina et al., 2003). So, for
example, for Yukawa potential this conditions may be presented in the form
l
p
/L <<
κ
(Totsuji et al., 1996). The potential of interparticle interaction was cut off on the distance L
cut
~ 4 l
p
, which was defined from the condition of a weak disturbance of electrical neutrality of
the system:
U ’(L
cut
) L
cut
2
<< (eZ)
2
. To prove that the results of calculation are independent of
the number of particles and the cutoff distance
L
cut
, the additional test calculations were
carried out for 512 independent particles with
L
cut
= 7 l
p
and Γ
*
= 1.5, 17.5, 25, 49 and 92.
The disagreement between the results of these calculations was within the limits of the
numerical error and didn’t exceed
± (1-3)%.
In the quasi-2d- case, the simulation was carried out for the monolayer of grains with
periodical boundary conditions in the directions
x and y. In z direction the gravitational
force
Mg, compensated by the linear electrical field E
z
=
β
z (|F
ext
| ≡ F
ext
z
= Мg - еZ
β
z), was
considered. Here
β
is the gradient of electrical field, and F
ext
x
= F
ext
y
≡ 0. The number of
independent particles in the central calculated cell was varied from 256 to 1024; accordingly,