Advances in Optical Amplifiers Part 8 docx
Bạn đang xem bản rút gọn của tài liệu. Xem và tải ngay bản đầy đủ của tài liệu tại đây (1.96 MB, 30 trang )
Under these conditions, a measurement of the small signal modal gain Γg
0
versus I will be
equivalent, owing to Eq. 44, to a determination of the modal gain Γ
¯
g versus
¯
N/τ
s
. Here, Γ is
the ratio S
act
/S of the active to modal gain areas in the SOA.
A last relationship between
¯
N
τ
s
and M
0
is then required to determine the modal gain Γ
¯
g as a
function of M
0
. It is obtained by substituting Γg(
¯
N
τ
s
) in the saturated steady state solution of
the carriers rate equation Eq. 11:
I
qLS
act
−
¯
N
τ
s
−
Γ
¯
g(
¯
N
τ
s
)
¯hω
M
0
Γ
= 0, (38)
where the injected current I is now fixed by the operating conditions.
Added to the previous relationship between Γ
¯
g and
¯
N
τ
s
, the Eq. 45 gives another expression of
Γ
¯
g as a function of
¯
N
τ
s
,
M
0
Γ
and I.Consequently,Γ
¯
g and
¯
N
τ
s
canbeknownwithrespecttothe
local intensity
M
0
(z)
Γ
and the injected current I.
To solve Eqs. 19, we need to express
¯
N as a function of
M
0
(z)
Γ
and I.Thisisequivalentto
express
¯
N with respect to
¯
N
τ
s
since
¯
N
τ
s
is known as a function of
M
0
(z)
Γ
and I.Consequently,we
model our SOA using the well-known equation:
¯
N
τ
s
= A
¯
N + B
¯
N
2
+ C
¯
N
3
, (39)
where A, B,andC, which are respectively the non-radiative, spontaneous and Auger
recombination coefficients, are the only parameters that will have to be fitted from the
experimental results.
Using Eq. 39 and the fact that we have proved that
¯
N/τ
s
and Γ
¯
g can be considered as function
of
M
0
(z)
Γ
and I only, we see that
¯
N, Γa = Γ
∂
¯
g
∂
¯
N
,and
U
s
Γ
=
¯hω
Γaτ
s
can also be considered as
functions of
M
0
(z)
Γ
and I. This permits to replace Eqs. 19 by the following system:
dM
0
dz
=
Γ
¯
g
(
M
0
(z)
Γ
, I
) −γ
M
0
, (40)
dE
1
dz
=
1
2
Γ
¯
g
(
M
0
(z)
Γ
, I
) −γ
E
1
+
1 −iα
2
ΓΔg
(
M
0
(z)
Γ
, I
)E
0
, (41)
dE
∗
−
1
dz
=
1
2
¯
g
(
M
0
(z)
Γ
, I
) −γ
E
∗
−
1
+
1 + iα
2
ΓΔg
(
M
0
(z)
Γ
, I
)E
∗
0
, (42)
with:
Δg
(
M
0
(z)
Γ
, I
)=
M
1
/U
s
(
M
0
(z)
Γ
, I)
1 + ΓM
0
/U
s
(
M
0
(z)
Γ
, I) −iΩτ
s
(
M
0
(z)
Γ
, I)
(43)
Eqs. 40, 41 and 42 are then numerically solved: Eq. 40 gives
M
0
(z)
Γ
, with the initial condition
M
0
(0)
Γ
=
√
γ
i
P
in
S
act
,whereP
in
is the optical input power.
M
0
(z)
Γ
can be then introduced into
Eqs. 41, 42. It is then possible to simulate the optical fields E
1
, E
−1
,ortheRFsignalM
1
(which
is equal either to E
∗
0
E
1
+ E
0
E
∗
−
1
,ortoE
∗
0
E
1
,ortoE
0
E
∗
−
1
, depending on the modulation format
before the photodiode).
It is important to note that the recombination coefficients A, B and C are the only fitting
parameters of this model. Once obtained from experimental data, they are fixed for any other
195
Slow and Fast Light in Semiconductor Optical Amplifiers for Microwave Photonics Applications
experimental conditions. Moreover, the only geometrical parameters that are required are the
length L of the SOA and the active area cross section S
act
. The derivation ofa predictive model,
independent of the experimental conditions (current and input optical power) is then possible,
provided that the simple measurements of the total losses and the small signal gain versus the
current are conducted. The above model lies in the fact that first, the spatial variations of
the saturation parameters are taken into account, and second, their values with respect to
the local optical power are deduced from a simple measurement. These keys ideas lead to a
very convenient model of the microwave complex transfer function of the SOA, and then of
the slow light properties of the component. It can be easily used to characterize commercial
components whose design details are usually unknown. We illustrate the accuracy and
the robustness of the model in the part 5. Lastly, it is worth mentioning that in order to
compute the complex transfer function of an architecture including a SOA and a filter, the
complex transfer function of the filter has to be then applied to the output field compounds
E
k
computed by the previous model (Dúill et al., 2010a).
4.2 Distortion model
The model we present in this part is a generalization of the former one. It enables to take
into account higher order coherent population oscillations due to large signal modulation,
or the non-linearities at the input of the SOA (from the Mach-Zehnder that modulates
the optical beam for example), and can be used to compute the harmonic generation and
the intermodulation products. The detailed model is presented in (Berger, Bourderionnet,
Alouini, Bretenaker & Dolfi, 2009).
4.2.1 Harmonic generation
In order to find the level of the generated harmonics, we first consider that the input optical
field is modulated at the RF frequency Ω.
|E|
2
, g and N are hence all time-periodic functions
with a fundamental frequency of Ω. They can therefore be written into Fourier harmonic
decompositions:
|E(z, t)|
2
=
+∞
∑
k=−∞
M
k
(z)e
−ik Ωt
, (44)
N
(z, t)=
¯
N
(z)+
+∞
∑
k=−∞
k
=0
N
k
(z)e
−ik Ωt
, (45)
g
(z, t)=
¯
g
(z)+a(z)
+∞
∑
k=−∞
k=0
N
k
(z)e
−ik Ωt
(46)
where
¯
N
(z) and
¯
g(z) respectively denote the DC components of the carrier density and of the
optical gain. a
(z) is the SOA differential gain, defined as a(z)=∂
¯
g/∂
¯
N. Defining g
k
as the
oscillating component of the gain at frequency kΩ, and considering only a finite number K of
harmonics, the carrier rate equation (Eq. 11) can be written as:
¯hω
I
qV
−
¯
N
τ
s
= α
0
¯
g
+
∑
p+q=0
p,q
∈[−K,K]
p=0
g
p
M
q
, (47)
196
Advances in Optical Amplifiers
0 = α
i
g
i
+
∑
p+k=i
p,q
∈[−K,K]
p=i
g
p
M
q
,fori = 0andi ∈ [−K, K] (48)
where α
k
= U
s
(1 + M
0
/I
s
− ikΩτ
s
),andα
0
= M
0
is the DC optical intensity. U
s
denotes
the local saturation intensity and is defined as U
s
= ¯hω/aτ
s
. It is worth mentioning that α
k
is obtained at the first order of equation (Eq. 11), when mixing terms are not considered. It
is important to note that in the following,
¯
N,
¯
g, a, τ
s
, U
s
, and consequently the α
k
’s are all
actually functions of z. Their variations along the propagation axis is then taken into account,
unlike most of the reported models in which effective parameters are used (Agrawal, 1988;
Mørk et al., 2005; Su & Chuang, 2006).
In order to preserve the predictability of the model,
¯
g, U
s
and τ
s
has to be obtained as in the
small signal case. However, in the case of a large modulation index, an iterative procedure
has to be used: in a first step, we substitute
¯
N/τ
s
, U
s
and τ
s
in (47) by their small signal values
¯
N/τ
(0)
s
, U
(0)
s
and τ
(0)
s
.Thegaincomponents
¯
g and g
k
can be then extracted from Eqs. 47 and
48. Similarly to the small signal case, using equations (39) and (47), we obtain
¯
N/τ
(1)
s
, U
(1)
s
and τ
(1)
s
as functions of I, A, B, C and M
k
(z). This procedure is repeated until convergence of
¯
N/τ
(n)
s
, U
(n)
s
and τ
(n)
s
, which typically occurs after a few tens of iterations.
The propagation equation (Eq 19) can now be expressed as:
dE
k
dz
=
1
2
(
¯
g
−γ
i
)
E
k
+
1 −iα
2
∑
p+q=k,
−K<p,q<K
Γg
p
E
q
, (49)
From these equations it is straightforward to deduce the equation for the component M
k
of the optical intensity, either if the modulation is single-sideband or double-sideband. For
numerical simulations, it is very useful to express the Eqs. 47, 48 and 49 in a matrix
formulation. The expressions can be found in (Berger, Bourderionnet, Alouini, Bretenaker
& Dolfi, 2009).
In the case of a real microwave photonics link, the harmonics at the input of the SOA, created
by the modulator, has to be taken into account. By using the reported model, the third
harmonic photodetected power, can be evaluated with:
H
3
= 2Rη
2
ph
|M
3,out
×S |
2
(50)
where R and η
ph
are respectively the photodiode resistive load (usually 50Ω) and efficiency
(assumed to be equal to 1). S denotes the SOA modal area.
4.2.2 Intermodulation distortion
Intermodulation distortion (IMD) calculation is slightly different from what has been
discussed in the above section. Indeed, the number of mixing terms that must be taken
into account is significantly higher. For radar applications a typical situation where the IMD
plays a crucial role is that of a radar emitting at a RF frequency Ω
1
, and facing a jammer
emitting at Ω
2
,closetoΩ
1
.BothΩ
1
and Ω
2
are collected by the antenna and transferred to
the optical carrier through a single electro-optic modulator. The point is then to determine the
nonlinear frequency mixing due to the CPO inside the SOA. In particular, the mixing products
at frequencies Ω
2
−Ω
1
(or Ω
1
−Ω
2
)and2Ω
2
−Ω
1
(or 2Ω
1
−Ω
2
) — respectively called second
197
Slow and Fast Light in Semiconductor Optical Amplifiers for Microwave Photonics Applications
(IMD
2
)andthird(IMD
3
) order intermodulation distortions — have to be evaluated at the
output of the SOA.
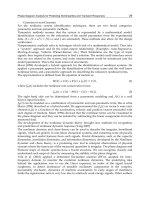
The main difference with harmonic calculation is that the optical intensity, and hence the SOA
carrier density N,andtheSOAgaing are no longer time-periodic functions of period Ω,but
also of period δΩ
= Ω
2
−Ω
1
.
−2Ω
2
−2Ω
1
−Ω
2
−Ω
1
0
Ω
1
Ω
2
2Ω
1
2Ω
2
Ω
1
+Ω
2
−Ω
1
−Ω
2
Ω
2
−Ω
1
Ω
1
−Ω
2
2Ω
2
−Ω
1
2Ω
1
−Ω
2
2(Ω
2
−Ω
1
)
2(Ω
1
−Ω
2
)
−2Ω
1
+Ω
2
−2Ω
2
+Ω
1
k=
2n+2
2n+1
2n
( )
n+2
n+1
n
n-1
( )
2
1
0
-1
-2
( )
-n+1
-n
-n-1
-n-2
( )
-2n
-2n-1
-2n-2
M=
M
block,−2
M
block,−1
M
block,0
M
block,1
M
block,2
RF
fre quency
Fig. 9. Set of significant spectral components of |E|
2
, N and g, and associated index k in their
Fourier decompositions. n is defined such as Ω
1
= nδΩ. Graph extracted from (Berger,
Bourderionnet, Alouini, Bretenaker & Dolfi, 2009).
We consider a typical radar frequency Ω
1
of 10GHz, and a frequency spacing δΩ of 10MHz.
Here, for intermodulation distortion calculation, we assume that only the spectral components
at Ω
1,2
,2Ω
1,2
, and all their first order mixing products significantly contribute to the
generation of IMD
2
and IMD
3
, as illustrated in figure 9. The M
k
’s and the g
k
’s are then
reduced in 19 elements vectors which can be gathered into blocks, the j
th
block containing
the mixing products with frequencies close to j
× Ω
1
. The Eqs. 47, 48 and 49 can be then be
written as matrices in block, and the full procedure described in the previous can be applied
in the same iterative way to determine the g
k
’s, U
s
and τ
s
, and to finally numerically solve the
equation (49). Detailed matrices are presented in (Berger, Bourderionnet, Alouini, Bretenaker
& Dolfi, 2009). Similarly to equation (50), the photodetected RF power at 2Ω
2
− Ω
1
is then
calculated through:
IMD
3
= 2Rη
2
ph
|M
out
2Ω
2
−Ω
1
×S |
2
. (51)
We explained in this section how to adapt the predictive small-signal model including
dynamic saturation, in order to compute the harmonics and the intermodulation products,
while keeping the accuracy and predictability of the model. It is worth noticing that in a
general way, the propagation of the Fourier compounds of an optically carried microwave
signal into the SOA can be seen as resulting from an amplification process and a generation
process by frequency mixing through CPO. We will see in part 5 how these two effects, which
are in antiphase, can be advantageously used to linearize a microwave photonics link.
In order to compute the dynamic range of a microwave photonics link, the only missing
characteristic is the intensity noise.
4.3 Intensity noise
The additional intensity noise can be extracted from the model of the RF transfer function
described in section 4.1. The principle is detailed in (Berger, Alouini, Bourderionnet,
Bretenaker & Dolfi, 2009b). Indeed, when the noise is described in the semi-classical beating
198
Advances in Optical Amplifiers
theory, the fields contributing to the intensity noise are the optical carrier and the spontaneous
emission. We define the input spontaneous emission power density as the quantum noise
source at the input of SOA, which can be extracted from a measurement of the optical noise
factor. The input intensity is then composed of:
(1) a spontaneous-spontaneous beat-note which is only responsive to the optical gain.
(2) a carrier-spontaneous beat-note, which can be considered as an optical carrier and a sum
of double-sideband modulation components at the frequency Ω (Olsson, 1989). However, the
right-shifted and the blue-shifted sidebands at Ω are incoherent. Consequently, the double
sidebands at Ω has to be taken into account as two independent single-sideband modulations.
Their respective contributions to the output intensity noise can be then computed from the
model of the RF transfer function described in section 4.1. All the contributions are finally
incoherently summed.
The relative intensity noise and the noise spectral density can be then easily modeled from
the RF transfer function described in section 4.1. It is interesting to observe that first
this model leads to an accurate description of the output intensity noise (Berger, Alouini,
Bourderionnet, Bretenaker & Dolfi, 2009b). Secondly, we can show that the relative intensity
noise after a SOA (without optical filter) is proportional to the RF transfer function, leading
to an almost constant carrier-to-noise ratio with respect to the RF frequency (Berger, Alouini,
Bourderionnet, Bretenaker & Dolfi, 2009a): the dip in the gain associated to tunable delays,
does not degrade the carrier-to-noise ratio. However, it is not anymore valid when an optical
filter is added before the photodiode (Duill et al., 2010b; Lloret et al., 2010), due to the
incoherent sum of the different noise contributions.
5. Dynamic range of slow and fast light based SOA link, used as a phase shifter
We focus here on the study of a single stage phase shifter consisting of a SOA followed by an
optical notch filter (ONF), which attenuates the red shifted modulation sideband (see section
3.2). In order to be integrated in a real radar system, the influence of such an architecture on
the microwave photonics link dynamic range has to be studied. The large phase shift obtained
by red sideband filtering is however accompanied by a significant amplitude reduction of the
RF signal at the phase jump. An important issue in evaluating the merits of the filtering
approach is its effect on the linearity of the link. Indeed, similarly to the fundamental signal
whose characteristics evolve with the degree of filtering, it is expected that attenuating the
red part of the spectrum should affect the nonlinear behavior of the CPO based phase shifter.
The nonlinearity we consider here is the third order intermodulation product (IMD3). This
nonlinearity accounts for the nonlinear mixing between neighboring frequencies f
1
and f
2
of
the RF spectrum, and refers to the detected RF power at frequencies 2 f
2
− f
1
and 2 f
1
− f
2
.
Since these two frequencies are close to f
1
and f
2
, this quantity is of particular importance in
radar and analog transmission applications, where IMD3 is the dominant detrimental effect
for MWP links (Ackerman, 1994).
To this aim, the predictions of the model presented in the previous part are compared with
experimental results (RF complex transfer function, intermodulation products IMD3). Then
we use our predictive model to find out the guidelines to optimize a microwave photonics
link including a SOA based phase shifter.
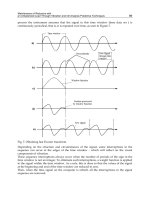
5.1 Experimental confirmation of the model predictions
The experimental set-up for IMD3 measurement is depicted on Fig. 10. The RF tones are
generated by two RF synthesizers at f
1
= 10 GHz and f
2
= 10.01 GHz. The two RF signals are
199
Slow and Fast Light in Semiconductor Optical Amplifiers for Microwave Photonics Applications
200 400 600200 400 600200 400 600
SOA bias current (mA)
0 200 400 600
−120
−100
−80
−60
−40
−20
RF power (dBm)
Fundamental
IMD3
24dB20dB14.4 dB
0
50
100
150
RF phase shift (deg)
Redshifted
sideband
suppression
0.5 dB
Fig. 11. Top: RF phase shift at 10 GHz versus SOA bias current; Bottom: RF power at
fundamental frequency
1
(in blue), and at 2
2
−
1
, (IMD3, in red). From left to right,
red-shifted sideband attenuation increases from 0.5 dB to 24 dB. Symbols represent
experimental measurements, and solid lines show theoretical calculations. Extracted from
(Berger, Bourderionnet, Bretenaker, Dolfi, Dúill, Eisenstein & Alouini, 2010).
Fig. 12. In blue: Spurious Free Dynamic Range (SFDR); in green: available phase shift. Both
are represented with respect to the red sideband attenuation. The model prediction is
represented by a line, the dots are the experimental points.
201
Slow and Fast Light in Semiconductor Optical Amplifiers for Microwave Photonics Applications
5.2 Influence of the optical filtering on the performance of the phase shifter
To this aim, we compute the Spurious-Free Dynamic Range (SFDR), which is the key figure of
the dynamic range in microwave photonics (Ackerman, 1994). It is defined as the RF power
range where the intermodulation products IMD3 are below the noise floor. We represent in
Fig. 12 the SFDR and the available phase shift with respect to the red sideband attenuation.
It appears that the best trade-off between the dynamic range and the available phase shift
corresponds to the minimum strength of filtering which enables to reveal the index-gain
coupling. With this non-optimized link, we reach a SFDR of 90dB/Hz
2/3
for an available
phase shift of 100 degrees.
5.3 Linearized amplification at high frequency
In a more general context, a SOA can be used to reduces the non-linearities of a microwave
photonics link. Indeed, the input linearities (from the modulator for example) can be reduced
by the nonlinearities generated by the gain in antiphase created by the CPO. It has already
been demonstrated using a single SOA (without optical filter) at low frequency (2 GHz) (Jeon
et al., 2002)). However with a single SOA, the gain in antiphase due to CPO is created only
at low frequency (below a few GHz), as it is illustrated on Fig. 5. However, when the SOA
is followed by an optical filter attenuating the red-shifted sideband, the gain in antiphase
is created at high frequency, as it is illustrated on Fig. 7. This architecture enables then a
linearization of the microwave photonics link well beyond the inverse of the carrier lifetime.
Indeed we have experimentally demonstrated that a dip in the IMD3 occurs at 10 GHz
(Fig. 11). However the instantaneous bandwidth is still limited to the GHz range.
6. Conclusion
We have reviewed the different set-ups proposed in literature, and we have given the physical
interpretation of each architecture, aiming at helping the reader to understand the underlying
physical mechanisms.
Moreover, we have shown that a robust and predictive model can be derived in order to
simulate and understand the RF transfer function, the generation of spurious signals through
harmonic distortion and intermodulation products, and the intensity noise at the output of
a SOA. This model takes into account the dynamic saturation along the propagation in the
SOA, which can be fully characterized by a simple measurement, and only relies on material
fitting parameters, independent of the optical intensity and the injected current. In these
conditions, the model is found to be predictive and can be used to simulate commercial SOAs
as well. Moreover, we have presented a generalization of the previous model, which permits
to describe harmonic generation and intermodulation distortions in SOAs. This model uses
a rigorous expression of the gain harmonics. Lastly, we showed the possibility to use this
generalized model of the RF transfer function to describe the intensity noise at the output of
the SOA.
This useful tool enables to optimize a microwave photonics link including a SOA, by finding
the best operating conditions according to the application. To illustrate this point, the model
is used to find out the guidelines for improving the MWP link dynamic range using a SOA
followed by an optical filter, in two cases: first, for phase shifting applications, we have shown
that the best trade-off between the dynamic range and the available phase shift corresponds
to the minimum strength of filtering which enables to reveal the index-gain coupling. Second,
we have experimentally demonstrated and have theoretically explained how an architecture
202
Advances in Optical Amplifiers
composed of a SOA followed by an optical filter can reduce the non-linearities of the
modulator, at high frequency, namely beyond the inverse of the carrier lifetime.
7. References
Ackerman, E. (1994). ,ArtechHouse.
Agrawal, G. P. (1988). Population pulsations and nondegenerate four-wave mixing in
semiconductor lasers and amplifiers, 5(1): 147–159.
Agrawal, G. P. & Dutta, N. K. (1993). , Kluwer Academic, Boston.
Anton, M. A., Carreno, F., Calderon, O. G., Melle, S. & Arrieta-Yanez, F. (2009).
Phase-controlled slow and fast light in current-modulated SOA,
42(9): 095403 (8pp).
Berger, P., Alouini, M., Bourderionnet, J., Bretenaker, F. & Dolfi, D. (2009a). Influence
of slow light effect in semiconductor amplifiers on the dynamic range of
microwave-photonics links, ,OpticalSocietyofAmerica,p.SMB6.
Berger, P., Alouini, M., Bourderionnet, J., Bretenaker, F. & Dolfi, D. (2009b). Slow light using
semiconductor optical amplifiers: Model and noise characteristics,
10: 991–999.
Berger, P., Alouini, M., Bourderionnet, J., Bretenaker, F. & Dolfi, D. (2010). Dynamic saturation
in semiconductoroptical amplifiers: accurate model, roleof carrier density, and slow
light, 18(2): 685–693.
Berger, P., Bourderionnet, J., Alouini, M., Bretenaker, F. & Dolfi, D. (2009). Theoretical study
of the spurious-free dynamic range of a tunable delay line based on slow light in soa,
17(22): 20584–20597.
Berger, P., Bourderionnet, J., Bretenaker, F., Dolfi, D., Dúill, S. O., Eisenstein, G. & Alouini, M.
(2010). Intermodulation distortion in microwave phase shifters based on slow and
fast light propagation in SOA, 35(16): 2762–2764.
Berger, P., Bourderionnet, J., de Valicourt, G., Brenot, R., Dolfi, D., Bretenaker, F. & Alouini,
M. (2010). Experimental demonstration of enhanced slow and fast light by forced
coherent population oscillations in a semiconductor optical amplifier,
35: 2457.
Bogatov, A. P., Eliseev, P. G. & Sverdlov, B. N. (1975). Anomalous interaction of spectral modes
in a semiconductor laser, 11: 510.
Boula-Picard, R., Alouini, M., Lopez, J., Vodjdani, N. & Simon, J C. (2005). Impact of the gain
saturation dynamics in semiconductor optical amplifiers on the characteristics of an
analog optical link,
Capmany, J., Sales, S., Pastor, D. & Ortega, B. (2002). Optical mixing of microwave signals in
a nonlinear semiconductor laser amplifier modulator, 10(3): 183–189.
Dúill, S. O., Shumakher, E. & Eisenstein, G. (2010a). The role of optical filtering in microwave
phase shifting, 35(13): 2278–2280.
Duill, S., Shumakher, E. & Eisenstein, G. (2010b). Noise properties of microwave phase shifters
based on SOA, 28(5): 791 –797.
Henry, C. (1982). Theory of the linewidth of semiconductor lasers,
18(2): 259 – 264.
Jeon, D H., Jung, H D. & Han, S K. (2002). Mitigation of dispersion-induced effects using soa
in analog optical transmission, 14(8): 1166 – 1168.
203
Slow and Fast Light in Semiconductor Optical Amplifiers for Microwave Photonics Applications
Lloret, J., Ramos, F., Sancho, J., Gasulla, I., Sales, S. & Capmany, J. (2010). Noise spectrum
characterization of slow light soa-based microwave photonic phase shifters,
22(13): 1005 –1007.
Mørk, J., Kjær, R., van der Poel, M. & Yvind, K. (2005). Slow light in a semiconductor
waveguide at gigahertz frequencies, 13(20): 8136–8145.
Olsson, N. (1989). Lightwave systems with optical amplifiers,
7(7): 1071–1082.
Peatross, J., Glasgow, S. A. & Ware, M. (2000). Average energy flow of optical pulses in
dispersive media, 84(11): 2370–2373.
Pesala, B., Chen, Z., Uskov, A. V. & Chang-Hasnain, C. (2006). Experimental demonstration
of slow and superluminal light in semiconductor optical amplifiers,
14(26): 12968–12975.
Shumakher, E., Duill, S. & Eisenstein, G. (2009a). Optoelectronic oscillator tunable by an soa
based slow light element, 27(18): 4063–4068.
Shumakher, E., Dúill, S. O. & Eisenstein, G. (2009b). Signal-to-noise ratio of a semiconductor
optical-amplifier-based optical phase shifter, 34(13): 1940–1942.
Su, H. & Chuang, S. L. (2006). Room temperature slow and fast light in quantum-dot
semiconductor optical amplifiers, 88(6): 061102.
Xue, W., Chen, Y., Öhman, F., Sales, S. & Mørk, J. (2008). Enhancing light slow-down in
semiconductor optical amplifiers by optical filtering, 33(10): 1084–1086.
Xue, W., Sales, S., Capmany, J. & Mørk, J. (2009). Experimental demonstration of 360otunable
rf phase shift using slow and fast light effects, ,OpticalSocietyof
America, p. SMB6.
Xue, W., Sales, S., Mork, J. & Capmany, J. (2009). Widely tunable microwave photonic
notch filter based on slow and fast light effects,
21(3): 167–169.
204
Advances in Optical Amplifiers
10
Photonic Integrated Semiconductor Optical
Amplifier Switch Circuits
R. Stabile and K.A. Williams
Eindhoven University of Technology
The Netherlands
1. Introduction
The acceptance of pervasive digital media has placed society in the Exabyte era (10
15
Bytes).
However the data centres and switching technologies at the heart of the Internet have led to
an industry with CO
2
emissions comparable to aviation (Congress 2007). Electronics now
struggles with bandwidth and power. Electronic processor speeds had historically followed
Gordon Moore's exponential law (Roadmap 2005), but have recently limited at a few
thousand Megahertz. Chips now get too hot to operate efficiently at higher speed and thus
performance gains are achieved by running increasing numbers of moderate speed circuits
in parallel. A bottleneck is now emerging in the interconnection network. As interconnection
is increasingly performed in the optical domain, it is increasingly attractive to introduce
photonic switching technology. While there is still considerable debate with regard to the
precise role for photonics (Huang et al., 2003; Grubb et al., 2006; Tucker, 2008; Miller 2010),
new power-efficient, cost-effective and broadband approaches are actively pursued.
Supercomputers and data centers already deploy photonics to simplify and manage
interconnection and are set to benefit from progress in parallel optical interconnects
(Adamiecki et al., 2005; Buckman et al., 2004; Lemoff et al., 2004; Patel et al., 2003; Lemoff et al.,
2005; Shares et al., 2006; Dangel et al., 2008). However, it is much more efficient to route the
data over reconfigurable wiring, than to overprovision the optical wiring. Wavelength
domain routing has been seen by many as the means to add such reconfigurability. Fast
tuneable lasers (Gripp et al., 2003) and tuneable wavelength converters (Nicholes et al., 2010)
have made significant progress, although bandwidth and connectivity remain restrictive so
far. All-optical techniques have been considered to make the required step-change in
processing speeds. Nonlinearities accessible with high optical powers and high electrical
currents in semiconductor optical amplifiers (SOAs) create mixing products which can copy
broadband information photonically (Stubkjaer, 2000; Ellis et al., 1995; Spiekman et al., 2000).
When used with a suitable filter, these effects can be exploited to create photonic switches and
even logic. However, the required combination of high power lasers, high current SOAs and
tight tolerance filters is a very difficult one to integrate and scale. Hybrid electronic and
photonic switching approaches (Chiaroni et al., 2010) are increasingly studied to perform
broadband signal processing functions in the simplist and most power-efficient manner while
managing deep memory and high computation functions electronically. This can still reduce
network delay and remove power-consuming optical-electronic-optical conversions (Masetti et
Advances in Optical Amplifiers
206
al., 2003; Chiaroni et al., 2004). The SOA gate has provided the underlying switch element for
the many of these demonstrators, leading to a new class of bufferless photonic switch which
assumes (Shacham et al., 2005; Lin et al., 2005; Glick et al., 2005) or implements (Hemenway et
al., 2004) buffering at the edge of the photonic network. Such approaches become more
acceptable in short-reach computer networking where each connection already offers
considerable buffering (McAuley, 2003). Formidable challenges still remain in terms of
bandwidth, cost, connectivity, and energy footprint, but photonic integration is now striving to
deliver in many of these areas (Grubb et al, 2006; Maxwell, 2006; Nagarajan & Smit, 2007).
This chapter addresses the engineering of SOA gates for high-connectivity integrated
photonic switching circuits. Section 2 reviews the characteristics of the SOA gates
themselves, considering signal integrity, bandwidth and energy efficiency. Section 3 gives a
quantitative insight into the performance of SOA gates in meshed networks, addressing
noise, distortion and crosstalk. Section 4 reviews the scalability of single stage integrated
switches before considering recent progress in monolithic multi-stage interconnection
networks in Section 5. Section 6 provides an outlook.
2. SOA gates
SOA gates exhibit a multi-Terahertz bandwidth which may be switched from a high-gain
state to a high-loss state within a nanosecond using low-voltage electronics. The electronic
structure is that of a diode, typically with a low sub-Volt turn on voltage and series
resistance of a few Ohms. Photonic switching circuits using SOAs have therefore been
relatively straight forward to implement in the laboratory. The required electrical power for
the SOA gate is largely independent of the optical signal, thus breaking the link between
rising energy consumption and rising line-rate which plagues electronics. SOA gates and the
underlying III-V technologies also bring the ability to integrate broadband controllable gain
elements with the broadest range of photonic components. A wide range of optical switch
concepts based on SOAs have already been proposed to facilitate nanosecond timescale path
reconfiguration (Renaud et al., 1996; Williams, 2007) performing favourably with the even
broader range of high speed photonic techniques (Williams et al., 2005). Now we review the
state of the art for the SOA gate technology itself, highlighting system level metrics in terms
of signal integrity, bandwidth and power efficiency.
2.1 Signal integrity
The broadband optical signal into an amplifying SOA gate potentially accrues noise and
distortion in amplitude and phase. Noise degrades signal integrity for very low optical
input powers, while distortion can limit very high input power operation. The useful
intermediate operating range, commonly described as the input power dynamic range
(Wolfson, 1999), is therefore maximised through the reduction of the noise figure and
increase in the distortion threshold. The signal degradation is generally characterised in
terms of the additional signal power penalty required to maintain received signal integrity.
Figure 1 quantifies power penalty degradation in terms of noise at low optical input powers
and distortion at high optical input powers for the case of a two input two output 2x2 SOA
switch fabric (Williams, 2006).
Noise originates primarily from the amplified spontaneous emission inherent in the on-state
SOA gate. The treatment for optical systems has been most comprehensively treated for
fiber amplifier circuits (Desurvire, 1994). The interactions of signals, shot noise, amplified
Photonic Integrated Semiconductor Optical Amplifier Switch Circuits
207
-25 -20 -15 -10 -5 0
0
-2
1
-1
2
0
3
1
4
Input power per wavelength channel [dBm]
Switch fabric gain [dB]
Power penalty [dB]
Fig. 1. Simulated input power dynamic range for a 2x2 SOA switch fabric (Williams, 2006)
spontaneous emission noise and the respective beat terms can require careful filtering and
bandwidth management to ensure optimum performance. The alignment of optical signals
with respect to the gain spectrum also impacts performance through the degree of
population inversion. Noise may be managed through the minimisation of loss and the
reduced requirement for high current amplifiers (Lord & Stallard, 1989). State of the art
noise figures for fiber-coupled SOAs are of the order 6-8dB (Borghesani et al., 2003),
depending on whether the structure is optimised for low-power input signals (pre-
amplifiers) or power booster amplifiers (post-amplifiers). These values are higher than for
fiber amplifiers, due to the losses in fiber to chip coupling and imperfect population
inversion. The design focus has therefore been on reducing losses (Morito et al., 2005).
Distortion in the saturation regime results from the charge carrier depletion from the incoming
data signal. When optical data signals are amplitude-modulated (on-off keyed), the signal can
deplete charge carriers and therefore reduce gain on the timescale of the spontaneous lifetime.
This leads to the time dependent patterning and therefore nonlinear distortions on the optical
output signal waveform. This can be alleviated by changing the data format: Proposals range
from wavelength keying (Ho et al., 1996; Kim & Chandrasekhar, 2000), wavelength domain
power averaging (Mikkelsen et al., 2000; Shao et al., 1994), and wavelength coding (Roberts et
al., 2005) for on-off keyed modulation. Increasingly popular constant power envelope formats
(Wei et al., 2004; Cho et al., 2004; Ciaramella et al., 2008, Winzer, 2009) are also more resilient.
Distortion is less evident for very low data rates where bit periods exceed the nanosecond
time-scale spontaneous lifetime, and also for very high data rates where the longest sequence
of bits are shorter than the spontaneous lifetime. Indeed, the optical transfer function can be
considered as a notch filter and this mode of operation has already been exploited for noise
suppression (Sato & Toba, 2001).
Pseudo random bit sequences are routinely used to assess data transmission. The longer 2
31
patterns have been particularly important for point to point telecommunications links to
stress-test all elements for the broadest bandwidth. The longest sequence of ones in a 2
31
pattern remains at the same level for over 3ns for a 10Gbit/s sequence, and is thus sensitive
to patterning (Burmeister & Bowers, 2006). However line rates of 100Gbit/s and above
would lead to maximum length sequences shorter than the spontaneous lifetime. For higher
line rates still, sophisticated optical multiplexing schemes are devised, and the concept of
the pattern length becomes less meaningful: Wavelength multiplexing measurements
commonly decorrelate replicas of the same signals (Lin et al., 2007), while optically
multiplexed signals use calibrated interleavers available only for the shortest 2
7
pattern
Advances in Optical Amplifiers
208
sequences (Albores et al., 2009). Packet switched test-beds impose more fundamental
constraints: a 2
31
sequence contains over two billion bits, far exceeding any likely data
packet length. Codes for receiver power balancing and packet checking also limit the
effective pattern lengths, and therefore shorter sequences are commonly used.
Techniques to increase the distortion threshold are readily understood through a
manipulation of the steady state charge carrier rate equation. Equation 1 approximates the
rate of change of charge carriers (left) in terms of the injected current, stimulated
amplification, and spontaneous emission (right). The steady state condition is defined when
the derivative tends to zero (dN/dt → 0).
dN/dt = I/eV – Γdg/dn(N-N
0
)P – N/τ
s
→ 0 (1)
The terms in Equation 1 correspond to the injected current I into active volume V. N represents
the charge carrier density,
Γ
is the optical overlap integral describing the proportion of
amplified light which overlaps with the active layer. dg/dn is the differential gain and N
0
is the
transparency carrier density.
τ
s
is the charge carrier lifetime. By defining a gain term G = dg/dn
(N-N
0
) it is possible to substitute out the unknown carrier density variable N in Equation 1 and
derive an expression for gain saturation by rearranging equation (1):
G ( 1 + Γτ
s
dg/dn P) = g ( τ
s
I/eV – N
0
) (2)
In the linear limit, the photon density P tends to zero, and the right hand side variables may
be approximated by one linear gain term G
linear
= g (
τ
s
I/eV – N
0
). A general expression for
gain G may thus be defined in terms of a linear gain G
linear
, photon density P and a photon
density saturation term such that G = G
linear
/(1+P/P
saturation
). Saturation is now simply defined
in terms of optical overlap integral
Γ
, carrier lifetime
τ
s
and differential gain dg/dn (Equation
3) and it turns out that each of these parameters can be exploited to reduce distortion.
P
saturation
= (Γτ
s
dg/dn)
-1
(3)
The optical overlap integral is defined by the waveguide design which has been chosen to
confine the carriers and the optical mode. While bulk active regions offer the highest
confinement, quantum wells (in reducing numbers) allow for an increase in distortion
threshold with output saturation powers of order +15dBm and higher being reported
(Borghesani et al., 2003; Morito et al., 2003). Quantum dot epitaxies allow even further
reductions in optical overlap for the highest reported saturation powers (Akiyama et al., 2005).
Tapered waveguide techniques additionally offer improved optical power handling (Donnelly
et al., 1996; Dorgeuille et al., 1996). Optimising optical overlap does however have implications
for current consumption, electro-optic efficiency and signal extinction in the off-state.
The carrier lifetime can be speeded up using an additional optical pump (Yoshino & Inoue,
1996; Pleumeekers et al., 2002; Yu & Jeppesen, 2001; Dupertuis et al., 2000). A natural evolution
of this, gain clamping (Tiemeijer & Groeneveld, 1995; Bachman et al., 1996; Soulage et al.,
1994), has also been extensively studied as a means to increase the distortion threshold. Here
the amplification occurs within a lasing cavity and so an out-of-band oscillation defines the
carrier density N at the threshold gain condition through fast stimulated emission. Gain
clamping can increase the distortion threshold by several decibels (Wolfson, 1999; Williams et
al., 2002) and can even be extended to allow variable gain (Davies et al., 2002).
The differential gain term in equation 2 describes how the change in complex dielectric
constant amplifies the optical signal. This parameter may be engineered through epitaxial
Photonic Integrated Semiconductor Optical Amplifier Switch Circuits
209
design. The associated differential refractive index modulation, commonly approximated by a
line-width broadening coefficient, can also be exploited to suppress distortion. Fast chirped
components may be precision filtered from slower chirped components in the output signal to
enhance the effective bandwidth (Inoue, 1997; Manning et al., 2007). While the approach does
remove energy from the optical signal, it also enables some of the most impressive line rates in
all-optical switching (Liu et al., 2007).
2.2 Bandwidth
SOA gates may be characterised by a number of time-constants and bandwidths. The
Gigahertz speed at which the circuit may be electronically reconfigured is determined
primarily by the spontaneous recombination lifetime and any speed-up technique employed
(section 2.1). While this time constant has an impact on the durations of packets and guard-
bands in a packet-type network, this does not directly impact the signalling speed, where
the multi-Terahertz optical gain bandwidth of the SOA becomes important. These limits are
now discussed in the context of state of the art.
1ns
1547.5nm
1544.2nm
1544.2nm
1547.5nm
Gate array Cyclic router
a)
b)
c)
Fig. 2. Dynamic routing with nanosecond switching windows for a SOA cyclic router (Rohit
et al., 2010):
a) The microscope photograph for the SOA gate array and arrayed waveguide cyclic router
b) The waveguide arrangement fot the single input, multiple output circuit
c) Time traces showing the selecting and routing of wavelength channels
The electronic switching time from high gain to high loss is limited primarily by the
spontaneous recombination lifetime with reports routinely in the nanosecond range
(Dorgeuille et al., 1998; Kikichi et al., 2003; Albores-Mejia et al., 2010; Rohit et al., 2010;
Burmeister & Bowers, 2006), enabling comparable nanosecond duration dark guard bands
between data packets. Figure 2 shows how such fast switching speeds can be exploited in
the routing of data in a SOA-gated router. Schemes for label based routing have been
reported using comparable approaches (Lee et al., 2005; Shacham et al., 2005).
Real time current control has been considered as a means to ensure optimum operating
characteristics of the individual SOA gates. Techniques range from the monitoring of the
narrow-band tone (Ellis et al., 1988) and broad-band data (Wonfor et al., 2001) on the SOA
Advances in Optical Amplifiers
210
electrodes themselves through to customised monitor diodes (Tiemeijer et al., 1997) and
integrated power monitoring (Newkirk et al., 1992; Lee et al., 2005). Hierarchical approaches
have also been proposed to enable the management of photonic parameters independently
of the digital switch state (White et al., 2007). The possibility to react to thermal transients
within the circuit, and even enable self calibration is increasingly important as circuit
complexity evolves. This abstraction of the physical layer becomes increasingly important as
network level functions such as self-configuration are considered (Lin et al., 2005).
Signalling line-rates of up to 40Gbit/s have been demonstrated using SOAs in a
transmission environment (Brisson et al., 2002), and also for integrated switch elements
(Burmeister & Bowers, 2006). To extend beyond 40Gb/s requires optical multiplexing. Here
SOAs have been demonstrated for in-line amplification for multiwavelength transmission
(Reid et al., 1998; Jennen et al., 1998; Sun et al., 1999). The early experiments operated the
SOAs within the saturation regime, but later demonstrations in the linear regime with
reduced crosstalk enable hundreds of Gbit/s WDM transmission (Spiekman et al., 2000).
Optically transparent networking becomes feasible once the circuit elements become
polarisation insensitive. Polarisation properties are engineered through the design of the
waveguide dimensions and the radiative transitions in the active media. The latter are tailored
using epitaxially defined strain. A broad range of reports have demonstrated polarisation
independent operation for both bulk (Emery et al., 1997; Dreyer et al., 2002; Morito et al., 2000;
Kakitsuka et al., 2000; Morito et al., 2003; Morito et al., 2005) and quantum wells SOAs
(Godefroy et al., 1995; Kelly et al., 1997; Ougazzadeu, 1995; Tiemeijer et al., 1996).
2.3 Energy
The energy efficiency for an interconnection network is commonly quantified in terms of
energy requirement per bit and includes the full end-to-end digital power usage. This concise
metric allows for a cross-comparison with electronic switching fabrics, and assists with the
road-mapping for CMOS technology. Figure 3 shows schematic arrangement for two example
photonic interconnection networks with electronic and photonic switching. Photonic links
remove transmission losses from the comparison, allowing a focus on the switch technologies
themselves. At the time of writing, state of the art vertical cavity laser array transceivers with
multimode fibers enabled energy efficiencies of a few picoJoules per bits, and distributed
feedback lasers on silicon are being developed for reduced power consumption single mode
fiber transceivers. Transceiver technologies dominate the interconnect power budget and a
prime motivator for optical switch research has now become the replacement of large numbers
of power consuming transceivers with a smaller, data agnostic switch circuit, to remove power
draining OEO conversions and excess packaging.
Photonic integration reduces optical losses by minimising the number of on-off-chip
connections. This additionally improves noise performance and reduce operating gain for
the SOA gates. This is important as it is the current used for amplification, non-radiative and
spontaneous recombination which ultimately determines energy consumption. If the non-
radiative currents become too high, and Joule heating in the resistive p-layers of the SOA
gates becomes significant, this can lead to a spiralling reduction in available gain, and the
need for significant heat extraction. Spot-size conversion (Morito et al., 2003) is increasingly
implemented to remove the losses between the SOA chip and the off-chip network elements,
such as the fiber patch-cords.
Cooler-free operation is now mandatory for data communications transceivers, but remains
unthinkable in many high performance telecommunications links. Integrated circuits
Photonic Integrated Semiconductor Optical Amplifier Switch Circuits
211
M
u
l
t
i
p
l
e
m
u
l
t
i
p
l
e
x
e
d
t
r
a
n
s
c
e
i
v
e
r
s
Large numbers of
high speed lines
S
w
i
t
c
h
i
n
g
Energy
consuming
transceivers
O
n
e
d
a
t
a
r
a
t
e
a
g
n
o
s
t
i
c
P
IC
L
o
w
s
p
e
e
d
s
i
g
n
a
l
p
r
o
c
e
s
s
i
n
g
f
o
r
s
c
h
e
d
u
l
i
n
g
S
c
h
e
d
u
l
i
n
g
High speed electronic
signal processing
Low-energy, modest speed
electronic signal processing
a) b)
Photonic integrated circuits
operating transparently to line-rate
P
h
o
t
o
n
i
c
t
r
a
n
s
p
o
r
t
P
h
o
t
o
n
i
c
t
r
a
n
s
p
o
r
t
Fig. 3. Schematic diagrams highlighting the motivation for hybrid photonic switch matrices
with electronic switch (left) and photonic switch (right)
exploiting semiconductor optical amplifiers are however well suited to uncooled operation
due to the broad spectral bandwidth. Initial reports have been promising. Uncooled
operation for a quantum dot SOA has been demonstrated for a wide temperature range up
to 70 °C (Aw et al., 2008), providing 19dB of optical gain at high temperatures with
negligible 0.1dB system penalty at 10Gb/s. Aluminium containing quaternaries, used for the
highest performance uncooled 10Gb/s data communications lasers, have also been used for
SOAs. These epitaxial designs allow for enhanced electronic confinement and therefore
excellent electronic injection efficiency at high temperature. SOAs have also been operated
at 45°C such that the packaged SOA module may operate with sub-Watt operating power
over the temperature range 0-75°C (Tanaka et al., 2010).
3. Networks
High-connectivity, multi-port electronic switches exploit multi-stage interconnection
networks (Dally & Townes, 2004; Kabacinski, 2005) and photonic networks are also set to
benefit from such approaches. Figure 4 shows an example of a switch network proposed to
allow the scaling of a SOA broadcast select architecture with four outputs per stage using
the hybrid Clos/broadcast-and-select architecture (White et al., 2009).
Fig. 4. An example multi-stage switch architecture showing parallel scaling and serial
interconnection of SOA gates
Advances in Optical Amplifiers
212
A 4x4 broadcast and select switch using SOA gates is placed within each of the twelve
switch cells. These are interconnected to each other in three stages to create the larger 16x16
network. Both serial and parallel interconnection of SOA gates is required for the multistage
interconnection networks. The interactions between SOA elements in such an architecture is
now considered, firstly in terms of signal evolution through the cascaded network, and
secondly in terms of crosstalk from incompletely extinguished signals from interferer paths.
3.1 Cascaded networks
The concatenation of multiple SOAs in amplified transmission and switching networks can
lead to aggregated noise and distortion. The build-up of noise between stages can be
minimised through reduction in gain and loss (Lord & Stallard, 1989). Reflections at the
inputs and outputs of the SOA gates were particularly problematic in the early literature
(Mukai et al., 1982; Grosskopf et al., 1988; Lord & Stallard, 1989), but can now be minimised
through integration (Barbarin et al., 2005) and facet treatments (Buus et al., 1991). The
residual distortion of signals (Section 2.1) can additionally build up with increasing
numbers of SOA gates, leading to a reduction in the input power dynamic range, and
ultimately the power penalty itself.
The largest cascaded networks of SOAs have been studied using recirculating loops, where
a signal is switched into and out of a loop with an amplifier and a loss element. The signal
circulates for predetermined numbers of iterations – often this is varied as part of the study
– and is then assessed for signal degradation. Up to forty cascades have been feasible while
maintaining an eye pattern opening – good discrimination between logical levels – for
10Gb/s data sequences (Onishchukov et al., 1998). Studies have also considered
transmission over individual fiber spools and field installed fiber spans. Figure 5
summarises many of the leading reports into signal degradation with increasing number of
SOAs. Data points are included for a pioneering research teams including those at Philips
(Kuindersma et al., 1996; Smets et al., 1997; Jennen et al., 1998) and Bell Labs (Olsson, 1989;
Ryu et al., 1989). The evidence suggests that power penalty can be modest for reasonably
low levels of cascaded amplifiers, with a steady degradation in penalty as cascade numbers
approach ten or more SOAs even when circuits are operated with high levels of gain. It is
0
1
2
3
4
5
6
024681012
Number of cascaded amplifiers
Power penalty [dB
]
Fig. 5. Power penalty in transmission experiments for cascaded semiconductor optical
amplifiers
Photonic Integrated Semiconductor Optical Amplifier Switch Circuits
213
worth noting that much of this data predates the innovative low distortion amplifier designs
developed over the last decade. Operating parameters can nonetheless become increasingly
stringent with important implications for control systems (Section 2.2).
3.2 Crosstalk
The aggregation of stray signals from disparate locations in a switch network leads to
crosstalk. Contributions may be separated into coherent leakage, incoherent leakage, and
cross gain modulation within co-propagating wavelength multiplexes.
Coherent crosstalk was identified as a particularly troublesome source of signal degradation
for large-mesh, optically-transparent, telecommunications networks. Channels
unintentionally combined with either remnants of themselves or other identical
wavelengths lead to interferometric beating (Legg et al., 1994). Coherent crosstalk with long
timescale fluctuations compromises threshold setting in receivers. The resulting beat noise
incurs large power penalties and bit error floors (Gillner et al., 1999). If the path length
differences are minimised to less than one bit period and the wavelengths are stable, as
might be anticipated in a monolithic multistage network, phase difference becomes
invariant and less problematic (Dods et al., 1997). Coherent crosstalk can incur an overhead
of order 10dB on the crosstalk requirement (Goldstein et al., 1994; Goldstein & Eskildsen,
1995; Eskildsen & Hansen, 1997) and this has led some to suggest a –40dB extinction ratio
requirement for telecommunication networks using an optical switch technology (Larsen
and Gustavsson, 1997). Figure 6 summarises representative quantifying the role of crosstalk
on signal degradation. Coherent crosstalk is identified with open symbols, while the closed
symbols represent incoherent crosstalk measurements and calculations. The calculations
performed by Buckman are also included for the cases of Gaussian and numerically
determined distributions for incoherent crosstalk characteristics. It is evident from figure 6
that the level of crosstalk which may be accomodated is significantly higher for incoherent
forms of crosstalk (Goldstein et al., 1994; Buckman et al., 1997; Yang & Yao, 1996; Jeong &
Goodman, 1996; Albores-Mejia et al., 2009).
0
1
2
3
4
-40-30-20-10 0
Crosstalk [dB]
Power Penalty [dB]
Jeong & Goodman, 1996
Yang & Yao, 1996
Albores-Meija et al., 2009
Eskildsen & Hansen, 1997
Goldstein et al., 1994
Buckman et al., 1997
(numerical)
Buckman et al., 1997
(Gaussian)
Fig. 6. Crosstalk incurred penalty in SOA networks
Advances in Optical Amplifiers
214
Switch extinction ratio is related to crosstalk at the circuit level. A worst case approximation
for crosstalk build up in a given path is simply the sum of signal leakage contributions in
each switch in the path (Saxtoft & Chidgey, 1993). Cumulated crosstalk ratio may be
described as the product of the number of stages between an input and output N
stages
, the
number of interferer inputs at each stage with radix N
radix
, and the extinction ratio of the
switch element X
extinction
:
ΣX
crosstalk
= N
stages
. (N
radix
– 1) . X
extinction
(4)
While the approach can be a useful guide for low channel counts, this can lead to
overestimated power penalty at high channel counts (Buckman et al., 1997) due to statistical
averaging (see for example Section 2.1). Nonetheless extinction ratios achieved for SOA
gates are commonly reported in the 40dB range (Larsen & Gustavsson, 1997; Varazza et al.,
2004, Tanaka et al., 2009; Albores-Mejia et al., 2010; Stabile et al., 2010).
Inter-wavelength crosstalk has been studied across architectures. Many early switch
architectures assumed one wavelength per switch element in multiwavelength fabrics, and
this called for a multi-domain description of spatially- and spectrally-originating crosstalk
(Gillner et al., 1999; Zhou et al., 1994; Zhou et al., 1996). Recent requirements for massive
data capacities have led recent work to focus on multi-wavelength routing where inter-
wavelength crosstalk can occur through cross gain modulation (Oberg & Olsson, 1988;
Inoue, 1989; Summerfield & Tucker, 1999).
4. Multi-port switches
Creating multi-port switches from SOA gates requires additional interconnecting passive
circuit elements. As the techniques and technologies for creating integrated power splitters,
low-loss wiring, low-radius bends, corner mirrors and waveguide crossings have evolved,
the levels of integration have allowed connectivity to increase from two to four and eight
output ports.
4.1 Two port switch elements
The broadest range of switching and routing concepts have been demonstrated for the
simplest two input two output multiport switches. The SOA gate based switches can be
classified as interoferometric or as broadcast and select. The former should allow near
complete coupling of optical power into the desired path, enabling the removal of
unnecessary and undesirable energy loss. The latter allows a broader range of network
functionality, including broadcast and multicast.
Interferometric schemes include the exploitation and frustration of multimode interference
in matrices of concatenated 1x2 MMI switches (Fish et al., 1998), vertical directional couplers
(Varazza et al., 2004) and gated arrayed waveguide grating based switches (Soganci et al.,
2010). The first two approaches lend themselves well to cross-grid architectures and have
been demonstrated at 4x4 connectivity. The incorporation of SOA gates with an
interferometer also offers enhanced extinction ratio. The switched arrayed waveguide
grating approach is also scalable, although only as a 1xN architecture.
Broadcast and select architectures have been more widely studied as they are intrinsically
suited to conventional laser based processing methods and epitaxies. The SOA gates are able
to overcome losses associated with the splitter network, allowing zero fiber-to-fiber
Photonic Integrated Semiconductor Optical Amplifier Switch Circuits
215
insertion loss at modest currents. Selective area epitaxy has allowed the separate
optimisation of active and passive circuit components required for insertion-loss-free
operation (Sasaki et al., 1998; Hamamoto & Komatsu, 1995). The splitting and combining
functions have been implemented using Y-couplers (e.g. Lindgren et al., 1990), multimode
interference couplers (e.g. Albores-Mejia et al., 2009) or arrangements of total internal
reflecting mirrors (e.g. Himeno et al., 1988; Gini et al., 1992; Burton et al., 1993; Sherlock et
al., 1994; Williams et al., 2005). Chip footprints of below 1mm
2
have been acheived in this
manner. Figure 7 shows the example of the mirrors created in an all active switch design
interconnecting eight SOA gates in a cross-grid array. The input and output guides include a
linearly tapered mode expander, which terminates at one of four splitters. The splitters
comprised 45º totally internal reflecting mirror which partially intersect the guided mode.
Part of the light is routed into the perpendicular guide and the remaining part is routed to
the through path.
200µm 2µm
Fig. 7. Two port integrated switch circuit (left) within a footprint of under 1mm
2
using
(right) ultracompact total internal reflecting mirrors (Williams at al., 2005)
Microbends offer a route to even further size reductions, while addressing a tolerance to
fabrication variability (Stabile & Williams, 2010). Whispering gallery mode operation is
predicted to give order of magnitude relaxation in required tolerances with respect to single
mode microbends. Polarization conversion can also be maintained below 1% with
appropriately designed structures.
Fig. 8. Schematic diagram for a fabrication tolerant whispering gallery mode bend for high
density switch circuits (Stabile & Williams, 2010)
Advances in Optical Amplifiers
216
Quantum dot epitaxies have also been considered to exploit anticipated advantages for
broadband amplification, low distortion and low noise (Akiyama et al., 2005). The first
monolithic 2x2 switch demonstration has been performed for the 1300nm spectral window
(Liu et al., 2007) showing negligible power penalty of <0.1dB for 10Gb/s data routing. The
first demonstrations in the 1550nm window followed, showing excellent power penalties of
order 0.2dB for 10Gbit/s data routing (Albores-Mejia et al., 2009). Multiple monolithically
integrated 2x2 circuits have also been demonstrated with 0.4-0.6dB penalty showing only a
weak signal degradation as quantum dot circuit elements are incorporated in larger switch
fabrics (Albores-Mejia et al., 2008).
4.2 Four port switch elements
Single stage four port switches have been implemented for a number of broadcast and select
configurations (Gustavsson et al., 1992; Bachmann et al., 1996; Larsen & Gustavsson, 1997;
van Berlo et al., 1995; Sasaki et al., 1998). Electrode counts of between sixteen and twenty-
four result, depending on whether additional on-chip amplification is required to overcome
circuit losses. This can add considerable complexity to circuit layout and is a potential limit
to single stage scaling. The first transmission experiments were reported for 50 km distances
at 2.488 Gbit/s, with less than 1 dB power penalty (Gustavsson et al., 1992) with an input
power dynamic range of over 10dB. Wavelength division multiplexed transmission was also
demonstrated with four 622 Mb/s wavelength channels spaced equally from 1548-1560nm
(Almstrom et al., 1996). Field trials at 2.5 Gbit/s were performed with three switch circuits
in a 160 km fiber-optic link. The majority of studies have been restricted to modest data
capacities between one input port and one output port (Gustavsson et al., 1992; Gustavsson
et al., 1993; Djordjevic et al., 2004).
Multi-port dynamic routing has recently been demonstrated for a 4x4 switch using a round-
robin scheduler and nanosecond-speed control electronics (Stabile et al., 2010). Figure 8
shows the monolithic photonic circuit on the left, and the output signals on the right. The
SOA gates are sequentially biased to enable the routing of the inputs to the outputs. The
right hand figures show the time traces recorded for each of the outputs, showing data
packets from each available input. Rotating priority (round-robin) path arbitration allows
the simplest control algorithm with only one input clock signal, abstracting the photonic
complexity from the logic control plane.
Fig. 8. Four port integrated switch circuit within 4mm
2
showing dynamic multi-path routing
(Stabile et al., 2010)
Multi-path routing has also been assessed for wavelength multiplexed inputs to three ports
in a discretely populated switching fabric. Field programmable gate arrays enabled the
Photonic Integrated Semiconductor Optical Amplifier Switch Circuits
217
synchronisation of switching and diagnostics. A power penalty in the range of 0.3–0.6 dB
was observed due to multi-path crosstalk and a further power penalty in the range of 0.4–1.2
dB was incurred through dynamic routing (Lin et al., 2007).
Connection scaling studies have allowed insight into the available power margins for SOA
switch fabrics operating at high line wavelength division multiplexed line-rates. The
potential for single-stage 8×8 switches at a data capacity of 10×10 Gbit/s is predicted with a
1.6dB power margin, identifying a potential route to Tbit/s switch performance in a single-
stage low-complexity switch fabric (Lin et al., 2006).
4.3 Eight port switch elements
Scaling to even higher levels of connectivity have been constrained by existing waveguide
crossing and waveguide bend techniques, and this is most clearly evidenced by the dearth
of single stage 8x8 switches. Researchers realising high connectivity single stage switches
have therefore focussed efforts on 1x8 monolithic connectivity.
Array integration has been explored as the first step towards large scale monolithic
integration (Dorgeuille et al., 1998; Suzuki et al., 2001; Sahri et al., 2001; Kikuchi et al., 2003;
Tanaka et al., 2010). The packaged array of 32 gain clamped SOA gates (Sahri et al., 2001)
has enabled the most extensive system level assessments in telecommunications test-beds
(Dittmann et al., 2003). Implementation of arrays of eight gates have also led to the early
demonstrations of 8×8 optical switching matrices based on SOA gate arrays with 1.28Tbit/s
(8×16×10Gb/s) aggregate throughput (Dorgeuille et al., 2000). These approaches rely on
fiber splitter networks.
Quantum dot all-active epitaxial designs (Wang et al., 2009) have been implemented using
multi-electrode amplifiers to create the separate SOA gates. The input channel is split to the
eight output gates by means of three stages of on-chip 1x2 MMI couplers. The use of low
splitting ratios is expected to allow more reproducible optical output power balancing. The
excellent measured power penalties allow the cascading of two stages which should enable
1x64 functionality.
Active-passive regrown wafers (Tanaka et al., 2009) have also been used to create compact
monolithic 1x8 switches. The thin tensile-strained MQW active layers used for the SOA
gates allow for an optimisation of output saturation power, noise, and polarization
insensitivity. A compact circuit footprint is facilitated by using a high density chip to fiber
coupling and through the use of a field flattened splitter to create a uniform split ratio 1x8 in
a highly compact 250 µm structure. This approach exhibits an on-state gain of 14.3 dB which
is largely wavelength and temperature insensitive. A path to path gain deviation of order
3.0 dB is also achieved. Extinction ratios of order –70dB were reported with an extensive
input power dynamic range of 20.5 dB for 10-Gbit/s signals. The high levels of gain
overcome the additional off-chip splitter losses which are incurred when combining eight
such circuits to construct an 8x8 switching fabric (Kinoshita, 2009).
5. Multi-stage interconnection networks
A broad range of multi-stage networks have been studied for photonic networks (Beneš,
1962; Wu & Feng, 1980; Spanke & Beneš, 1987; Hluchyj & Karol, 1991; Shacham & Bergman,
2007). The constraints imposed in SOA gate based networks lead to a preference for smaller
numbers of stages (Williams et al., 2008; White et al., 2009). Simulations are presented to
Advances in Optical Amplifiers
218
provide insight into the scalability of multi-stage photonic networks. Then examples of
multistage networks are given for 2x2 and 4x4 building blocks, highlighting the state of the
art for connectivity, the numbers of integrated stages and line-rate.
Numerical simulations for the physical layer have been performed using travelling wave
amplifier modelling which inherently accounts for noise and distortion and allows for
wavelength multiplexed system simulation (Williams et al., 2008). Connectivity limits for
Tbit/s photonic switch fabrics are studied by scaling the number of splitters in a three stage
switch fabric: An intermediate loss between each SOA gate accounts for the radix of the
switch element. A 3.5dB loss describes each 1x2 splitter or coupler element in the circuit.
Figure 9 summarises the dimensioning simulations by presenting input power dynamic
range as a function of the number of splitters per stage. Power penalty contours are given
for 1dB and 2dB power penalties to show tolerated inter-stage losses and therefore
connectivity.
Fig. 9. Simulated power penalty in increasing connectivity SOA gate switching networks
Optical data rate at 10λx10Gbit/s using on-off keyed data format (Williams et al., 2008)
Input power dynamic range for 10λx10Gb/s wavelength multiplexed data is seen to reduce
both with the number of switch stages and the optical loss between each switch stage. The
dynamic range specified for a 1dB power penalty over three stages is observed to exceed
10dB for the four splitter architectures, which is equivalent to a three stage 16×16 switch. For
the case of six splitters, a 5dB dynamic range for 2dB power penalty is indicative of viable
performance for a 64×64 interconnect based on 8×8 switch stages. Large test-beds exploiting
multiple stages of discrete SOA gates have supported these findings. Wavelength
multiplexed routing in a 12×12 switch exploiting three stages of concatenated 1×2 SOA-
switches enables Terabit class interconnection (Liboiron-Ladouceur et al., 2006). Two stages
of SOA gates are implemented in a 64×64 wavelength routed architecture proposed for
supercomputers (Luijten & Grzybowski, 2009).
Connectivity for integrated photonic circuits has recently been increased to record levels
through the use of the Clos-Broadcast/Select architecture highlighted in Figure 4. Three
stages of four 4x4 switch building blocks were integrated within the same circuit (Wang et
al., 2009) to demonstrate the first 16×16 port count optical switches using an all-active
AlGaInAs quantum well epitaxy. Paths in the circuit have enabled 10Gbit/s routing with
2dB circuit gain and a power penalty of 2.5dB. The electrical power consumption of the all-
active chip is estimated to be 12W for a fully operational circuit, which corresponds to a
modest power density of 0.3W/mm
2
. The power consumption could be approximately
halved by replacing the current active shuffle networks with their passive equivalents.
Photonic Integrated Semiconductor Optical Amplifier Switch Circuits
219
Capacity has also recently been increased to record 320Gb/s line-rates per path for a multi-
stage photonic interconnection network (Albores-Mejia et al., 2010). This represents both the
leading edge in the number of monolithically integrated switching stages and the highest
reported line rates through a switching fabric. Bit error rate studies show only modest levels
of signal degradation. The circuit is presented in Figure 10. The N-stage planar architecture
includes up to four serially interconnected crossbar switch elements in one path, and is
representative of a broader class of 2x2 based multistage interconnection networks. The step
change in line rate is believed to be attributable to the use of the active-passive epitaxial
regrowth, which allows the separate optimisation of gates and routing circuits.
Time [ps]
0 20
Fig. 10. Photograph of a four port multistage interconnection network, and right, the eye
diagrams after four stages of integrated crossbars for 320Gb/s (Albores-Mejia et al., 2010)
6. Conclusion
Integrated photonics is poised to become a key technology where the highest signalling
speeds are required. The numbers of integrated optoelectronic components which can be
integrated on a chip can rise significantly, and with this, the sophistication of circuit
functions can be expected to grow. The critical parameters required for high capacity, high
connectivity switching circuits have now been demonstrated, and the challenge is to devise
architectures that are able to simultaneously match performance with energy efficiency and
integration. A symbiotic relationship between massive bandwidth photonic circuits and
intelligent electronic control circuits could well evolve to create a generation of ultrahigh
speed signal processors.
7. References
Adamiecki, A., M. Duelk and J.H. Sinsky, "25 Gbit/s electrical duobinary transmission over
FR-4 backplanes", Electronics Letters, 41, 14, 826-827, (2005)
Akiyama, T., M. Ekawa, M. Sugawara, K. Kawaguchi, H. Sudo, A. Kuramata, H. Ebe and Y.
Arakawa, "An ultrawide-band semiconductor optical amplifier having an
extremely high penalty-free output power of 23 dBm achieved with quantum dots",
Photonic Technology Letters, 17, 8, 1614-1616, (2005)
Albores-Mejia, A., K.A. Williams, T. de Vries, E. Smalbrigge, Y.S. Oei, M.K. Smit, S.
Anantathanasarn, R. Notzel, "Scalable quantum dot optical Switch matrix in the
1.55 um wavelength range", Proceedings Photonics in Switching, Paper D-06-4
(2008)