Advances in Spacecraft Technologies Part 4 docx
Bạn đang xem bản rút gọn của tài liệu. Xem và tải ngay bản đầy đủ của tài liệu tại đây (2.35 MB, 40 trang )
Advances in Spacecraft Technologies
110
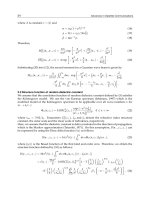
Fig. 11. ESA’s SILEX project. Credits: ESA multimedia gallery.
over 45.000 km were reached with up to 50 Mbps binary rates (Fletcher, Hicks & Laurent,
1991).
Other significant projects never went beyond the design table, such as the OCDHRLF
project, which in 2002 intended to load a 2.5 Gbps optical communication terminal on board
the International Space Station using commercial off-the-shelf components (Ortiz et al.,
1999). Or the EXPRESS project, in which a link was designed to download data from the
space shuttle with a speed of up to 10 Gbps (Ceniceros, Sandusky, & Hemmati, 1999). Or the
most ambitious NASA’s MLCD project, which in 2009 intended to prove a link of up to 100
Mbps link from Mars by using a small low-power (5W of average power) terminal on board
the MTO (Mars Telecom Orbiter), which was not launched after all due to budget pressures
(Edwards et al., 2003).
3.2 Diffraction limit of a telescope and beam divergence
In fact, a telescope’s primary mirror or lens can be considered a circular opening, because it
produces light inside a circle described by its primary mirror. If the opening’s diameter is D
and the wave length is λ, the angular variation of intensity of radiation is given by the Eq.
(6) (Hecht, 2002):
()
()
2
1
sin
()
2
(0)
sin
D
J
I
D
I
π
θ
θ
λ
π
θ
λ
⎡
⎤
⎛⎞
⎢
⎥
⎜⎟
⎝⎠
⎢
⎥
=
⎢
⎥
⎢
⎥
⎣
⎦
(6)
where J
1
(x) is the Bessel function of first order of x. The first zero refers to
(πD/λ)sin(θ) = 3.832. Using the approach sin(θ) ≈ θ, we get a telescope’s diffraction limit,
which is given by the equation (7):
1,22
D
λ
θ
⎛⎞
=
⎜⎟
⎝⎠
rad (7)
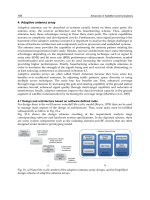
This limit determines the lowest diffraction angle, and consequently the minimum of beam
divergence with an increase in distance (Fig. 12).
Here, the diffraction limit formula has been calculated according to the criterion of the first
zero in the Bessel function. If a different criterion were used, the multiplying factor of (λ/D)
Development of Optoelectronic Sensors and Transceivers for Spacecraft Applications
111
would be different. For example (Franz, 2000), if one were to take the point where the power
falls to a half, instead of taking the point where the first zero is, the multiplying factor
would be 1.03.
Fig. 12. Diffraction limit of a telescope.
The use of such short wavelength as the light’s permits the emission of signals with a
minimal diffraction. In the case of very large distances, divergence becomes a critical factor,
because the wider the area that the emitted power reaches, the smaller the density of power
per unit of surface area, that is, the lesser the signal that reaches the receiving antenna’s
surface. Since with the light’s propagation, as with any electromagnetic wave, the area
covered by the signal becomes squared with the distance, the loss of power is proportional
to the square of the distance. This means that at great distances much more power can be
delivered to the receiver compared with RF, and, since the performance of this kind of
communications is limited by the signal-to-noise ratio, the use of optical wavelengths offers
a great advantage to satellite communications.
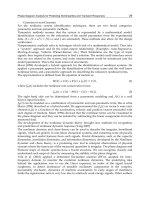
Fig. 13 shows a comparison between an RF link and an optical one carried out by a space
probe around Neptune transmitting with a telescope/antenna of 40 cm diameter, with a
wavelength of ~1 μm (IR) in the case of the optical link, and a frequency of 30 GHz (Ka
band) in the case of RF. The result is that with the optical communication link the spot that
is received on the earth has around one terrestrial diameter, whereas with the RF it has
around 10000 times the earth’s diameter. And that means that with the same emitted power
the received power is 10000 times larger with the optical link. Using a large 4-meter antenna
(similar to the one installed in the Cassini probe), the power received on the earth would
still be 3 orders of magnitude below the one received with the lasercom terminal.
If we compare RF frequencies with optical wave lengths in terms of achievable bit rates,
only potential limits can be considered, as optoelectronic technology is still very far from
reaching them. The information transfer rate is limited by a fraction of the carrier frequency,
so that, with such high frequencies as that of the light, bit rates far beyond Tbps could be
achieved –if the technology were available- resulting in an improvement of several orders of
Advances in Spacecraft Technologies
112
magnitude in relation to RF. Nowadays speeds over one Gbps have already been verified.
Besides, such a large directivity permits the use of an almost infinite bandwidth, because of
the absence of regulation against interferences, as is the case with RF.
Fig. 13. Comparison between RF and optical links.
On the other hand, a great directivity demands a high pointing accuracy. After the process
of pointing acquisition, in which both terminals establish the line of sight to each other, the
procedure to keep the pointing is several orders of magnitude more complex than with
radio frequency. In RF, the pointing accuracy is of the order of milliradians in the Ka band,
which can be achieved with the spaceships’ attitude control systems. By contrast, a deep-
space lasercom link would typically require submicroradian accuracy (Ortiz, Lee &
Alexander, 2001). In order to keep a stable line of sight, the spaceship needs to have a
dedicated system in charge of isolating the optical lasercom terminal from the spaceship’s
platform jitter. This can be achieved by means of vibration isolators and jitter measures
through a laser beacon from the ground terminal, if the probe is near the earth, and
additionally celestial references and inertial sensors, if the probe is in deep-space. With a
stabilized line of sight, the pointing and tracking system is responsible of pointing the beam
towards the other terminal and keeping the pointing throughout the communication. This is
carried out by referring the position of the laser beacon and/or the celestial references to the
ground station terminal, and by maintaining it with an open loop correction.
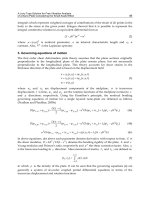
3.3 Block diagram and main elements in a lasercom link
Any satellite optical communication link (Fig. 14) would consist of one or several ground
stations, one transceptor on board each of the flight terminals, and between both ends the
optical communication channel, whether it be the space in the case of an intersatellite link,
or the atmosphere in the case of communication with the earth.
The flight terminal receives the information provided by the spaceship and encodes and
modules it on a laser beam, which transmits it through an antenna (telescope) after the process
of reception and pointing to the earth terminal. The laser beam propagates through an optical
channel that causes free space losses due to the divergence in the propagation of light,
background noise mainly due to the sun, and some atmospheric effects near the earth surface.
Once the beam reaches the earth terminal, its job is to provide, by means of a telescope,
enough of an opening to collect the received light, show an adequate photodetection
sensitivity in the photons-electron conversion, and carry out the demodulation and decoding
of the signal.
Development of Optoelectronic Sensors and Transceivers for Spacecraft Applications
113
Fig. 14. Block diagram of an optical satellite communication link.
Coding schemes of information for the detection and correction of errors caused by the
channel are similar to those used in RF (convolutional codes such as Reed-Solomon, and block
codes such as Turbo codes), but modulation techniques vary a great deal. The most simple
format consists in turning the laser on and off (OOK, On-Off Keying). However, this technique
shows serious deficiencies when great distances are involved: on the one hand the peak power
of the pulses needs to be high enough to compensate for the free-space losses, but on the other
hand the average transmission power needs to be low enough to reduce the electricity
consumption. Various modulation techniques come up here, whose common denominator is
the possibility to encode more than one bit per pulse. Pulse Position Modulation (PPM)
consists in dividing the duration of each sequence of n bits into m=2n slots, corresponding to
the m symbols that can be encoded. Each time a pulse is sent, it is placed in one of these slots,
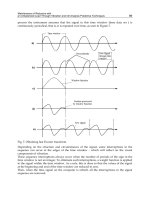
so that its value is defined by its position within the time interval (Fig. 15).
Fig. 15. Modulation of the sequence 101001 in OOK (above), and in 8-PPM (below).
That is a way (Hamkins & Moision, 2004) to get the Eq. (8), where the PPM technique is seen
to help to reduce the laser’s work cycle, and improve the signal-to-noise ratio at the cost of
requiring higher modulation speeds to keep the same binary rate.
peak
ave
m PPM
P
m
Pn
−
⎛⎞
=
⎜⎟
⎝⎠
(8)
Advances in Spacecraft Technologies
114
These modulation techniques could be considered versions of encoded OOK rather than real
modulations, because all of them are based on an amplitude modulation, or IM/DD
(Intensity Modulation/Direct Detection), as they are known in the field of traditional optical
communications. There are also coherent modulation techniques, based on the same
principles as RF, consisting in placing the received signal on top of a local laser’s signal, so
that the surface of the photodiode receives a mixture of signals. This way the local laser acts
as an amplifier of the received signal, resulting in a better signal-to-noise ratio. Unlike
intensity modulation techniques, coherent modulations allow various techniques to
modulate the signal, similar to the ones used in RF, like FSK (Frequency Shift Keying), PSK
(Phase Shift Keying), etc.
One way to evaluate the performance of each of these types of modulation is to calculate the
relation between the signal-to-noise ratios of both techniques. A comparison (Carrasco,
2005) between a coherent receptor and a direct-detection one, both being based on avalanche
photodiodes (APD), would provide Eq. (9). In it, SNR
c
and SNR
d
symbolize the signal-
tonoise ratio for coherent and non-coherent detectors respectively; P
l
and P
r
represent the
local laser’s power and the received signal’s power respectively; and M, x, R
0
, I
d
and N
t
refer
to an APD detector’s traditional parameters, that is, the APD multiplication factor, the
dependence on the material, the responsivity, the darkness current, and the spectral density
of power of the thermal noise. Eq. (9) proves that if P
l
is big enough the predominant noise
is the shot, and SNR
c
will always be bigger than SNR
d
because the numerator increases
faster than the denominator.
2
0
2
0
4
x
rd t
cl
x
dr ldt
eM R P I N
SNR P
SNR P e M R P I N
+
+
⎛⎞
++
⎛⎞
⎡⎤
⎣⎦
=
⎜⎟
⎜⎟
⎜⎟
⎜⎟
++
⎡⎤
⎝⎠
⎣⎦
⎝⎠
(9)
Although in theory the coherent modulation is superior to the non-coherent one in terms of
SNR, the implementation of a system based on coherent modulation involves a number of
problems that prevent its ideal behavior, such as the difficulty involved in the process of
mixture of signals at the photodetector’s entrance in the case of very short wavelengths, or
especially the effects added to the signal in its journey through the atmosphere (and the
shorter the wavelength, the more pronounced those effects are). In this case, the atmospheric
turbulence causes, among other things, the loss of spatial coherence by the wavefront, a
crucial factor in the mixture of signals that is necessary in any coherent modulation.
Atmospheric turburlence causes the most adverse effects in optical communications in free
space, due to air mass movements that cause random changes of the refraction index. The
effect of the turbulence is crucial in coherent systems, but it must always be taken into account
as it affects in variouos degrees all kinds of optical systems whose element includes the
atmosphere. Besides loss of spatial coherence, turbulence also causes widening of the received
beam, random wander of the beam’s center, and redistribution of the beam’s energy in its
transversal section resulting in irradiance fluctuations, also known as scintillation.
The downlink is generally the link causing the most difficulties in the design of a satellite
lasercom system. However, in the case of atmospheric turbulence, the uplink is the most
seriously affected, as the effect on the beam takes place in the first kilometers, and this
translates into an amplification throughout the rest of the journey, which is far longer than
with the downlink. Either with uplinks or with downlinks, the effect of the turbulence can
be mitigated with various techniques, among which stands out aperture averaging. This
Development of Optoelectronic Sensors and Transceivers for Spacecraft Applications
115
Fig. 16. Effect of turbulence on a received beam spot.
technique can be used by making the receiving opening bigger than the width of correlation
of the received irradiance fluctuations. If this requirement is met, the receptor becomes
bigger than a punctual one. Since the signal experiences instant fluctuations, it can be
integrated into different points corresponding to the same moment, with the result that the
receiver perceives several patterns of simultaneous correlations, and therefore while the
signal is integrated the level of scintillation decreases on the image plane. The effect of this
technique can be quantified with the aperture averaging factor (Andrews & Phillips, 2005):
2
2
()
(0)
IG
I
D
A
σ
σ
=
(10)
where σ
I
2
(0) is the level of scintillation in the case of a punctual receiver, and σ
I
2
(D
G
) is the
level of scintillation averaged out for an opening with a diameter of D
G
. Consequently, A
provides information about the improvement achieved between A=0 (for no fluctuations at
all) and A=1 (for no improvement). In the case of long-distance or deep-space links, the
order of magnitude of the irradiance spatial correlation width is clearly defined: In
downlinks, it is of a few centimeters, whereas in uplinks it is of tens of meters (Maseda,
2008); therefore a terminal placed in space will always act as a punctual receptor. By
contrast, in ground stations it is possible to use large telescopes or separate small ones
forming an array, in order to decrease scintillation fades in the downlink. The equivalent
technique for the uplink is based on transmitting through multiple mutually incoherent
beams, either by using various laser sources or by dividing the outgoing beam into several
smaller ones. If the laser beams are separated enough, they will propagate through
uncorrelated portions of the atmosphere, resulting in an effective single beam. Generally,
these scintillation fades can be reduced by increasing the number of beams. Very low
probability of fades can be obtained using 8–16 independent beams (Steinhoff, 2004).
As mentioned above, wavefront distortions caused by atmosphere turbulence are
particularly harmful in coherent systems. This loss of spatial coherence by the wavefront can
Advances in Spacecraft Technologies
116
be mitigated with adaptive optics (AO). This kind of systems, otherwise quite often used in
astronomical telescopes, provides real-time wavefront control, which allows the correction
of distortions caused by turbulence on a millisecond time scale. However, its application in
communication systems is not direct, due to significant differences with its imaging use: in
astronomical telescopes, losses in signal energy can be solved by observing longer, which is
not feasible when receiving information continuously. Besides, astronomical telescopes are
only used for night operation under weak turbulence. In communications, AO systems need
to work in daytime too, which causes strong turbulence conditions. The classic design of an
AO system is based on wavefront measurements that allow the reconstruction of distorted
wavefronts and the use of the resulting information to correct the incoming beam by means
of active optical elements, such as deformable mirrors based on micro-electromechanical
systems (MEMS). Wavefront measurement techniques can prove difficult under strong
turbulence and, to solve that, alternative designs (Weyrauch & Vorontsov, 2004) have been
proposed, based on wavefront control by optimization of a performance quality metric, such
as the signal strength, which is readily available in lasercom terminals.
Besides turbulence, the atmosphere causes other detrimental effects in optical
communication links, althouth they can be mitigated through various techniques. For
example, atmospheric gases, according to their composition, absorb part of the
electromagnetic radiation in ways that depend on their frequency. Although in some
regions the atmosphere is for all purposes opaque, there are some windows of minimal
absorption in the optical area of the spectrum, such as the visible zone, from about 350 nm
to around 750 nm, and those zones centered around 0.85 μm, 1.06 μm, 1.22 μm, 1.6 μm, 2.2
μm and 3.7 μm (Seinfeld & Pandis, 1998). Taking the atmospheric absorption into account is
crucial because it determines the choice of the link’s wavelength, although the effect of its
losses in the link is negligible if the choice of wavelength is correct.
Clouds cause other detrimental atmospheric effects and can even completely block a laser’s
transmission if they temporarily obstruct the line of sight. The variability in their
appearance and their seeming fortuitousness allow the use of only two methods to avoid
their presence during communications: a correct choice in placing the earth terminals, and
their replication, so that at any given moment at least one site be free of clouds, for which
locations are to be chosen that show no correlation in atmospheric variability. The most
adequate positionings usually coincide with those of astronomical observatories, which are
placed at altitudes, normally above 2000 m, so as to prevent the effects of the first layer of
the atmosphere. An availability of over 90% is possible if at least three redundant sites are
used (Link, Craddock & Allis, 2005).
The first of the techniques mentioned above is also used to mitigate the scattering effect.
Scattering is another of the effects that affect any optical signal propagating through the
atmosphere. It is due to the presence of particles with different sizes and refraction indexes,
which cause various types of light spread according to the relation between the particle size
and the wavelength, and the relation between the particle’s refraction index and the medium’s.
The most harmful effect caused by scattering over optical communications, particularly in
direct-detection systems, is not on the laser signal, but on the sun light during daytime and,
to a lesser degree, on the moon’s and planets’ light, if they come within the telescope’s field
of view. Solar photons are scattered by the atmospheric aerosols in all directions so that they
can propagate following the line of sight, causing a background noise that is received
together with the communication signal in the receiver, even if this is angularly far from the
sun. The noise power N
S
collected due to sky radiance is given by Eq. (11) (Hemmati, 2006).
Development of Optoelectronic Sensors and Transceivers for Spacecraft Applications
117
2
(,,)
4
S
D
NL
π
λ
λθϕ
Ω
Δ
=
(11)
where L(λ,θ,φ) is total sky radiance, a value that depends on wavelength λ, on the observer’s
zenith angle θ, and on the angular distance φ between observer and sun zenith angles. With
a given sky radiance, the noise power depends on the aperture diameter D (cm), on the field
of view Ω (srad), and on the filter width Δλ (µm). The way to decrease this noise in relation
to the sky radiance is that of the strategy mentioned above: a suitable location for the
ground station, which in this case means low concentration of scatterers and high altitude
sites. This choice is usually done according to sky radiance statistics collected by means of a
network of photometers like AERONET. The technological strategies used for decreasing
the sky background noise focus on the use of masks and solar rejectors, which prevent the
noise not directly entering the telescope’s field of view, and the use of very narrow filters,
which limit the receiver’s optical bandwidth, with widths below an angstrom.
The only way of completely preventing atmospheric effects is by placing all the terminals
above the atmosphere. This may be done by establishing intersatellite links, which involves
significant advantages and a great drawback – it’s cost. If the communication is carried out
entirely in space, any wavelength can be chosen, as it is free from the limitations imposed by
minimal absorption windows. For instance, very small wavelenghts, with lesser propagation
divergences, could be used, which offers the possibility to decrease the size of the telescopes
on board. A rough estimate (Boroson, Bondurant & Scozzafava, 2004): in a communication
between Mars and the Earth, a telescope on board a satellite around the Earth would need
2.6 meters to keep a link of the same capacity as a telescope of 8.1 meters placed on the earth’s
surface. Besides, sun light does not suffer scattering in space, whereas it does in the
atmosphere, therefore sun background noise gets minimized. The number of necessary
terminals is also greatly reduced, because direct vision lines are much wider, as the Earth does
not stand in the way. For example (Edwards et al., 2003), in order to keep a continuous
communication with Mars without the effects of the Earth’s rotation, 2 or 3 satellites would be
necessary, or between 3 and 9 ground stations. In short, the cost of a topology based on
receptor satellites is still bigger than through ground stations, although at very large distances
a receptor on the earth’s surface could become non-viable due to the effect of the atmosphere
on the very week received signal. As an intermediate option, the use of stratospheric balloons
has been proposed, which at altitudes over 40 km makes it possible to avoid 99% of the
atmosphere. However, this option also meets drawbacks such as the limited duration of the
flights (no more than 100 days), and the lack of a complete control of the trajectories.
3.4 Design constraints and strategies
The most basic tool to carry out a link design is the traditional equation, similar to the one
used in RF. The link equation (12) relates the mean received power (P
R
) and the transmitted
power (P
T
) in the following way (Biswas & Piazzolla, 2003):
P
RTTTPSARRM
PG L L G L
ηηη
=
⋅⋅⋅⋅⋅⋅⋅⋅
(12)
where G
T
and G
R
are the gains in transmission and reception; η
T
, η
R
y η
A
are the optical
efficiency of the transmitter and the receiver, and the atmosphere’s efficiency, all of which
can be taken as losses; L
P
, L
S
y L
M
are pointing losses, due to free space and other effects, like
mismatch of the transmitter and receiver polarization, etc. The most significant parameters
in the link equation can be easily quantified, which allows making a quick preliminary
Advances in Spacecraft Technologies
118
analysis of the link. The gains in transmission and reception can be worked out with the
equations (13) and (14) (Majumdar, 2005):
2
16
T
T
G =
Θ
(13)
2
R
D
G
π
λ
⎛⎞
=
⎜⎟
⎝⎠
(14)
where Θ
T
is the full transmitting divergence angle in radians, D is the telescope aperture
diameter and λ is the wavelength. The free-space losses are shown by the equation (15)
(Gowar, 1984):
2
4
S
L
L
λ
π
⎛⎞
=
⎜⎟
⎝⎠
(15)
where L is the distance between transmitter and receptor. Equations (13), (14) and (15)
would complete the link’s analysis in optical-geometric terms, which represents the most
important quantitative contribution to the link equation.
In the design of a lasercom link, key parameters are the laser’s transmission power, the
telescope aperture, and the wavelength, among others. When making decisions about these
parameters, the goal will always point to optimize the signal-to-noise ratio, which, as was
shown above, is the factor that sets the limits of a system’s performance.
The most direct way to optimize this parameter is by increasing the transmission power.
However, the improvement in the downlink is very limited because energy available in
space is also quite limited. Nevertheless the use of PPM modulation permits increasing the
peak power, keeping a low average consumption, as explained above. On the other hand, by
increasing the transmitting telescope’s aperture the beam divergence gets reduced, so that
the beam can be focused more, thereby making much better use of the transmitted energy.
The drawback is the increase in volume and mass of the satellite, and the resulting greater
difficulty in pointing the narrow beam. Normally, these two parameters –laser power and
telescope aperture– are maximized in accordance with the satellite platform’s requirements,
and then they are taken as fixed parameters.
An important design aspect is the choice of wavelength. This choice is first limited by the
technological availability of laser sources and optical detectors. For example, for deep-space
the tendency is to choose wavelengths close to 1.064 µm or 1.55 µm due to the availability of
high peak-to-average power lasers: Nd:YAG, Nd:YVO4, Nd:YKLF or erbium-doped fiber
amplifier lasers (Hemati, 2006). Although limited by these requirements, equation (2) shows
that the wavelength can be decreased with the same results as the increase in telescope
diameter, i.e., less beam divergence without affecting the flight terminal, except in relation
with the greater difficulty in pointing. However, the strength of intensity fluctuations due to
atmospheric turbulence decreases as λ
-7/6
(Majumdar & Ricklin, 2008), in the same way as
the scattering attenuation and sky radiance do as λ
-4
(Jordan, 1985), and consequently, if the
signal has to cross the atmosphere, shorter wavelengths provide a larger scintillation, which
could be a limiting factor when choosing them.
The natural tendency in satellite communication links is to transfer the system’s complexity
to the Earth, whenever possible. The reason is that any technological effort resulting in an
increase of weight, volume, consumption or complexity is more readily undertaken by a
Development of Optoelectronic Sensors and Transceivers for Spacecraft Applications
119
ground station than by a satellite. Regarding this aspect, there is a number of techniques that
make it possible to optimize the overall link performance, by making improvements in the
ground station. The most direct ones are the increase of the receiver’s collecting area and
the improvement in optoelectronic efficiency of the receptors.
It is certainly possible to increase the gain in reception by building a very large telescope,
although this method meets serious limitations due to the high costs and complexity of this
kind of installations. Nowadays, astronomical telescopes with the largest aperture only reach
10 meters, in spite of very high costs of development and maintenance. To overcome this
limitation in the ground station, a proposal has been made and tested (Vilnrotter et al., 2004)
consisting of a synthesis of very large optical apertures by means of arrays of smaller
telescopes. The difference between collecting light by using a large telescope and an array of
smaller ones is that in the first case all the light is focused before its detection, either with one
big element or an array of multiple smaller segments. By contrast, in an array of telescopes
each element in the array focuses the received beam into different photodetectors, in order to
later combine the signals in the electric domain. This idea offers the opportunity to rapidly
implement cost-effective large apertures, otherwise unfeasible by using one single telescope
that would require massive support structures, developing the necessary custom optics,
complex alignment process, etc, being all of this exacerbated by the great gravitational
requirements found in such heavy installations. Besides, there is a number of other significant
advantages: reuse in future, more demanding missions, by making use of their great scalability
through the addition of more telescopes to the array; very fast recovery in case of failure by
just replacing one telescope with a spare one; the possibility of flexibly managing all the
elements in the array for more than one simultaneous link; and lesser requirements over the
telescopes, which makes it possible to use cheap off-the-shelf systems.
Significant improvements in detector efficiency have also been carried out. With a detector
based on direct detection, the most straightforward method is by using photodetectors with
inner amplification, such as avalanche photodiodes (APD), or photomultiplier tubes (PMT).
The receiver’s noise contribution can be ignored in some ways, such as by cooling the
detector down to cryogenic temperatures; with high bias voltages, which leads to very high
amplification gains; and by using error correction coding to mitigate the effect of false
photon detections in the form of dark counts. This way it is possible to distinguish the
entrance of a single photon, procedure called photon counting. There are two types of
photon counters: linear and geiger-mode. The former can be implemented with an APD or a
PMT, and provide an electrical signal that is proportional to the number of received photons.
They are limited by the detector’s bandwidth, which gives the greatest temporary resolution to
distinguish photons. Geiger-mode photon counters work in a way similar to a Geiger counter
and are implemented by taking an APD’s bias voltage very close to saturation. The result is
that a photon’s arrival triggers a carrier’s avalanche that provides a very intense pulse, which
equates to an infinite gain. These devices are limited by the fact that, after each avalanche,
some recovery time (in the order of µs) must go by so as to bring the APD back to below
breakdown and make it ready for the next detection. During this time, the arrival of a new
photon would be ignored. This can be overcome by means of a GM-APD array, so that there is
an increased probability of some detector always being ready to trigger an avalanche. As in the
case of arrays of telescopes, the use of arrays of detectors offer additional advantages: It is
possible to use them to extract information for the tracking process, as well as information
related to atmospheric conditions, because they can distinguish between pixels; and they offer
a way to dynamically adapt the field of view, depending on the number of elements used. This
Advances in Spacecraft Technologies
120
type of detection has proved to offer efficiency improvements of up to 40× in terms of photons
per bit, compared with traditional systems (Mendenhall et al., 2007).
4. Conclusions
An optoelectronic velocity measurement system was designed, developed and implemented
using discrete circuits. The system is able to measure the velocity of small projectiles, flying at
speeds in the range from 30 to 1200 m/s. Velocity system is based on the noncontact
measurement of the projectile times of flight between three optical barriers. The velocity data
is computed by the control process unit (microcontroller) and the result is displayed on a LCD
mounted in the system and sent to remote computer using a serial protocol. The velocity
accuracy was theoretically calculated and experimentally evaluated. Values better than 1%
were obtained for the worst case, when one of the optical barrier. This accuracy depends
mainly on the projectile velocity and optical barrier distances, and it could be improved by
increasing either the clock frequency of microcontroller or the distance between optical
barriers. The influence of background light in the measured velocity is negligible. The
implemented system is simple, cost-effective, and robust against potential failures of the
optical elements and covers a wide velocity range from subsonic to supersonic.
Regarding to communication systems, a review has been made of the fundamentals on
which are based free-space lasercom transceivers on board spacecraft. As it was shown, this
new technology offers improvements of several orders of magnitude over present RF links,
and thus it seems to have a great potential in the future. However, the leap from microwave
frequencies to optical wavelengths involves a paradigm shift in how the information is
transmitted, which requires the development of a new technology at all levels of the
communication link. The influence of the main elements that make up a lasercom link has
been studied, focusing on the techniques that are most crucial to mitigate the specific
problems arising from this type of communication: atmospheric effects affecting optical
signals, difficulty in controlling the pointing and tracking, etc. Finally, an analysis of the
main strategies to be followed in the design of a free-space laser communication system has
been presented, so that all the key parameters involved in an optical link are revised.
5. References
Alon, Y. (1989). Doppler Radar Method and Apparatus for Measuring a Projectile's Muzzle Velocity,
United States Patent 4837718, Lear Siegler, Inc. (Santa Monica, CA), United States.
Andrews, L. C. & Phillips, R. L. (2005). Laser Beam Propagation through Random Media, SPIE Press
Monograph, Volume PM152, ISBN 0819459488, Bellingham, Washington, United States.
Biswas, A. & Piazzolla, S. (2003). Deep Space Optical Communications Downlink Budget
from Mars: System Parameters. The Interplanetary Network Progress Report, 42-154,
pp. 1-38, August, 2003.
Boroson, D. M.; Bondurant, R. S. & Scozzafava, J. J. (2004). Overview of High Rate Deep
Space Laser Communications Options, Free-Space Laser Communications Technologies
XVI, Proceedings of SPIE, Vol. 5338, pp. 37-49, January, 2004.
Carrasco, A. (2005). Diseño de un Enlace de Comunicaciones Ópticas con Marte. Engineering
degree final project, University of Málaga.
Ceniceros, J.M.; Sandusky, J. V. & Hemmati, H. (1999). 10 Gbps Shuttle-to-Ground Adjunct
Communication Link Capability Experiment, 1999 Shuttle Small Payloads Project
Office Symposium, NASA/CP-1999-209476, pp. 293-295, September, 1999.
Development of Optoelectronic Sensors and Transceivers for Spacecraft Applications
121
Chan, V.W.S. (2000). Optical Space Communications, Millennium Issue IEEE Journal on
Selected Topics in Quantum Electronics, Vol. 6, No. 6, pp. 959–975, November-
December, 2000.
Crittenden Jr., E.C.; King, R. A. & Andrews, T. C. (1973). Target Measurement System for
Precise Projectile Location, United States Patent 3727069, Litton Systems Inc. (Beverly
Hills, CA), United States.
Edwards, B. L.; Townes, S. A.; Bondurant, R. S.; Scozzafava, J. J.; Boroson, D. M.; Roberts, W. T.;
Biswas, A.; Pillsbury, A. D.; Khatri, F. I.; Burnside, J. W.; Bold, D. R.; Murphy, D. V.;
McIntosh, A. K.; Caplan, D. O.; DeCew, A. E.; Sharma, J; Parvin, B. A.; Fitzgerald, R. J.;
Zingales, S. H. & De Paula, R. (2003). Overview of the Mars Laser Communications
Demonstration Project, American Institute of Aeronautics and Astronautics AIAA Space
2003 Conference, Paper 2003-6417, pp. 1444-1454, September, 2003.
ESA multimedia gallery.
Fletcher, G. D.; Hicks, T. R. & Laurent, B. (1991). The SILEX Optical Interorbit Link
Experiment. Electronics & Communication Engineering Journal, Volume. 3, No. 6, pp.
273-279, ISSN 09540695, December, 1991.
Franz, J. H. & Jain, V. K. (2000). Optical Communications, Components and Systems. Alpha
Science Internacional Ltd, ISBN 1842650556, New Delhi, India.
Gowar, J. (1984). Optical Communication Systems. Prentice-Hall International Inc., ISBN
0136387276, London, United Kingdom.
Hamkins, J. & Moision, B. (2004). Selection of Modulation and Codes for Deep Space Optical
Communications. Free-Space Laser Communication Technologies XVI, Proceedings of
SPIE, Vol. 5338, pp. 123-130, January, 2004.
Hartwig, R. (1986). Accuracy of Velocity Measurement of Projectiles with Fins and Tracers
by Means of Sky-Screens. Journal of Ballistics. Vol. 9, No. 3, pp. 2299-2310, 1986.
Hecht, E. (2002). Optics. Addison Wesley, ISBN 0321188780, San Francisco, United States.
Hemmati, H. (2006). Deep Space Optical Communications. John Wiley & Sons, ISBN
0470040025, New Jersey, United States.
Henniger, H.; Giggenbach, D; Florian, D. & Rapp, C. (2003). Evaluation of FEC for the
Atmospheric Optical IM/DD Channel, Free-Space Laser Communication Technologies
XV, Proceedings of the SPIE, Vol. 4975, pp. 1-11, July, 2003.
Jeganathan, M.; Toyoshima, M.; Wilson, K.; James, J.; Xu, G. & Lesh, J. (1997). Data Analysis
Results from the GOLD Experiments. Free-Space Laser Communications Technologies
IX, Proceedings of SPIE, Vol. 2990, pp. 70-81, April, 1997.
Jordan, E. C. (1985). Reference Data for Engineers: Radio, Electronics, Computer & Communications.
Howard W. Sams & Co., Inc., ISBN 0672215632, Indiana, United States.
Lambert, S. G. & Casey, W. L. (1995). Laser Communications in Space. Artech House, ISBN
0890067228, Boston, United States.
Layland, J. W & Rauch, L. L. (1997). The Evolution of Technology in the Deep Space
Network: A History of the Advanced Systems Program. The Telecommunications and
Data Acquisition Progress Report, TDA PR 42-130, pp. 1-44, August, 1997.
Link, R. P.; Craddock, M. E. & Allis, R. J. (2005). Mitigating the Impact of Clouds on Optical
Communications, Aerospace Conference 2005 IEEE, pp. 1258-1265, ISBN 0780388704,
March, 2005.
Majumdar, A. K. (2005). Free-space Laser Communication Performance in the Atmospheric
Channel. Journal of Optical and Fiber Communications Research, Volume 2, No. 4, pp.
345-396, October, 2005.
Majumdar, A. K. & Ricklin, J. C. (2008). Free-Space Laser Communications, Principles and
Advances. Springer, ISBN 9780387286525, New York, United States.
Advances in Spacecraft Technologies
122
Maseda, R. H. (2008). Estudio de Enlaces de Comunicaciones Ópticas a Grandes Distancias en
presencia de Turbulencia Atmosférica. Engineering degree final project, Carlos III
University of Madrid.
Mendenhall, J. A.; Candell, L. M.; Hopman, P. I.; Zogbi, G.; Boroson, D. M.; Caplan, D. O.;
Digenis, C. J.; Hearn, D. R. & Shoup, R. C. (2007). Design of an Optical Photon
Counting Array Receiver System for Deep-Space Communications. Proceedings of
the IEEE, Volume 95, No. 10, pp. 2059-2069, ISSN 00189219, October, 2007.
Moss, G.M.; Leeming, D.W. & Farrar, C.L. (1995). Military Ballistics: a basic manual, Brassey’s
New Battlefield Weapons Systems and Technology Series, ISBN 1857530845,
London, United Kingdom.
Ortiz, G. G.; Jeganathan, M.; Sandusky, J. V. & Hemmati, H. (1999). Design of a 2.5 Gbps
Optical Transmitter for the International Space Station. Free-Space Laser
Communication Technologies XI, Proceedings of SPIE, Vol. 3615, pp. 179-184, April, 1999.
Ortiz, G. G.; Lee, S. & Alexander, J. W. (2001). Sub-microradian Pointing for Deep Space
Optical Telecommunications Network. 19th AIAA International Communications
Satellite Systems Conference, 921, pp. 1-16, No. 921, April, 2001.
Paulter, Jr. N. G. & Larson, D. R. (2009). Reference Ballistic Chronograph, Optical
Engineering, Vol. 48, No. 4, pp. 43602-43607, April, 2009.
Pena, J. M. S.; Marcos, C.; Fernández, M. Y. & Zaera, R.(2007). Cost-Effective Optoelectronic
System to Measure the Projectile Velocity in High-Velocity Impact Testing of
Aircraft and Spacecraft Structural Elements, Optical Engineering, Vol. 46, No. 5, pp.
510141-510146, ISSN 00913286, May, 2007.
Schroder K.A.; Allen R.J.; Parker J.V. & Snowden P.T. (1999). In-Bore Measurements Using
an Optical Data Link, IEEE Transactions on Magnetics, Vol. 35, pp. 95-99, ISSN
00189464, January 1999.
Seinfeld, J. H. & Pandis, S. N. (1998). Atmospheric Chemistry and Physics: From Air Pollution to
Climate Change. John Wiley & Sons Inc., ISBN 0471178160, New York, United States.
Steinhoff, N. (2004). Irradiance and Fade Characteristics for the JPL MLCD Program. The
Optical Science Company, Report No. TR-1657, California.
Taylor, J.; Lee, D. K. & Shambayati, S. (2006). Mars Reconnaissance Orbiter
Telecommunications. DESCANSO Design and Performance Summary Series, Article 12.
Vilnrotter, V.; Andrews, K.; Lau, C. & Srinivasan, M. (2004). Conceptual Design of an
Optical Array Receiver, with Preliminary Experimental Results. The Interplanetary
Network Progress Report, Volume 42-156, pp. 1-9, February, 2004.
Weyrauch, T & Vorontsov, M. A. (2004). Free-space Laser Communications with Adaptive
Optics: Atmospheric Compensation Experiments. Journal of Optical and Fiber
Communications Research, Volume 1, No. 4, pp. 355-379, ISBN 18673007, December, 2004.
Wilde, A. F.; Roylance, D. K. & Rogers, J. M. (1973). Photographic Investigation of High-
Speed Missile Impact Upon Nylon Fabric, Part I: Energy Absorption and Cone
Radial Velocity in Fabric, Textile Research Journal, Vol. 43, No. 12, pp. 753-761,
December, 1973.
Wilson, K. E.; Lesh, J. R. & Yan, T. Y. (1993). GOPEX: A Laser Uplink to the Galileo
Spacecraft on Its Way to Jupiter. Free-Space Laser Communication Technologies V,
Proceedings of SPIE, Volume 1866, pp. 138-146, January, 1993.
Zukas, J. A.; Nicholas, T. & Swift, H. F. (1992). Impact Dynamics
, Krieger Publishing
Company, ISBN 0894646907, Florida, United States.
6
Solar Electric Propulsion Subsystem
Architecture for an All Electric Spacecraft
Dr. Michele Coletti, Dr. Angelo Grubisic,
Cheryl Collingwood and Prof. Stephen Gabriel
University of Southampton,
United Kingdom
1. Introduction
For many space missions, both a main propulsion subsystem and additional attitude control
(AOCS) propulsion subsystem are required. These subsystems normally use different
propellants, hence require separate tanks, different flow control units (FCU) and, in case of
solar electric propulsion (SEP), separate power processing units (PPU). This leads to
increases in total mass of the spacecraft and complexity while reducing system specific
impulse.
One possibility to alleviate this problem would be to develop a main and an AOCS
propulsion technology which could be integrated, sharing some of the components required
for their operation, hence reducing system mass. A spacecraft employing such combined
technologies as part of an SEP system is referred to as an “All-electric-spacecraft” (Wells et
al., 2006).
In this chapter, the system design for an all-electric-spacecraft will be presented. A gridded
ion engine (GIE) is proposed as a main propulsion subsystem with hollow cathode thrusters
(HCT) considered for the AOCS propulsion subsystem. The mission considered during this
study is the ESA European Student Moon Orbiter (ESMO), which the University of
Southampton proposed to use SEP for both attitude control and main propulsion. During
the ESMO phase-A study, a full design of the SEP subsystem was performed at QinetiQ as
part of a wider study of the mission performed in conjunction with QinetiQ staff and
funded by ESA. The output of this study will be here presented to explain the concept of the
all-electric-spacecraft, its benefits, drawbacks and challenges.
1.1 The european student moon orbiter mission
ESMO is a student mission sponsored by the European Space Agency that started in 2006
and that, at present, is planned to be launched in early 2014
( ESMO will be completely
designed, built and operated by students from across Europe resulting in the first European
student built satellite reaching the moon. ESMO will be launched in a geostationary transfer
orbit (GTO) as a secondary payload and from there will have to use its onboard propulsion
to move to a lunar polar orbit. The payload will consist of a high resolution camera for
optical imaging of the lunar surface.
Advances in Spacecraft Technologies
124
3. SEP subsystem definition
As already anticipated in the introduction, the SEP subsystem proposed by Southampton
University was based on the idea of an all-electric spacecraft, where a gridded ion engine
provides primary propulsion and where hollow cathode thrusters are used to unload
momentum from the reaction wheels. The gridded ion engine is based on the flight model
hardware of the GOCE (Gravity and Ocean Open Circulation Explorer) mission T5 GIE,
developed by QinetiQ (Edwards et al., 2004), whereas the HCTs to be used for AOCS will be
based on the T5 discharge cathode.
The proposed SEP subsystem comprises:
• a single T5 GIE.
• eight HCTs used for AOCS functions.
• one or two (depending on the subsystem configuration) power processing units (PPU)
to process and supply power to the T5 GIE and to the HCTs.
• one or two (depending on the subsystem configuration) flow control units (FCU) to
regulate the propellant flow to the T5 GIE and to the HCTs.
• a tank for propellant storage.
During the course of this study, it has been assumed that the thruster to be used onboard
ESMO will have the same performance as the GOCE T5 GIE (Table 1).
GOCE T5
Thrust 1-20 mN
Specific Impulse 500-3500 s
Power 55-585 W
Table 1. T5 GOCE performance (Wells et al., 2006)
3.1 SEP subsystem design options and trade off
Three different design options were identified for the SEP subsystem, based on the level of
integration between the GIE and HCTs.
Option 1 – High mass, low risk, low cost
Fig. 1. First SEP subsystem architecture option: high mass, low risk, low cost
GIE PPU
HCTs
HCT PPU
Xe TANK
HCT FCU
GIE FCU
T5 GIE
data
power
propellant
Solar Electric Propulsion Subsystem Architecture for an All Electric Spacecraft
125
This is the option with the lowest risk and cost. Only the propellant tank is shared between
the main propulsion and AOCS propulsion systems, hence leaving the more critical (and
more expensive) components, such as the flow control units and the power processing units,
unaltered. The low level of risk and cost is reflected in a low level of integration but results
in a high system mass.
Option 2 – Medium mass, low risk, low cost
Fig. 2. Second SEP subsystem architecture option: medium mass, low risk, low cost
This option differs from the first by integrating the GIE and HCT flow control units into a
single FCU. This provides a reduction of the system mass, whilst the cost and risk are kept
relatively low since the PPUs (regarded as the most critical component) are left unmodified.
Separate PPUs, able to supply the T5 GIE and the T5 HCTs already exist. An integrated
PPU, able to supply both a GIE and several HCTs requires development and so will bring a
high level of cost.
Option 3 – Low mass, high risk, high cost
Fig. 3. SEP subsystem architecture option three: low mass, high risk, high cost
The level of integration is maximized in this final option, with the tank, PPU and FCU all
being shared between the GIE and the HCTs. This leads to the lowest achievable system
mass but conversely results in a high level of risk, since a new PPU must be designed able to
supply both the GIE and several HCTs.
Considering that this study was carried out for a student mission with strict budget
constraints, and that an EP mission to the Moon is in itself challenging, option 2 was
HCTs
Xe TANK
T5 GIE
data
power
propellant
FCU
PPU
GIE PPU
HCTs
HCT PPU
Xe TANK
T5 GIE
data
power
propellant
FCU
Advances in Spacecraft Technologies
126
selected since it provides a low level of risk, whilst providing a medium level of integration
and a relatively low system mass in comparison to the two non-integrated systems.
Once the general architecture has been fixed two other tradeoffs were carried out.
The first concerns compensation of the torque caused by any thrust misalignment of the
main engine. Considering the long duration of the mission, associated with the long transfer
time from GTO to the Moon for a SEP subsystem, the amount of propellant needed for the
HCTs to compensate the torque is not negligible. Three options are available to reduce the
thrust misalignment of the main engine; use of a gimbal, use of thrust vectoring or the
choice to use additional propellant and accept the losses.
Thrust vectoring can be achieved using a set of movable grids on the GIE (Jameson, 2007).
This technique is still experimental and hence, due to the level of risk involved, this solution
was discarded. A gimbal is a relatively heavy, complex and expensive component whereas
carrying additional propellant would be by far the simplest approach, though adversely
affecting the overall mass budget.
The second trade-off to be carried out concerned the operation of the HCTs. Two possible
options were identified: one option was to utilize a dedicated HCT PPU, able to drive as
many HCTs as required whilst also driving the main propulsion system, the second option
involved use of a switchbox utilizing the neutralizer cathode supply present inside the T5
GIE PPU.
Overall, four options exist for the subsystem design:
• HCTs driven by a dedicated PPU.
• HCTs driven by the neutralizer supply inside the T5 PPU via a switchbox.
• HCTs driven by a dedicated PPU plus a gimbal to reduce thrust misalignment.
• HCTs driven by the T5 PPU via a switchbox plus a gimbal to reduce thrust
misalignment.
A comparison between all these options is reported in Table 2.
It is evident from Table 2 that the use of a gimbal produces a significant increase to the
overall AOCS related mass. This option was therefore discarded.
The mass of the two remaining options differs by 4kg, due to the presence (or not) of a
dedicated HCT PPU. These two options were traded against each other due to the cost and
operational impact that the presence of a dedicated HCTs PPU would have.
The cost related to the development of a dedicated HCTs PPU would be substantial, based
on estimates provided by QinetiQ; the cost would be twice that for development of a
switchbox.
Regarding operation of the spacecraft, it must be noted that a switchbox offers no flexibility
in the operation of the GIE and HCTs, since each time the HCTs must be used, the GIE must
be switched off. Considering that the HCTs will be needed for a period from 1/3 to 1/6 of
each orbit, the use of a switchbox would significantly reduce the average thrust produced by
the GIE and consequently increase the transfer phase length and propellant required. The
use of a dedicated PPU will instead allow both the main thruster and the HCTs to operate at
the same time though, due to the limited power availability, the T5 GIE will have to be
throttled down to free enough power for the HCT operations. More importantly, not having
to switch off the main thruster each time the HCTs are used and perform a GIE shut-down
and start-up procedure, management of the thruster subsystem is simplified.
Following the trade off studies, the use of a dedicated HCT PPU was chosen as the baseline
option.
Solar Electric Propulsion Subsystem Architecture for an All Electric Spacecraft
127
Dedicated HCTs
PPU without
gimbal
Dedicated HCT
PPU with gimbal
Switchbox
without gimbal
Switchbox with
gimbal
Mass Margin Mass Margin Mass Margin Mass Margin
Thrust
misalignment
propellant mass
3 Kg 20% 0 Kg 20% 3 Kg 20% 0 Kg 20%
Solar pressure,
safe
manoeuvres
and initial
despin
1 Kg 20% 1 Kg 20% 1 Kg 20% 2 Kg 20%
HCT PPU 4 Kg 15% 4 Kg 15%
gimbal 7 Kg 5% 7 Kg 5%
Switchbox 0.5 Kg 20% 0.5 Kg 20%
Total AOCS
related mass
9.4 Kg 13 Kg 5.4 Kg 10.35 Kg
Table 2. Comparison between a dedicated HCTs PPU and a switchbox with or without a
gimbal
4. SEP baseline design description
The baseline design comprises:
• A single flight spare T5 GOCE GIT
• Eight HCTs (to provide some level of redundancy)
• A T5 PPU
• A HCT PPU
• A FCU able to supply both the HCTs and the T5 GIT
• A pressurized Xenon tank
4.1 T5 gridded ion thruster
The QinetiQ T5 Ion Thruster is a conventional electron bombardment, Kaufman-type GIE (a
schematic of which is shown in Fig. 4).
In this kind of thruster a DC discharge is established between a hollow cathode (HC) and a
cylindrical anode. The energetic electrons emitted from the HC collide with neutral
propellant atoms injected upstream, resulting in ionization. The efficiency of the ionization
is enhanced by the application of an axial magnetic filed to constrain the electron motion.
The ions produced are then extracted and accelerated by a system formed of two perforated
disks (called grids), across which a potential difference of about 1.5 kV is applied. An
external HC, referred to as the neutraliser, emits the electrons necessary to neutralise the
space charge of the emerging ion beam.
Advances in Spacecraft Technologies
128
Anode
Solenoid
Earthed
screen
Xe f low
NEUTRALISER
ASSEMBLY
Neutraliser
Xe f low
Cathode
Xe flow
Main flow
CATHODE
ASSEMBLY
Insulators
Feromagnetic Circuit
St ainless Steel
Magnetic Field Line
Molybdenum
Sc re en
Grid
Accel
Grid
Baffle
Discharge
Chamber
Backplate and
Inner pole
Cathode
Keeper
Front
Pole
Cathode
Tip
Fig. 4. A Kaufmann type gridded ion thruster schematic (T5) (image courtesy of QinetiQ)
The T5 GIT specifications for the GOCE application are reported in Table 3
Mass 1.7 kg
Dimensions Ø 170 mm x 200 mm long
Mean Power
Consumption
up to 600 W @ 20mN
Thrust Range 1 to 20 mN
Specific Impulse 500 s to 3500 s (across thrust range)
Total Impulse
> 1.5 x 10
6
Ns (under GOCE continuous
throttling conditions)
T5 capability > 8500 On/Off cycles
Table 3. T5 GIT specification (GOCE)
Solar Electric Propulsion Subsystem Architecture for an All Electric Spacecraft
129
4.2 T5 Power processing unit
The power processing unit the will be used to drive the T5 GIE and the T5 FCU will be
similar to the EADS Astrium Crisa GOCE PPU (Tato, de la Cruz, 2007). The PPU includes
both a high voltage and a low voltage supply with the associated telemetry. The high
voltage supply will be used to apply the required potential for the first of the two grids,
whereas the low voltage supply will be used to operate the neutralizer and apply the
potential for the second of the thruster grids. A schematic of the PPU is displayed in Fig. 5
whilst specifications are reported in Table 4.
AC Inverter
100V
CPU ERC 322
RAM ROM &
EEPROM
FPGA
ML 1553B
Interface
Aux
Supply
Discharge Cathode
Heater Supply
Discharge Cathode
Strike Supply
Discharge Cathode
Keeper Supply
Anode Discharge
Supply
Burn-away Supply
Accel Grid
Supply
Neutraliser Cathode
Heater Supply
Neutraliser Cathode
Strike Supply
Neutraliser Cathode
Keeper Supply
Analog I/O
ADC &DAC
TM/TC
Contro l
Faraday Housing
Primary Power
HPC ON/OFF
ON/OFF status
MIL BUS A
MIL BUS B
PPS
TEST
Control Electronics
PXFA Interface
Valve
drivers
Pressure sen so r s
Temp sensors
15V
Analog I/O
ADC &DAC
TM/TC
Contro l
Aux
Supply
Magnet Supply
Set Current
Ion Beam Supply
Primary Power
Fig. 5. GOCE PPU schematic (image courtesy of EADS Astrium Crisa)
Mass 16 kg
Dimensions 300 x 250 x 150 mm
Operating temperature -20 °C to +50 °C
Operating lifetime
15 years in orbit (GOCE PPU qualification to mission
duration of 2 years)
Nominal input voltage
22 - 37 V extended input range to 20 V without
degradation
Maximum input current 37 A @ 22 V
Power 55-585 W
Electrical efficiency Beam supply 92 – 95% other supplies ≥ 92%
Table 4. T5 GOCE PPU specification
Advances in Spacecraft Technologies
130
4.3 Hollow cathode thruster
The thrust generated by a hollow cathode thruster in open-diode configuration (HC and a
single anode) has been extensively characterized at the University of Southampton
(Grubisic, 2009).
The basic feasibility of a HCT has been demonstrated and thrust levels up to several mN
have been measured with specific impulse of the order of hundreds of seconds. More
recently in light of its beneficial electrical characteristics, a T5 hollow cathode has undergone
preliminary thrust characterization for application on ESMO. The experiment used a T5
STRV-A1 (Space Technology Research Vehicle) DRA (Defence Research Agency) flight-
spare cathode launched in June 1994. This included an experiment to allow the hollow
cathode assembly to demonstrate spacecraft electrostatic discharging. The cathode is rated
at a maximum DC current of 3.2A at flow rates typically 0.04 -1mgs
-1
operating below 90W.
The T5 cathode was originally designed for the main discharge cathode in the UK-10 ion
engine and has been extensively characterized (Crofton, 1996). The cathode assembly
contains a tungsten dispenser, 1.0mm ID x 2.8mm OD x 11mm, impregnated with a mixture
of barium-oxide, calcium oxide and aluminates (BaO: CaO: Al
2
O
3
), which lowers the insert’s
work function for thermionic emission and maintains a working temperature of ~1000°C. A
solid tantalum tip welded to the cathode body contains an axial orifice 0.2mm in diameter
and 1mm long. The face of the T5 cathode is shown in Fig.6.
Fig. 6. T5 Hollow Cathode Thruster
The open keeper has a 3mm diameter aperture and is mounted 3mm downstream of the
cathode tip, with the whole assembly mounted on a UK-25 ion thruster back-plate. In typical
hollow cathodes a keeper electrode usually draws approximately 1A of current, however in
this study the cathode is operated in an open-diode configuration with the full discharge
current being drawn to the keeper, which is now termed the anode. Previous studies on this
type of hollow cathode have incorporated a much larger anode disk and a secondary
discharge between the keeper and the anode and applied magnetic fields to simulate a
Kaufman ion engine environment.
Open-diode configuration is more representative of a standalone microthruster
configuration with no need for a coupled discharge. Results for the various current
conditions are shown in Fig. 7.
Solar Electric Propulsion Subsystem Architecture for an All Electric Spacecraft
131
Fig. 7. Measurements of specific impulse with mass flowrate
Results show near monotonic dependence of specific impulse on discharge current with
rapidly increasing performance below 0.4mgs
-1
for the 3.2 and 1.6 Amp throttle settings with
a less pronounced increase at 0.8 Amps. Since a change in flow rate results in a change in
operating voltage it is seen that specific impulse can be correlated with specific power of the
flow (J/mg) and a product of the discharge current and operating voltage, shown in Fig. 8.
Operation at low powers (<13W) in the low current condition (0.8Amp) brings relatively
high specific impulse of up to 165 seconds. At the high current condition operation at
powers below 30W give specific impulse in the region of 250s. Further reduction in flow rate
increases operating voltage and power invested in the flow. This results in a quadratic
increase in specific impulse with declining thrust efficiency as convective and radiative
losses begin to dominate.
Fig. 8. Dependence of specific impulse on specific power at the various current levels with
argon for the T5FO cathode
Advances in Spacecraft Technologies
132
The highest specific impulse of 429s was attained at 3.2 Amps, with 1.1% thrust efficiency,
79W discharge power. Specific impulse can be traded for higher thrust to power ratios by
increasing propellant flow rates or decreasing discharge current (however higher thrust
efficiencies are obtained at higher discharge currents) generating thrust efficiencies of 14%
(200μN/W) and specific impulse of 167s at 0.8Amps, and over 8% at the maximum rated
current capacity of 3.2 Amps, with specific impulse ~250s (77μN/W, 35W discharge power).
Thrust production with respect to specific impulse is shown in Fig. 9. Up to 2.4mN could be
generated at higher currents, with the maximum flow rate of 1mgs
-1
with specific impulse
over 250s.
Fig. 9. Thrust and specific impulse attained at various current conditions in the T5 cathode
4.4 Hollow cathodes thruster PPU
The HCT PPU is sketched in 10.
The HCTs PPU consists of two anode and heater supplies and of a high voltage strike
supply. The anode and heater supply is used to power the cathode heater during the start
up phase and then, once the cathode is started using the HV strike supply, to power the
cathode keeper to sustain its discharge. Two anode and heater supplies are present to allow
the use of two HCTs at the same time that can be selected thanks to a system of switches. A
mass estimate for this HCT PPU is 4 kg.
The anode and heater power supply is taken from the T6 neutralizer cathode PPU and is
able to provide 3A@90W. Such a supply is over-sized for a T5 hollow cathode (as can be
seen from the data in Section 4.3) hence further study will be carried out to verify the
possibility of powering two hollow cathodes in series (in this case with the PPU here
presented we will be able to power four HCTs or alternatively we can use only one keeper
heater supply saving mass).
4.5 Flow Control Unit
A suitable design for the FCU has been developed in collaboration with Thales Alenia Space
(Matticari et al., 2005; Matticari et al., 2006; Van Put et al., 2004; van der List et al., 2006).
Solar Electric Propulsion Subsystem Architecture for an All Electric Spacecraft
133
Anode and Heater
Supply
Const. Current
+
-
Anode and Heater
Supply
Const. Current
-
+
HV Strike
Supply
Const. Voltage
-
+
ML 1553B
Interface
TM/TC
Control
Aux
Supply
HCT Power Supply and
Switch Unit
Fig. 10. HCT PPU schematic
Component
Mass flow rate
[mg/s]
Pressure
T5 GIT 0.07 – 0.53 ±0.007
13 mbar (gas flow only)
20 mbar (gas flow &
discharge)
T5 discharge
cathode
0.1 ± 0.007
10 mbar (gas flow only)
100 mbar (gas flow &
discharge)
T5 neutralizer 0.041 ± 0.006
10 mbar (gas flow only)
100 mbar (gas flow &
discharge)
HCT 0.5 – 1.5
100 mbar
~ 1 bar (cold gas mode)
Table 5. Pressure and mass flow requirements
The design of the FCU, able to supply propellant to both the T5 GIE and to the HCTs,
assumes that the HCTs will always be operated in pairs. Pressure and mass flow
requirements are reported in Table 5.