Advances in Vehicular Networking Technologies Part 12 potx
Bạn đang xem bản rút gọn của tài liệu. Xem và tải ngay bản đầy đủ của tài liệu tại đây (3.28 MB, 30 trang )
Advances in Vehicular Networking Technologies
322
[16] A. Abbasfar, K. Yao, and D. Disvalar, Accumulate repeat accumulate codes, in Proc.
IEEE Globecomm, Dallas, Texas, Nov. 2004.
[17] G. Liva, E. Paolini, and M. Chiani, Simple reconfigurable low-density parity-check
codes, IEEE Comm.Letters, vol. 9, pp. 258–260, March 2005.
[18] B. Matus, Link Layer Coding for DVB-S2 Interactive Satellite Services to Trains, in Proc.
IEEE VTC, Sigapore, May. 2008
18
Mobility Aspects of Physical Layer in Future
Generation Wireless Networks
Asad Mehmood and Abbas Mohammed
Blekinge Institute of Technology Karlskrona
Sweden
1. Introduction
The demand from social market for high speed broadband communications over wireless
media is pushing the requirements of both the mobile and fixed networks. The past decade
has witnessed tremendous advancement in the blooming development of mobile
communications including mobile-to-mobile and mobile-to-fixed networks. Wireless fixed
and cellular networks of future generation will need to support new protocols, standards and
architecture leading to all IP-based networks. Different systems like digital video
broadcasting (DVB) via satellites have great success commercially as they provide ubiquitous
coverage and serve large number of users with high signal quality. Satellite communications
have proven to be attractive means to provide communication services such as broadband
communications (3G services), surveillance, remote monitoring, intelligent transportation
systems, navigation, traffic warnings and location-based information etc. to fixed and mobile
users. However, to meet the growing demands of mass market integration of satellites and
terrestrial networks seems to be inevitable for future generation wireless networks.
Due to technology advances and growing traffic demands, communication systems must
evolve to completely new systems or within themselves in order to provide broadband
services in a safe and efficient way. While enhancements continue to be made to leverage
the maximum performance from currently deployed systems, there is a bound to the level to
which further improvements will be effective. If the only purpose were to deliver superior
performance, then this in itself would be relatively easy to accomplish. The added
complexity is that such superior performance must be delivered through systems which are
cheaper from installation and maintenance prospect. Users have experienced an incredible
reduction in telecommunications charges and they now anticipate receiving higher quality
communication services at low cost. Therefore, in deciding the subsequent standardization
step, there must be a dual approach: in search of substantial performance enhancement but
at reduced cost. Long Term Evolution (LTE) is that next step and will be the basis on which
future mobile telecommunications systems will be built. LTE is the first cellular
communication system optimized from the outset to support packet-switched data services,
within which packetized voice communications are just one part.
In case of highly mobile scenarios, the effects of signal blockages and Doppler shifts
introduce more burdens on the receiver demodulator. The signals blockage is prominent in
the case of land mobile communications as compared to satellite communications. In
deciding the technologies to comprise in LTE, one of the key concerns is the trade-off
Advances in Vehicular Networking Technologies
324
between cost of implementation and practical advantage. Fundamental to this assessment,
therefore, has been an enhanced understanding different scenarios of the radio propagation
environment in which LTE will be deployed and used.
The organization of the chapter is as follows. In section 2, different mobility aspects related
to the physical layer of future generation mobile communication networks are discussed.
Section 3 discusses the propagation scenarios in which LTE will be deployed. Section 4
describes space-time processing techniques to enhance the system performance. In section 5
LTE system’s performance is evaluated at different mobile speeds. Finally, section 6
concludes the chapter.
2. Physical layer aspects
The high data rate multimedia broadcast/multicast services at cheap rates with appropriate
quality-of-service (QoS), fast handoff techniques and wide area seamless mobility pave the
way for future generation wireless communications. Wireless network operators require
different schemes for including new services to take benefits from new access technologies.
Fundamental to these strategies is to incorporate mobility that can bring unique advantages
to mobile users. In response to these requirements, the wireless industry is foreseen to shift
toward LTE and world wide interoperability of microwave access (WiMAX) technologies to
be able to support cost effectively the capacity required by mobile operators to meet mass
market demands of data services (Motorola, 2010). LTE must be able to provide superior
performance compared to the existing wireless network infrastructures which suffer from
cell-edge performance, spectral efficiency and desired QoS to end users. In order to provide
high data rates with high QoS in already crowded spectrum, LTE is susceptible to different
impairments: noise and interference. Therefore to mitigate these propagation impairments,
efficient and robust techniques need to be adapted to take full benefits of the technology. A
thoughtful design of physical layer aspects to mitigate these propagation impairments and
improve the system performance is thus crucial for successful operation and support of the
desired QoS.
2.1 Objectives of physical layer
The objectives of LTE physical layer are the significant increase in peak data rates up to
100 Mb/s in downlink and 50 Mb/s in uplink within 20 MHz spectrum leading to spectrum
efficiency of 5 Mb/s, increased cell-edge performance maintains site locations as in Wide
Band Code Division Multiple Access (WCDMA), reduced user and control plane latency to
less than 10 ms and less than 100 ms, respectively (Kliazovich1, et al.). LTE will be able to
provide interactive real-time services such as high quality video/audio conferencing and
multiplayer gaming with mobility support for up to 350 km/h or even up to 500 km/h and
reduced operation cost. It also provides a scalable bandwidth 1.25/2.5/5/10/20 MHz in
order to allow flexible technology to coexist with other standards, 2 to 4 times improved
spectrum efficiency the one in Release 6 HSPA to permit operators to accommodate
increased number of customers within their existing and future spectrum allocation with a
reduced cost of delivery per bit, low power consumption and acceptable system and
terminal complexity. The system should be optimized for low mobile speed but also support
high mobile speed as well. In this section we will discuss some of the features included in
LTE physical layer to mitigate propagation impairments.
Scalable OFDMA: Multiple access schemes are used in multi-user communications to
provide on-demand data rates to users by sharing the available resources in available finite
Mobility Aspects of Physical Layer in Future Generation Wireless Networks
325
bandwidth. The orthogonal frequency division multiple access (OFDMA) is used as
multiple access scheme in the downlink and single carrier frequency division multiple
access (SC-FDMA) is used in the uplink. OFDMA is OFDM based multiple access technique
used for LTE to facilitate the exploitation of multi-user diversity, frequency diversity and
flexible users scheduling to enhance the system capacity in challenging multi-user
communications with wide range of applications, data rates and QoS requirements. The
flexible structure of OFDMA allows efficient implementation of space-time processing
techniques, e.g., multiple-input multiple-output (MIMO) with reasonable complexity. The
scalable bandwidth with different FFT sizes and dynamic subcarrier allocation allows the
efficient use of spectrum in different regional regulations for mobile applications.
Frame Structure and Transmission Modes: LTE supports two types of frame structures:
type1 frame structure which is designed for frequency division duplex (FDD) and is valid
for both half duplex and full duplex FDD modes. Type 1 radio frame has a duration 10 ms
and consists of 20 slots each of 0.5 ms. A sub-frame comprises two slots, thus one radio
frame has 10 sub-frames. In FDD mode, half of the sub-frames are available for downlink
and the other half are available for uplink transmission in each 10 ms interval, where
downlink and uplink transmission are separated in the frequency domain (3GPP, 2008).
Type 2 frame structure is applicable for time division duplex mode (TDD). The radio frame
is composed of two identical half-frames having duration of 5 ms. Each half-frame is further
divided into 5 sub-frames having duration of 1 ms. Two slots of length 0.5 ms constitute a
sub-frame which is not special sub-frame. The special type of sub-frame is composed of
three fields Downlink Pilot Timeslot (DwPTS), GP (Guard Period) and Uplink Pilot Timeslot
(UpPTS). Seven uplink-downlink configurations are supported with both types (10 ms and 5
ms) of downlink-to-uplink switch-point periodicity. In 5 ms downlink-to-uplink switch-
point periodicity, special type of sub-frames are used in both half-frames but it is not the
case in 10 ms downlink-to-uplink switch-point periodicity, special frame is used instead of
are used only in first half-frame. For downlink transmission sub-frames 0, 5 and DwPTS are
always reserved. UpPTS and the sub-frame next to the special sub-frame are always
reserved for uplink communication (3GPP, 2009).
Mobility Support: One of the features of LTE is appropriate physical layer design to facilitate
users at high vehicular speeds to support delay sensitive applications (e.g., VOIP) with
appropriate QoS. The physical layer features such as power control, hybrid automatic repeat
request (HARQ), sub-channelization and pilot structure are used to mitigate the fluctuations
in the received signal caused by channel fast fading. In addition, link adaptation technique is
used to adjust system parameters according to channel dynamics, i.e, to select appropriate
parameters under available propagation conditions. This permits to optimize the spectral and
power sources of the system under poor propagation conditions.
Advanced Antenna Techniques: Multiple antenna systems based on space-time processing
algorithms have brought great benefits to wireless communications by exploiting the spatial
domain to use the resources in efficient way. Advanced antenna techniques such as
diversity techniques, spatial multiplexing and beamforming are employed to create
independent multiple parallel channels which result in overall system improvement in
terms of link reliability, high capacity, extended coverage and reduced transmitted power.
LTE uses advanced antennas techniques in both single-user and multi-user MIMO cases.
Link Adaptation and Channel Coding: Link adaptation is used to adjust the system
parameters in time varying propagation conditions to facilitate users at different data rates.
Thus link adaptation scheme is very closely related to channel coding schemes used for
Advances in Vehicular Networking Technologies
326
forward error correction (Sesia, et al. 2009). LTE schedules down link data transmission and
selects modulation and coding schemes based on the feedback information in terms of
signal-to-interference plus noise ratio (SINR) provided by channel quality indicator (CQI) in
uplink direction. The LTE specifications define the signalling between user terminal and
eNodeB for link adaptation and switching between different modulation schemes and
coding rates that depend on several factors including cell throughput and required QoS.
Scheduling and Quality-of-Service: The purpose of scheduling is to manage the resources
in uplink and downlink channels while maintaining the desired QoS according to user
expectations. In LTE eNodeB performs this operation. The principle of scheduling algorithm
is to allocate the resources and transmission powers in order to optimize certain set of
parameters such as throughput, user spectral efficiency, average delay and outage
probability. The LTE MAC layer can support large number of users with desired QoS.
3. Radio propagation models
From the beginning of wireless communications there is a high demand for realistic mobile
fading channels. The reason for this importance is that efficient channel models are essential
for the analysis, design, and deployment of communication systems for reliable transfer of
information between two parties. Realistic channel models are also significant for testing,
parameter optimization and performance evolution of communication systems. The
performance and complexity of signal processing algorithms, transceiver designs and smart
antennas etc., employed in future mobile communication systems, are highly dependent on
design methods used to model mobile fading channels. Therefore, correct knowledge of
mobile fading channels is a central prerequisite for the design of wireless communication
systems (Rappaport, 1996; Ibnkahla, 2005; Ojanpera, et al., 2001).
The difficulties in modeling the wireless channel are due to complex propagation processes.
A transmitted signal arrives at the receiver through different propagation mechanisms as
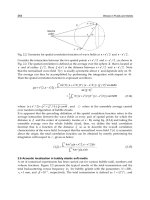
shown in Figure 1. The propagation mechanisms involve the following basic mechanisms: i)
free space or line of sight (LOS) propagation ii) specular reflection due to interaction of
electromagnetic waves with plane and smooth surfaces which have large dimensions as
compared to the wavelength of interacting electromagnetic waves iii) Diffraction caused by
bending of electromagnetic waves around corners of buildings iv) Diffusion or scattering
due to contacts with objects having irregular surfaces or shapes with sizes of the order of
wavelength v) Transmission through objects which cause partial absorption of energy
(Oestges, et al., 2007; Rappaport, 1996). It is significant here to note that the level of
information about the environment a channel model must provide is highly dependent on
the category of communication system under assessment. To predict the performance of
narrowband receivers, classical channel models which provide information about signal
power level distributions and Doppler shifts of the received signals, may be sufficient. The
advanced technologies (e.g., UMTS and LTE) build on the typical understanding of Doppler
spread and fading also incorporate new concepts such as time delay spread, direction of
departures (DOD), direction of arrivals (DOA) and adaptive antenna geometry (Ibnkahla,
2005). The presence of multipaths (multiple scattered paths) with different delays,
attenuations, DOD and DOA gives rise to highly complex multipath propagation channel.
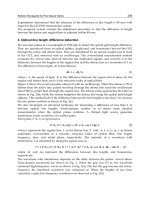
Figure 2 illustrates power delay profile (PDP) of a multipath channel with three distinct
paths.
Mobility Aspects of Physical Layer in Future Generation Wireless Networks
327
Fig. 1. Signal propagation through different paths showing multipath propagation
phenomena
Power
1
τ
2
τ
3
τ
Delay
Fig. 2. Power delay profile of a multipath channel
3.1 Propagation aspects and parameters
The behaviour of a multipath channel needs to be characterized in order to model the
channel. The concepts of Doppler spread, coherence time, delay spread and coherence
bandwidth are used to describe various aspects of the multipath channel.
3.1.1 Delay spread
To measure the performance capabilities of a wireless channel, the time dispersion or
multipath delay spread related to small scale fading of the channel needs to be calculated
in a convenient way. One simple measure of delay spread is the overall extent of path
delays called the excess delay spread. This is an appropriate way because different
channels with the same excess delay can exhibit different power profiles which have more
or less impact on the performance of the system under consideration. A more efficient
method to determine channel delay spread is the root mean square (rms) delay spread
(
rms
τ
) which is a statistical measure and gives the spread of delayed components about the
mean value of the channel power delay profile. Mathematically, rms delay spread can be
described as second central moment of the channel power delay profile (Rappaport, 1996)
which is written as:
Advances in Vehicular Networking Technologies
328
N1
2
nn m
n0
rms
N1
n
n0
P( )
P
−
=
−
=
τ−τ
τ=
∑
∑
(1)
where,
1
0
1
0
N
nn
n
m
N
n
n
P
P
−
=
−
=
τ
τ=
∑
∑
is the mean excess delay.
3.1.2 Coherence bandwidth
When the channel behaviour is studied in frequency domain then coherence bandwidth
c
fΔ
is of concern. The frequency band, in which the amplitudes of all frequency components of
the transmitted signal are correlated, i.e., with equal gains and linear phases, is known as
coherence bandwidth of that channel (Ibnkahla, 2005). The channel behaviour remains
invariant over this bandwidth. The coherence bandwidth varies in inverse proportion to the
delay spread. A multipath channel can be categorized as frequency flat fading or frequency
selective fading in the following way.
Frequency flat fading: A channel is referred to as frequency flat if the coherence
bandwidth
c
fΔ >>B, where B is the signal bandwidth. In this case frequency components of
the signal will experience the same amount of fading.
Frequency selective fading: A channel is referred to as frequency selective if the coherence
bandwidth
c
fBΔ≤ . In this case different frequency components will undergo different
amount of fading. The channel acts as a filter since the channel coherence bandwidth is less
than the signal bandwidth; hence frequency selective fading takes place (Fleury, 1996).
3.1.3 Doppler spread
The Doppler spread arises due to the motion of mobile terminal. Due to the motion of
mobile terminal through standing wave the amplitude, phase and filtering applied to the
transmitted signal vary with time according to the mobile speed (Cavers, 2002). For an
unmodulated carrier, the output is time varying and has non-zero spectral width which is
Doppler spread. For a single path between the mobile terminal and the base station, there
will be zero Doppler spread with a simple shift of the carrier frequency (i.e., Doppler
frequency shift) at the base station. The Doppler frequency depends on the angle of
movement of the mobile terminal relative to the base station.
3.1.4 Coherence time
The time over which the characteristics of a channel do not change significantly is termed as
coherence time. The reciprocal of the Doppler shift is described as the coherence time of the
channel. Mathematically we can describe coherence time as:
c
rms
1
T
2
=
πν
(2)
where
rms
ν
is root mean square vale of Doppler spread.
Mobility Aspects of Physical Layer in Future Generation Wireless Networks
329
The coherence time is related to the power control schemes, error correction and
interleaving schemes and to the design of channel estimation techniques at the receiver.
4. Standard channel models
Standard channel models can be developed by setting up frame work for generic channel
models and finding set of parameters that need to be determined for the description of the
channel. Another method is to set up measurement campaigns and extracting numerical
values of parameters and their statistical distributions (Meinilä, et al., 2004).
When designing LTE, different requirements are considered: user equipment (UE) and base
station (BS) performance requirements which are crucial part of LTE standards, Radio
Resource Management (RRM) requirements to ensure that the available resources are used
in an efficient way to provide end users the desired quality of service, the RF performance
requirements to facilitate the existence of LTE with other systems (e.g., 2G/3G) systems
(Holma, et al., 2009). The standard channel models play a vital role in the assessment of
these requirements. In the following section, some standard channel models are discussed
which are used in the design and evaluation of the UMTS-LTE system.
4.1 SISO, SIMO and MISO channel models
COST projects, Advanced TDMA (ATDMA) Mobile Access, UMTS Code Division Testbed
(CODIT) conducted extensive measurement campaigns to create datasets for SISO, SIMO
and MISO channel modeling and these efforts form the basis for ITU channel models which
are used in the development and implementation of the third generation mobile
communication systems (Sesia, et al., 2009). COST stands for the “European Co-operation in
the Field of Scientific and Technical Research”. Several Cost efforts were dedicated to the
field of wireless communications, especially radio propagation modeling, COST 207 for the
development of Second Generation of Mobile Communications (GSM), COST 231 for GSM
extension and Third Generation systems, COST 259 “Flexible personalized wireless
communications (1996-2000)” and COST 273 “Towards mobile broadband multimedia
networks (2001-2005)”. These projects developed channel models based on extensive
measurement campaigns including directional characteristics of radio propagation (Cost 259
and Cost 273) in macro, micro and picocells and are appropriate for simulations with smart
antennas and MIMO systems. These channel models form the basis of ITU standards for
channel models of Beyond 3G systems. Detailed study of COST projects can be found in
(Molisch, et al., 2006; Corria, 2001).
The research projects ATDMA and CODIT were dedicated to wideband channel modelling
specifically channel modelling for 3
rd
generation systems and the corresponding radio
environments. The wideband channel models have been developed within CODIT using
physical-statistical channel modelling approach while stored channel measurements are
used in ATDMA which are complex impulse responses for different radio environments.
The details of these projects can be found in (Ojanpera, et al., 2001).
4.2 ITU multipath channel models
The ITU standard multipath channel models proposed by ITU (ITU-R, 1997) used for the
development of 3G 'IMT-2000' group of radio access systems are basically similar in
structure to the 3GPP multipath channel models. The aim of these channel models is to
Advances in Vehicular Networking Technologies
330
develop standards that help system designers and network planners for system designs and
performance verification. Instead of defining propagation models for all possible
environments, ITU proposed a set of test environments in (ITU-R, 1997) that adequately
span the all possible operating environments and user mobility. In this chapter we use ITU
standard channel models for pedestrian and vehicular environments.
4.2.1 ITU Pedestrian-A, B
In both Pedestrian-A and Pedestrian-B channel models the mobile speed is considered to be
3 km/h. For Pedestrian models the base stations with low antennas height are situated
outdoors while the pedestrian users are located inside buildings or in open areas. Fading
can follow Rayleigh or Rician distribution depending upon the location of the user. The
number of taps in case of Pedestrian-A model is 3 while Pedestrian-B has 6 taps. The
average powers and relative delays for the taps of multipath channels based on ITU
recommendations are given in Table 1 (ITU-R, 1997).
4.2.2 ITU Vehicular-A (V-30, V-120 and V-350)
The vehicular environment is categorized by large macro cells with higher capacity, limited
spectrum and large transmit power. The received signal is composed of multipath
reflections without LOS component. The received signal power level decreases with
distance for which path loss exponent varies between 3 and 5 in the case of urban and
suburban areas. In rural areas path loss may be lower than previous while in mountainous
areas, neglecting the path blockage, a path loss attenuation exponent closer to 2 may be
appropriate.
For vehicular environments, the ITU vehicular-A channel models consider the mobile
speeds of 30 km/h, 120 km/h and 350 km/h. The propagation scenarios for LTE with
speeds from 120 km/h to 350 km/h are also defined in (Ericsson, et al., 2007) to model high
speed scenarios (e.g., high speed train scenario at speed 350km/h). The maximum carrier
frequency over all frequency bands is f=2690 MHz and the Doppler shift at speed v=350
km/h is 900 Hz. The average powers and relative delays for the taps of multipath channels
based on ITU recommendations are given in Table 2 (ITU-R, 1997).
Tap
No
Pedestrian-A Pedestrian-B Doppler
Spectrum
Relative Delay
(ns)
Average
Power(dB)
Relative Delay
(ns)
Average
Power(dB)
1 0 0 0 0 Classical
2 110 -9.7 200 -0.9 Classical
3 190 -19.2 800 -4.9 Classical
4 410 -22.8 1200 -8 Classical
5 NA NA 2300 -7.8 Classical
6 NA NA 3700 -23.9 Classical
Table 1. Average Powers and Relative Delays of ITU multipath Pedestrian-A and
Pedestrian-B cases
Mobility Aspects of Physical Layer in Future Generation Wireless Networks
331
Tap No
Average Power(dB) 0 -1.0 -9.0 -10.0 -15.0 -20.0
Relative Delay(ns) 0 310 710 1090 1730 2510
Table 2. Average Powers and Relative Delays for ITU Vehicular-A Test Environment.
5. Multiple antenna techniques
Broadly, multiple antenna techniques utilize multiple antennas at the transmitter or/and
receiver in combination with adaptive signal processing to provide smart antenna array
processing, diversity combining or spatial multiplexing in a wireless system (Dahlman, et
al., 2007; Salwa, et al., 2007). Previously, in conventional single antenna systems the
exploited dimensions are only time and frequency whereas multiple antenna systems
exploit an additional spatial dimension. The utilization of spatial dimension with multiple
antenna techniques fulfils the requirements of LTE; improved coverage (possibility for
larger cells), improved system capacity (more user/cell), QoS and targeted date rates are
attained by using multiple antenna techniques as described in (3 GPP, 2008). Multiple
antenna techniques are an integrated part of LTE specifications because some requirements
such as user peak data rates cannot be achieved without the utilization of multiple antenna
techniques.
The radio link is influenced by the multipath fading phenomena due to constructive and
destructive interferences at the receiver. By applying multiple antennas at the transmitter or
at the receiver, multiple radio paths are established between each transmitting and receiving
antenna. In this way dissimilar paths will experience uncorrelated fading. To have
uncorrelated fading paths, the relative location of antennas in the multiple antenna
configurations should be distant from each other. Alternatively, for correlated fading
(instantaneous fading) antenna arrays should be closely separated. Whether uncorrelated
fading or correlated fading is required depends on what is to be attained with the multiple
antenna configurations (diversity, beamforming, or spatial multiplexing) (Dahlman, et al.,
2007). Generally, multiple antenna techniques can be divided into three categories (schemes)
depending on their benefits: spatial diversity, beamforming and spatial multiplexing which
will be discussed further in the following sections.
5.1 Spatial diversity
Conventionally, multiple antennas are exercised to achieve increased diversity to encounter
the effects of instantaneous fading on the signal propagating through the multipath channel.
The basic principle behind spatial diversity is that each transmitter and receiver antenna
pair establishes a single path from the transmitter to the receiver to provide multiple copies
of the transmitted signal to obtain an improved BER performance (Zheng, et al., 2003). In
order to achieve large gains with multiple antennas there should be low fading correlation
between the transmitting and the receiving antennas. Low value of correlation can be
achieved when inter-antenna spacing is kept large. Hence it is difficult to place multiple
antennas on a mobile device due size restrictions depending upon the operating carrier
frequency. An alternative solution is to use antenna arrays with cross polarizations, i.e.,
antenna arrays with orthogonal polarizations. The number of uncorrelated branches (paths)
available at the transmitter or at the receiver refers to the diversity order and the increase in
Advances in Vehicular Networking Technologies
332
diversity order exponentially decreases with the probability of losing the signal. To achieve
spatial diversity for the enhancement of converge or link robustness multiple antennas can
be used either at the transmitter side or at the receiver side. We will discuss both transmit
diversity where multiple antennas are used at the transmitter (MISO-multiple-input signal-
output), and receive diversity using multiple receive antenna (SIMO signal-input multiple-
output). On the other hand, MIMO channel provides diversity as well as additional degree
of freedom for communication.
5.2 Transmit diversity
The transmit diversity scheme relies on the use of
t
N ≥ 2 antennas at the transmitter side in
combination with pre-coding in order to achieve spatial diversity when transmitting a single
data stream (Furht, et al., 2009; Jankiraman, 2004). Usually transmit diversity necessitates
the absolute channel information at the transmitter but it becomes feasible to implement
transmit diversity without the knowledge of the channel with space-time block coding
(Jankiraman, 2004). The simplest transmit diversity technique is Alamouti space-time coding
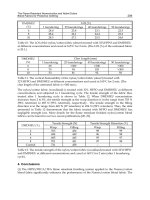
(STC) scheme (Alamouti, 1998). Transmit diversity configuration is illustrated in Figure 3.
The use of transmit diversity is common in the downlink of cellular systems because it is
easier and cheaper to install multiple antennas at base station than to put multiple antennas
on every handheld device. In transmit diversity to combat instantaneous fading and to
achieve considerable gain in instantaneous SNR, the receiver is being provided with
multiple copies of the transmitted signal. Hence transmit diversity is applied to achieve
extended converge and better link quality when the users experience hostile channel
conditions.
In LTE, transmit diversity is defined only for 2 and 4 transmit antennas and these antennas
usually need to be uncorrelated to take full advantage of the diversity gain.
LTE physical layer supports both open loop and closed loop diversity schemes. In open loop
scheme channel state information (CSI) is not required at the transmitter, consequently
multiple antennas cannot provide beamforming and only diversity gain can be achieved. On
the other hand, closed loop scheme does not entail channel state information (CSI) at the
transmitter and it provides both spatial diversity and beamforming as well.
By employing cyclic delay diversity and space frequency block coding, open loop transmit
diversity can be accomplished in LTE. In addition, LTE also implements close loop transmit
diversity schemes such as beamforming.
R
x
T
X
Fig. 3. Transmit diversity configuration
Mobility Aspects of Physical Layer in Future Generation Wireless Networks
333
5.3 Space-Frequency Block Coding (SFBC)
In LTE, transmit diversity is implemented by using Space-Frequency Block Coding (SFBC).
SFBC is a frequency domain adaptation of the renowned Space-Time Block Coding (STBC)
where encoding is done in antenna/frequency domains rather than in antenna/time
domains. STBC is also recognized as Alamouti coding (Rahman, et al.). Thus, SFBC is
merely appropriate to OFDM and other frequency domain based transmission schemes.
The advantage of SFBC over STBC is that in SFBC coding is done across the subcarriers
within the interval of OFDM symbol while STBC applies coding across the number of
OFDM symbols equivalent to number of transmit antennas (Rahman, et al.). The
implementation of STBC is not clear-cut in LTE as it operates on the pairs of adjacent
symbols in time domain while in LTE the number of available OFDM symbols in a sub-
frame is often odd. The operation of SFBC is carried out on pair of complex valued
modulation symbols. Hence, each pair of modulation symbols are mapped directly to
OFDM subcarriers of first antenna while mapping of each pair of symbols to corresponding
subcarriers of second antenna are reversely ordered, complex conjugated and signed
reversed as shown in Figure 4.
For appropriate reception, mobile unit should be notified about SFBC transmission and
linear operation has to be applied to the received signal. The dissimilarity between CDD and
SFBC lies in how pairs of symbols are mapped to the second antenna. Contrarily to CDD,
SFBC grants diversity on modulation symbol level while CDD must rely on channel coding
in combination with frequency domain interleaving to provide diversity in the case of
OFDM.
S
0
S
p
ace
Fr
eque
n
cy
(O
FD
M
subca
rri
e
r
s
)
- S
1
*
S
0
*
-S
n+1
*
S
n
*
S
1
S
n
*
S
n+1
Fre
q
uenc
y
domain OFDM s
y
mbol
OFDM
modulation
OFDM
modulation
R
X
Fig. 4. Space-Frequency Block Coding SFBC assuming two antennas
The symbols transmitted from two transmitted antennas on every pair of neighboring
subcarriers are characterized in (Sesia, et al., 2009) as:
(0) 1
(0) 1
x (1) x (1)
X
x(2) x(2)
⎡
⎤
=
⎢
⎥
⎣
⎦
(3)
where
(P)
X(K) denotes the symbols transmitted from antenna port ‘p’ on the k
th
subcarrier.
The received symbol can be expressed as:
y
Hs n
=
+
(4)
0000100
1111011
y
hhSn
y
hhS n
∗
∗∗ ∗ ∗
−
⎡
⎤⎡ ⎤⎡⎤⎡⎤
=+
⎢
⎥⎢ ⎥⎢⎥⎢⎥
⎣
⎦⎣ ⎦⎣⎦⎣⎦
(5)
Advances in Vehicular Networking Technologies
334
where
ij
h is the channel response for symbol i transmitted from antenna j, and n is the
additive white Gaussian noise.
6. Performance comparison of channel estimation schemes
We simulate LTE down link using the SISO system with the parameters given in the
specifications (3GPP, 2009). The system bandwidth selected is 15 MHz with the numbers
of subcarriers 1536 out of which 900 subcarriers are used and the remaining are zero
padded. The sub frame duration is 0.5 ms which leads to a frame length of 1 sec. This
corresponds to a sampling frequency of 23.04 MHz or sampling interval of 43.4 ns. A
cyclic prefix of length 127 (selected from specification which is extended CP) is inserted
among data subcarriers to render the effects of multipath channel which completely
removes inter-symbol-interference (ISI) and inter-carrier-interference (ICI). In simulating
the SISO system, only one port of an antenna is considered and this antenna port is
treated as a physical antenna. We consider one OFDM symbol of size 900 subcarriers and
the reference symbols which are (total numbers of reference symbols are 150) distributed
among data subcarriers according to specifications (3GPP, 2009) transmitted from the
antenna during one time slot. The constellation mappings employed in our work are
QPSK, 16 QAM and 64 QAM.
The channel models used in the simulation are ITU channel models (ITU-R, 1997). At the
receiver end we used regularized LS and LMMSE estimation methods for the channel
estimation. All channel taps are considered independent with equal energy distribution. In
addition, frequency domain linear equalization is carried out on the received data symbols.
The performance of the system is evaluated by calculating the bit error rates using ITU
channel models with different modulation schemes.
The designed simulator is flexible to use. A scalable bandwidth is used, i.e., there is option
for using bandwidths of 5 MHz, 10 MHz, 15 MHz and 20 MHz. In addition, cyclic prefixes
of different lengths specified in (3GPP, 2009) can be easily selected in the simulation of the
system. We used single port of antenna which is taken as physical antenna however changes
can be easily made to include two ports antenna.
The performance of LTE transceiver is shown in terms of curves representing BER against
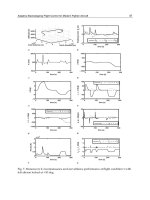
SNR values and is compared with AWGN for different channel models. Figures 5 and 6
show BER versus SNR for LMMSE and LS channel estimations, respectively, for different
ITU channel models using QPSK modulation. From these figures, it can be seen that
LMMSE channel estimation gives better performance than LS channel estimation. Figures 7
and 8 show BER plots for ITU channel models using 16QAM modulation format. It is seen
that by increasing the modulation order, the system performance degrades as compared to
QPSK modulation. This is due to the fact that higher modulations schemes are more
sensitive to channel estimation errors and delay spreads. For 16QAM, LMMSE still have
superior performance as compared to LS estimation but its performance also diminishes in
environments with high mobile speeds (Doppler spread) and large delay spreads. The LS
estimation gives poor performance for higher modulation schemes. Some interpolation
techniques can be employed to mitigate ISI effects which can enhance system performance.
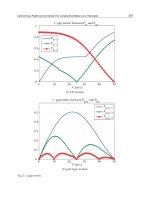
Figure 9 illustrates the performance of transceiver for ITU vehicular-A channel model using
multiple antennas. The SISO system is also shown for comparision purposes.
Mobility Aspects of Physical Layer in Future Generation Wireless Networks
335
0 2 4 6 8 10 12 14 16 18 20
10
-4
10
-3
10
-2
10
-1
10
0
SNR (dB)
BER
BER vs SNR for ITU channel models using 4-QAM modulation
pedA_Z MMSE estimates
vehA120_Z MMSE estimates
VA350_Z MMSE estimates
AWGN
Fig. 5. BER performance of LTE transceiver for different channels using QPSK modulation
and LMMSE channel estimation
0 2 4 6 8 10 12 14 16 18 20
10
-4
10
-3
10
-2
10
-1
10
0
SNR (dB)
BER
BER vs SNR for ITU channel models using 4-QAM modulation
pedA_Z LS estimates
vehA120_Z LS estimates
VA350_Z LS estimates
AWGN
Fig. 6. BER performance of LTE transceiver for different channel models using QPSK
modulation and LS channel estimation
Advances in Vehicular Networking Technologies
336
0 5 10 15 20 25 30
10
-4
10
-3
10
-2
10
-1
10
0
SNR (dB)
BER
BER vs SNR for ITU channel models using 16-QAM modulation
AWGN
pedA_Z LMMSE estimates
vehA_Z LMMSE estimates
VA350_Z LMMSE estimates
Fig. 7. BER performance of LTE transceiver for different channel models using 16 QAM
modulation and LMMSE channel estimation
0 5 10 15 20 25 30
10
-6
10
-5
10
-4
10
-3
10
-2
10
-1
10
0
SNR (dB)
BER
BER vs SNR for ITU channel models using 16-QAM modulation
AWGN
PedA_Z, LMMSE_estimates
VA120_Z, LMMSE_estimates
VA350_Z, LMMSE_estimates
Fig. 8. BER performance of LTE transceiver with multiple antennas for different ITU channel
models using 16 QAM modulation and LS channel estimation
Mobility Aspects of Physical Layer in Future Generation Wireless Networks
337
0 2 4 6 8 10 12 14 16 18 20
10
-4
10
-3
10
-2
10
-1
10
0
SNR (dB)
BER
BER vs SNR for ITU Vehicular-A channel using 4-QAM modulation
2x2_vehA_Z LMMSE estimates
2x1_vehA_Z LMMSE estimates
1x1_vehA_Z LMMSE estimates
Fig. 9. BER performance of LTE transceiver with multiple antennas for ITU Vehicular-A
channel model using 4-QAM modulation and LMMSE channel estimation
7. Conclusions
This chapter illustrates the physical layer aspects of future generation mobile
communication systems. Proper knowledge of propagation impairments and channel
models is necessary for the design and performance assessment of advanced transceiver
techniques employed to establish reliable communication links in future generation mobile
communication systems.
The results have been presented by means of simulations. The performance is evaluated in
terms of BER and SER and the obtained results are compared with theoretical values. The LS
estimator is simple and suitable for high SNR values; however its performance degrades
with higher constellation mappings for high mobile speeds. On the other hand, LMMSE
estimator is computationally complex and requires a priori knowledge of noise variance but
its performance is superior to LS estimates for higher modulation schemes and large delay
spreads. The performance of future generation mobile communication systems will be
highly dependent on different factors including operating frequency, elevation angles,
geographic location, climate etc.
8. References
3GPP (2008). TR 25.913:Requirements for Evolved UTRA (E-UTRA) and Evolved UTRAN
(E-UTRAN). Release 8, V 8.0.0.0.
3 GPP (2008). Overview of 3GPP Release 8: Summery of all Release 8 Features, V0.0.3.
3GPP (2009). Physical Channels and Modulation. TR 36.211 V8.7.0, Release 8.
Alamouti, S. M. (1998). A Simple Transmit Diversity Technique for Wireless
Communication. IEEE Journal Select. Areas Communications, pp. 1451-1458.
Advances in Vehicular Networking Technologies
338
Correia, L., M. (2001). Wireless Flexible Personalized Communications (COST 259 Report),
John Wiley & Sons, Chichester, UK.
Cavers, J. K. (2002). Mobile Channel Characteristics. Kluwer Academic Publishers, New
York, Boston, Dordrecht, London, Moscow.
Dahlman, E., Parkvall, S., Sköld, J., & Beming, P. (2007). 3G Evolution: HSPA and LTE for
Mobile Broadband, Elsevier Ltd.
Ericsson, Nokia, Motorola, and Rohde & Schwarz. (2007). R4-070572: Proposal for LTE
Channel Models. www. gpp.org, 3GPP TSG RAN WG4, meeting 43, Kobe, Japan.
Fleury, B. H. (1996). An Uncertainty Relation for WSS Processes and Its Application to
WSSUS Systems. IEEE Transactions on Communications, 44(12):1632–1634.
Furht, B., & Ahson, S. A. (2009). Long Term Evolution: 3GPP LTE radio and cellular
technology, published by Taylor & Francis Group, LLC.
Holma, H., & Toskala, A. (2009). LTE for UMTS: OFDMA and SC-FDMA Base Band Radio
Access. John Wiley & ISBN 9780470994016 (H/B) John Wiley & Sons Ltd.
Ibnkahla, M. (2005). Signal Processing for Mobile Communications. CRC Press, New York
Washington, D.C.
ITU-R (1997). M.1225. International Telecommunication Union: Guidelines for evaluation of
radio transmission technologies for IMT-2000.
Jankiraman, M. (2004). Space-Time Codes and MIMO Systems. Artech House Boston,
London.
Kliazovich1, D., Granelli, F., Redana, S., & Riato, N. (2007). Cross-Layer Error Control
Optimization in 3G LTE,”
IEEE Global Telecommunication Conference, Trento.
Meinilä, J., Jämsä, T., Kyösti, P., Laselva, D., El-Sallabi, H., Salo, J., Schneider, C., & Baum, D.
(2004). IST-2003- 507581 WINNER: Determination of Propagation, IST-2003- 507581
WINNER.
Molisch, A., F., Asplund, H., Heddergott, R., Steinbauer, M., & Zwick, T. (2006). The COST
259 vol.5, no. directional- channel model A-I: overview and methodology. IEEE
Transactions on Wireless Communications, 12, pp. 3421-3433.
Motrola. (2008). Inter-technology Mobility: Enabling Mobility between LTE and other
Access Technologies.
Oestges, C., & Clercks, B. (2008). MIMO Wireless Communications: From Real-World
Propagation to Space-Time Code Design, Elsevier Publishers.
Ojanpera, T., & Prasad, R. (2001). WCDMA: Towards IP Mobility and Mobile Internet.
Artech House Publishers, Boston, London.
Rahman, M. I., Marchetti, N., Das, S. S., Fitzek, F., & Prasad, R. Combining Orthogonal
Space-Frequency Block Coding and Spatial Multiplexing in MIMO-OFDM System.
for TeleInFrastruktur (CTiF), Aalborg University, Denmark.
Rappaport, T. (1996). Communications, Principles and Practice. Prentice-Hall, Englewood
Cliffs, NJ, USA.
Salwa, A. A., Thiagarajah, S. (2007). A Review on MIMO Antennas Employing Diversity
Techniques, Proceedings of the International Conference on Electrical Engineering
and Informatics Institute Technology Bandung, Indonesia.
Sesia, S., Toufik, I., & Bakkar, M. (2009). LTE- The UMTS Long Term Evolution, John Wiley
and Sons, Ltd, First Edition.
Zheng, L., & Tse, D. N. C. (2003). Diversity and Multiplexing: A Fundamental Tradeoff in
Multiple-Antenna Channels. IEEE Transactions on Information Theory.
19
Verifying 3G License Coverage Requirements
Claes Beckman
Center for RF-Measurement Technology, University of Gävle, and
Center for Wireless Systems, Wireless@KTH, Royal Institute of Technology,
Sweden
1. Introduction
In the beginning of the 21’st century, the 3
rd
generation mobile phone systems, 3G, were
introduced all around the world. In most countries, spectrum for this technology was allocated
through some kind of licensing procedure. In Europe, the prevailing approach was to allocate
spectrum through auctions, a process which led to a situation where the European operators
found themselves committed to pay a staggering 130Bilion Euros for their 3G licenses.
However, in most European countries, the fee was not the only obligation put on the
licensee: A coverage, “roll-out” requirement was in many cases also connected to the license
(Northstream, 2002). Typically, these coverage requirements required that the licensees
cover a certain area at a certain point in time after that the licenses had been awarded.
In order for the regulators to verify that the licensees had met the coverage requirement and,
hence, complied with the regulation, a method for coverage verification was needed. Such
methods have therefore since then been developed by several European regulators (e.g. PTS
2004; ECC 2007). In this book chapter we describe some general underlying consideration for
the verification of radio coverage in UMTS systems and in particular we describe the Swedish
methodology developed by the Swedish Telecom regulator Post & Telestyrelsen (PTS).
2. Licensing of 3G in Sweden
In 2001, the Swedish Telecom regulator Post & Telestyrelsen (PTS) granted four licenses for
the operation of third generation mobile phone systems (PTS 2001). In contrast to most other
European countries, the Swedish licenses were granted through a beauty contest. When
acquiring the licenses, the licensees committed themselves to build networks that covered a
population of 8.860.000 inhabitants. This requirement implied that each operator would
cover some 99.98% of the Swedish population (as counted for in 1996). However, in order to
support the roll out, the regulator allowed the operators to build their networks in a
combination of self owned sites in the major cities (30% of population) and shared sites in
the countryside (70%) (Beckman and Smith, 2005). The roll-out of these 3G networks was
delayed several times and the coverage requirements somewhat modified, but in 2007 all
Swedish operators reported that they complied with the license requirements. Today
Sweden is unique in that more than 98% of the population and 48% of the of the national
territory (170.000 km
2
) has 3G service coverage (PTS 2008).
In contrast to many other European countries, the original Swedish 3G license defined
coverage by specifying a field strength requirement to be measured outdoors on the primary
Advances in Vehicular Networking Technologies
340
common pilot channel, CPICH. The assumption was that depending on the environment
and the average building penetration pathloss, the pilot signal strength can be related to a
particular data service (rate) indoors.
In the original Swedish license requirement the operators where obliged to provide an out-
door signal strength that in the 3GPP release 99 standard of the UMTS system (3GPP 2000)
corresponded to an in-door packet switched data services, of 384 kbps in downlink and
144kbps in uplink. These requirements were then translated into a field strength for the
signal received from the base station. In the original license agreement coverage
requirement was that when measured outdoors at a height of 1.7m above ground over
5MHz, the field strength on the CPICH should be at least 58 dBμV/m with an area
probability of 95% (PTS 2001).
The design of the Swedish measurement method is previously described in a number of
papers, e.g. PTS 2004; PTS 2004 II; Beckman et al 2006; Beckman et al 2008.
3. General considerations
To verify coverage one needs to develop a practical test procedure for measuring field
strength. The verification can then easily be performed e.g. in a drive test (PTS 2004; ECC
2007). However, designing such test presents a number of challenges:
- A requirement can be given for a particular field strength measured on the common
pilot channel. However, in the UMTS systems the power to be allocated to the CPICH is
not given by the standard or by the regulator
- There is no given relation between pilot power and service. In the Swedish license
requirements it was assumed that an outdoor signal strength of 58dBμV/m on the
CPICH in practise relates to a downlink service indoors of 384 kbps and an uplink
service of 144kbps (PTS 2001). However, building penetration path loss varies in
different environment. Hence, field strength requirement must vary accordingly.
- A license is typically given for area and population coverage while a drive test only
measures along a linear route. In order to convert measurement data from drive testing
to a probability of coverage for a given area with a certain population, one needs a
statistical model based on population density and geography.
4. The primary Common Pilot Channel
The Universal Mobile Telephony System (UMTS) is a 3G systems specified by the Third
Generation Partnership Project organization (3GPP 2002). It has a radio interface based on a
code division multiple access scheme, cdma, and 5MHz wide radio channels. Since the radio
channel is somewhat wider than previous cdma systems it is referred to as: “wideband”
cdma or WCDMA.
The primary Common Pilot Channel, CPICH, is one of many codes in the WCDMA
common downlink pilot channel (Holma and Toskala 2002). It is a control channel mainly
used for handovers. It does not have a fixed power allocated to it so it is principle not
related to any service in either the up- or down-link.
4.1 Allocating power to the CPICH
In theory it is possible to allocate anything between 0% and 100% of the available power to
the CPICH. In practice the allocated power has a lower bound which can be derived as
follows (PTS 2004)
Verifying 3G License Coverage Requirements
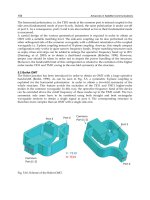
341
Fig. 1. Illustration of the downlink interference situation at the border between two cells
In order to initiate a soft handover at the border between two cells (Fig. 1.), a cell’s pilot
must be detected when an adjacent cell’s pilot is 5 dB stronger. The required E
b
/N
0
on the
primary CPICH on the downlink is approximately 10 dB (3GPP 2002). The processing gain
on the pilot is 10*log(3840/12.2) = 25 dB which means that the minimum output power for
the pilot is approximately: 5 + 10 – 25= -10dB (10%) compared to the total output power
from the base station. A worse case scenario is of course when the mobile is at the
intersection of 3 cells. The interference level would then of course be doubled. Allocating
between 10% and 20% of the available power in the radio channel is also often suggested in
industry literature (PTS 2004 II). However, it is in the interest of the operators not to increase
the pilot power unnecessarily since raising the pilot power will mean that less power is
available for services.
4.2 Relationship between pilot power and services
As described above, there is no given relation between pilot power and services. Still, the
regulator needs to have measurable criteria:
First of all one needs to consider what measure is most suitable. By tradition regulators uses
prefers to measure the signal strength in e.g. dBμV/m. The main reason for this is that this
parameter is easy to measure in a drive test and is independent on frequency and antenna
gain. The relationship between signal strength E (as measured in dBμV/m) and signal
power P (as measured in dBm) can we written as:
P = E - 20log10f - 77.219 + G, (1)
where f is the frequency given in MHz and G the antenna gain given in dBi.
Assuming that 10% of the available power is allocated to the primary CPICH and that the
building penetration path loss is known, it is now possible to estimate the pilot power
Advances in Vehicular Networking Technologies
342
needed to provide the required services for different environments by calculating the link
budgets (Holma and Toskala 2002).
The base station has typically 10-20 W (40-43 dBm) output power available, while the mobile
unit has 0.125 W (21 dBm). The Noise Factor of the base station is typically ~4 dB compared
to ~7 dB for the mobile receiver. Antenna diversity is implemented at the base station for the
uplink and therefore approximately 4-5 dB lower Eb/N
0
than required in the downlink.
Still the downlink has a 10-15 dB path loss advantage over the uplink in a symmetrical
service. In case of asymmetrical load (higher bitrates in the downlink than in the uplink), the
10-15 dB advantage reduces to around 5-10 dB (assuming 384 kbits/s downlink and 144
kbit/s uplink).
Uplink coverage can be improved by introducing Tower Mounted Low Noise Amplifiers,
i.e. an amplifier directly after the antenna. The gain of this is that the feeder losses in the
uplink can be ignored (expect for a short jumper cable between the antenna and the
amplifier), and that the TMA often has a better Noise Factor (NF) than the base station (1.5–2
dB compared to 4-5 dB). TMA is widely used by the operators to improve coverage in rural
areas.
Mobile a terminals are used in a variety of environments, but to a large extent they are used
indoors. The signal is thus being attenuated as it has to propagate through the walls or
windows of the building where the user is located. Therefore, the link budget needs to
include a margin for the penetration loss in case service is planned for indoor users.
It is evident that a single penetration loss value will not apply to all environments. In rural
areas, people often live in small houses that have thin walls and windows in different
directions, thus giving a lower penetration loss. In Sweden single family house are mainly
constructed out of wood, while multi family and multistory buildings are normally made of
concrete.
In the Swedish example, the following guidelines for building attenuation was suggested:
1. In rural areas, single family houses (11 dB attenuation)
2. In suburban areas, single family houses and semi detached homes (11dB)
3. In urban areas, concrete houses with large separation (16dB)
4. In dense urban areas, concrete houses with small separation (20dB)
The link budget calculations are summarized in Tables 1 and 2. Calculations are done for the
four different scenarios mentioned above, with and without tower mounted low noise
amplifiers, TMA, in rural, and for packet switched uplink and downlink data rates of
144kbps and 384kbps, respectively. The input data is in accordance with the 3GPP UMTS
release 99 standard (3GPP 2001) and Holma and Toskala (2002).
In literature link budgets normally includes a margin for the “log normal fading”, which can
be described statistically, to arrive at a maximum path loss that can be used for radio
planning purposes. When comparing the above link budget with the license requirements, it
is important to understand that the margin for the statistical variation of the measured
signal in the outdoor environment is already
4.3 Coverage criteria
In Table 3 the main results of the link budget calculations are presented. As can be seen, in
all cases it is the up-link that limits the service performance. However, the CPICH signal
strength required in order to be able to provide the respective services varies in different
environments. The pilot signal strength requirement of 58dBμV/m set out in the Swedish
license seems to be ~ 7dB too low in dense urban and ~8dB too strict in rural environments.
Verifying 3G License Coverage Requirements
343
Environment Dense Urban Suburban Rural
Rural
TMA
Rural
TMA
Service UL kbit/s 144 144 144 144 144 64
Max mobile transmit
power
dBm 21 21 21 21 21 21
Mobile Antenna Gain dBi 0 0 0 0 0 0
Body loss dB 0 0 0 0 0 0
EIRP dBm 21 21 21 21 21 21
Thermal Noise dBm/Hz -174 -174 -174 -174 -174 -174
Noise Figure dB 4 4 4 4 2 2
Noise Density dBm/Hz -170,0 -170,0 -170,0 -170,0 -172,0 -172,0
Noise Power dBm -104,2 -104,2 -104,2 -104,2 -106,2 -106,2
Interference Margin dB 3 3 3 1 1 1
Receiver interference
Power dBm -104,2 -104,2 -104,2 -110,0 -112,0 -112,0
noise + interference dBm -101,2 -101,2 -101,2 -103,2 -105,2 -105,2
Processing Gain dB 14,3 14,3 14,3 14,3 14,3 17,8
Required Eb/No dB 1,5 1,5 1,5 2 2 2
Receiver Sensitivity dBm -113,9 -113,9 -113,9 -115,4 -117,4 -120,9
Base station antenna gain dBi 18 18 18 18 18 18
Cable loss dB 4 4 4 4 1 1
Max Path Loss dB 148,9 148,9 148,9 150,4 155,4 158,9
Fast fading margin dB 4 4 4 4 4 4
Max Fading Path Loss dB 144,9 144,9 144,9 146,4 151,4 154,9
Average Penetration Loss dB 20 16 11 11 11 11
Max outdoor UL Path loss dB 124,9 128,9 133,9 135,4 140,4 143,9
Table 1. Uplink link budgets for different services and environment used for the calculation
of the Swedish license requieremnts
What is then a sufficient pilot strength criteria in order to determine whether an area is
covered or not with 3G? What is evident from the above link budget calculations is that the
signal strength requirements needs to be set differently for different environments. In Table
3, the modified Swedish CPICH requirements for different environments are summarized
(PTS 2004 II).
Advances in Vehicular Networking Technologies
344
Environment Dense Urban Suburban Rural
Rural
TMA
Service DL kbit/s 384 384 384 384 384
Total available
Power dBm 43 43 43 43 43
Cable Loss dB 4 4 4 4 4
Antenna Gain dBi 18 18 18 18 18
Transmitter total
ERP
dBm 57 57 57 57 57
Max Service Power
% 25% 25% 25% 50% 50%
Max Service ERP dBm 51,0 51,0 51,0 54,0 54,0
Thermal Noise dBm/Hz -174 -174 -174 -174 -174
NF dB 7 7 7 7 7
Noise Density dBm/Hz -167 -167 -167 -167 -167
Noise Power dBm -101,2 -101,2 -101,2 -101,2 -101,2
Processing Gain dB 10,0 10,0 10,0 10,0 10,0
Required Eb/No dB 6 6 6 6 6
Receiver
Sensitivity dBm -105,2 -105,2 -105,2 -105,2 -105,2
Base station
antenna gain
dBi 18 18 18 18 18
Cable loss dB 4 4 4 4 4
Max Path Loss dB 156,1 156,1 156,1 159,1 159,1
Fast fadin
g
mar
g
in dB 4 4 4 4 4
Max Fading Path
Loss
dB 152,1 152,1 152,1 155,1 155,1
Average
Penetration Loss
dB 20 16 11 11 11
Max outdoor DL
Path loss
dB 132,1 136,1 141,1 144,1 144,1
Table 2. Downlink link budgets for different services and environment used for the
calculation of the Swedish license requieremnts
Verifying 3G License Coverage Requirements
345
Environment
Limiting
Link
Required CPICH
[dBμV/m]
Modified Swedish
Requirements[dBμV/m]
Dense Urban UL 65.1 58
Urban UL 61.1 58
Suburban UL 56.1 52
Rural UL 54.6 52
Rural TMA withTMA UL 49.6 50
Table 3. Summary of the Swedish link budget calculations and modified CPICH
requirements
5. Measurement set-up
The method used to verify the operators networks needs for obvious reasons to be accurate
but also well accepted. The traditional way of performing radio coverage measurements is
by conducting drive tests with a vehicle upon the roof of which antennas are mounted. The
signal is then sampled, measured and stored on equipment carried inside.
Fig. 2. Photo of the measurement car including the antenna solution with an extra disc as
ground plane, used by the Swedish regulator, PTS
5.1 Instrumentation
The measurement system needs by necessity be able to simultaneously detect several control
channels from several base station. The reason for that is that when the measurement is
performed in urban environments the receiver will detect several base stations. In sub-urban
or rural areas, it is of importance to be able to carefully measure at least two base staion
control channels during (soft) handowver.
The standard way of doing this is to perform a so called Top N measurement. The
measurement instrument then measures the scrambling codes transmitted on each detected
CPICH. In a “Top N” measurement, the system scans for all 512 scrambling codes and
returns the “N” strongest. In the Swedish measurement the top 6 scrambling codes were
detected and measure but N can typically be any number between 1 and 32.