Advances in Vibration Analysis Research Part 16 doc
Bạn đang xem bản rút gọn của tài liệu. Xem và tải ngay bản đầy đủ của tài liệu tại đây (2.76 MB, 18 trang )
Support Vector Machine Classification of Vocal Fold Vibrations Based on Phonovibrogram Features
439
3 Intensity classes
CI1:={F1I1, F2I1, F3I1}; CI2:={F1I2, F2I2, F3I2}; CI3:={F1I3, F2I3, F3I3}.
(2)
9 Combined Frequency/Intensity classes
CS1 := {F1I1} ; CS2 := {F1I2} ; CS3 := {F1I3} ;
CS4 := {F2I1} ; CS5 := {F2I2} ; CS6 := {F2I3} ;
(3)
CS7 := {F3I1} ; CS8 := {F3I2} ; CS9 := {F3I3} .
2.3 Selection of sequences
Within the acoustic signals the intervals of sustained phonation were identified by visual
inspection. Within each interval a time section of 1 second was selected. The identical
section was analyzed in high speed video data. The sequence length of one second time (>
150 glottal cycles) was in accordance with previous studies who suggested approx. 130 - 190
cycles (Karnell, 1991). Thus, altogether 108 pairs of high-speed and acoustic data sets were
available (Tab. 1), reflecting isochronal information about vibratory characteristics of the
voice generator (high-speed data) and the acoustic outcome (voice signal). Only in four
cases the video data could not be further processed due to low image quality. To ensure,
that possible occurring differences between recordings were only induced by the different
phonation task, the recordings were performed within a day. As far as we know these data
represent the most exhaustive examination of a single subject’s vocal fold dynamics using
HSI.
Intensity/F0
Low(F1)
Normal(F2)
High(F3)
CI1-CI3
Soft(I1)
4(12)
4(12)
4(12)
12(36)
Normal(I2)
4(9)
4(11)
4(12)
12(32)
Loud(I3)
4(12)
4(12)
4(12)
12(36)
CF1-CF3
12(33)
12(35)
12(36)
36(104)
Table 1. Applied Data. Overview of the performed 36 recordings which equals 108
sequences. From these sequences 104 could be analysed for acoustic and dynamical data.
2.4 PVG parameters describing vocal fold dynamics
2.4.1 Image processing
The vibrating edges of both vocal folds were extracted alongside their entire glottal length to
analyze the laryngeal vibrations during phonation (Lohscheller et al., 2007). Information at
each specific position of vocal folds is required to obtain detailed information about the
vibration characteristics at dorsal, medial and ventral parts of vocal folds. For this purpose
an extensively evaluated image segmentation procedure was applied (Lohscheller et al.,
2007). The procedure delivers the left/right vocal fold edge contours cL/R(t), the glottal area
a(t), the location of anterior/posterior glottal ending A(t) and P(t) as well as the glottal main
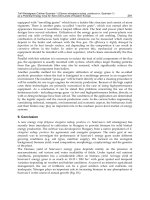
axis l(t). A typical result of a segmented high-speed image is shown in Fig. 2.
Since the segmentation accuracy highly affects the following analysis, the quality of the
results was visually monitored. For this purpose, within a movie viewer the segmented
vocal fold contours were displayed. Further, for identifying potential faulty segmented
440
Advances in Vibration Analysis Research
images (outliers) the glottal area a(t) was displayed within a diagram, see Fig. 2. Thus, in
case of imprecise results, a re-segmentation of the high speed videos could be performed.
Fig. 2. Glottal area function. Left: Segmented image of a high-speed video. The extracted
vocal fold edges are superimposed and are used to verify visually the accuracy of the
segmentation results. Right: The glottal area waveform a(t) is monitored to detect faulty
segmented images within a segmented video sequence.
In this study, the image processing procedure was applied only when the glottal length was
fully visible during one second. From all 108 data sets 104 sequences each containing 2,000
consecutive images were successfully processed resulting in 208,000 segmented images. In
all cases satisfactory segmentation accuracy were obtained, which are comparable to the
example shown in Fig. 3.
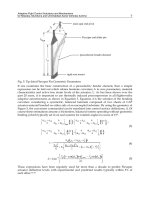
2.4.2 Generation of phonovibrograms
For visualizing the entire vibration characteristics of both vocal folds the Phonovibrogram
(PVG) was applied which was described in detail before (Lohscheller et al., 2008a). The
principles of PVG computation are shortly summarized in Fig. 3. For each image of a highspeed video, the segmented glottal axis is longitudinally split and the left vocal fold contour
is turned 180° around the posterior end. Following, the distances dL,R(y,t) between the glottal
axis and the vocal fold contours are computed; y ∈ [1,…,Y] with Y=256 denotes the spatial
sampling of glottal axis. The distance values are stored as column entries of a vector and
become color coded. The distance magnitudes are represented by the pixel intensities and
two different colors. If vocal fold edges cross the glottal axis during an oscillation cycle the
pixel is encoded by the color blue, otherwise the color red was used to indicate the distance
from the glottal axis. A grayscale representation (black: vocal fold edges are at the glottal
midline, white vocal fold edges have a distance to the glottal midline) of the originally
colored PVG is given in Fig. 3. The entire vibration characteristics of both vocal folds are
captured within one single PVG image by iterating the described procedure for an entire
sequence and consecutively arranging the obtained vectors to a two-dimensional matrix.
The left vocal fold is represented in the upper and the right vocal fold in the lower
horizontal plane of the PVG, respectively. The PVG enables at the same time an assessment
Support Vector Machine Classification of Vocal Fold Vibrations Based on Phonovibrogram Features
441
of the individual vibration characteristics for each vocal fold and gives evidence about
left/right and posterior/anterior vibration asymmetries as well as predications about the
temporal stability of the vibration pattern.
Fig. 3. PVG generation. 1) Segmentation of HS video. 2) Transformation of extracted vocal
fold contours and computation of the distance values dL,R(y,t) which represent the distances
from the vocal fold edges to the glottal midline. 3) Color coding of distance values for an
entire high-speed video result into a PVG image comprising the entire vibration dynamics
of both vocal folds in a single image (PVG is shown as grayscale image).
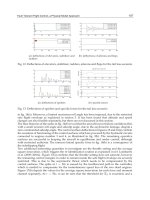
2.4.3 Analysis of vocal fold vibrations
PVG pre-processing: Phonovibrograms obtained from high speed sequences contain
multiple reoccurring geometric patterns representing consecutive oscillation cycles of vocal
folds. In order to describe the vibratory characteristics of vocal folds objectively, the 104
PVGs were pre-processed as follows: Firstly, for the left and right vocal fold unilateral PVGs
are computed, denoted as uPVGL/R which are in the following regarded as two-dimensional
functions vL(k,y) and vR(k,y) with k∈ {1,…,K} and K=2,000 representing the number of frames
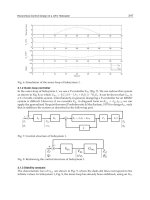
within a sequence. From the unilateral PVGs the Glottovibrogram (GVG) is derived vG(k,y)=
vL(k,y) + vR(k,y) which represents the glottal width (distances between the vocal folds) at
each vocal fold position y over time, Fig. 4. In a subsequent step, the uPVGs and the GVG are
automatically subdivided into a set of single PVG/GVG cycles, Fig. 4 right. A frequency
analysis and peak picking strategy in the image domain is performed for the cycle
identification (Lohscheller et al., 2008a).
Finally, the obtained single cycle PVGs are normalized to a constant width and height which
are denoted sPVGLi, sPVGRi, sGVGi, with i∈ {1,…,IL,R,G} and IL,R,G representing the number of
cycles within the corresponding Phonovibrogram. Hence, vocal fold vibrations can be
described by a set of the three functions
diL (t , y ) := sPVGiL , diR (t , y ) := sPVGiR , gi (t , y ) := sGVGi
(4)
with t∈ {1,…,T} where T=256 represents the normalized cycle length. In the following, the
index α:={L,R} is introduced to distinguish the functions dαi(t,y) representing the left and
442
Advances in Vibration Analysis Research
right vocal fold. Both, the unilateral as well as the normalized PVGs form the basis for the
following analysis to obtain detailed information about vocal fold dynamics.
Fig. 4. Pre-Processing. From a raw PVG (left) so-called unilateral PVGs are computed
(middle) which are further subdivided into a set of normalized single cycle PVGs (right).
Extraction of symmetry features: In order to describe the overall behavior of vocal fold
dynamics the PVGs are analyzed as follows. At each glottal position y the 1D-power
spectrum
Pα ( f , y ) :=|FFT { vα ( k , y )}| ∀y
(5)
is calculated by Fast Fourier Transform algorithm (FFT). Due to settings, corresponding
α
frequency resolution of the spectral components were 1 Hz. Fundamental frequencies f0 are
estimated by identifying the maxima within the discrete power spectra
α
f0 := arg max Pα ( f , y )
∀y.
(6)
f
By defining the feature vector
θ := θ ( y ) :=
L
f0
R
f0
∀y
(7)
frequency differences between the left and right vocal fold as well as differences alongside
the glottal axis are captured. If lateral (i.e. left/right) fundamental frequencies are identical
the feature vector
L
R
υ := υ ( y ) := ϕ {P L ( f0 , y )} − ϕ { P R ( f0 , y )}
∀y
(8)
describes the phase delays between the left and right vocal fold.
The left/right vibration asymmetry is further described by introducing the mean relative
amplitude ratios a( y ) which are computed as follows. Within the sPVGL,R the points in time
α
Ty ,imax := arg max diα (t , y )
t
∀α , y , i
(9)
Support Vector Machine Classification of Vocal Fold Vibrations Based on Phonovibrogram Features
443
along the vocal fold length are identified when the maximum vocal fold deflections occur.
By identifying the time points of minimal vocal fold deflection
α
Ty ,imin := arg min diα (t , y )
∀α , y , i
(10)
t
the relative peak-to-peak amplitudes
α
α
Αα ,i := diα ( Ty ,imax , y ) − diα ( Ty ,imin , y )
y
∀α , y , i
(11)
can be defined which are independent from the absolute position of the glottal axis. The
mean relative amplitude ratios
⎛ AL ,i ⎞
y
a := a( y ) = ⎜ R ⎟ ∀y
⎜ A y ,i ⎟
⎝
⎠
(12)
and corresponding standard deviations a:=a(y) serve as features to describe left/right
asymmetries as well as the stability of vibrations at each position of the vocal folds. The
obtained parameters are merged to the symmetry feature vector s (Eqs. (7),(8),(12)):
s := [θ , υ , a , σ a ].
(13)
Extraction of glottal features g: In order to capture characteristics of the glottal dynamics
within the oscillation cycles, the following parameters are extracted from the normalized
GVG matrices gi(t,y). Firstly, the maximum glottal area of each oscillation cycle i is
determined as
Y
ρi = max ∑ gi (t , y ) ∀t , i.
(14)
σ ρ = Var( ρi )
(15)
t
y =1
The feature
describes the stability of the glottal vibratory cycles over time. Subsequently, the open
quotients OQy,i are defined for each glottal position i as duration of open phase divided by
duration of complete glottal cycle and are computed as
⎛
⎞
ˆ
OQ y , i = ⎜ ∑ gi (t , y ) ⎟ / T ∀y , i ;
⎝ t
⎠
(16)
⎧1 gi (t , y ) > 0 ∀t.
ˆ
gi = ⎨
⎩ 0 otherwise.
(17)
with
The mean values
444
Advances in Vibration Analysis Research
oq =
1 I
∑ OQ y ,i
I i
∀y
(18)
and standard deviations
σ oq = Var (OQ y , i ) ∀y
(19)
are used as features describing the stability of the glottal opening behavior at each position
alongside the glottal axis (Var symbolizes the variance). Analogously, the mean speed
quotients sq and the corresponding standard deviations sq are computed describing the
mean glottal vibratory shape and its stability over time (Jiang et al., 1998).
Finally, the glottal closure insufficiencies
Y
ˆ
min ∑ hi (t , y )
gci i =
t
y
Y
∀t , i.
(20)
are derived using
ˆ ⎧1 gi (t , y ) > 0 ∀y.
hi = ⎨
⎩ 0 otherwise.
(21)
which are identifiable for each oscillation cycle i. The supplemental features gci and
σ gci describe the mean glottal closure insufficiency and its stability for the entire high-speed
sequence. The glottal parameters are merged to the glottal feature vector (Eqs. (15),(18),(19)):
g := [σ ρ , oq , σ oq , sq , σ sq , gci , σ gci ].
(22)
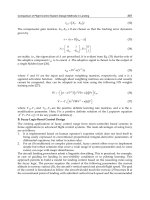
Extraction of geometric PVG feature ω: Besides the conventional symmetry and glottal
parameters we propose a novel way for describing vocal fold vibrations by quantifying the
geometric structure within sPVGα images. The main vibration characteristics of a vocal fold
can be described by extracting representative contour lines from the sPVGα images. This is
α
done by determining the oscillatory states n during the opening ( t < Ty , imax ) and closing
α max
( t > Ty ,i
) phases where vocal folds reach a certain percentage of relative deflection
Αα ,n :=
yi
n α
Α y ,i , n ∈ [0,100].
100
(23)
Hence, the set of vectors
Oα ,n := arg ( diα ( x , y ) = Αα ,n ), with t < tα max
yi
yi
i
∀α , y , i.
(24)
Cα ,n := arg ( diα ( x , y ) = Αα ,n ), with t > tα max
y i
y i
i
∀α , y , i.
(25)
x
x
describe temporal and spatial propagation of each vocal fold at different oscillation states
during glottal opening Oα ,n and closing Cα ,n . In order to get a comprehensive
y i
y i
Support Vector Machine Classification of Vocal Fold Vibrations Based on Phonovibrogram Features
445
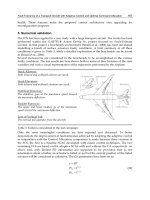
understanding of the entire vibration cycle, multiple contour lines are extracted at different
oscillation states. Fig. 5 shows exemplarily extracted contour lines at n=(30,60,90) for the left
and right vocal fold during a single oscillation cycle.
The functional characteristics
ΡOα ,n := diα (t , y )
y i
αn
oi
ΡCα ,n := diα (t , y )
y i
αn
ci
∀α , y , i
(26)
of sPVGα at positions Oα ,n and Cα ,n of the contour lines give precise information on actual
y i
y i
deflection of the vocal folds. As features which describe the average vibratory pattern of
vocal folds, the means for the contour lines n=(30,60,90), the deflection characteristics and
their time indices
Oα ,n
yi
, POα ,n ,
y i
Cα ,n ,
yi
PCα ,n ,
y i
(27)
are computed for all cycles i. The vibration stability is captured by the corresponding
standard deviations
σ(Oα ,n ) , σ(ΡOα ,n ) , σ(Cα ,n ) , σ(ΡCα ,n ) .
y i
y i
y i
y i
The Euclidian-Norm
2
(28)
between the mean positions of the contour lines
n
N O ,C = O L ,ni − O R,n
y
yi
2
∀n
(29)
describes deviations between the mean left and right vocal fold vibration patterns. Finally,
all parameters (Eqs. (27),(28),(29)) are merged to the PVG feature vector
n
ω := [Oα ,n , POα ,n , Cα ,n , PCα ,n , σ(Oα ,n ), σ(POα ,n ), σ(Cα ,n ), σ(PCα ,n ), NO ,C ].
y i
y i
y i
y i
y i
y i
y i
y i
(30)
The entire vocal fold dynamics extracted from one high speed sequence can be described by
merging the introduced features for left-right symmetry, glottal and PVG characteristics
(Eqs. (13),(22),(30)) to the feature vector
β := [s, g, ω].
(31)
The feature vector β represents vocal fold dynamics at each position y along the glottal axis
with y∈ {1,…,Y}. In order to reduce the dimensionality of the parameter space for further
analysis, the feature vector is reduced to y∈ {1,…,12} by computing average values. Hence,
for an effective vocal fold length of 1 cm the feature vector represents the average oscillation
dynamics within 0.9 mm sections of the vocal length which constitutes sufficient accuracy.
Acoustic voice quality measures: For the nine frequency/intensity phonatory tasks also
the acoustic voice signals were analyzed. The selected acoustic sequences correspond to
the time intervals of the analyzed video data. From the selected intervals 10 voice quality
measures were derived using Dr.Speech-Tiger-Electronics/Voice-Assessment-3.2 software
(www.drspeech.com). The computed parameters describe temporal voice properties as cycle
duration stability (Jitter, STD F0, STD Period, F0 tremor), amplitude stability (Shimmer, STD
446
Advances in Vibration Analysis Research
Ampl., Amp. Tremor), harmonic to noise ratio (HNR), signal to noise ratio (SNR), and
normalized noise energy (NNE). The nine different frequency/intensity classes are given by
the measured sound pressure level (SPL[dB]) and mean fundamental frequency (Mean
F0[Hz]), Tab. 2.
Fig. 5. The contour lines O (opening phase) and C (closing phase) describe the main
characteristics of sPVGα geometry. The contours represent the spatio-temporal positions of
vocal fold edges at the oscillation states n=(30,60,90) for the left and right vocal fold. The n
value corresponds to the percentage of open and closed positions.
No.Sequ.
SPL(dB)
Mean F0
(Hz)
CS1
12
59,0
±0,8
153
±3
CS2
9
63,3
±0,5
160
±4
CS3
12
72,5
±1,7
201
±2
CS4
12
58
±0
182
±4
CS5
11
63
±0
193
±4
CS6
12
75
±0
231
±8
CS7
12
58,3
±0,5
318
±5
CS8
12
64,3
±1,4
328
±8
CS9
12
71
±0,9
328
±5
Table 2. Mean values and standard deviations for the different fundamental frequencies
[mean F0] and voice intensities [sound pressure level (SPL[dB])] representing the nine
different phonatory tasks CS1-CS9.
Classification of different phonation conditions: Due to the high number of PVG
parameters conventional statistics and correlation analysis is not appropriate to identify
potential parameter changes between the different phonation conditions. Thus, to explore
the influence of intensity and frequency alterations within the parameter sets a nonlinear
classification approach was applied (Hild et al., 2006; Selvan & Ramakrishnan, 2007; Lin,
2008).
The following hypothesis was investigated: if a classifier is capable of distinguishing
between different phonatory classes it can be concluded that intensity and frequency
variations are actually present within the observed vocal fold dynamics represented by the
introduced feature sets.
Support Vector Machine Classification of Vocal Fold Vibrations Based on Phonovibrogram Features
447
For classification of the PVG features, a nonlinear support vector machine (SVM) was used
(Duchesne et al., 2008; Kumar & Zhang, 2006). For the SVM, a Gaussian radial basis function
kernel (RBF) was chosen (Vapnik, 1995). Appropriate SVM parameters were determined by
an evolutionary strategy optimization procedure (Beyer & Schwefel, 2002). The parameter
space of SVM, cost parameter and the width of the RBF kernel was automatically searched
in order to obtain best classification results (Hsu et al., 2003). The models' classification
accuracy was evaluated via 10-fold cross-validation with stratification (Kohavi, 1995).
In order to compare PVG result with conventionally used measures the classifier was also
applied to traditional glottal and symmetry parameters as well as to the ten acoustic voice
quality measures.
3. Results
3.1 Validation of data acquisition
For a reliable interpretation of the later classification results it is essential to verify that the
data acquisition representing the nine different phonatory tasks effectively succeeded. Tab.
2 shows the means and standard deviations for the different sound pressure levels (SPL)
and fundamental frequencies (mean F0) for all nine phonatory tasks. Already the very small
standard deviations of the SPL and mean F0 within the classes CS1-CS9 prove the high
consistency of the data acquisition which included the repeated recording of the different
phonatory tasks. Applying statistical analysis (Kolmogorov-Smirnov-Tests following t-Tests
or Mann-Whitney-U-Tests) it could be shown that for frequency classes LOW (CF1),
NORMAL (CF2), and HIGH (CF3) (Eq. (1)) the fundamental frequencies were significantly
(p<0.05) different. Also for intensity classes SOFT (CI1), NORMAL (CI2), and LOUD (CI3)
(see Eq. (2)) the intensity values were computed significantly (p<0.05) different.
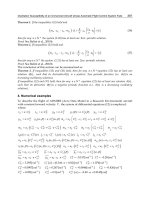
3.2 SVM classification of vocal fold vibrations
Exemplarily, Tab. 3 shows SVM classification results obtained for frequency classes CF1CF3. The Class Precision reflects the percentage of the correct allocation: 30 out of 104
sequences were predicted as low (CF1). From these 30, three sequences were wrongly
assigned to the class low (being actually in class CF2) resulting in 90% Class Precision. In
contrast, the Class Recall reflects the percentage of how many members of the class were
allocated towards the class. Here, 35 out of 38 normal sequences were correctly assigned to
class CF2 whereas three sequences were predicted to class CF1. This results in a Class Recall
accuracy of 92.1%. The Overall Accuracy for all classes is 94.18% ±6.53% which represents the
mean performance of the classifier which is in the following used for interpretation purpose.
Low (CF1)
Normal (CF2)
High (CF3)
Class Recall
True Low
27
3
0
90.0%
True Normal
3
35
0
92.1%
True High
0
0
36
100.0%
Class Precision
90.0%
92.1
100.0%
Table 3. Classification result of the SMV of the intensity class problem CF1-CF3 using the
entire feature vector from eq. (31). The overall classification accuracy amounts approx. 94%.
Using the parameters captured within the feature vector β:=[s,g,ω] (Eq. (31)) the SVM
reached a classification accuracy of 95.1%±6.7% for the frequency class problem (CF1-3),
448
Advances in Vibration Analysis Research
97.3%±4.2% for the intensity class problem (CI1-3), and 94.2%±9.1% for the nine class
problem (CS1-CS9). This very high classification accuracy was obtained just by parameters
describing vocal fold dynamics extracted from the high speed videos.
In order to investigate which parameters can be made responsible for the high performance
of the classifier, the SVM was individually applied to components [s], [g] and [ω] as well as
to the combinations [s,g], [g,ω], [s,ω]. The results are summarized in Fig. 6. The conventional
symmetry [s] and glottal parameters [g] achieved classification accuracy of only 15.5%±4.9%
and 40.5%±10.5% for the nine class problem. Likewise, the classification accuracies for the
frequency and intensity class problems were significantly reduced. Contrarily, very high
classification accuracy was obtained using the new introduced PVG features [ω]. Applying
exclusively the PVG features [ω] a classification accuracy of 85.5%±7.7% for the nine class
problem, 96.2%±4.7% for the frequency class problem, and 91.6%±7.6% for the intensity class
problem was obtained.
Fig. 6. Mean classification accuracies and standard deviations achieved by applying
conventional symmetry [s], glottal [g] and PVG [ω] parameters using a support vector
machine (SVM) classification approach with stratified 10-fold cross-validation. The highest
classification accuracy is obtained by the new introduced PVG features [ω].
As the PVG feature vector contains information derived from different oscillation states
( Oα ,n , Cα ,n ) it was further investigated which oscillation state delivers the most valuable
y i
y i
information needed for classifying vocal fold vibrations. For this purpose, the SVM was
applied to different oscillation parts n={30,60,90} of the feature vector [ω]. Fig. 7 summarizes
the achieved classification accuracies obtained by n={[30,60],[60,90],[30,60,90]}. Using the
single oscillation states n={[30],[60],[90]}, already a mean classification accuracy of
58.2%±9.9% could be obtained for the nine class problem which exceeds considerably the
Support Vector Machine Classification of Vocal Fold Vibrations Based on Phonovibrogram Features
449
classification rates obtained by the conventional symmetry [s] and glottal [g] parameters as
shown in Fig. 6. The classification accuracies by applying combined oscillation states
n={[30,60],[60,90] ,[30,60,90]} are significantly improved.
Fig. 7. Mean SVM classification accuracies and standard deviations achieved by applying
part of the PVG features vector [ω] representing different oscillation states n={30,60,90}.
Highest classification accuracy is obtained by a combination of the different oscillation
states.
In a final step it was investigated which PVG components contribute most to the
classification accuracy. For this purpose the feature vector [ω] (eq. (30)) was divided into
parameter groups representing the average vibration type [ω1] : = (Oα ,n Cα ,n ) , the average
y i
y i
deflection characteristics [ω2] := ( POα ,n PCα ,n ), the average lateral vibration symmetry
y i
y i
n
[ω3]:=( N O ,C ),
and
the
average
temporal
stability
of
vocal
fold
vibrations
[ω4]:=( σ(Oα ,n ) , σ(ΡOα ,n ) , σ(Cα ,n ) , σ(ΡCα ,n ) ). Figure 8 shows the classification accuracies
yi
yi
yi
y i
obtained by the different parts of the feature vector [ω].
The isolated consideration of the average vibration type [ω1] results into the highest
classification accuracy of 52.8%±6.8% for the nine class problem and a mean accuracy of
85.1%±10.58% for the frequency and intensity class problems. By comparing the results in
Fig. 6 and Fig. 8, it can be seen, that information about the mean vibration type (Fig. 8)
already gives better classification results than information about the conventional
parameters as speed quotient, open quotient, glottal closure insufficiency (Fig. 6).
Information about vocal fold deflection amplitudes [ω2], left/right discrepancies [ω3] and
450
Advances in Vibration Analysis Research
vibration instabilities [ω4] do not reach the same level of classification accuracy. However,
combining all PVG features increases considerably the classification accuracy of up to
96.2%±4.7% for the frequency class problem.
Fig. 8. Results show the comparison between the different features within the PVG
parameters. The PVG parameters are split into groups representing the spatio-temporal
vibration type, information about vibration amplitudes and symmetry as well as vibration
instabilities. Fusing all information ω1-ω4 to a common feature vector results highest
classification performance (i.e. frequency classes). The performance of the different
classification results shows that the more precisely the vocal fold dynamics is described
using a combination of several PVG features the better the dynamical changes of vocal fold
dynamics can be captured.
3.3 SVM classification of the acoustic signal
To give an overview of the acoustic measures, Tab. 4 shows the means and standard
deviations for all 10 computed acoustic voice quality parameters used for classification.
Table 5 summarizes the classification results for acoustic parameters. The best classification
performance (93.45%) was achieved for the frequency class problem (CF1-CF3). The
accuracy for the three class intensity problem (85.64%) was just slightly higher than accuracy
for the combined nine class problem (83.73%). In contrast to the classification results
obtained using the PVG parameters the acoustic parameters reached lower classification
accuracies. Nevertheless, for the nine class problem still a classification accuracy of more
than 80% could be achieved. It proves that even for a single subject frequency and intensity
changes of the voice signal influence voice quality outcome measures.
Support Vector Machine Classification of Vocal Fold Vibrations Based on Phonovibrogram Features
Jitter
(%)
Shimmer
(%)
HNR
(%)
SNR
(%)
NNE
(%)
STD F0
(Hz)
STD Period
(ms)
Mean Amp
(%)
STD Amp.
(%)
F0 Tremor
(Hz)
Amp.
Tremor (Hz)
CS1
0,30
±0,06
2,17
±0,44
23,4
±1,6
23,4
±1,6
-3,0
±1,5
1,4
±0,5
0,06
±0,02
86
±4,8
5,9
±1,7
4,0
±2,6
2,5
±1,3
CS2
0,13
±0,02
1,07
±0,17
30,2
±1,0
30,2
±1,0
-13,6
±1,9
1,0
±0,3
0,04
±0,01
92
±2,1
3,5
±1,3
2,6
±1,2
2,1
±1,2
CS3
0,12
±0,03
0,98
±0,35
33,2
±1,7
33,2
±1,7
-17,1
±2,7
1,4
±0,5
0,04
±0,01
91
±3,1
4,4
±1,5
2,8
±1,3
2,4
±1,5
CS4
0,21
±0,04
1,69
±0,36
27,6
±1,9
27,6
±1,9
-8,6
±4,0
1,4
±0,4
0,04
±0,01
86
±4,1
6,1
±1,5
3,3
±1,3
2,6
±1,0
CS5
0,21
±0,08
1,48
±0,25
28,8
±1,3
28,8
±1,3
-11,1
±2,9
1,5
±0,7
0,04
±0,02
90
±3,1
5,4
±2,1
2,7
±1,3
3,0
±1,3
CS6
0,10
±0,03
0,88
±0,45
32,4
±3,0
32,4
±3,0
-21,2
±1,1
1,5
±0,4
0,03
±0,01
90
±3,1
4,8
±1,8
2,1
±0,8
2,2
±1,1
CS7
0,21
±0,05
1,68
±0,42
28,6
±2,2
28,7
±2,2
-9,3
±2,6
2,8
±1,5
0,03
±0,01
85
±5,5
6,2
±2,1
2,8
±1,5
2,6
±1,4
CS8
0,11
±0,02
0,85
±0,22
34,6
±1,7
34,6
±1,7
-13,1
±2,5
2,3
±0,6
0,02
±0,01
88
±4,3
5,1
±1,5
2,5
±1,8
2,4
±1,2
451
CS9
0,12
±0,05
0,84
±0,11
28,4
±1,6
28,4
±1,6
-21,5
±2,3
1,6
±0,3
0,02
±0,01
93
±2,3
2,7
±0,9
1,8
±0,7
4,9
±3,8
Table 4. Mean values and standard deviations of the 10 acoustic measured parameters
(Dr.Speech 3.2) grouped for the nine paradigms. The vertical grey shadings correspond to
the frequency classes.
Accuracy (%)
STD (%)
SVM accuracy for acoustic parameters
Intensity
Frequency
85.64
93.45
6.14
8.25
Frequency/Intensity
83.73
8.60
Table 5. Overall accuracy of the acoustic SVM classification results.
4. Discussion
The endoscopic imaging of vocal fold vibrations is an essential part of clinical examination
of voice disorders. Digital high-speed videolaryngoscopy is the state-of-the-art technology
for investigation of asymmetric and irregular vocal fold vibrations (Doellinger, 2009).
Similar to stroboscopy, high-speed videos are frequently evaluated by visual inspection
relying on the experience of the investigator. There is still no objective or standardized
procedure for describing the entire vibration patterns of vocal folds. Besides the description
of vocal fold vibrations, the acoustic analysis of the voice signal gives valuable information
for describing the severity of voice disorders. However, in most of the applied methods the
acoustic properties and the laryngeal vibrations are separately examined. Thus, there is still
little knowledge about the direct relation between the acoustic voice signal and the vibration
pattern of vocal folds.
452
Advances in Vibration Analysis Research
In this work, we presented a novel approach, called Phonovibrography, allowing an
objective analysis of the visible vocal fold dynamics. Here, quantitative features are derived
from PVG images which describe precisely the entire characteristics of vocal fold dynamics.
For validation purpose Phonovibrography was applied to 108 high-speed sequences
recorded from a single healthy female subject with normal voice. The female subject was
instructed to produce 9 different phonatory tasks, i.e. phonation at different frequency and
intensity combinations. A sequence length of one second time (> 150 glottal cycles) was
chosen. The simultaneously recorded acoustic signals were analyzed using established voice
quality measures (www.drspeech.com). Thus, besides evaluating the PVG analysis
approach the effect of different phonation conditions on both the laryngeal vibrations and
the acoustic voice signal could be studied.
Choosing just a single subject for validating the accuracy of the proposed PVG approach is
mandatory as only within a healthy subject the phonatory tasks related changes of vocal
fold vibration patterns can be interpreted in a correct way. For a single subject the extensive
data acquisition comprising the recording of 108 repeated phonatory tasks is very timeconsuming and potentially incriminating for the subject. Thus, collecting such a full data set
from several subjects is difficult to achieve. As far as we know this examination presents the
worldwide most detailed analysis of vocal fold vibrations within a single subject. Besides
evaluating the performance of novel analysis approaches, the data set can further be used to
investigate very precisely the fundamental principles of voice production in normal voice.
In the present study we applied methods from the field of machine learning towards
recognition of different phonatory tasks within vocal fold dynamics as well as within the
simultaneously recorded acoustic signals. Even though endoscopic and voice data represent
different physical properties describing voice production (tissue vibrations vs. acoustic
sound pressure), both modalities could be used to individually classify the nine different
phonatory tasks within normal voice of one female.
4.1 Classification of vocal fold vibrations
The results given in Fig. 6 clearly show that a very high SVM classification accuracy (up to
96%) could be obtained using the new introduced PVG features. Even the classification of
the nine class problem showed a very high performance of 85.5% which is in the same range
as the results obtained using the acoustic measures, Tab. 5. It can be concluded from the
results that the investigated frequency and intensity variations can be quantitatively traced
back to alterations of the laryngeal dynamics. Furthermore, changes of vocal folds dynamics
induce alterations of the acoustic signal as shown in Tabs. 4 and 5. To our knowledge, this is
the first time that vocal fold vibrations could be quantitatively described so precisely during
different phonation tasks and that the different phonatory task could automatically be
classified at the vocal fold level.
The results obtained by the PVG parameters were further compared to symmetry/glottal
parameters (Eqs. (13) and (22): [s], [g]) which are frequently used to describe vocal fold
vibrations. Fig. 6 shows, that using the conventionally used glottal and symmetry
parameters the performance of the classification is highly reduced. Using the feature vector
[s] only a classification accuracy of approx. 15% for the nine class problem could be
obtained. The glottal features [g] show a better performance with approx. 40% but are still
far worse than the classification accuracy (94%) obtained using PVG parameters ω. The low
classification results obtained by the glottal parameters show, that the reduction of the
complex 2D vocal fold vibration pattern to a few parameters based on 1D glottal area
Support Vector Machine Classification of Vocal Fold Vibrations Based on Phonovibrogram Features
453
waveform signal is not sufficient for analyzing the laryngeal vibrations completely.
Likewise, putting the focus only onto specific features as vocal fold symmetry (amplitude,
phase, frequency) – which is frequently evaluated within the subjective assessment of
stroboscopic or high speed movies - is not sufficient to fully describe vocal fold vibrations.
Having a closer look at PVG features at different oscillation states n={30,60,90}, similar
results were found for n=30 and n=60 state (Fig. 7). While the three class problems could still
be classified with a high accuracy, for the nice class problem a classification accuracy of only
approx. 60% was obtained. For n=90 the classification results show a similar behavior with a
slightly reduced performance. However, when fusing all information obtained from the
three oscillation states, the highest classification results were obtained. The increase of the
performance documents that a precise analysis of vocal fold dynamics demands to describe
the entire vibration pattern very comprehensively as it is done by PVG parameters which
describe the temporal and spatial propagation of vocal fold vibrations.
Splitting up PVG parameters in different features ([ω1]: vibration type, [ω2]: deflection
information, ω3: symmetry, and ω4: instabilities) further proves the benefit of including all
extracted parameters together. Considering the parameter features separately (Fig. 8) the
classification accuracy is reduced. Nevertheless, despite the feature reduction the
classification accuracy using PVG parameters ω1 - which comprises only information about
the mean spatio-temporal vibration propagation of vocal folds - still shows a better
performance than glottal [g] and symmetry [s] parameters together. Combining all features
together results into highest classification accuracy of up to 96%. This again suggests the
necessity of considering a combination of all features types as deflections, discrepancy, and
instability.
4.2 Comparison of acoustics and vocal fold vibration classification
The highly consistent results obtained from acoustic and motion data show that within a
subject vocal fold vibrations as well as the acoustic voice signal obtained from different trials
can only be compared if they are recorded at similar intensity levels and similar
fundamental frequencies. Recordings at significantly different intensity levels or frequencies
will definitely cause different perturbations measures (e.g. Jitter, Shimmer, HNR, SNR,
NNE) as well as changes within the laryngeal vibrations (Rovirosa et al., 2008). The results
suggest that in clinical practice the repeated examination of a subject’s voice needs to be
performed at a comparable phonatory condition. Otherwise, the clinical value of
measurements as objective and representative voice quality measures is highly limited.
In this work it could be shown that PVG analysis is a sufficiently sensitive approach to
successfully identify even subtle changes in vocal fold vibratory characteristics induced by
different phonatory tasks. As the sensitivity of the PVG approach could successfully be
demonstrated, it can be used in ongoing studies to investigate vocal fold vibrations in
presence of voice disorders. For studying pathologically induced alterations of vocal fold
dynamics within a subject it must be considered that the examinations should be done
under similar phonation conditions to exclude examination dependent influences.
5. Conclusion
Digital high-speed videolaryngoscopy is the state-of-the-art technology for investigating
normal and pathological vocal fold vibrations. However, without adequate image analysis
there is hardly an additional benefit comparing to the currently used stroboscopy technique
454
Advances in Vibration Analysis Research
in sense of evidenced based medicine. The Phonovibrogram (PVG) has the potential to
overcome the subjective or semi-automatic assessment of high-speed videos (Kunduk et al.,
2010). Within this study it was proven that PVG image analysis has the necessary sensitivity
to capture even minor alterations within vocal fold vibrations induced just by frequency and
intensity variations. It was further shown that alterations of vocal fold vibrations are also
detectable within acoustic perturbation measures. The high accordance between the results
further proves that changes within the acoustic signal can directly be traced back to
alterations of vocal fold vibrations. In respect to future clinical application, PVG analysis
may be a useful tool to standardize the description of healthy and abnormal vocal fold
vibrations. Objective Phonovibrography can directly be applied after examination and the
obtained PVG images can easily be documented and stored on a hard-disc-drive using a
lossless image data format which is essential for evidenced based medicine. An objective
endoscopic image analysis tool, such as PVG, describing the vocal fold dynamics, could not
only enhance voice assessment techniques but also help to objectively determine the
outcome following an intervention in voice disorders (Voigt et al., 2010).
6. Acknowledgements
This work was supported by Louisiana State University, Faculty Research Grant 2008/2009,
Deutsche Forschungsgemeinschaft (DFG) grant no. FOR894/1 and no. LO1413/2-1.
7. References
Beyer H.G. Schwefel H.P. (2002). Evolution strategies - a comprehensive introduction.
Natural Computing, vol. 1, pp. 3-52.
Braunschweig T., Flaschke J., Schelhorn-Neise P., Doellinger M. (2008). High-speed video
analysis of the phonation onset, with an application to the diagnosis of functional
dysphonia. Med Phys Eng, vol. 30,no. 1, pp. 59-66.
Doellinger M., Hoppe U., Hettlich F., Lohscheller J., Schuberth S., Eysholdt U. (2002).
Vibration parameter extraction from endoscopic image series of the vocal folds.
IEEE T Biomed Eng, vol. 49, no. 8, pp. 773–781.
Doellinger M., Braunschweig T, Lohscheller J, Eysholdt U., Hoppe U. (2003). Normal voice
production: computation of driving parameters from endoscopic digital high speed
images. Methods Inf Med, vol. 42, no.3, pp. 271-276.
Doellinger M. (2009). The next Step in voice assessment: High-Speed digital endoscopy and
objective evaluation. Current Bioinformatics, vol. 60, no. 2, pp. 101-111.
Doellinger M., Lohscheller J., McWhorter A., Kunduk M. (2009). Variability of Normal Vocal
Fold Dynamics for Different Vocal Loading in One Healthy Subject Investigated by
Phonovibrograms. J Voice, vol. 23, no. 2, pp. 175-181.
Deliyski D.D., Petrushev P.P., Bonilha H.S., Gerlach T., Martin-Harris B., Hillman R.E.
(2008). Clinical Implementation of Laryngeal High-Speed Videoendoscopy:
Challenges and Evolution. Folia Phoniatr Logop, vol. 60, no. 1, pp. 33-44.
Duchesne S., Caroli A., Geroldi C., Barillot C., Frisoni G.B., Collins D.L. (2008). MRI-based
automated computer classification of probabile AD versus normal controls. IEEE
Trans Med Imaging, vol. 27, no. 4, pp. 509-520.
Eysholdt U. & Lohscheller J. (2008). Phonovibrogram: vocal fold dynamics integrated within
a single image. HNO, vol. 56, no. 12, pp. 1207-1212.
Support Vector Machine Classification of Vocal Fold Vibrations Based on Phonovibrogram Features
455
Hild K.E., Erdogmus D., Torkkola K., Principe J.C. (2006). Feature extraction using
information-theoretic learning. IEEE Trans Pattern Anal Mach Intell, vol. 28, no. 9,
pp. 1385-1392.
Hsu C.W., Chang C.C., Lin C.J. (2003). A practical guide to support vector classification.
Technical report, Department of Computer Science and Information Engineering,
National Taiwan University.
Jiang J.J., Tangc S., Dalal M., Wu C.H, Hanson D.G. (1998). Integrated analyzer and classifier
of glottographic signals. IEEE Trans Rehabil Eng, vol. 6, no. 2, pp. 227-234.
Karnell M.P. (1991). Laryngeal perturbation analysis: minimum length of analysis window. J
Speech Hear Res, vol. 34, no. 4, pp. 544-548.
Kohavi R. (1995). A Study of Cross-Validation and Bootstrap for Accuracy Estimation and
Model Selection. IJCAI, pp. 1137-1145.
Kumar A. & Zhang D. (2006). Personal recognition using hand shape and texture. IEEE
Trans Image Process, vol. 15, no. 8, pp. 2454-2461.
Kunduk M., Doellinger M., McWhorter A., Lohscheller J. (2010). Assessment of the
variability of vocal fold dynamics with and between recordings with high-speed
imaging and by Phonovibrogram. Laryngoscope, vol. 120, no. 5, 981-987.
Lin H. (2008). Identification of spinal deformity classification with total curvature analysis
based on coded structured light. IEEE Trans Biomed Eng, vol. 55, no. 1, pp. 376-382.
Lohscheller J., Toy H., Rosanowski F., Eysholdt U., Doellinger M. (2007). Clinically
evaluated procedure for the reconstruction of vocal fold vibrations from
endoscopic digital high-speed videos. Med Image Anal, vol. 11, no. 4, pp. 400-413.
Lohscheller J., Eysholdt U., Toy H., Doellinger M. (2008a). Phonovibrography: mapping
high-speed movies of vocal fold vibrations into 2-d diagrams for visualizing and
analyzing the underlying laryngeal dynamics. IEEE Trans Med Imaging, vol. 27, no.
3, pp. 300-309.
Lohscheller J., Doellinger M., McWhorter A., Kunduk M. (2008b). Quantitative analysis of
vocal loading effects on vocal fold dynamics using Phonovibrograms. Ann Otol
Rhinol Laryngol, vol. 117, no. 7, pp. 484-493.
Lohscheller J. & Eysholdt U. (2008). Phonovibrogram Visualization of Entire Vocal Fold
Dynamics. Laryngoscope, vol. 118, no. 4, pp. 753-758.
Murphy P.J. (1999). Perturbation-free measurement of the harmonics-to-noise ratio in voice
signals using pitch synchronous harmonic analysis. J Acoust Soc Am, vol. 105, no. 5,
pp. 2866-2881.
Neubauer J., Mergell P., Eysholdt U., Herzel H. (2001). Spatio-temporal analysis of irregular
vocal fold oscillations: biphonation due to desynchronization of spatial modes. J.
Acoust. Soc. Am., vol. 110, no. 6, pp. 3179-3192.
Qiu Q., Schutte H.K., Gu L., Yu Q. (2003). An automatic method to quantify the vibration
properties of human vocal folds via videokymography. Folia Phoniatr Logop, vol. 55,
no. 3, pp. 128–136.
Rovirosa A., Ascaso C., Abellana R., Martínez-Celdrán E., Ortega A., Velasco M., Bonet M.,
Herrero T., Arenas M., Biete A. (2008). Acoustic voice analysis in different phonetic
contexts after larynx radiotherapy for T1 vocal cord carcinoma. Clin Transl Oncol,
vol. 10, no. 3, pp. 168-174.
Ruben R.J. (2000). Redefining the survival of the fittest: Communication disorders in the 21st
century. Laryngoscope, vol. 110, no. 6, pp. 241-245.
456
Advances in Vibration Analysis Research
Schwarz R., Doellinger M., Wurzbacher T., Eysholdt U., Lohscheller J. (2008). Spatiotemporal quantification of vocal fold vibrations using high-speed videoendoscopy
and a biomechanical model. J Acoust Soc Am, vol. 123, no. 5, pp. 2717-2732.
Selvan S. & Ramakrishnan S. (2007). SVD-based modeling for image texture classification
using wavelet transformation. IEEE Trans Image Process, vol. 16, no. 11, pp. 26882696.
Titze, I.R. (2006). The Myoelastic Aerodynamic Theory of Phonation. National Center for Voice
and Speech, Iowa City, IA 52242, USA, ISBN 978-0-87414-156-6
Tokuda I., Horácek J., Svec J.G., Herzel H. (2007). Comparison of biomechanical modeling of
register transitions and voice instabilities with excised larynx experiments. J Acoust
Soc Am, vol. 122, no. 1, pp. 519-531.
Vapnik V.N. (1995). The nature of statistical learning theory. Springer-Verlag New York,
Inc., ISBN-10: 0387987800, New York, NY, USA.
Voigt D., Doellinger M., Braunschweig T., Yang A., Eysholdt U., Lohscheller J. (2010).
Classification of functional voice disorders based on Phonovibrograms. Artif Intell
Med, vol. 49, no. 1, 51-59.
Westphal L & Childers D. (1983). Representation of glottal shape data for signal processing.
IEEE Trans Acoust Speech, vol. 31, pp. 766–769.
Wurzbacher T, Schwarz R., Doellinger M, Hoppe U., Eysholdt U., Lohscheller J. (2006).
Model-based classification of non-stationary vocal fold vibrations. J Acoust Soc Am,
vol. 120, no. 2, pp. 1012–1027.
Wurzbacher T., Doellinger M., Schwarz R., Hoppe U., Eysholdt U., Lohscheller J. (2008).
Spatiotemporal classification of vocal fold dynamics by a multi mass model
comprising time-dependent parameters. J Acoust Soc Am, vol. 123, no. 4, pp. 23242334.
Yan Y., Ahmad K., Kunduk M., Bless D. Analysis of vocal-fold vibrations from high-speed
laryngeal images using a hilbert transform-based methodology. J Voice, vol. 19, no.
2, pp. 161–175.A.
Yang A., Lohscheller J., Berry D.A., Becker S., Eysholdt U., Voigt D., Döllinger M. (2010).
Biomechanical Modeling of Human Vocal Fold Dyanmics by a 3D-Multi-MassModel. J Acoust Soc Am, vol.127, no. 2, pp. 1014-1031.
Zhang Y &. Jiang J.J. (2008). Acoustic analyses of sustained and running voices from patients
with laryngeal pathologies. J Voice, vol. 22, no. 1, pp. 1-9.