báo cáo hóa học:" Concordane of OSTA and lumbar spine BMD by DXA in identifying risk of osteoporosis" pptx
Bạn đang xem bản rút gọn của tài liệu. Xem và tải ngay bản đầy đủ của tài liệu tại đây (232.07 KB, 6 trang )
BioMed Central
Page 1 of 6
(page number not for citation purposes)
Journal of Orthopaedic Surgery and
Research
Open Access
Research article
Concordane of OSTA and lumbar spine BMD by DXA in identifying
risk of osteoporosis
ChunYan Lu
1
, DeCai Chen*
1
, YunHua Cai
2
and SongQuan Wei
1
Address:
1
Department of Endocrinology, West China hospital of SiChuan University, ChengDu, China and
2
Department of Endocrinology,
County hospital of QianWei, SiChuan, China
Email: ChunYan Lu - ; DeCai Chen* - ; YunHua Cai - ;
SongQuan Wei -
* Corresponding author
Abstract
Objective: To investigate the accuracy of Osteoporosis Self-assessment Tool for Asians (OSTA)
in identifying the risk of osteoporosis in postmenopausal women. To validate use of OSTA risk
index by comparing it with the bone mineral density (BMD) of lumbar spine measured by dual
energy X-ray absorptiometry (DXA).
Methods: The data of lumbar spine BMD (LS BMD) measurements by DXA of 218
postmenopausal women of Han nationality in Sichuan province were compared with OSTA risk
index. The concordance of OSTA and LS BMD were calculated and analyzed by fourfold table and
receiver operating characteristic (ROC) curve.
Results: The prevalence of osteoporosis in these women was 40.4% and 61.5%, with the LS BMD
T score cutoffs -2.5 and -2.0, respectively. The sensitivity, specificity, and accuracy of OSTA risk
index compared with T score cutoff -2.5 of LS BMD were 59.1%, 56.9% and 57.8%, respectively,
while they were 57.5%, 63.1%, 59.6% by T score cutoff -2.0.
Conclusion: For identifying risk of osteoporosis, the concurrence was lower than those reported
studies when comparing LS BMD measurements to OSTA risk index in Chinese Han nationality
postmenopausal women of Sichuan province. Physicians should identify women who need BMD
measurement according to more factors rather than age and body weight.
1. Background
According to the improvement of living standard and life
expectancy, osteoporosis (OP) is becoming one of the
most common pubic healthy problems in China and
worldwide. The prevalence of osteoporosis is progres-
sively increasing. The most severe complication of OP is
fracture, which brings great burden to individual, family
and society.
Osteoporosis is very common among postmenopausal
women [1-3], while women of high risk are often asymp-
tomatic. Therefore, early screening and evaluation of oste-
oporosis in postmenopausal women are important. It is
widely accepted that bone mineral density (BMD) meas-
urement measured by dual X-ray absorptiometry (DXA) is
the golden standard of diagnosis of OP. Because of the
limited availability and rather expensive cost of DXA, sim-
ple tools in identifying women needed DXA measure-
ments have developed.
Published: 21 November 2006
Journal of Orthopaedic Surgery and Research 2006, 1:14 doi:10.1186/1749-799X-1-14
Received: 09 April 2006
Accepted: 21 November 2006
This article is available from: />© 2006 Lu et al; licensee BioMed Central Ltd.
This is an Open Access article distributed under the terms of the Creative Commons Attribution License ( />),
which permits unrestricted use, distribution, and reproduction in any medium, provided the original work is properly cited.
Journal of Orthopaedic Surgery and Research 2006, 1:14 />Page 2 of 6
(page number not for citation purposes)
The Osteoporosis Self-assessment Tool for Asians (OSTA)
is an index using chart or formula to predict low BMD
simply on the basis of age and weight[4]. It was firstly pro-
posed by Koh LK, which had a sensitivity of 91% and spe-
cificity of 45% in identifying women of high risk when
compared with final results of femoral neck BMD meas-
urement in Asia women. The index of Osteoporosis Self-
assessment Tool (OST) is calculated by the same formula
or chart of OSTA, which is reported to predict low BMD in
other races of people using different cutoff values[5].
In this article, 218 Chinese women of Han nationality in
Sichuan province were assessed by OSTA index and the
usefulness of OSTA was evaluated to predict osteoporosis
in comparing with LS BMD which measured by DXA.
2. Data and methods
This study is a diagnostic test. We analyzed the database of
DXA measurement for lumbar spine BMD (LS BMD) from
August 1
st
2005 to September 30
th
2005 in our hospital.
Most of the patients did not measure femoral neck or hip
BMD. In-patient and out-patient postmenopausal women
of Han nationality from Sichuan province were selected
for further evaluation, among which enrolled in a physi-
cal examination clinic, rehabilitation department, geriat-
ric department and endocrinology department were
recruited. Patients were ineligible if they had a history in
their case files of advanced osteoarthritis, hyperthy-
roidism, hyperparathyroidism, renal failure, and other
knowing severe diseases or conditions that could interfere
with bone metabolism. Finally, 218 postmenopausal
women were eligible and applied the OSTA index.
LS BMD by DXA was measured with Challenger densito-
meter (DMS, France), which uses the DMS reference
source for the spine. A spine phantom was measured every
week to keep the precision error less than 2%. All meas-
urements were completed by one operator. T scores of
lumbar spine L
2
to L
4
were obtained and osteoporosis was
defined as T scores of any site equal to or less than -2.5[6].
In addition, when compared with the OSTA index, a T
score cutoff for osteoporosis of -2.0 were also applied,
according to the consensus of some specialists in
China[7]. These postmenopausal women were identified
at various BMD thresholds (T score values of -2.0 and -
2.5) for osteoporosis and non-osteoporosis (osteopenia
or normal).
OSTA index was derived according to the formula of 0.2 ×
(weight in kilograms – age in years), truncated to an inte-
ger[4,5,8]. Three risk categories were used for the index
according to its developer's recommendations[4] and in
our study, dichotomous cutoff for Asian women were
used as the following: ≥ 0 for low risk and < 0 for moder-
ate-high risk.
A fourfold table was applied to calculate the sensitivity
(sen.), specificity (spe.), and accuracy of OSTA compared
with different T score cutoffs of LS BMD by DXA. Receiver
operating characteristic curves (ROC curves) were con-
structed and the areas under curve (AUC) as well as its
95% confidence interval (95% CI) was estimated by using
SPSS statistical software10.0 (SPSS Inc.). The prevalence
of osteoporosis was examined across different categories
of the OSTA risk index.
3. Results
The mean age of the postmenopausal women in this study
was 59.0 ± 9.2 years, and the mean weight was 56.7 ± 9.8
kg. The prevalence of osteoporosis at lumbar spine
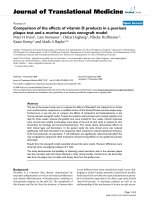
increased progressively with age (Figure 1). Of all the
women in our sample, 40.4% (T ≤ -2.5) and 61.5% (T ≤ -
2.0) were osteoporotic at L
2–4
, respectively. The OSTA
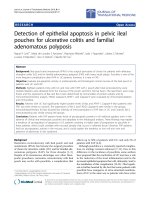
index varied between -9 to 6, and the percent distribution
of the women according to the OSTA index is shown in
Figure 2. On the basis of categories used in Asian
women[4], there are 50.5% women (n = 110) of low risk,
42.2% (n = 92) of moderate risk, and 7.3% (n = 16) of
high risk, respectively. Figure 3 shows the different cutoffs
for LS BMD T score by DXA and the categories of low,
moderate, and high risk of osteoporosis by OSTA index.
Table 1 was the fourfold table of OSTA in assessing risk of
osteoporosis comparing with LS BMD according to vari-
ous cutoffs. Performance of OSTA risk index comparing
with LS BMD by DXA and T score cutoffs was shown in
table 2. The results showed that the sensitivity, specificity,
and accuracy were 59.1%, 56.9%, 57.8% (LS BMD T score
cutoff -2.5), and 57.5%, 63.1%, 59.6%(LS BMD T score
cutoff -2.0), respectively. The OSTA yielded AUC of 0.615
(95% CI 0.537 to 0.692) and 0.628 (95% CI 0.553 to
0.703) for LS BMD by DXA T score of -2.5 or less and -2.0
or less, respectively (Figure 4 and 5).
4. Discussion
It's never ending for specialists to find out an easy tool for
osteoporosis risk evaluation. The Chinese Medical Associ-
ation recommended that all women aged 65 and older or
postmenopausal women with one or more risk factors
should have BMD measurements[9]. But it is not possible
for all women satisfied with the conditions mentioned
above to receive DXA measurements in China, because of
little physicians' and patients' awareness, little public
heath policy support, and so on. Therefore, we want to
find out patients in high risk of osteoporosis using simple
tools such as OSTA, which had been validated well in clas-
sifying the osteoporotic risk among postmenopausal
women.
There are many risk assessment indices in identifying
women at moderate or high risk of osteoporosis who need
Journal of Orthopaedic Surgery and Research 2006, 1:14 />Page 3 of 6
(page number not for citation purposes)
BMD measurements by DXA, such as Osteoporosis Index
of Risk (OSIRIS), Simple Calculated Osteoporosis Risk
Estimation (SCORE), Osteoporosis Risk Assessment
Instrument (ORAI), and OSTA. All of these tools were pre-
dicting osteoporosis risk according to age, weight, race,
history of fracture, history of medication, and so on. The
main results were displayed in table 3. It was said the
OSTA, based only on age and weight, could perform well
in assessing risk categories[4,5,8,10-14]. In our study
involving 218 Asian postmenopausal women of Han
nationality in Sichuan Province with a mean age of 59.0
years, the OSTA index did not perform very well in identi-
fying women of high risk whose LS BMD by DXA meas-
urements were very low (T score less than -2.5 or -2.0). For
example, among the 88 (40.4%) women of osteoporosis
using a T score cutoff -2.5 by DXA, only 52 women were
identified moderate or high risk by OSTA risk index. It
means 41% women of osteoporosis will be neglected if
they were assessed only by OSTA index. Meanwhile,
among the 130 women of non-OP (osteopenia or normal
bone mass), only 74 (57%) women were low risk by
OSTA who did not need BMD measurement.
We found the performance of OSTA risk index is not as
satisfied as those reported in Asian or other races and it
can not help us precisely to give judgement on whether a
Prevalence of osteoporosis by age and T score cutoffs (T ≤ -2.5 and T ≤ -2.0) of DXA measurementFigure 1
Prevalence of osteoporosis by age and T score cutoffs (T ≤ -2.5 and T ≤ -2.0) of DXA measurement.
Journal of Orthopaedic Surgery and Research 2006, 1:14 />Page 4 of 6
(page number not for citation purposes)
Prevalence of osteoporosis according to various T score cutoffs at different levels of OSTA risk indexFigure 3
Prevalence of osteoporosis according to various T score cutoffs at different levels of OSTA risk index. (Categorization used in
Asian women by koh et al[4]. Numbers of women in low, moderate, and high risk group are 110, 92, 16, respectively.)
Distribution of the patients according to their OSTA risk indexFigure 2
Distribution of the patients according to their OSTA risk index.
Journal of Orthopaedic Surgery and Research 2006, 1:14 />Page 5 of 6
(page number not for citation purposes)
DXA measurement of LS BMD should be given to a post-
menopausal women or not. Because our subjects were
from hospital, not from an epidemiologic investigation,
the prevalence of osteoporosis was rather higher than
those reported in Asian women[4]. Through a woman's
life, there are so many risk factors for osteoporosis, such
as age, race, hormone conditions, heredity, weight, nutri-
tional status, history of fracture, childbearing, and so
on[15]. We think there were limitations in OSTA risk
index by using only age and weight. According to the
OSTA formula, if the weight (in kilograms) of a woman
surpasses her age (in years), she will always be in low risk
of osteoporosis. It is of some absurd for you to tell your
patient that when she was 90 years old, she should keep
the body weight 90 kg for prevention of osteoporosis.
The ROC curve for OSTA index using LS BMD T score cut-off -2.0 by DXA measurementFigure 5
The ROC curve for OSTA index using LS BMD T score cut-
off -2.0 by DXA measurement.
Table 1: Fourfold table of OSTA comparing with LS BMD by DXA
LS BMD by DXA
T ≤ -2.5 T ≤ -2.0
OSTA index OP non-OP total OP non-OP total
moderate-high risk 52 56 108 77 31 108
low risk 36 74 110 57 53 110
total 88 130 218 134 84 218
Table 2: Performance of OSTA index by LS BMD and various T score cutoffs
Sen. Spe. Accuracy
T ≤ -2.5 59.1% 56.9% 57.8%
T ≤ -2.0 57.5% 63.1% 59.6%
The ROC curve for OSTA index using LS BMD T score cut-off -2.5 by DXA measurementFigure 4
The ROC curve for OSTA index using LS BMD T score cut-
off -2.5 by DXA measurement.
Publish with BioMed Central and every
scientist can read your work free of charge
"BioMed Central will be the most significant development for
disseminating the results of biomedical research in our lifetime."
Sir Paul Nurse, Cancer Research UK
Your research papers will be:
available free of charge to the entire biomedical community
peer reviewed and published immediately upon acceptance
cited in PubMed and archived on PubMed Central
yours — you keep the copyright
Submit your manuscript here:
/>BioMedcentral
Journal of Orthopaedic Surgery and Research 2006, 1:14 />Page 6 of 6
(page number not for citation purposes)
The identification of low bone mass in postmenopausal
women should be emphasized because of the severe com-
plications. Although some experts should give advice to
their patients, most physicians and patients in our country
are not aware of osteoporosis. It is only appropriately
diagnosed and treated in a very small proportion of
patients, even if they had a prior history of osteoporotic
fracture. Up to now, BMD measurement is still the golden
standard of osteoporosis diagnosis. We recommended
that physicians should identify women who are likely to
have low BMD according to much more factors than
OSTA risk index.
The limitation of this study is that not all patients meas-
ured femoral neck BMD, so the data did not compared
with OSTA index. Although BMD measurements of total
hip and femoral neck were easily influenced by body posi-
tion, they could be alternative sites for identifying oste-
oporosis, especially when false high lumbar spine BMD
were found because of vertebral fractures, hyperostosis,
aortic calcification, and so on.
5. Conclusion
A risk index of osteoporosis like OSTA has its characteris-
tic of calculating simply and quickly. But the validation of
its use in our hospital for postmenopausal women who
underwent LS BMD measurements by DXA was somewhat
disappointed. The OSTA risk index may not be a very
good method in identifying postmenopausal women at
high risk of osteoporosis, as measured by DXA, in Sichuan
province.
References
1. Melton LJ 3rd: How many women have osteoporosis now? J
Bone Miner Res 1995, 10(2):175-177.
2. Yan XD, Wang F, Huang ZH: Investigation of bone mass density
and prevalence rate of osteoporosis in healthy Han and
Zhuang people in Nanning region. Chinese Journal of Osteoporosis
2003, 9(3):268-270.
3. Lin W, Ding LP, Wu HF: Measurement of bone mineral density
by DEXA and prevalence rate of osteoporosis in 1530
Guangzhou residents. Chinese Journal of Osteoporosis 2003,
9(3):257-258.
4. Koh LK, Sedrine WB, Torralba TP: A simple tool to identify asian
women at increased risk of osteoporosis. Osteoporos Int 2001,
12(8):699-705.
5. Richy F, Gourlay M, Ross PD: Validation and comparative eval-
uation of the osteoporosis self-assessment tool (OST) in a
Caucasian population from Belgium. QJM 2004, 97(1):39-46.
6. Jacques B, Robert J: 2002 clinical practice guidelines for the
diagnosis and management of osteoporosis in Canada. .
7. Diagnositic criteria of primary osteoporosis in Chinese. Chi-
nese Journal of Osteoporosi 1999, 5(1):1-3.
8. Adler RA, Tran MT, Petkov VI: Performance of the Osteoporosis
Self-assessment Screening Tool for osteoporosis in Ameri-
can men. Mayo Clin Proc 2003, 78(6):723-727.
9. Chinese Medicine Association: Guideline for diagnosis and treat-
ment of osteoporosis (first draft). 2003.
10. Kung AW, Ho AY, Sedrine WB: Comparison of a simple clinical
risk index and quantitative bone ultrasound for identifying
women at increased risk of osteoporosis. Osteoporos Int 2003,
14(9):716-21.
11. Park HM, Sedrine WB, Reginster JY: Korean experience with the
OSTA risk index for osteoporosis: a validation study. J Clin
Densitom Fall 2003, 6(3):247-50.
12. Yang NP, Lin T, Wang CS: Correlation of osteoporosis screen-
ing by quantitative ultrasound of calcaneus and Osteoporosis
Self-Assessment Tool for Asians in Taiwanese.
J Formos Med
Assoc 2004, 103(2):130-6.
13. Wallace LS, Ballard JE, Holiday D: Evaluation of decision rules for
identifying low bone density in postmenopausal African-
American women. J Natl Med Assoc 2004, 96(3):290-296.
14. Cadarette SM, McIsaac WJ, Hawker GA: The validity of decision
rules for selecting women with primary osteoporosis for
bone mineral density testing. Osteoporos Int in press. 2004 Jan 17
15. Stephen F, Nelson B, John P: American Association of Clinical
Endocrinologists Medical Guidelines for Clinical Pratice for
the Prevention and Treatment of Postmenopausal oste-
oporosis. Osteoporosis, 2001 edition, with Selected Updates for 2003 .
Table 3: Results of OST(A) in diagnostic studies.
Investigator Publication time Race Sample size Sen. Spe.
Koh LK
(4)
2001 Asian women 860 91% 45%
Kung AW
(10)
2003 Hong Kong women 722 79–88% 54–60%
Park HM
(11)
2003 Korea women 1101 80–87% 67–72%
Yang NP
(12)
2004 Taiwan women 3456 Compared with QUS*
Wallace LS
(13)
2004 African-American women 174 83.61% 53.85%
Cadarette SM
(14)
2004 Canadian white women 190 > 90% 40%
Richy F
(5)
2004 Belgian Caucasian women 4035 85% 37%
Adler RA
(8)
2003 American white men 181 93% 66%
* QUS means Calcaneal quantitative ultrasound.