Desalination Trends and Technologies Part 8 ppt
Bạn đang xem bản rút gọn của tài liệu. Xem và tải ngay bản đầy đủ của tài liệu tại đây (1.77 MB, 25 trang )
Desalination, Trends and Technologies
164
(a) (b) (c) (d)
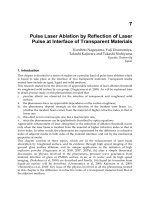
Fig. 15. Solar concentrating systems, (a) parabolic trough, (b) Fresnel lenses, (c) dish engine,
and (d) power tower.
reflectors, each of which focuses the sun's radiation on a receiver tube that absorbs the
reflected solar energy. The collectors track the sun so that the sun's radiation is continuously
focused on the receiver. Parabolic troughs are recognized as the most proven CSP
technology, and at present, experts indicate the cost to be 10 US cents/kWh or less.
Fresnel mirror reflector. This type of CSP is broadly similar to parabolic trough systems,
but instead of using trough-shaped mirrors that track the sun, flat or slightly curved mirrors
mounted on trackers on the ground are configured to reflect sunlight onto a receiver tube
fixed in space above these mirrors. A small parabolic mirror is sometimes added atop the
receiver to further focus the sunlight. As with parabolic trough systems, the mirrors change
their orientation throughout the day so that sunlight is always concentrated on the heat-
collecting tube.
Dish/Stirling engine systems and concentrating PV (CPV) systems. Solar dish systems
consist of a dish-shaped concentrator (like a satellite dish) that reflects solar radiation onto a
receiver mounted at the focal point. The receiver may be a Stirling or other type of engine
and generator (dish/engine systems) or it may be a type of PV panel that has been designed
to withstand high temperatures (CPV systems). The dish is mounted on a structure that
tracks the sun continuously throughout the day to reflect the highest percentage of sunlight
possible onto the thermal receiver. Dish systems can often achieve higher efficiencies than
parabolic trough systems, partly because of the higher level of solar concentration at the
focal point. Dish systems are sometimes said to be more suitable for stand-alone, small
power systems due to their modularity. Compared with ordinary PV panels, CPV has the
advantage that smaller areas of PV cells are needed; because PV is still relatively expensive,
this can mean a significance cost savings.
Power tower. A power tower system consists of a tower surrounded by a large array of
heliostats, which are mirrors that track the sun and reflect its rays onto the receiver at the
top of the tower. A heat-transfer fluid heated in the receiver is used to generate steam,
which, in turn, is used in a conventional turbine generator to produce electricity. Some
Renewable Energy Opportunities in Water Desalination
165
power towers use water/steam as the heat-transfer fluid. Other advanced designs are
experimenting with molten nitrate salt because of its superior heat-transfer and energy-
storage capabilities. Power towers also reportedly have higher conversion efficiencies than
parabolic trough systems. They are projected to be cheaper than trough and dish systems,
but a lack of commercial experience means that there are significant technical and financial
risks in deploying this technology now. As for cost, it is predicted that with higher
efficiencies, 7–8 cents/kWh may be possible. But this technology is still in its early days of
commercialization.
CSP systems coupled with desalination plant
The primary aim of CSP plants is to generate electricity, yet a number of configurations
enable CSP to be combined with various desalination methods. When compared with
photovoltaics or wind, CSP could provide a much more consistent power output when
combined with either energy storage or fossil-fuel backup. There are different scenarios for
using CSP technology in water desalination [28], and the most suitable options are described
below.
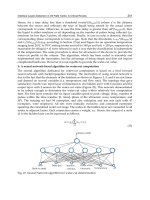
Parabolic trough coupled with MED desalination unit. Figure 16 shows a typical parabolic
trough configuration combined with a MED system, where steam generated by the trough
(superheated to around 380
o
C) is first expended in a non-condensing turbine and then used
in a conventional manner for desalination. The steam temperature for the MED plant is
around 135
o
C; therefore, there is sufficient energy in the steam to produce electricity before
it is used in the MED plant. It is important to emphasize that water production is the main
purpose of the plant—electricity is a byproduct. Although conventional combined-cycle
Fig. 16. Parabolic trough power plant with oil steam generator and MED desalination
(Source: Bechtel Power)
Desalination, Trends and Technologies
166
(CC) power plants can be configured in a similar manner for desalination, a fundamental
difference exists in the design approach for solar and for fossil-fuel-fired plants. The fuel for
the solar plant is free; therefore, the design is not focused primarily on efficiency but on
capital cost and capacity of the desalination process. In contrast, for the CC power plant,
electricity production at the highest possible efficiency is the ultimate goal [29].
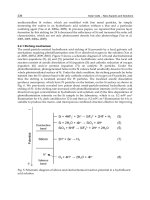
Parabolic trough coupled with RO desalination unit. In this case, as in MED, the steam
generated by the solar plant can be used through a steam turbine to produce the electric
power needed to drive the RO pumps. As an alternative for large, multi-unit RO systems,
the high-pressure seawater can be provided by a single pump driven by a steam turbine.
This arrangement is similar to the steam-turbine-driven boiler feed pumps in a fossil-fuel
power plant. Often, MED and RO are compared in terms of overall performance, and
specifically for energy consumption. Based on internal studies by Bechtel [30], one can
conclude that in specific cases, the CSP/RO combination (see Fig. 17) requires less energy
than a similar CSP/MED combination.
Fig. 17. Parabolic trough coupled with seawater RO desalination unit (
modified from Bechtel
Power)
However, an analysis presented in [31] suggests that, for several locations, CSP/MED
requires 4% to 11% less input energy than CSP/RO. Therefore, before any decision can be
made on the type of desalination technology to be used, we recommend that a detailed
analysis be conducted for each specific location, evaluating the amount of water, salinity of
the input seawater, and site conditions. It appears that CSP/MED provides slightly better
performance at sites with high salinity such as in closed gulfs, whereas CSP/RO appears to
be more suitable for low-salinity waters in the open ocean.
One additional advantage of the RO system is that the solar field might be located away
from the shoreline. The only connection between the two is the production of electricity to
drive the RO pumps and other necessary auxiliary loads.
3.1.1.3 Solar thermal applications
Although the strong potential of solar thermal energy to seawater desalination is well
recognized, the process is not yet developed at the commercial level. The main reason is that
Renewable Energy Opportunities in Water Desalination
167
the existing technology, although demonstrated as technically feasible, cannot presently
compete, on the basis of produced water cost, with conventional distillation and RO
technologies. However, it is also recognized that there is still potential to improve
desalination systems based on solar thermal energy.
Among low-capacity production systems, solar stills and solar ponds represent the best
alternative in low fresh water demands. For higher desalting capacities, one needs to choose
conventional distillation plants coupled to a solar thermal system, which is known as
indirect solar desalination [32]. Distillation methods used in indirect solar desalination
plants are MSF and MED. MSF plants, due to factors such as cost and apparent high
efficiency, displaced MED systems in the 1960s, and only small-size MED plants were built.
However, in the last decade, interest in MED has been significantly renewed and the MED
process is currently competing technically and economically with MSF [33]. Recent advances
in research of low-temperature processes have resulted in an increase of the desalting
capacity and a reduction in the energy consumption of MED plants providing long-term
operation under remarkable steady conditions [34]. Scale formation and corrosion are
minimal, leading to exceptionally high plant availabilities of 94% to 96%.
Many small systems of direct solar thermal desalination systems and pilot plants of indirect
solar thermal desalination systems have been implemented in different places around the
world [35]. Among them are the de Almería (PSA) project in 1993 and the AQUASOL
project in 2002. Study of these systems and plants will improve our understanding of the
reliability and technical feasibility of solar thermal technology application to seawater
desalination. It will also help to develop an optimized solar desalination system that could
be more competitive against conventional desalination systems. Table 2 presents several of
the implemented indirect solar thermal pilot systems.
Plant Location
Year of
Commission
Water
Type
Capacity
(L/hr)
RES Installed
Power
Unit Water
Cost (US$/m
3
)
Almeria, Spain, CIEMAT 1993 SW 3000
2.672 m
2
solar
collector area
3.6-4.35
Hazeg, Sfax, Tunisia 1988 BW 40-50
80 m
2
solar
collector area
25.3
Pozo Izquierdo, Gran
Canaria, SODESA
Project
2000 SW 25
50 m
2
solar
collector area
-
Sultanate of Oman,
MEDRC Project
2002 SW 42
5.34 m
2
solar
collector area
-
AQUASOL Project 2002 SW 3000
14 cells of
parabolic
concentrator
-
SW: seawater, BW: brackish water
Table 2. Solar thermal distillation plants
On a commercial basis, CSP technology will take many years until it becomes economic and
sufficiently mature for use in power generation and desalination.
Desalination, Trends and Technologies
168
3.2 Solar PV desalination
General description of a PV system
A photovoltaic or solar cell converts solar radiation into direct-current (DC) electricity. It is
the basic building block of a PV (or solar electric) system. An individual PV cell is usually
quite small, typically producing about 1 or 2 watts of power. To boost the power output, the
solar cells are connected in series and parallel to form larger units called modules. Modules,
in turn, can be connected to form even larger units called arrays. Any PV system consists of
a number of PV modules, or arrays. The other system equipment includes a charge
controller, batteries, inverter, and other components needed to provide the output electric
power suitable to operate the systems coupled with the PV system. PV systems can be
classified into two general categories: flat-plate systems and concentrating systems. CPV
system have several advantages compared to flat-plate systems: CPV systems increase the
power output while reducing the size or number of cells needed; and a solar cell's efficiency
increases under concentrated light.
Figure 18 is a schematic diagram of a PV solar system that has everything needed to meet a
particular energy demand, such as powering desalination units.
Fig. 18. Schematic of a typical photovoltaic system.
Typical PV system driving RO-ED units
PV is a rapidly developing technology, with costs falling dramatically with time, and this
will lead to its broad application in all types of systems. Today, however, it is clear that
PV/RO and PV/ED will initially be most cost competitive for small-scale systems installed
in remote areas where other technologies are less competitive. RO usually uses alternating
Renewable Energy Opportunities in Water Desalination
169
current (AC) for the pumps, which means that DC/AC inverters must be used. In contrast,
ED uses direct current for the electrodes at the cell stack, and hence, it can use the energy
supply from the PV panels without major modifications. Energy storage is again a concern,
and batteries are used for PV output power to smooth or sustain system operation when
solar radiation is insufficient.
PV/RO systems applications
PV-powered reverse osmosis is considered one of the most promising forms of renewable-
energy-powered desalination, especially when it is used in remote areas. Therefore, small-
scale PV/RO has received much attention in recent years and numerous demonstration
systems have been built. Figure 19 is a schematic diagram of a PV/RO system. Two types of
PV/RO systems are available in the market: brackish-water (BWRO) and seawater (SWRO)
PV/RO systems. Different membranes are used for brackish water and much higher
recovery ratios are possible, which makes energy recovery less critical [36].
Fig. 19. Schematic of a PV/RO system.
Brackish water PV/RO systems
Brackish water has a much lower osmotic pressure than seawater; therefore, its desalination
requires much less energy and a much smaller PV array in the case of PV/RO. Also, the
lower pressures found in BWRO systems permit the use of low-cost plastic components.
Thus, the total cost of water from brackish water PV/RO is considerably less than that from
seawater, and systems are beginning to be offered commercially [37]. Table 3 presents
information on installed brackish water PV/RO systems [38–42]. Many of the early PV/RO
demonstration systems were essentially a standard RO system, which might have been
designed for diesel or mains power, but powered from batteries charged by PV. This
approach generally requires a rather large PV array for a given flow of product because of
poor efficiencies in the standard RO systems and batteries. Large PV arrays and the regular
replacement of batteries typically make the cost of water from such systems rather high.
Desalination, Trends and Technologies
170
Location
Feedwater
(ppm)
Capacity
(m
3
/day)
PV
(kWp)
Batteries
(kWh)
Energy
Consumption
(kWh/m
3
)
Water
Cost
(US$/m
3
)
Year
Sadous, Riyadh,
SA
5,800 15 10.08 264 1994
Magan, Isreal 4,000 3
3.5+0.6
wind
36 11.6 1997
Elhamarawien,
Egypt
3,500 53
19.8+0.64
control
208 0.89 1986
Heelafar Rahab
Oman
1,000 5 3.25 9.6 6.25 1995
White Cliffs,
Australia
3,500 0.5 0.34 none 2-8
Solar flow,
Australia
5,000 0.4 0.12 none 1.86 10–12
Hassi-Kheba,
Algeria
3,200 0.95 2.59 10
INETI, Lisbon,
Portugal
5,000 0.1–0.5 0.05–0.15 none 2000
Conception del
Oro, Mexico
3,000 0.71 2.5 none 6.9 1982
Thar desert, India 5,000 1 0.45
1 kWh/kg
salt
1986
Perth, Australia BW 0.4–0.7 1.2 4-5.8 1989
Gillen Bore,
Australia
1,600 1.2 4.16 none 1996
Wano Road,
Australia
BW 6
Kasir Ghilen,
Tunis
5,700 50 7.25 2006
Coite-Pedreias,
Brazil
BW 0.25 1.1 9.6 3–4.7 14.9
Mesquite, Nevada 3,500 1.5 0.4 1.38 3.6 2003
N. Jawa,
Indonesia
BW 12 25.5
Univ. of Almeria,
Spain
BW 2.5 23.5
Table 3. Brackish water RO plants driven by PV power
Seawater PV/RO application systems
The osmotic pressure of seawater is much higher than that of brackish water; therefore, its
desalination requires much more energy, and, unavoidably, a somewhat larger PV array.
Also, the higher pressures found in seawater RO systems require mechanically stronger
components. Thus, the total cost of water from seawater PV/RO is likely to remain higher
than that from brackish water, and systems have not yet passed the demonstration stage.
Table 4 shows some of the installed seawater PV/RO plants [38–42].
Renewable Energy Opportunities in Water Desalination
171
Location
Feedwater
(ppm)
Capacity
(m
3
/day)
PV
(kWp)
Batteries
(kWh)
Energy
Consumption
(kWh/m
3
)
Water
Cost
(US$/m
3
)
Year
Lampedusa,
Italy
SW 40 100 880 5.5 9.5 1990
Jeddah, S.
Arabia
42,800 3.2 8 1981
St. Luice, FL 32,000 0.64 2.7 13 1995
Doha, Qatar 35,000 5.7 11.2 none 10.6
Cress,
Laviro,
Greece
36,000 < 1
4+ 0.9
wind
44 33 2001
ITC Canaries
Island, Spain
SW 3 4.8 19 5.5 13 1998
Crest, UK SW 0.5 L/h 1.54 none 4.2 2003
Vancouver,
Canada
SW 0.5–1.0 0.48
Ponta
Libeco, Italy
SW 9.8 1993
Table 4. Seawater RO plants driven by PV power.
PV/ED applications
ED uses DC for the electrodes; therefore, the PV system does not include an inverter, which
simplifies the system. Figure 20 shows a schematic diagram of a PV-powered ED system.
Currently, there are several installations of PV/ED technology worldwide. All
PV/RD applications are of a standalone type, and several interesting examples are
discussed below.
In the city of Tanote, in Rajasthan, India, a small plant was commissioned in 1986 that
features a PV system capable of providing 450 peak watts (W
p
) in 42 cell pairs. The ED unit
includes three stages, producing 1 m
3
/d water from brackish water (5000 ppm TDS). The
unit energy consumption is 1 kWh/kg of salt removed [43]. A second project is a small
experimental unit in Spencer Valley, New Mexico (USA), where two separate PV arrays are
used: two tracking flat-plate arrays (1000 W
p
power, 120 V) with DC/AC inverters for
pumps, plus three fixed arrays (2.3 kW
p
, 50 V) for ED supply. The ED design calls for 2.8
m
3
/d product water from a feed of about 1000 ppm TDS. This particular feed water contains
uranium and radon, apart from alpha particles. Hence, an ion-exchange process is required
prior to ED. Unit consumption is 0.82 kWh/m
3
and the reported cost is 16 US$/m
3
[44-45].
A third project is an unusual application in Japan, where PV technology is used to drive an
ED plant fed with seawater, instead of the usual brackish water of an ED system [46]. The
solar field consists of 390 PV panels with a peak power of 25 kW
p
, which can drive a 10
m
3
/d ED unit. The system, located on Oshima Island (Nagasaki), has been operating since
1986. Product-water quality is reported to be below 400 ppm TDS, and the ED stack is
provided with 250 cell pairs.
Desalination, Trends and Technologies
172
Fig. 20. Shows a schematic diagram of a PV-powered ED system.
3.3 Desalination systems driven by wind
Wind turbines can be used to supply electricity or mechanical power to desalination plants.
Like PV, wind turbines represent a mature, commercially available technology for power
production. Wind turbines are a good option for water desalination especially in coastal
areas presenting a high availability of wind energy resources. Many different types of wind
turbines have been developed. A distinction can be made between turbines driven mainly
by drag forces versus those driven mainly by lift forces. As shown in Fig. 21, a distinction
can also be made between turbines with axes of rotation parallel to the wind direction
(horizontal) and with axes perpendicular to the wind direction (vertical). The efficiency of
wind turbines driven primarily by drag forces is low compared with the lift-force-driven
type. Therefore, all modern wind turbines are driven by lift forces. The most common types
are the horizontal-axis wind turbine (HAWT) and the vertical-axis wind turbine (VAWT).
Wind-driven desalination has particular features due to the inherent discontinuous
availability of wind power. For standalone systems, the desalination unit has to be able to
adapt to the energy available; otherwise, energy storage or a backup system is required.
Wind energy is used to drive RO, ED, and VC desalination units. A hybrid system of
wind/PV is usually used in remote areas. Few applications have been implemented using
wind energy to drive a mechanical vapor compression (MVC) unit. A pilot plant was
installed in 1991 at Borkum, an island in Germany, where a wind turbine with a nominal
power of 45 kW was coupled to a 48 m
3
/day MVC evaporator. A 36-kW compressor was
Renewable Energy Opportunities in Water Desalination
173
Fig. 21. Presents the horizontal and vertical wind turbine configurations.
required. The experience was followed in 1995 by another larger plant at the island of Ru¨
gen. Additionally, a 50 m
3
/day wind MVC plant was installed in 1999 by the Instituto
Tecnologico de Canarias (ITC) in Gran Canaria, Spain, within the Sea Desalination
Autonomous Wind Energy System (SDAWES) project [47]. The wind farm is composed of
two 230-kW wind turbines, a 1500-rpm flywheel coupled to a 100-kVA synchronous
machine, an isolation transformer located in a specific building, and a 7.5- kW
uninterruptible power supply located in the control dome. One of the innovations of the
SDAWES project, which differentiates it from other projects, is that the wind generation
system behaves like a mini power station capable of generating a grid similar to
conventional ones without the need to use diesel sets or batteries to store the energy
generated.
Regarding wind energy and RO combinations, a number of units have been designed and
tested. As early as 1982, a small system was set at Ile du Planier, France [48], which as a 4-
kW turbine coupled to a 0.5-m
3
/h RO desalination unit. The system was designed to operate
via either a direct coupling or batteries. Another case where wind energy and RO were
combined is that of the Island of Drenec, France, in 1990 [48]. The wind turbine, rated at 10
kW, was used to drive a seawater RO unit. A very interesting experience was gained at a
test facility in Lastours, France, where a 5-kW wind turbine provides energy to a number of
batteries (1500 Ah, 24 V) and via an inverter to an RO unit with a nominal power of 1.8 kW.
A 500 L/h seawater RO unit driven by a 2.5-kW wind generator (W/G) without batteries
was developed and tested by the Centre for Renewable Energy Systems Technology
(CREST) UK. The system operates at variable flow, enabling it to make efficient use of the
naturally varying wind resource, without need of batteries [49].
Desalination, Trends and Technologies
174
Excellent work on wind/RO systems has been done by ITC within several projects such as
AERODESA, SDAWES, and AEROGEDESA[50]. Additionally, a wind/RO system without
energy storage was developed and tested within the JOULE Program (OPRODES-JORCT98-
0274) in 2001 by the University of Las Palmas. The RO unit has a capacity of 43–113 m
3
/h,
and the W/G has a nominal power of 30 kW [51]. In addition, an excellent job on combining
wind/RO was done by ENERCON, the German wind turbine manufacturer. ENERCON
provides modular and energy-efficient RO desalination systems driven by wind turbines
(grid-connected or standalone systems) for brackish and seawater desalination. Market-
available desalination units from ENERCON range from 175 to 1400 m
3
/day for seawater
desalination and 350 to 2800 m
3
/day for brackish water desalination. These units in
combination with other system components, such as synchronous machines, flywheels,
batteries, and diesel generators, supply and store energy and water precisely according to
demand [52]. Table 5 shows several existing wind/RO installations.
Plant Location
Year of
Commission
Water
Type
Capacity
(L/h)
W/T
Nominal
Power (kW)
Unit Water
Cost ($/m
3
)
Ile de Planier, France 1983 SW/BW 500 4 -
Fuerteventura island,
PUNTA JANDIA project
1995 SW 2,333 225 -
Therasia island, Greece 1997 SW 200 15 -
Pozo Izquierdo, Gran Canaria,
AEROGEDESA project
2003 SW 800 15 4.4 -7.3
CREST, UK 2004 SW 500 2.5 2.6
Table 5. Installed wind/RO plants
3.4 Geothermal energy
The earth’s temperature varies widely, and geothermal energy is usable for a wide range of
temperatures from room temperature to well over 300°F. The main advantage of geothermal
energy is that thermal storage is unnecessary in such systems. Geothermal reservoirs are
generally classified as being either low temperature (<150°C) or high temperature (>150°C).
Generally speaking, high-temperature reservoirs are suitable for, and sought out for,
commercial production of electricity. Energy from the earth is usually extracted with ground
heat exchangers, made of a material that is extraordinarily durable but allows heat to pass
through efficiently. The direct use of moderate and high temperatures is for thermal
desalination technologies. A high-pressure geothermal source allows the direct use of shaft
power on mechanically driven desalination, whereas high-temperature geothermal fluids
can be used to generate electricity to drive RO or ED plants.
The first geothermal energy-powered desalination plants were installed in the United States
in the 1970s [53–57], testing various potential options for the desalination technology,
including MSF and ED. An analysis [58] discussing a technical and economic analysis of an
MED plant, with a capacity of 80 m
3
/d, powered by a low-temperature geothermal source
and installed in Kimolos, Greece showed that high temperature geothermal desalination
could be a viable option. A study [59] presented results from an experimental investigation
of two polypropylene-made HD plants powered by geothermal energy [60]. Recently, a
study [61] discussed the performances of a hybrid system consisting of a solar still in which
Renewable Energy Opportunities in Water Desalination
175
the feed water is brackish underground geothermal water. Finally, the availability and/or
suitability of geothermal energy and other renewable energy resources for desalination is
given by [62].
4. General economic assessment of desalination
The cost of desalinated water is usually expressed in US$ per cubic meter of product water.
This figure is obtained by dividing the sum of all expenses (capital cost, plus operation and
maintenance cost) related to the production of desalinated water by the total amount of
desalted water produced. Capital cost includes both direct and indirect costs. Direct capital
costs are the land cost, building cost, and all equipment costs. Indirect capital costs include
freight, insurance, construction overhead, engineering and legal fees, and contingencies
costs. Costs of energy, labor, chemicals, consumables, spare parts, and major replacements
or refurbishment required over the lifetime of the plant are included in operational and
maintenance costs.
The economies of desalination and the decision as to which approach to select depend on
situation-specific parameters. Because energy is the main driver in the cost of operation,
economic feasibility of either approach to desalination is highly correlated to the location-
specific cost and availability of energy [63]. Table 6 presents a comparative illustration of
cost distribution and energy share of total cost for the two widely used conventional
systems (RO and MSF) installed in Libya with a capacity of 10 mgbd each.
Type of
Plant
Capital
Cost
(%)
Energy
Cost
(%)
Maintenance
and Repair
Cost (%)
Membrane
Replacement
(%)
Labor
(%)
Chemicals
(%)
RO 31 26 14 13 9 7
MSF 42 41 8 0 7 2
Table 6. Percentage of cost for conventional systems
In the representative example above, the capital cost is considerably higher for the thermal
process than for the membrane process. This reflects the prevailing situation in the
desalination industry, in which the construction cost of thermal desalination plants exceeds
that of membrane plants. All other main costs related to operating a desalination plant are
usually higher for a membrane processes due to the greater complexity of maintenance tasks
and operation. Accordingly, cost of chemicals is 7% vs. 2%, maintenance and parts are 14%
vs. 7%, and labor cost is 9% vs. 7% of total operating cost for the representative RO and MSF
plants, respectively. Membrane replacement, which is listed separately, adds further to the
maintenance cost for RO, whereas this cost is obviously absent for thermal processes.
Strong inter-firm competition and advances in technology have resulted in average annual
unit cost reductions of close to 6% for MSF processes since 1970. In addition, many MSF
desalination plants, which are mostly located in the Middle East, have increasingly taken
advantage of economies of scale. RO, which has been used commercially only since 1982,
has seen even steeper cost declines since inception. Membrane costs have fallen by 86%
between 1990 and 2002 [64]. Steeply declining maintenance cost, in combination with
relatively low capital cost, has contributed greatly to the rapidly growing success of
membrane technology.
Desalination, Trends and Technologies
176
The unit product cost of fresh water differs when it is produced from different plant
capacities. Table 7 shows the unit product cost of water produced from plants of different
type and capacity. Product unit prices generally take into account all relevant costs
originating from direct capital, indirect capital, and annual operating costs.
Type of system and capacity (mgbd)
Product Cost
($/gallon)
MVC (0.03) 1.894
MVC (0.13) 1.220
MVC (1.06) 0.939
MVC (1.20) 0.920
MVC (5.28) 0.174
MSF (7.13-Dual purpose) 0.292
MSF (7.13-Single purpose) 0.621
MSF (Gas turbine, Waste heat boiler) 0.545
MSF (9.99) 0.473
MED (6-Dual purpose) 0.330
MED (6-Single purpose) 0.739
MED (9.99) 0.409
MED (Gas turbine, Waste boiler) 0.496
RO (5.28, Single stage) 0.242
RO (5.28, Two stage) 0.288
RO (0.03) 0.898
RO (1.06) 0.750
RO (1.20) 0.489
RO (9.99) 0.413
RO (30) 0.208
MED- TVC (Single purpose) 0.866
MED- TVC (Dual purpose) 0.496
Table 7. Fresh water cost for different types and capacities
Economic analysis for renewable energy desalination processes
The economics of operating solar desalting units tend to be related to the cost of producing
energy with these alternative energy devices. Presently, most of the renewable energy
systems have mature technology; but despite the free cost of renewable energy resources,
their collecting systems tend to be expensive, although they may be expected to decline as
further development of these devices reduces their capital cost. The economic aspects of
each renewable energy desalination system will be discussed below.
We first look at the cost distribution of both conventional and renewable energy-operated
desalination units. Table 8 shows the comparison of cost distribution for conventional
systems (RO and MSF) and plants driven by a renewable energy system [65]. For the
renewable systems, the investment costs are the highest and the energy costs are the lowest.
Renewable Energy Opportunities in Water Desalination
177
Type of Process Capital Costs (%)
Operational Costs
(%)
Energy Costs
(%)
Conventional (RO) 22 – 27 14 – 15 59 – 63
Conventional (MSF) 25 – 30 38 – 40 33 – 35
Renewable 30 – 90 10 – 30 0 -10
Table 8. Distribution of costs for conventional (RO and MF) desalination systems and for
systems driven by renewable energy technology
One study has considered the techno-economic viability of solar desalination using PV and
low-grade thermal energy using solar ponds [66]. Table 9 presents a comparison of the cost
of water produced by a conventional cogeneration system (producing electricity and water)
and that of solar-powered MSF and RO systems. The figures in the table are based on a
plant capacity of 1 m
3
/d and an annual utilization factors of 90% for conventional systems
and 75% for solar-based systems.
MSF
Parameter
Conventional
System
Partial Solar-
based System
Complete Solar-
based System
Annual Water Production (m
3
) 328 274 274
Cost of Water Production ($/m
3
) 1.75 1.79 2.84
RO
Conventional
System
Partial Solar-
based System
Complete Solar-
based System
Annual Water Production (m
3
) 328 274 274
Cost of Water Production ($/m
3
) 1.30 5.70 12.05
Table 9. Cost of desalinated water using conventional and solar-powered MSF and RO
systems
The results in Table 9 show that the cost of water produced by a conventional RO system is
less than that by a conventional MSF system. However, for solar-based systems, the partial
solar-based MSF system gives the lowest cost of water production.
Solar thermal desalination economics
Solar still economic
Because of limited capacity of solar units, the capital costs and operating costs are not as
well established as for the other processes. For solar stills, the cost of water production is
high due to the low productivity of these stills. However, this type of desalination is only
used in remote areas where there is no access to conventional energy resources. Table 10
compares the water costs for simple and multi-effect solar stills [66]. As shown, the water
costs for multi-effect solar stills are much lower than for simple stills.
Solar-assisted desalination systems
One study [67] showed that solar-pond desalting systems have considerable potential to be
cost effective if favorable site conditions exist. Table 11 presents the cost comparison of
solar-pond-powered desalination with conventional seawater RO (SWRO) for two
production capacities (20,000 and 200,000 m
3
/d). As seen from the table, the unit water-cost
difference is relatively small. However, investment costs and specific investment cost for
Desalination, Trends and Technologies
178
solar-powered systems are still higher compared with the SWRO systems, where the
difference decreases as the capacity increases.
Type
Capacity /
Productivity
Water Cost
($/m
3
)
Description Reference
Solar Stills 4 L/m
2
d 23.80
20 yrs lifetime, collector cost:
$315/m
2
, 5% interest rate
66
Multi-effect Stills 12 L/m
2
d 9.95
Storage module, 20 year
lifetime, 5% interest rate
66
Multi-effect Stills 20 L/m
2
d < 9.0*
Non-corroding polymer
absorbers, storage, 24-hour
operation
66
*Predicted
Table 10. Water costs for simple and multi-effect solar stills
SWRO SP-MED SP-HYB
Capacity (m
3
/d)
System Type
20,000 200,000 20,000 200,000 20,000 200,000
Investment (mil/$) 20 160 48 380 32 250
Specific Investment
($/m
3
d)
1000 800 2400 1900 1600 1250
Unit Water Cost ($/m
3
) 0.77 0.66 0.89 0.71 0.79 0.65
Table 11. Cost comparison of solar pond-powered desalination with conventional SWRO
Using CSP systems with desalination is still in its experimental stage until now but from the
several pilot plant projects results, it could be concluded that we need time for this
technology to be economically competitive with other desalination technologies.
PV/RO system economics
Cost figures for desalination have always been difficult to obtain. The total cost of water
produced includes the investment cost, as well as the operating and maintenance cost. In a
comparison between seawater and brackish water desalination, the cost of the first is about
3–5 times the cost of the second for the same plant size. As a general rule, a seawater RO
unit has low capital cost and significant maintenance cost due to the high cost of the
membrane replacement. The cost of the energy used to drive the plant is also significant.
The major energy requirement for RO desalination is for pressurizing the feed water. Energy
requirements for SWRO have been reduced to about 5 kWh/m
3
for large units with energy
recovery systems, whereas for small units (without energy recovery system), this may
exceed 15 kWh/m
3
. For brackish water desalination, the energy requirement is between 1
and 3 kWh/m
3
. The product water quality ranges between 350 and 500 ppm for both
seawater and brackish water units. According to published reports [38–42], the water cost of
a PV seawater RO unit ranges from 7.98 to 29 US$/m
3
for product-water capacity of 120–12
m
3
/day, respectively. Also for a PV/RO brackish-water desalination unit, a water cost of
about 7.25 US$/m
3
for a product-water capacity of 250 m
3
/day has been reported in the
literature [38–42].
Renewable Energy Opportunities in Water Desalination
179
PV/ED economics
In general, electrodialysis is an economically attractive process for low-salinity water. EDR
has greater capital costs than ED because it requires extra equipment (e.g., timing
controllers, automatic valves), but it reduces or almost eliminates the need for chemical
pretreatment. In ED applications, the electricity from a PV system can power to electro-
mechanical devices such as pumps or to DC devices such as electrodes. The total energy
consumption of an ED system under ambient temperature conditions and assuming
product water of 500 ppm TDS would be about 1.5 and 4 kWh/m
3
for a feed water of 1500–
3500 ppm TDS, respectively. The water cost of a PV-operated ED unit ranges from 16 to 5.8
US$/m
3
[45–46]. The main advantage of PV desalination systems is the ability to develop
small-scale desalination plants.
Wind-Renewable Energy economics
Wind energy could be used to drive RO, ED, and VC desalination units. A hybrid system of
wind/PV was also used in remote areas. Few applications have been implemented using
wind energy to drive a mechanical vapor compression unit, and a number of wind/RO
combinations systems have been designed and tested. ENERCON provides modular and
energy-efficient RO desalination systems driven by wind turbines for brackish and seawater
desalination. The estimated water cost produced from the installed wind/RO unit ranges
from 7.2 to 2.6 US$/m
3
of fresh water. According to a published report [68], the water cost of
a wind brackish water RO unit (capacity of 250 m
3
/day) is of the order of 2 Euro/m
3
,
whereas for the same feed-water salinity and size, the water cost of a wind/electrodialysis
unit is around 1.5 Euro/m
3
. For standalone wind-powered MVC units with a capacity range
between 5 and12.5 m
3
/h, the mean water cost varies between 3.07 and 3.73 Euro/m
3
[69].
5. Conclusion
Desalination technology has been in continuous development during the previous decades,
making it possible to include salt water as part of the production of fresh water. However,
the current cost of desalinated water is still high because of its extensive use of energy. The
selection of a desalination process should be based on a careful study of the specific site
conditions and applications. Local circumstances may play a significant role in determining
the most appropriate process for an area. The use of renewable energy for desalination is a
technically mature option toward emerging energy and water problems. And technological
advances will continue to improve system efficiencies and reduce capital costs, making
these systems competitive when used in desalination systems. Currently, the cost of fresh-
water production from renewable-energy-powered desalinated systems is less than other
alternatives in remote areas where access to electricity is not available. Numerous studies
on a suitable technical match between renewable energy and desalination process have been
reported in the literature. These studies conclude that renewable-energy-powered systems
could compete with conventional systems under certain circumstances. Very few solar
desalination plants have been reported in the literature. Several studies on a suitable
technical match between renewable energy resources and desalination processes propose
that solar thermal/MED, solar thermal/MSF, solar PV/RO, solar PV/ED, wind/RO, and
geothermal/MED technologies are very promising options. The economic competitiveness
of solar thermal/MED and solar thermal/MSF has been shown in a number of theoretical
studies. However, this has not been verified experimentally, and therefore, cannot be used
Desalination, Trends and Technologies
180
as a guide for decision-making regarding technology selection for a particular application.
At present, small-scale PV and wind desalination systems appear to be especially suitable in
remote regions without access to the electric grid and where water scarcity is a major
problem. The large scale of these systems is hindered by non-technical barriers.
6. References
[1] Economic and Social Commission for Western Asia. Energy options for water
desalination in selected ESCWA member countries. New York: United Nations;
2001.
[2] CORDIS Database; 2006.
[3] UNEP (United Nations Environment Program) (2003) Key Facts about Water
www.unep.org/wed/2003/keyfacts <accessed January 15, 2006>.
[4]
[5] World Health Organization. Guidelines for drinking water quality, Vol. I, Geneva, 1984.
[6] ARMINES. Technical and economic analysis of the potential for water desalination in the
Mediterranean region, RENA-CT94–0063, France; 1996.
[7] O.K.Buros. The desalinating ABC, McGrawhill, New York, 1990.
[8] O.A Hamed (2005). Overview of hybrid desalination systems – current status and future
prospects. Desalination 186, 207-214.
[9] K. Quteishat and M. Abu-Arabi. Promotion of solar desalination in the MENA region.
Middle East Desalination Centre, Muscat, Oman–
docs/Abu-Arabi.pdf [accessed March 28, 2006].
[10] A. Maurel. Desalination by reverse osmosis using renewable energies
(Solarwind):cadarache central experiment. In: Proceedings of the New Technologies for
the Use of Renewable Energy Sources in Water Desalination Conference, Session II,
Athens, Greece; 1991. p. 17–26.
[11] B.S. Richards and I.A. Schafer (2002). Design considerations for a solar-powered
desalination system for remote communities in Australia. Desalination 144: 193–9.
[12] S.A. Avlonitis, K. Kouroumbas, and N. Vlachakis (2003). Energy consumption and
membrane replacement cost for seawater RO desalination plants. Desalination
157:151–8.
[13] S. Avlonitis, G.P. Sakellaropoulos, W.T. Hanbury (1995). Optimal design of spiral
wound modules: an analytical method. Trans I ChemE 73(Part A):575–80.
[14] European Commission. Desalination guide using renewable energies, Thermie
Programme, Directorate General for Energy (DG XVII), ISBN 960-90557-5-3; 1998.
[15] O. Kuroda, S. Takahashi, S. Kubota, K. Kikuchi, Y. Eguchi, Y. Ikenaga, et al. (1987). An
electrodialysis seawater desalination system powered by photovoltaic cells.
Desalination 167:161–9.
[16] M. Lichtwardt and H. Remmers. Water treatment using solar powered electrodialysis
reversal. In: Proceedings of the Mediterranean Conference on Renewable Energy Sources
for Water.
[17] I. Al-Hayek and O.O. Badran (2004). The effect of using different designs of solar stills
on water distillation. Desalination 169:121–7.
Renewable Energy Opportunities in Water Desalination
181
[18] Economic and Social Commission for Western Asia. ESCWA water development report
3. Role of desalination in addressing water scarcity, New York: United Nations;
2009.
[19] M. Sodha, A. Kumar, G. Tiwari, and R. Tyagi, Simple multiple wick solar still: analysis
and performance, Solar Energy 26 (1981) 127–131.
[20] J.L. Fernandez and N. Chargoy (1990). Multi-stage, indirectly heated solar still, Solar
energy 44(4), pp. 215-223.
[21] H. Al-Hinai, M.S. Al-Nassri, and B.A. Jubran (2202). Effect of climatic, design and
operational parameters on the yield of a simple solar still. Energy Conv. Management
43, 1639–1650.
[22] E. Mathioulakis, V. Belessiotis, and E. Delyannis (2007). Desalination by using
alternative energy: Review and state-of-the-art. Desalination 203, 346–365.
[23] A. Bohner, Solar desalination with a higher efficiency multi effect process offers new
facilities (1989). Desalination 73, 197–203.
[24] E. Mathioulakis, V. Belessiotis, and E. Delyannis (2007). Desalination by using
alternative energy: Review and state of the art. Desalination 203, 346-365.
[25] F.A. Banat, Membrane distillation for desalination and removal of volatile organic
compounds from water, Ph.D. thesis , Mcgill University, 1994.
[26] H.M. Qiblawey and F. Banat (2008). Solar thermal desalination technologies,
Desalination 220, 633–644.
[27] H. Price, et al., (2003). Assessment of Parabolic Trough and Power Tower Solar
Technology Cost and Performance Forecasts, Sargent & Lundy LLC Consulting
Group, National Renewable Energy Laboratory, Golden, Colorado, 2003
[28] F. Trieb and H. Müller-Steinhagen (2007). Concentrating Solar Power for Seawater
Desalination in the Middle East and North Africa, Submitted to Desalination.
[29] L. García-Rodríguez (2003). Renewable energy applications in desalination: state of the
art, Solar Energy 75, 381-393.
[30] J. Zachary and C. Layman, Bechtel Power Corp. Adding Desalination to Solar Hybrid
and Fossil Plants, Electric Power Journal, May 2010.
[31] M. Al-Shammiri and M. Safar (1999). Multi-effect distillation plants: state of the art.
Desalination 126:45-59.
[32] K. Quteishat and M. Abu-Arabi, (2006): Promotion of solar desalination in the MENA
region. Middle East Desalination Centre, Muscat, Oman –
(accessed 28 March 2006).
[33] Collares et al. (2003). A new low concentration CPC type collector with convection
controlled by a honeycomb TIM Material: A compromise with stagnation
temperature control and survival of cheap fabrication materials. In Proceedings of the
ISES Solar World Congress 2003, 14-19 June, Göteborg, Sweden.
[34] Water corporation, A strategic review of desalination possibilities for western Australia,
September 2000.
[35] E. Zarza and M. Blanco. Advanced M.E.D. solar desalination plant: Seven years of
experience at the Plataforma Solar de Almería. In: Proceedings of the Mediterranean
Conference on Renewable Energy Sources for Water Production, Santorini, Greece, 1996.
Desalination, Trends and Technologies
182
[36] M. Thomson, J. Gwillim, A. Rowbottom, I. Draisey, and M. Miranda. Batteryless
photovoltaic reverse osmosis desalination system, S/P2/00305/REP, ETSU, DT1,
UK.
[37] G. Fiorenza, V. Sharma, and G. Braccio (2003). Technoeconomic evaluation of a solar
powered water desalination plant. Energy Convers Manage 44:2217–40.
[38] S. Kehal. Reverse osmosis unit of 0.85 m
3
/h capacity driven by photovoltaic generator
in South Algeria. In: Proceedings of the New Technologies for the Use of Renewable
Energy Sources in Water Desalination Conference, Session II, Athens, Greece; 1991. p. 8–
16.
[39] E. Tzen and K. Perrakis. Prefeasibility study for small Aegean islands, RENA-CT94–
0063, CRES, Greece; 1996.
[40] M. Thomson and D. Infield (2002). A photovoltaic powered seawater reverse-osmosis
system without batteries. Desalination 153:1–8.
[41] A. Hafez and S. El-Manharawy (2003). Economics of seawater RO desalination in the
Red Sea region, Egypt. Part 1: a case study. Desalination 153:335–47.
[42] K. Perrakis, E. Tzen, and P. Baltas. PV-RO desalination plant in Morocco, JOR3-CT95-
0066, CRES, Greece.
[43] P. Finken, K. Korupp. Water desalination plants powered by wind generators and
photovoltaic systems. In: Proceedings of the New Technologies for the Use of Renewable
Energy Sources in Water Desalination Conference, Session II, Athens, Greece; 1991. p.
65–98.
[44] M.R. Adiga, S.K. Adhikary, P.K. Narayanan, W.P. Harkare, S.D. Gomkale, and K.P.
Govindan (1987). Performance analysis of photovoltaic electrodialysis desalination
plant at Tanote in the Thar desert. Desalination 67:59–66.
[45] O. Kuroda, S. Takahashi, S. Kubota, K. Kikuchi, Y. Eguchi, Y. Ikenaga, et al. (1987). An
electrodialysis seawater desalination system powered by photovoltaic cells.
Desalination 67:161–9.
[46] M. Lichtwardt and H. Remmers. Water treatment using solar powered electrodialysis
reversal. In: Proceedings of the Mediterranean Conference on Renewable Energy Sources
for Water Production; 1996.
[47] J.A. Carta, J. Gonzalez, and V. Subiela (2004). The SDAWES project: an ambitious R&D
prototype for wind—powered desalination. Desalination 161: 33–48.
[48] A. Maurel. Desalination by RO using RE (solar & wind): Cadarache Center Experience.
Proceedings of the New Technologies for the Use of RE Sources in Water Desalination,
Greece, 26–28 Sept. 1991, pp. 17–26.
[49] A. Peral, G.A. Contreras, and T. Navarro. IDM—Project: Results of one year’s operation.
Proceedings of the New Technologies for the Use of RE Sources in Water Desalination,
Greece, 26–28 Sept. 1991, pp. 56–80.
[50] M. Miranda and D. Infield (2002). A wind powered seawater RO system without
batteries. Desalination 153:9–16.
[51] De La Nuez Pestana I, Francisco Javier G, Celso Argudo E, Antonio Gomez G. (2004).
Optimization of RO desalination systems powered by RE: Part I. Wind energy.
Desalination 160:293–9.
[52] ENERCON. Desalination units. , accessed 2006.
Renewable Energy Opportunities in Water Desalination
183
[53] E. Barbier (2002). Geothermal energy technology and current status: an overview. Renew
Sustain Energy Rev 6:3–65.
[54] E. Barbier (1997). Nature and technology of geothermal energy. Renew Sustain Energy
Rev 1(1–2):1–69.
[55] L. Awerbuch, T.E. Lindemuth, S.C. May, and A.N. Rogers (1976). Geothermal energy
recovery process, Desalination 19, 325–336.
[56] W.J. Boegli, S.H. Suemoto, and K.M. Trompeter (1977). Geothermal desalting at the East
Mesa test site. (Experimental results of vertical tube evaporator, MSF and high-
temperature ED. Data about fouling, heat transfer coefficients, scaling.) Desalination
22, 77–90.
[57] A. Ophir (1982). Desalination plant using low grade geothermal heat, Desalination 40,
125–132.
[58] K. Karytsas, V. Alexandrou, and I. Boukis, The Kimolos Geothermal Desalination
Project, Proc. International Workshop on Possibilities of Geothermal Energy Development
in the Aegean Islands Region, Milos Island, Greece, 2002, pp. 206–219.
[59] K. Bourouni, R. Martin, and L. Tadrist (1997). Experimental investigation of evaporation
performances of a desalination prototype using the aero-evapocondensation
process, Desalination 114, 111–128.
[60] B. Bouchekima (2003). Renewable energy for desalination: a solar desalination plant for
domestic water needs in arid areas of South Algeria, Desalination 153, 65–69.
[61] V. Belessiotis and E. Delyannis, Renewable energy resources, in Encyclopedia of
Life Support Systems (EOLSS), Desalination: Desalination with Renewable
Energies, available on line:
http:/ /www.desware.net/DeswareLogin/LoginForm.Aspx
[62] V. Belessiotis and E. Delyannis, Renewable energy resources, in Encyclopedia of Life
Support Systems (EOLSS), Desalination: Desalination with Renewable Energies,
available on line: http:/ /www.desware.net/DeswareLogin/LoginForm.Aspx
[63] D. Zejli, O-K Bouhelal, R. Benchrifa, and A. Bennouna (2002). Applications of solar and
wind energy sources to sea-water desalination—economical aspects. International
Conference on Nuclear Desalination: Challenges and Options. October 2002,
Marrakech, Morocco.
[64] Al-Hallaj and J.R. Selman (2002). A comprehensive study of solar desalination with a
humidification – dehumidification cycle. The Middle East Desalination Research Center
– Muscat, Sultanate of Oman.
[65] R.K. Suri, A.M.R. Al-Marafie, A.A Al-Homoud, and G.P. Maheshwari (1989). Cost-
effectiveness of solar water production. Desalination 71, 165-175.
[66] Templitz-Sembitsky. The use of renewable energy for sea-water desalination; a brief
assessment technical information, W16e, Gate information services, Germany, 2000.
[67] P. Glueckstern (1995). Potential uses solar energy for seawater desalination, Desalination
101, 11-20.
[68] P. Finken and K. Korupp (1991). Water desalination plants powered by wind generators
and photovoltaic systems, Proceedings of the New Technologies for the Use of Renewable
Energy Sources in Water Desalination Conference, Session II, pp. 65-98, Athens, Greece.
Desalination, Trends and Technologies
184
[69] W. Damm, P. Gaiser, and D. Kowalczyk, and U. Plantikow (1996) Wind powered MVC
desalination plant – operating results and economical aspects, Proc. of the
Mediterranean Conference on Renewable Energy Sources for Water Production, pp. 143-
146, ISBN 960-905777 0-2, Santorini, Greece.
9
New Trend in the Development of
ME-TVC Desalination System
Anwar Bin Amer
Kuwait Foundation for the Advancement of Sciences (KFAS),
Research Directorate,
Water Resources Program
Kuwait
1. Introduction
Several low temperature Multi-Effect Thermal Vapor Compression (ME-TVC) desalination
units have been installed recently in most of the GCC countries. The total installed capacity
has increased up to 500 million imperial gallons per day (MIGD) between 2000 and 2010 as
shown in (Table 1). The majority of these units were commissioned in the UAE by SIDEM
Company. The unit size capacities of these units were increased exponentially from 1 to 8.5
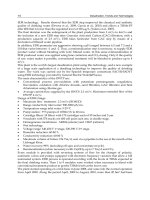
(MIGD) between 1991 and 2008 as shown in Fig.1. The new trend of combining ME-TVC
with conventional multi-effect units led to this tremendous increase, more than eight times,
during a very short period. Moreover, the unit size capacity of this technology is currently
available with 10 MIGD, and it is expected to increase up to 15 MIGD in the near future.
Hence, this system has become highly attractive and competitive against Multi Stage Flash
(MSF) desalination system and it is predicted to get a considerable increase in the
desalination market in future, particularly, in the GCC countries because it includes the
following attractive features:
- Operates at lower top brine temperature around 60 to 70
o
C compared to 90 to 120
o
C in
the MSF, and this reduces the scale formation, corrosion problems, anti-scalant
chemicals and maintenance shutdown time (Darwish & Alsairafi, 2004).
- Requires less pumping energy than MSF (1.5~2 kW/m
3
compared to 4~5 kW/m
3
),
because there is no need to re-circulate large quantities of brine as in MSF system.
- Produces higher gain output ratios (GOR) up to 16 with less number of effects
compared to 8 GOR and 21 stages in the MSF (Wade, 2001).
- Uses falling film horizontal tube evaporator (HTE), which gives high heat transfer
coefficient and reduces the needed heat transfer area and consequently the capital cost
of the desalination plant (Reddy & Ghaffour, 2007).
- Better response to steam supply variation, so, it has more flexibility of operation than
MSF (Darwish & Alsairafi, 2004).
Table1 shows that ME-TVC technology is gaining more market shares recently in Bahrain,
Saudi Arabia and Qatar with a total installed capacity of 60 MIGD, 176 MIGD and 63 MIGD,
respectively.
Desalination, Trends and Technologies
186
Year Location Country
Unit
capacity
No. of
units
Total
capacity
GOR
1991 Jabal Dhana UAE 1 MIGD 4 4 MIGD 8
2000 Umm Al-Nar UAE 3.5 MIGD 2 7 MIGD 8
2001 Layyah UAE 5 MIGD 2 10 MIGD 8
2002 Al-Taweelah A
1
UAE 3.7 MIGD 14 52 MIGD 8
2005 Sharjah UAE 8 MIGD 2 16 MIGD 8.4
2006 Al-Hidd Bahrain 6 MIGD 10 60 MIGD 8.9
2007 Al-Jubail Saudi Arabia 6.5 MIGD 27 176 MIGD 9.8
2008 Fujairah UAE 8.5 MIGD 12 100 MIGD 10
2009 Ras Laffan Qatar 6.3 MIGD 10 63 MIGD 11.1
Table 1. Several projects of ME-TVC commissioned by SIDEM in the GCC countries.
Year
1990 1992 1994 1996 1998 2000 2002 2004 2006
Unit Capacity, MIGD
0
2
4
6
8
10
Mirfa
Trapani
Umm Al-Nar
Layyah
Al-Tawelah
Sharjah
Fig. 1. The increase of unit size capacity of ME-TVC desalination systems.
2. Literature review
Several studies have been published since the early of 1990's concerning ME-TVC
desalination system. Some of which include field studies others describe different
conceptual designs. Diverse mathematical models have been developed since then, in most
of these publications for simulation and economic evaluation purposes. A summary
New Trend in the Development of ME-TVC Desalination System
187
literature review of these studies were reported in (Al-Juwayhel et al, 1997) and (El-
Dessouky & Ettouney, 1999). On the other hand, limited studies were published handling
ME-TVC desalination system from exergy (Second Law) point of view since the middle of
last decade, but it has been carried out in several published works recently.
(Hamed et al., 1996) conducted and evaluated the performance of a ME-TVC desalination
system. An exergy analysis was also performed and compared with conventional multi
effect boiling (MEB) and mechanical vapor compression (MVC) desalination systems.
Results showed that the ME-TVC desalination system is the most exergy-efficient compared
to other systems.
(Al-Najem et al., 1997) conducted a parametric analysis using First and Second Laws of
Thermodynamics for single and multi effect thermal vapor compression system (ME-TVC).
The study revealed that the steam ejector and evaporators are the main source of exergy
destruction in the ME-TVC desalination system.
(Alasfour et al., 2005) developed mathematical models for three configurations of a ME-TVC
desalination system using energy and exergy analysis. A parametric study was also
performed to investigate the impacts of different parameters on the system performance.
Results showed that the first effect was responsible for about 50 % of the total effect exergy
destructions. The parametric study also showed that the decrease in exergy destructions is
more pronounced than the decrease in the gain output ratio at lower values of motive steam
pressure. Lowering the temperature difference across the effects, by increasing the surface
area, decreases the specific heat consumption. On the other hand, exergy losses are small at
low temperature difference and low top brine temperature.
(Choi et al., 2005) presented an exergy analysis for ME-TVC pilot plant units, which was
developed by Hyundai Heavy Industries Company. The units have different capacities of 1,
2.2, 3.5 and 4.4 MIGD. Exergy analysis showed that most of the specific exergy losses were
in thermal vapor compressor and the effects. The amount of exergy destruction represents
more than 70% of the total amount. Results also showed that the increase of entrainment
ratio to 120% will decrease the total heat transfer area by 12%.
(Wang & Lior, 2006) presented the performance analysis of a combined humidified gas
turbine (HGT) plant with ME-TVC desalination systems using Second Law of
thermodynamics. The analysis is performed to improve the understanding of the combined
steam injection gas turbine power and water desalination process and ways to improve and
optimize it. Results showed that the dual purpose systems have good synergy in fuel
utilization, in operation and design flexibility.
(Sayyaadi & Saffari, 2010) developed thermo-economic optimization model of a ME-TVC
desalination system. The model is based on energy and exergy analysis. A genetic algorithm
is used to minimize the water product cost.
This chapter describes and discusses new developments which have taken place recently in
the design, operation and material selection of ME-TVC units. A mathematical model of a
ME-TVC desalination system is also developed in this chapter, using Engineering Equation
Solver (EES) Software. This model is used to evaluate and improve the performance of
some new commercial ME-TVC units having capacities of 2.4, 3.5 and 6.5 MIGD using
energy and exergy analysis. The model results were compared against the actual data which
showed good agreement. The other aim of this chapter is to develop a mathematical
optimization model using MATLAB program. The model is used to determine the optimum
operating and design conditions of different numbers of effects to maximize the gain output
Desalination, Trends and Technologies
188
ratio of the ME-TVC unit, using two optimization approaches: (1) Smart Exhaustive Search
Method (SESM) and (2) Sequential Quadratic Programming (SQP).
3. Process description
The arrangement of combining the ME-TVC with conventional Multi-effect consists of two
separate rows of effects, each packed into one circular/rectangular vessel along with a
thermo-compressor. Both vessels are connected parallel with a third vessel in the middle,
which contains a number of effects along with the end condenser.
A schematic diagram of this arrangement is shown in Fig. 2, where two identical ME-TVC
units are combined with a single MED unit, where as the vapor produced in the last effect of
each ME-TVC unit (D
j
) is split into two streams. The first stream D
r
is entrained by a thermo-
compressor and other part (D
f
) is used as a heat source to operate low temperature multi
effect distillation unit (LT-MED).
The configuration consists of the following components (1) a number of horizontal falling
film evaporators (n effects), (2) two thermo-compressors, (3) a number of feed heaters, (4)
five main pumps (distillate, feed, condensate, cooling and brine disposal pumps) to circulate
the streams, (5) an end condenser and (6) a number of flashing boxes.
Two streams of motive steam (D
s
) are directed at relatively high motive pressure (P
s
) into
two thermo-compressors. The motive steam is supplied usually either from boiler or steam
turbine. Part of the vapor formed in the last effect (D
r
) of each ME-TVC unit, is entrained
and compressed by the thermo-compressor as mentioned above along with the motive
steam (D
s
+D
r
) into the first effect of each unit where it condenses. The latent heat of
condensation is used to heat the feed F
1
from T
f1
to the boiling temperature T
1
and
evaporates part of that feed by boiling equal to D
1
. Part of the condensate (D
s
) returns to its
source and the other part of the condensed vapor (D
r
) is introduced to the first flashing box,
where a small amount of vapor flashes off due to pressure drop and equal to D
r
y, where
y=C·ΔT/L
1
. This flashing vapor is passed through the first feed heater along with the vapor
formed in the first effect (D
1
+D
r
y) heating the feed F
1
from T
f2
to T
f1
; then part of it
condenses, and the remaining vapor (D
1
+D
r
y -F
1
y) flows as a heating source to the second
effect and so on up to the last effect n. The brine leaving the first effect (B
1
) is directed to the
second effect which is at a lower pressure, so that flashing will release additional vapor,
which is theoretically equal to B
1
C ∆T/L
2
. This process is continued up to the last effect n.
In this configuration, the condensate vapor in each feed heater is assumed to be equal to
vapor flashed between the two effects from both accumulated distillate and the brine. This
gives an increase in temperature across the feed heaters, which equal to the temperature
drop between the effects i.e. (ΔT
fi
= ΔT).
The vapor formed in the last effect D
n
flows into the end condenser where it condenses by
the cooling seawater stream M
c
. The latent heat of condensation is used to heat the seawater
temperature from T
c
to T
f
. Part of the cooling stream flows to the effects (F) where it is
heated in a series of feed heaters and the remainder (M
c
-F) is rejected from the system.
The feed seawater flow (F) rate splits equally into each effect. Each part sprayed over a
horizontal tube bundle through nozzles, the spray forms a thin falling film over the tubes of
the bundle. The formation of this thin film enhances the heat transfer rate and makes the
evaporation process more efficiently. Series feed heaters are also used between the effects to