Desalination Trends and Technologies Part 10 pdf
Bạn đang xem bản rút gọn của tài liệu. Xem và tải ngay bản đầy đủ của tài liệu tại đây (792.01 KB, 25 trang )
Desalination, Trends and Technologies
214
Wang, Y. & Lior, N. (2006). Performance analysis of combined humidified gas turbine power
generation and multi-effect thermal vapor compression desalination systems —
Part 1: The desalination unit and its combination with a steam-injected gas turbine
power system.
Desalination, Vol. 196 (2006) 84-104.
Part 3
Environmental and Economical Aspects
10
Solar Desalination
Bechir Chaouachi
Unit of research: Environment, Catalysis & Processes Analysis
National School of Engineers of Gabes, University of Gabes,
Omar Ibn ElKhattab Street - 6029 Gabes,
Tunisia
1. Introduction
Water is life in all its forms. All living organisms contain water: the body of a human being
is composed of approximately 60% of water, a fish of 80%, plants between 80 and 90%.
Water is necessary for the chemical reactions that occur in living cells and is also in the
middle of this water that these cells are formed. Water is essential to sustainable food
production as well as all living ecosystems; human development is based entirely on the
hydrological cycle.
Water covers about 70% of the globe area. Furthermore, 97% of this water (salty, non-
potable and unsuitable for irrigation) is located in the oceans. Freshwater is only 3% of total
water on our planet. In this low percentage, rivers and lakes are 0.3%, while the rest is
stored in the polar caps and glaciers.
Freshwater tanks are very unevenly distributed on the surface of the globe. While Western
countries for example have the chance to have huge reserves which will renew each year to
feed a population that acknowledges a low population growth for most. Many tropical and
island countries lack sufficient water, however suffer rampant demographic growth and
know an extremely bad supply difficulties. Arid regions are in a situation of severe water
stress and simply a drought to decimate the weaker populations and livestock.
We fought for the strategic islands or for black gold, we will fight soon for «blue gold" if
everyone does not share its resources, and does not reduce consumption and losses.
Drinking water demand is also growing more and more, and the inadequacy of this water
can be considered to be a danger that continued to disturb the humanity until our days (and
in the future), causing thus disruption or even a braking of economic activities and a
deterioration of living standards [1, 2]. Similarly this lack can be linked directly to 80% of
diseases affecting the world's population and 50% of cases of infant mortality [3]. All these
data so eloquent drew our attention on the need to search other sources of drinking water.
On the other hand, and worldwide distribution of drinking water is not commensurate with
the needs of each region. This is manifested by finding a surplus of water in regions, while
others have chronic shortages. For the latter, the desalination of brackish or sea water is
becoming the inevitable solution.
Furthermore, in addition to the vital need for water, human beings live also have a crucial
need for energy. This is particularly true for human beings who consume increasing energy
not only for food, dress, heat, move, entertainment and treat, but also for product all
manufactured objects quantities.
Desalination, Trends and Technologies
218
The quality of life of the world population largely depends on energy at its disposal, not
only in quantity but also in quality. It is determined by the choice of modes of production,
distribution and consumption. Resolve the crucial energy in the world by providing men
energy that they need on their housing and production sites is certainly a factor of peace.
In these circumstances, made to find a source of energy other than those of fossil energies
and responding to environmental requirements, seems crucial. In this context, renewable
energy have a certain interest and, in particular, solar energy.
Desalination processes fall into two categories; a distillation processes (requiring a phase
change, vaporization/condensation) and in the other hand the membrane processes
(membrane separation).
For its operation, the distillation process requires, for much part, the thermal energy for
heating salty water. For seawater, for example, 100-50. 10
3
kcal per m
3
of water’s produced
following the performance of the unit. In addition, this thermal energy must be provided at
a relatively low temperature, between 120 and 60 ° C according to the technology adopted.
The heat source can be provided, in the case of a coupling solar, by solar flat plate or
concentrator collectors.
The usually used processes which are likely to be coupled to solar energy are:
- Direct solar distillation greenhouse is a strictly a solar process.
- Classical distillation processes such as Multi-stage flash, multiple-effects, vapour
compression process.
Solar energy can be converted from appropriate converters to other forms of energy such as
electrical, mechanical, thermal, etc. In the thermal energy conversion there are two modes of
conversion: at low temperature, where heating fluid temperature remains below 100 ° C [4-
7] and at average and high temperature when it exceeds 100 ° C. For the first case, this level
of temperature is reached by means of a flat plate collector, while in the second case, a
concentrator collector is required [7, 8]. Several types of collectors were made until today
we quote:
• conical concentrator,
• spherical concentrator,
• cylindro-parabolic concentrator and
• parabolic concentrator.
The process of solar distillation is used to distill brackish/saline water by using solar
energy. The systems involved in solar distillation operate under two modes: passive and
active.
Many prototypes of solar stills have been constructed and experimented by various
researchers. A solar distillation system may consist of two separated devices - the solar
collector and the distiller - or of one integrated system. The first case is an indirect solar
desalination process, and the second one is a direct solar desalination process. Many small-
size systems for direct solar desalination and several pilot plants of indirect solar
desalination have been designed and implemented [9-11].
2. Desalination processes
These are separation processes that rely on a technique or technology for transforming a
mixture of substances into two or more distinct components. The purpose of this type of
process is to purify the saline water of its impurities.
Solar Desalination
219
The principle of a separation process is to use a difference of properties between the interest
compound and the remaining mixture. When the difference property will be greater, the
separation is easy. So the choice of the separation process starts with a good knowledge of
the mixture composition and properties of different components. The desalination processes
are divided into two main categories: on the one hand, the distillation process (which
requires a phase change, evaporation / condensation) and on the other hand the membrane
processes (filtration).
The most current techniques of desalination are thermal distillation - for the treatment of
great volumes of water (55 000 m
3
/jour) – and the membranes technology: electrodialysis
and reverse osmosis. The ability of treatment with membrane technology can be adapted
according to the intended use (the great plants have a capacity of more than 5000 m
3
/day,
the averages plant between 500 and 5000 m
3
/day, while that small installations have a
maximum capacity of 500 m
3
/day).
It is noticed that these processes use thermal energy and / or electrical energy and
consequently are consumer’s energy and pollutants. The energy, conventional methods
commonly used, can be of solar origin either a partial or total depending on production
capacity and in this way we minimize significantly the consumption of energy while
protecting the environment. Future research in this area is oriented toward the maximum
utilization of solar energy, which is free and clean, or through technological innovation
and/or improvements on conventional methods.
2.1 Solar thermal distillation
For their operation, the distillation processes require for much of the thermal energy for
heating salt water. Furthermore, this thermal energy must be supplied at a relatively low
temperature, between 60 and 120 ° C. Heat can be provided in the case of the use of solar
energy by solar flat plate or concentrator collector according to working conditions.
The processes most commonly used and which are likely to be coupled to a source of solar
energy are:
- The direct solar greenhouse distillation is a properly solar process.
- The conventional distillation processes such as multi-stage flash, multi-effects, vapor
compression
2.1.1 Direct solar greenhouse distillation
This process consists in heating water directly by the solar radiation in a closed enclosure
covered with glazing. The produced vapor, which condenses on the colder glazing and
slightly inclined, east collects in the form of condensed in gutters. The principle is very
simple, reliable and does not require any maintenance. But its output is relatively weak, 4 to
6 liters/day.m
2
[12, 13]. They are however two types of manufacturing distillers, they can be
built either:
- In the form of modular product, it is usually a tray (plastic, metal, wood ) isolated
from below and covered with a glass top. Several distillers can be fed simultaneously to
form a distillation unit. The number of distillers depends on the desired produced
water capacity. This model is used only for very small product capacities, a few liters
per d. It is practical when the need for distilled water is not very important (laboratory
analysis, auto park ).
They are however several variants include plat distillers, cascading wick, with multiple
effects, spherical etc.
Desalination, Trends and Technologies
220
Fig. 1. Solar distillation by greenhouse effect.
Fig. 2. Solar distiller with cylindroparabolic concentrator
Fig. 3. Spherical solar distiller with sweeping
Solar Desalination
221
Fig. 4. Solar distiller with wick
Fig. 5. Solar distiller with cascade
- When the needs are greater and to increase the production of fresh water, we can
juxtapose several distillers or build a distiller of large surface. The first construction of
this type of distillers was held in 1872 at Las Salinas (Chile) with an area of 4700 square
meters and a production of 23 m
3
/ d of fresh water [14]. In Tunisia, a desalination plant
was built in 1929 near Ben Gardanne to support French military troops [15]. The first
large pools (439 and 1300 m
2
) were built during the 60s in the regions of Chakmou and
Mahdia. Their daily production is respectively 0.57 and 4.48 m
3
[14, 16, 17].
The theoretical analysis is based on the heat balance of the distiller who allows to determine
its output according to the various parameters.
Desalination, Trends and Technologies
222
2.1.2 Distillation with multi-stage flash (MSF)
This process usually profitable only for large capacity (several hundreds of thousands of
m
3
), is not flexible and presents difficulties of setting in mode for a solar application. The
number of effects depends on the pressure difference that exists between the first and last
stage. It is noticed that the contribution of thermal energy can be completely or partially
solar and this is function of the desired production.
Fig. 6. Multi stage flash distiller
2.1.3 Distillation by vapour compression
It is a process involving a series of evaporators; however, its performance is improved by
recycling vapor from the last effect (at the lowest heat) by compressing and then used as
heating steam to the first effect. This method can use solar energy as heat source, but
requires more energy to compress vapor. This is done either with a supercharger
(mechanical compression) or a steam ejector (thermal compression)
2.1.4 Distillation by multiple effects
In this category, there are two processes: some use vertical tubes, the other horizontal tubes.
The advantage goes to the horizontal tubes for low pumping power used and a global
coefficient of heat exchange important.
An example of multiple effect distillers is shown in Fig. 7 [14].
This distiller is composed of a series of vertical and parallel plates, a storage tank for hot
water and a solar panel. The first plate is heated by hot water circulating in the pipe welded
at its left part. The last plate is cooled by circulating salt water in a tube in contact with it.
After that, the heated salt water supplies distributors at the top and right side plates. These
distributors provide a falling film flow along them. The contribution of energy provided by
hot water at the first stage, will give rise to the formation of a quantity of steam in the right
side of this plate. The steam is condensed in the left side of the plate after evaporating a
quantity of water falling film flowing on the right side of this plate and so on. The
condensate is collected at the bottom of the plates.
The storage tank allows the multiple effect process to operate during periods of absence or
insufficient solar radiation. Hence the advantage of this system compared to those using
solar energy directly.
Solar Desalination
223
Fig. 7. Multiple effects solar distillation.
It should be noted that the multiple effect solar distillation at atmospheric pressure cannot
always compete with one single effect. Thus, several studies have been conducted to
improve the performance of these distillers. Among these works, there are those that replace
the flat-plate by parabolic concentrator in order to produce steam for the initiation of
multiple effect distillation [14].
2.2 Solar membrane processes
The main membrane processes used in the field of desalination are electrodialysis and
reverse osmosis.
2.3 Electrodialysis
This process requires, for its operation, the application of an electric field between a cathode
and an anode to allow the migration of the ions (positive and negative) through the
membranes. It is a large consumer of energy, which makes its solar application possible,
only for brackish water of very low salinity.
Fig. 8. Electrodialysis desalination process
Desalination, Trends and Technologies
224
2.4 Reverse osmosis
The principle of this process is to move under the influence of pressure, pure water through
a semi permeable membrane which has the characteristic of retaining the salts dissolved in
water. So we need the necessary energy to supply a high pressure pump, which can be
provided economically (for small plants) by a photovoltaic generator or an aerogenerator.
Fig. 9. Reverse osmosis desalination process
A certain number of units are in operation worldwide, and the results obtained through
various studies and experiments make its application very encouraging.
2.5 Vacuum membrane distillation
Membrane distillation is a relatively recent process. This process uses hydrophobic porous
membranes to separate a solution physically. The process driving force corresponds to the
pressure and temperature variation between the two sides of membrane. The principle of
separation by the membranes distillation is based on the balance liquid/vapour which
controls the selectivity of the process [18].
Fig. 10. Diagram of the desalination unit
Solar Desalination
225
The principal interests of membrane distillation compared to the conventional distillation
process are the great contact specific area due to the installations compactness’s, the
modularity and the possibility of automating the process easily.
Among the membrane distillation techniques we are interested to the vacuum membrane
distillation (VMD). It is an evaporative process which uses a hydrophobic porous
membrane, whose function is to separate and put in contact a liquid and a gas phase [19].
This process is interesting for the seawater desalination. The analysis of the operating
conditions shows that the parameters keys are a relatively low temperature and pressure.
Moreover, the process coupling vacuum membrane distillation with a source of energy
(solar or geothermal) could compete with reverse osmosis [20].
An example of a solar vacuum membrane distillation (SVMD) is represented on the figure 1.
It is composed by a solar desalination system in series with a tank which receives seawater.
This one feed by retentate flow and a auxiliary flow
3. Solar energy
The solar energy received at the ground level is very abundant and far exceeds the energy
requirements of the current world population. It is free and accessible to all by its
decentralized appearance. It reaches the user without hazardous waste or pollution risk.
3.1 Different forms of solar radiation
During the passage of solar radiation by the atmosphere, some is absorbed (UV and X rays),
another part is dispersed by air molecules or suspended particles (dust). This gives rise to
diffuse solar radiation. The remaining part arrives directly at the surface of the ground and
constitutes the direct radiation. The total solar radiation is made of direct and diffuse radiation.
3.2 Solar constant
It is the total energy sent by the sun to the limit of the terrestrial atmosphere on a
perpendicular surface to the radiation. The average value selected is of 1353 W/m ² [21].
3.3 Evaluation of solar radiation reaching the collector
Several mathematical models have been developed to measure the solar irradiance at the
collector. Among these models are cited that of EUFRATE which is based on the synthesis
work of PERRIN DE BRICHAMBAUT, KASTEN and HAY. This model uses the factor of
disturbance of LINKE (TL), latitude and declination [22]. Because the concentrators do not
collect the diffuse radiation [21], we will be interested in this part only to the direct radiation.
The various equations describing the EUFRAT model are:
3.3.1 Correction of the earth-sun distance (r)
r = 1 + 0,034 cos(0,986j – 2) (1)
3.3.2 Estimation of the disturbance factor of LINKE (TL)
TL = 1,6 + 16βA + 0,5 ln(P/100) (2)
The disturbance coefficient of Angström (βA) varies according to the sky type. The
following table illustrates this variation:
Desalination, Trends and Technologies
226
Type of the sky
βA
Major blue 0,02
Pure blue 0,05
Light blue 0,10
Milky blue 0,20
Whitish 0,50
Table 1. Angström disturbance coefficient βA.
In the same way, the factor TL can be estimated by geographical area with the help of the
equation:
TL = TO + u cos(0,986j) + v sin(0,986j) (3)
The TL value must be corrected according to altitude (-0,35 par 1000 m).
Zone TO u v
coast
Mediterranean
inside
3,25
3,15
-1,1
-0,5
-0,15
-0,05
Atlantic 3,25 -0,7 -0,15
Continental 3,75 -0,2 -0,05
Great agglomerations 4,05 -0,5 -0,10
Table 2. Values of the coefficients TO, u et v.
3.3.3 Equation of time (Et) [21]
1
6
Et = 0,123 (t + 87) - sin(2(t + 10)) (4)
t = 0,988 [ D + 30,3 ( M – 1 ) ] (5)
3.3.4 Real solar time (TSV)
TSV = TU +
15
Lo
+ Et (6)
3.3.5 Hour Angle (ω)
ω = 15 (TSV – 12) (7)
3.3.6 Declination (δ)
δ = 23,45 sin (0,986j – 80) (8)
3.3.7 Height or the angle between the direction of the sun with its projection (γ) [23]
sin(γ) = sin(δ)sin(La) + cos(δ)cos(La)cos(ω) (9)
Solar Desalination
227
3.3.8 Optical way (AM)
(
)
1 - 0,1 .z)
AM =
sin(
γ
)
(10)
3.3.9 Direct solar irradiance received on a normal surface with the rays (E)
- AM TL
Bo r exp
0,9 AM 9,4
E
⎡
⎤
⎢
⎥
⎢
⎥
⎣
⎦
=
+
(11)
Bo = 1367 W/m².
3.4 Conversion of solar energy
Solar energy can be converted using appropriate converters in other forms of energy such as
electrical, mechanical, thermal, etc In this case, we are interested to the thermal conversion.
We distinguish then two conversion modes: at low temperature, where the fluid
temperature to heat remains below 100 ° C and at medium and high temperature when it
exceeds 100 ° C. For the first case, the temperature level is achieved by means of a flat plate
collector, whereas in the second case, a concentrator collector is required.
Several types of concentrators have been made to this day which we quote:
•
the conical concentrator,
•
the spherical concentrator,
•
the cylindro-parabolic concentrator and
•
the parabolic concentrator.
This last which will be the subject of this study, was used for a long time, because it ensures
an high level of temperature and power [24]. A parabola is the whole of the points located at
equal distance from a line fixes D, called director of the parabola, perpendicular to axis
(OZ), passing by the X-coordinate (- F) and the focal point F (fig.11). Any luminous ray
parallel with axis (OZ) will be deviated by the reflective surface of the paraboloid towards
the point F of X-coordinate (F) representing the focal distance. The equation giving the focal
distance (F) is [25]:
Fig. 11. Status of the paraboloid from the director D and demonstration of the focus F.
Desalination, Trends and Technologies
228
a
f =
Φo
4t
g
()
2
(12)
The depth of the paraboloid (Po) is given by:
Po =
2
16
a
f
(13)
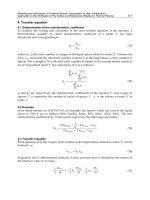
3.4.1 Concentration of the solar radiation
a. Geometrical concentration (Cg)
The geometric concentration is defined as the ratio between collector area (S) of the
concentrator obtained by orthogonal projection of the pupil surface on a perpendicular
plane to the incident radiation and surface receptor (s) of the converter [26]. To determine
the equation of the geometric concentration factor, we proceed as follows: Consider a
paraboloid which approaches the stigmatism (small diameter of the paraboloid and low
angle of incidence [27]), in I point, it receives a conical light beam of angle
ε (fig.12).
Fig. 12. Image of a solar beam on the focal plane[21].
As defined, the expression of the geometric concentration factor is presented in the
following form:
2
2
S
πR
C= =
g
s
π
r
(14)
When we replace (r) and (R) by their expression in equation (14), we find:
2
2
g0
2
o
(2φ )
ε
sin
C = (1+tg(φ )t
g
())
2
tg
4(ε/2)
(15)
b. Effective geometrical concentration (Cge)
The effective geometrical concentration (Cge) is the ratio between the surface of pupil (So)
and the absorbing surface (so) [5]. In the case of a pointed concentrator with a flat absorber,
the effective geometric concentration is equal to the geometric (Cg = Cge).
Solar Desalination
229
Fig. 12’. Diagram of a mirror concentrator
3.4.2 Heat balance of a concentrator
The heat balance of a solar concentrator in permanent pattern is the following:
Pa = Pu + Pe (16)
The power of absorbed radiation can be calculated by:
Pa = ECgs
ργτα (17)
The coefficient of interception is given by the following equation [28,29]:
o
r
γ
= 1-exp [-820 (0,7 )²(1+cos( φ ))]
f
(18)
If we consider that on the level of the absorber we have only one transfer of energy without
phase change, the useful power [30] will be:
Pu = qc(T
s
-T
e
) (19)
The heat losses of the converter are given by:
Pe = Cps(T
moy
-T
a
) (20)
The average temperature T
moy
of the absorber is expressed according to the exit and inlet
temperatures of the coolant and the temperature gradient heat transfer between the
absorbing surface and the coolant ΔT. This is given by the following expression:
se
s
moy
T + T
T +
2
T = + ΔT
2
(21)
Substituting Pa, Pu and Pe in equation (22) by their expressions, we find:
ECgsρταγ = q
c
c
c
(T
s
-T
e
)+ Cps(0,25(3Ts+Te)+ΔT-T
a
) (22)
Desalination, Trends and Technologies
230
The instantaneous global efficiency of the concentrator η
g
is determined by:
u
g
g
P
η =
CsE
(23)
By replacing P
u
by EC
g
sρταγ - Cp(T
moy
-T
a
)s in equation (23), we obtained:
mo
y
a
g
g
(T - T )
η = αρτγ- Cp
CE
(24)
We note here, that when the geometric concentration is higher, the instantaneous global
efficiency is better. The instantaneous internal efficiency
η
i
of the concentrator is:
u
i
a
P
η
P
= (25)
After replacement of Pu and Pa by their expression we obtained:
moy a
i
g
(T - T )
η =1-Cp
EC ρατγ
(26)
a. Conductance of the thermal losses [23,30,31]
The thermal losses are located for a concentrator on the level of the absorber. These losses
are by convection and radiation on the illuminated face and by conduction on the no
enlightened face. The conductance of the thermal losses is given by the following equation:
Cp = hr+hcv+har (27)
b. Exchange coefficient by conduction
The coefficient of exchange by conduction is given by:
Absorber cavity shape
o ar mo
y
ar
ar
moy a
s
λ
( T - T )
h =
s e ( T - T )
(28)
Absorber plane shape
ar
moy ar
ar
moy a
λ
( T - T )
h =
e ( T - T )
(29)
c. Exchange coefficients by radiation and convection
The exchange coefficients by radiation and convection are given following the case where
the absorbing surface is protected or not.
Unprotected absorbent surface on the enlightened face. (fig. 13)
The following diagram shows the case of an unprotected absorber.
In this case, the coefficient of exchange by radiation is given by the following expression for
the two shapes of the absorber:
4
4
moy
v
''
ra
mo
y
a
(T
-T )
h = ε σ
(T -T )
(30)
Solar Desalination
231
a / cavity shape b / plane shape
Fig. 13. Unprotected absorber.
For an absorbing surface with 100 < T
moy
< 500°C, the exchange coefficient by convection is
given by:
Absorber cavity shape
for 0 < V < 4 m/s
''
cv
h = 7,5 + 4V (31)
for 4
≤ V < 40 m/s
'' 0,8
cv
h = 7,3V (32)
Absorber plane shape
for 0 < V < 4 m/s
'' 0,25
cv moy a
h = 2,2(T - T ) + 4V (33)
for 4
≤ V < 40 m/s
'' 0,8
cv
h = 7,5V (34)
Protected absorbing surface : greenhouse effect- (figure 14)
In this case, we have partial conductances presented in the following diagram:
a / cavity shape b / plane shape
Fig. 14. Protected absorber (greenhouse effect).
Desalination, Trends and Technologies
232
The expressions which give these conductances are the following ones:
Absorber cavity shape
4
4
moy
cmo
y
'
rac
mo
y
cmo
y
(T
-T )
h = ε σ
(T -T )
(35)
With
ac
ac
1
ε =
11
+ - 1
εε
h’cv = 3,30 W/m
2
°C (36)
4
4
a
cmoy
v
''
r
cmoy a
εσ (-)
h =
(T -T )
T
T
(37)
h’’cv = 7,5 + 4V (38)
for 0 <V < 4 m/s
or
h’’cv = 7,3V
0,8
(39)
for 4
≤ V < 40 m/s
Absorber plane shape
4
4
cmo
y
moy
'
rac
moy cmoy
-T )
T
h=εσ
T-T
(
(40)
h’cv = 1,1 (T
moy
– T
cmoy
) (41)
4
4
cmoy
v
cmoy a
''
ra
T
(-)
T
h = ε σ
(T -T )
(42)
0,25
moy a
''
cv
h = 2,2 (T - T ) + 4V
(43)
For 0 <V < 4 m/s
or
0,8''
cv
h = 7,5 V (44)
For 4
≤ V < 40 m/s
The expression of the resulting coefficient of exchange for the front face is given by:
1
hr + hcv =
11
+
h'r+h'cv h''r+h''cv
(45)
Solar Desalination
233
3.4.3 Example
The thermal conversion of solar energy by means of solar concentrators makes it possible to
reach high temperatures able to boil the salted water with pressures higher or equal to the
atmospheric one. In order to test these concentrators in the brackish water desalination field,
Chaouachi and al. have designed, dimensioned and built in their laboratory a small solar
desalination unit equipped with a paraboloid concentrator.
The experimental device shown in Fig. 1, is composed of a solar parabolic collector type. The
support of the parabolic concentrator is made of molded fiberglass with 1.8 m in dish
aperture diameter. This dish surface was covered with rectangular stainless steel sheet
segments with a thickness of 1 mm [32,33]. The obtained reflecting surface presents some
imperfections due to the imperfect attachment of the sheets to the mother dish. The absorber
is mounted at its focus, which is shaped like a cylindrical vase, with a receiving surface of
0.013 m2 and a geometric concentration of 195. This absorber is completely insulated except
the part lit by the solar rays reflected by the parabolic surface. The sun tracking mechanism
for this solar distiller has two axes according to previous research [8,9] and it is a manual
system. The brackish water supply to the absorber is kept continuous in order to keep a
constant volume of water in the absorber. The steam produced passes in a coil condenser
where it is condensed. The cooling water circulates with counter flow in the shell and with a
salt water flow of 40 L/h. Condensation is made inside the horizontal copper tubes and it is
out of film. In the same way, it works at the atmospheric pressure and it is followed by a
stage of under-cooling.
Fig. 15. Experimental device.
The capacity of production can reach 4,5 l/m
2
.day.
4. Conclusion
The lack of drinking water, exhaustion and the high cost of energy and pollution problem,
encourage us to find appropriate solutions to meet these challenges. The desalination of
brackish or sea water using renewable energy such as solar energy represents a promising
way. Future research in this area is oriented toward the maximum utilization of solar
energy, which is free and clean, or through technological innovation and/or improvements
on conventional desalination processes.
Desalination, Trends and Technologies
234
Nomenclature
Capital letters :
Cp Apparent conductance of heat loss (W/m
2
°C).
D Day of the month
La Latitude (degree).
Lo Longitude (degree).
M Number of months
P Vapour pressure (Pa)
Pa Incident power of absorbed radiation (W/m
2
)
Pe Power of heat loss (W/m
2
)
Pu Useful power (W)
R Radius of the pupil surface (m)
S Collecting area (m
2
)
T Temperature (K)
TU Universal Time (h)
V Wind speed (m/s)
Small letters:
a Aperture diameter of the paraboloid (m).
c The specific heat (J/kg°C).
e Thickness of the insulation on the back of the absorbers (m).
f Focal or friction factor.
h Exchange coefficient (W/m
2
°C).
h’ Internal heat transfer coefficient (W/m
2
°C).
h’’ External heat transfer coefficient (W/m
2
°C).
qc Mass flow of coolant (kg/s).
R Radius of the absorber or correction of the earth-sun distance (m).
so Surface receptor (m
2
).
s Collecting surface (m
2
)
z Altitude (km).
Greek letters
φo
Aperture Half angle of the paraboloid (degree).
α
Absorption coefficient of the absorber (%).
ε
The angle of a conical light beam (degree).
εa
Emissivity of the absorber (%).
εc
Emissivity of the cover (%).
εac
Apparent emissivity of the system (%).
λ
Thermal Conductivity (W/m°C).
ρ
Reflection coefficient of the paraboloid (%).
σ
STEFAN-BOLTZMANN constant.
τ
Transmittivity of the cover (%).
ω
Hour Angle (degree).
Indices :
a Absorber or ambient.
ar Rear wall insulation.
Solar Desalination
235
cmoy Average cover.
moy
cv
Average absorber
Convection
r Radiation.
s Fluid outlet of the concentrator.
v Steam or vault surrounding.
5. References
[1] G.N.Tiwari, H.N.Singh, R.Tripathi (2003) .Present status of solar distillation. Solar Energy,
75, pp. 367-373.
[2] L.Zhang, H.Zheng, Y.Wu (2003). Experimental study on a horizontal tube falling film
evaporation and closed circulation solar desalination system. Renewable Energy, 28,
pp. 1187-1199.
[3] R.DESJARDINS (1988). Traitements des eaux. 2ème édition, Editions de l’école
polytechnique de Montréal.
[4] A.Al-kharabshesh, Y. Goswami (2003). Experimental study of an innovative solar water
desalination system utilizing a passive vacuum technique. Solar Energy, 75, pp. 395-
401.
[5] S.K. Shukla, V.P.S. Sorayan (2005). Thermal modeling of solar stills: an experimental
validation, Renewable Energy, 30, pp. 683-699.
[6] H.D. Ammari, Y.L. Nimir (2003). Experimental and theoretical evaluation of the
performance of a tar solar water heater. Energy Conversion and Management, 44, pp.
3037-3055.
[7] S.A. Kalogirou (2004). Solar thermal collectors and applications. Progress in Energy and
Combustion Science, 30, pp. 231-295.
[8] R.Y. Nuwayhid, F. Mrad, R. Abu-Said (2001). The realization of a simple solar tracking
concentrator for university research applications. Renewable Energy, 24, pp. 207-222.
[9] H.E.S. Fath(1998). Desalination, 116, 45.
[10] E. Delyannis, and V. Belessiotis, Mediterranean. Conference on Renewable Energy
Sources for Water Production. European Commission, EURORED Network, CRES,
EDS, Santorini, Greece, 1996, pp. 3-l 9.
[11] E.E. Delyannis(1987). Desalination, 67, pp. 3.
[12] J. GIRI, B. MEUNIER, (1980). Evaluation des énergies renouvelables pour les pays en
développement. Volume 2, Commissariat à l’énergie solaire, France, pp. 194, 199-201.
[13] J. R. VAILLANT, (1978). Utilisation et promesses de l’énergie solaire. EYROLLES, Paris, pp.
178,183.
[14] A. A. M. SAYIGH, (1977). Solar energy engineering. Academic press, New York, pp. 434,
437,449,455,459.
[15] F. BEN JEMAA et al, (1998). Desalting in Tunisia : Past experience and future prospects.
Desalination 116, pp. 124.
[16] F. BEN JEMAA et al, (1998). Potential of renewable energy development for water
desalination in Tunisia. Renewable energy, December, pp. 6.
[17] I. HOUCINE et al, (1999). Renewable energy sources for water desalting in Tunisia.
Desalination, 125, p p. 126.
Desalination, Trends and Technologies
236
[18] N. COUFFIN, C. CABASSUD et V. LAHOUSSINE-TURCAUD, (1998). A new process
to remove halogenated VOCs for drinking water production: vacuum membrane
distillation. Desalination, 117 pp. 233-245
[19] D. WIRTH, (2002). Etude de la distillation pour le dessalement de l’eau de mer, Thèse de
Doctorat, Institut National des Sciences Appliquées de Toulouse.
[20] D. WIRTH, C. CABASSUD, (2002). Water desalination using membrane distillation:
comparison between inside/out and outside/in permeation. Desalination, 147, pp.
139-145.
[21] R. BERNARD, G. MENGUY, M. SCHARTZ, (1980). Le rayonnement solaire conversion
thermique et applications. 2ème édition, Technique et documentation, Paris, pp.
30,39,149,197.
[22] B. BOURGES, L. BERTOLO, (1992). Données climatiques utilisées dans le bâtiment.
Technique de l’ingénieur, B 2015, Paris, pp. 22.
[23] A. A. SFEIR, G. GUARRACINO, (1981). Ingénierie des systèmes solaires applications à
l’habitat. Technique et documentation, Paris, pp. 55.
[24] J. GLEN, K. LOVEGROVE, A. LUZZI, (2003). Optical performance of spherical
reflecting elements for use with paraboloidal dish concentrators. Solar energy, 74,
pp. 133.
[25] R. HOUZE, (1989).Les antennes du fil rayonnant à la parabole, Tome 2, EYROLLES, Paris,
pp. 150,154.
[26] R. PASQUETTI, (1987). Chauffage des fluides par capteurs solaires à concentration.
Technique de l’ingénieur, B 2420, Paris, pp. 4-7,13,16.
[27] M. HENRY, (1981). Optique géométrique. Technique de l’ingénieur, A 190, Paris, pp. 5.
[28] P. GALLET, F. PAPINI, G. PERI, (1980). Physique des convertisseurs héliothermiques.
EDISUD, Aix en Provence, pp. 131,135,136,144,145.
[29] J. DUFFIC, B. WILLIAM, (1974). Solar energy thermal processes. John Wiley & Sons inc,
New York, pp. 191,194,196.
[30] J. DESAUTEL, (1979). Les capteurs héliothermiques. EDISUD , Paris, pp.16-19, 80- 83.
[31] A. S. KENKARE, J. P. YIAMMOULLOU, (1983). The performance of a concentrating
solar collector in UK weather conditions. Solar world congress. 2, Pergamon
press,U.K., pp. 1043.
[32] R.Y. Nuwayhid, F. Mrad and R. Abu-Said, (2001) .The realization of a simple solar
tracking concentrator for university research applications. Renewable Energy, 24,
PP. 207–222.
[33] V.V. Pasichny and B.A. Uryukov, (2002). Theoretical aspects for optimization of solar
radiation concentrators with plane facets. Solar Energy, 73, pp.239.
[34] B. Chaouchi, A. Zrelli, S. Gabsi (2007). Desalination of brackish water by means of a
parabolic solar concentrator. Desalination 217, pp. 118–126.
11
Reject Brine Management
Muftah H. El-Naas
United Arab Emirates University
UAE
1. Introduction
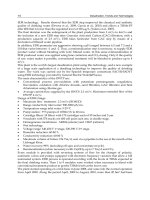
Desalination has been growing rapidly as an industry and as a field of research that
combines engineering and science to develop innovative and economical means for water
desalting. Many countries in the world, especially in the Middle East, depend heavily on
seawater desalination as a major source of drinking water and have invested considerable
efforts and financial resources in desalination research and training. Desalination plants
have seen considerable expansion during the past decade as the need for potable water
increases with population growth. It is estimated that the world production of desalination
water exceeds 30 million cubic meters per day and the desalination market worldwide is
expected to reach $ 30 billion by 2015.
One of the major economical and environmental challenges to the desalination industry,
especially in those countries that depend on desalination for potable water, is the handling
of reject brine, which is the highly concentrated waste by-product of the desalination
process. It is estimated that for every 1 m
3
of desalinated water, an equivalent amount is
generated as reject brine. The common practice in dealing with these huge amounts of brine
is to discharge it back into the sea, where it could result, in the long run, in detrimental
effects on the aquatic life as well as the quality of the seawater available for desalination in
the area.
Although technological advances have resulted in the development of new and highly
efficient desalination processes, little improvements have been reported in the management
and handling of the major by-product waste of most desalination plants, namely reject brine.
The disposal or management of desalination brine (concentrate) represents major
environmental challenges to most plants, and it is becoming more costly. In spite of the
scale of this economical and environmental problem, the options for brine management for
inland plants have been rather limited. These options include: discharge to surface water or
wastewater treatment plants; deep well injection; land disposal; evaporation ponds; and
mechanical/thermal evaporation. Reject brine contains variable concentrations of different
chemicals such as anti-scale additives and inorganic salts that could have negative impacts
on soil and groundwater.
This chapter highlights the main concerns as well as the environmental and economical
challenges associated with the generation of large amounts of reject brine as a by-product of
the desalination process. The chapter also outlines and compares the most common options
for the treatment or disposal of reject brine. The chapter focuses on a novel approach to the
management of reject brine that involves chemical reactions with carbon dioxide in the
Desalination, Trends and Technologies
238
presence of ammonia, based on a modified Solvay process. Reject brine is mixed with
ammonia and then exposed to carbon dioxide using different contact techniques. The end
result is the conversion of NaCl and CO
2
into a useful solid product, namely sodium
bicarbonate, and the reduction of the salinity of the treated brine, which may then be used for
irrigation. Besides brine management, the new approach will reduce the emissions of CO
2
as a
major contributor to global warming. Carbon dioxide can be used as a pure gas from gas
sweetening units or in the form of flue or exhaust gas from chemical or power plants.
2. Current brine disposal options
Since desalination processes generate considerable amounts of reject brine, the industry has
adopted numerous disposal options that usually depend on the location of the desalination
plant and type of process used. These options include: discharge to surface water or
wastewater treatment plants; deep well injection; land disposal; evaporation ponds; and
mechanical/thermal evaporation. Management of reject brine has recently become an
increasingly difficult challenge due to many factors that include: growing number and size
of desalination plants which limits disposal options; increased regulations of discharges that
make disposal more difficult; increased public concern with environmental issues; increased
number of desalination plants in semi-arid regions where conventional disposal options are
limited (Mickley, 2006). Cost plays an important role in the selection of a brine disposal
method and it is believed to range from 5% to 33% of the total cost of desalination (Ahmed
et al, 2001). Mickley et al. (1993) identified the factors that influence the selection of a
disposal method. These include the quantity and quality of the brine; composition of the
concentrate; physical or geographical location of the discharge point of the concentrate;
availability of receiving site, permissibility of the option, public acceptance, capital and
operating costs, and ability for the facility to be expanded. The cost of disposal depends on
the characteristics of reject brine, the level of treatment before disposal, means of disposal,
volume of brine to be disposed of, and the nature of the disposal environment (Ahmed et al,
2001). A detailed review of the different brine disposal methods can be found in a report by
Mickley (2001). The following sections will present a brief summary of the main brine
disposal options and highlight the main drawbacks of each option.
2.1 Discharge into surface water
It has been a common practice for coastal desalination plants to dispose reject brine into the
close-by surface water body, namely sea or ocean. For these plants, such disposal operation
has always been deemed the most practical and least expensive. Costs for disposal are
typically low provided that pipeline conveyance distances are not excessively long and the
concentrate is compatible with the environment of the receiving water body. An assessment
of salinity or TDS impact as well as those of specific constituents on the receiving stream
must always be considered (Mickely et al, 2006). The main factors that determine the costs of
reject brine discharge to surface water include: costs to transport the brine from the
desalination plant to the surface water discharge outfall; costs for outfall construction and
operation; and costs associated with monitoring the environmental effects of the brine
discharge on the surface waters (Mickely et al, 2006).
The impact of brine disposal operations on coastal and marine environment is still largely
unknown, but the high temperature and salinity associated with reject brine may have
detrimental effects on marine life. Moreover, the high level of chemicals could reduce the