New Tribological Ways Part 9 doc
Bạn đang xem bản rút gọn của tài liệu. Xem và tải ngay bản đầy đủ của tài liệu tại đây (2.05 MB, 35 trang )
New Tribological Ways
264
locking occurs even in the case where a belt is wrapped around an axis two or more times.
Two conditions are required to bring about self-locking. One is smaller coefficient of belt-
belt friction than that of belt-axis friction. The other is larger wrap angle than the critical
wrap angle. Utilizing the self-locking property of belt, a novel one-way clutch was
developed. The problem of this clutch is how to get the smaller and stable coefficient of belt-
belt friction for long time use. Friction of a flexible element wrapped around a generalized
profile was studied. However, the friction of twisted flexible element in a thread, rope and
wire has not been clarified yet. Further research is required.
7. References
Hashimoto H., (2006). Tribology, Morikita publishing, ISBN 4-627-66591-1, Tokyo
Imado K., (2007). Study of Self-locking Mechanism of Belt Friction, Proceedings of the
STLE/ASME International Joint Tribology Conference, ISBN 0-7918-3811-0, San Diego
October 2007, ASME
Imado K., (2008 a). Study of Belt Buckle, Proceedings of the JAST Tribology Conference, pp.139-
140, ISSN 0919-6005, Tokyo, May 2008
Imado K., (2008 b). Study of Belt Friction in Over-Wrapped Condition, Tribology Online,
Vol.3, No.2, pp.76-79, ISSN 1881-2198
Imado K., Tominaga H., et al. (2010). Development of novel clutch utilizing self-locking
mechanisms of belt. Triloboy International, 43. pp.1127-1131, ISSN 0301-679X
J. A. Williams (1994). Engineering Tribology, Oxford University Press, ISBN 0-19-856503-8,
New York
Joseph F. Shelley (1990). Vector Mechanics for Engineers, McGraw-Hill, ISBN 0-07-056835-9,
New York
Yano K. & Ishihara S., (1964). Vector Analysis, Shokabo, 3341-01060-3067, Tokyo
13
Surface Friction Properties of
Fabrics and Human Skin
Mari Inoue
Graduate School of Human Development and Environment,
Kobe University, Hyogo, 657-8501,
Japan
1. Introduction
We will select and decide to buy our clothes not only by looking at the design and colour of
the clothes, but also by handling the cloth. And for the people which their skin has any
trouble, the surface friction property of fabrics is important. It is known that the fabric
handle judged by hand is affected by the mechanical properties, surface property and the
thermal and water transfer properties of the fabrics. The objective evaluation equations are
developed by Kawabata and Niwa [1].
Figure1shows the factors concerning for the performance of clothing. The factors of the
properties of clothing are the structure of clothing and the properties of fabrics. And the
factors of the properties of fabrics are the structure of the fabrics and the properties of yarn,
and the factors of the properties of yarn are the structure of the yarns and the properties of
fiber.
In the objective evaluation equations of hand value, especially, NUMERI and FUKURAMI,
the effects of surface properties is so large. In this study, objectives are to be remarkable
about three points. At first, the friction properties of fabrics which differ from the kinds of
fiber, yarn counts, and yarn density, secondly, the friction properties of the human skin and
next, the friction properties between human skin and the fabrics are experienced.
Fig. 1. The factors for properties of clothing
New Tribological Ways
266
2. Experimental
2.1 Surface friction properties of fabrics
2.1.1 Measuring method
The surface friction properties of fabrics are measured by KES-SE surface friction tester as
shown in Figure 2. Figure 3 shows the friction contactor. It consists of the twenty steel wires
of which the diameter is 0.5 mm and the fingerprint is simulated. The contact area is 10mm x
10mm, and the contact load is 0.5N. The scan speed of the tester is 1 mm/sec. Measuring
characteristics values are coefficients of the surface friction, MIU and the standard deviation
of MIU, MMD. This tester is used in all experiments.
Fig. 2. KES-SE surface friction tester
Fig. 3. Friction contactor
2.1.2 Samples
The properties of the fabrics are affected by the yarn properties and the structure of the
fabrics. And the yarn properties are affected by the properties of fibers and the structure of
the yarns. In these experiments, the samples are composed of different fibers as shown in
Table 1. Another samples are shown in Table 2. Yarn counts of these samples are same, but
yarn density is different in these groups.
Surface Friction Properties of Fabrics and Human Skin
267
symbol Fiber Yarn
Yarn counts
tex(=×10
-5
N/m)
structure warp weft
SC Natural cotton staple 14.8 14.8
SL fiber linen staple 7.4 7.4
SW wool staple 14.1 12.3
SS silk staple 8.4 8.4
FN Synethetic nylon filament 7.8 7.8
FP fiber polyester filament 5.6 8.3
SA acrylic staple 11.4 11.4
Table 1. Samples for fabric consisted of various fibers
symbol Fiber Yarn counts Yarn density
tex(=×10
-5
N/m) ends/cm picks/cm
C1 cotton 14.8 43.0 30.4
C2
(staple)
14.8 34.6 30.0
C3 14.8 43.0 20.2
C4 14.8 33.2 20.0
C5 cotton 7.4 47.0 39.0
C6
(staple)
7.4 46.2 30.0
C7 7.4 33.6 30.4
C8 7.4 45.8 20.4
P1 polyester 16.7 38.7 40.1
P2
(filament)
16.7 37.3 35.5
P3 16.7 36.3 31.7
P4 16.7 36.1 27.5
Table 2. Samples for fabric which are different density
2.2 Surface friction properties of human skin
Surface friction properties, MIU and MMD of human skin of twenty-six subjects in their
twenties are measured by KES-SE. in Figure 2. Figure 4 shows the measurement of human
skin and the figure 5 shows the example of the measurement result of the surface friction.
And moisture regain of the skin also is measured as shown in figure 6.
New Tribological Ways
268
Fig. 4. Measurement of surface friction properties of human skin
L
,
c
m
0 1 2
0.4
-0.4
L
,
c
m
0 1 2
0.4
-0.4
Fig. 5. The example of the measurement result of the surface friction
Fig. 6. The measurement of moisture regain of human skin
2.3 Friction properties between Human skin and fabric
Friction properties, that is, coefficients of the surface friction, MIU and the standard deviation,
MMD of human skin of twenty-six subjects in their twenties are measured by KES-SE using
contactor with fabrics between Human skin and fabric. Figure 7 shows the contactor.
Surface Friction Properties of Fabrics and Human Skin
269
The mounted fabrics are two knitted fabrics and two woven fabrics. The MIU and MMD of
each fabric are shown in Table 3. MIUs of K2 and W2 are larger than K1 and W1, respectively.
Fig. 7. Surface contactor mounted with fabric
sample structure fiber
MIU MMD
thickness weight
Ave. SD Ave. SD mm mg/cm
2
K1
rib knitted
cotton 100%
0.163 0.016 0.0070 0.0016 0.78 21.6
K2
plain
knitted
cotton 100%
0.273 0.037 0.0115 0.0015 2.41 32.0
W1 plain woven
cotton/PET
50/50%
0.131 0.002 0.0172 0.0051 0.34 11.0
W2 twill woven
cotton100%
0.227 0.007 0.0084 0.0012 1.49 21.3
Table 3. MIU and MMD of fabrics using friction experiments with human skin
3. Results and discussion
3.1 Surface friction properties of fabrics
Table 4 shows the MIU and MMD of specimen which is composed of different fiber. MIU of
sample FN (nylon filament) shows the lowest value and the MIU and MMD of sample SW
(wool staple) show the highest values. The tendency is that MIU and MMD of filament fiber
are lower than staple fiber. But it’s not remarkable.
The relationship between product of yarn density in the warp and weft direction and the
MIU or MMD shows in Figure 8. In the case of staple yarn, the tendency is not remarkable,
but it is remarkable that the higher density shows the higher MIU and MMD in the case of
filament yarns.
symbol
MIU MMD
μm μm
SC 0.161 0.0104
SL 0.127 0.0149
SW 0.169 0.0154
SS 0.141 0.0148
FN 0.102 0.0145
FP 0.130 0.0125
SA 0.205 0.0099
Table 4. MIU and MMD of specimen composed of different fiber
New Tribological Ways
270
0.20
0.18
0.16
0.14
0.12
0.10
2000150010005000
C1 - C4
C5 - C8
P1 - P4
60
40
20
0
x10
-3
2000150010005000
Surface Friction MIU, μm
ends x picks, yarns/cm
2
MMD, μm
Fig. 8. The relationship between product of yarn density and MIU and MMD
3.2 Surface friction properties of human skin
Surface friction properties, that is, coefficients of the surface friction, MIU and the standard
deviation, MMD of human skin of twenty-six subjects in their twenties are shown in Table 4.
There is no difference between male and female, but there is large difference among
individuals because of the large standard deviation.
Figure 9 shows the relationships between moisture regain and MMD of all subjects in 25
degree C and 65%RH. It does not show the remarkable tendency, but the it is consider that
the larger moisture regain, the larger MMD it is.
Figure 10 shows the examples of coefficients of surface friction of skin versus moisture
regain of skin in the same person. The coefficients of surface friction have not only the large
difference among individuals, but also the difference of moisture regain. Therefore, it is
consider that there are the differences between season or rhythm of one day.
number
MIU
MMD
Moisture regain,%
Ave. SD Ave. SD Ave. SD
male 13 0.405 0.220 0.0193 0.0136 32.3 4.5
female 13 0.430 0.144 0.0111 0.0065 29.6 3.2
all 26 0.419 0.187 0.0148 0.0114 30.8 4.2
Table 4. MIU, MMD and moisture regain of human skin
Surface Friction Properties of Fabrics and Human Skin
271
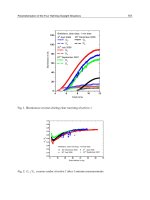
Fig. 9. The relationships between moisture regain and MMD of all subjects in 25 degree C
and 65%RH
Fig. 10. The relationship between moisture regain and MIU of human skin
3.3 Friction properties between Human skin and fabric
Figure 11 shows the examples of MIU which the change of MIU is the largest one of twenty-
six subjects. From these results, it is concluded that the MIU between human skin and fabric
does not relate to the MIU of fabric, but moisture regain of skin.
New Tribological Ways
272
Fig. 11. The relationship between moisture regain and MIU of human skin/fabric
4. Conclusion
The hand of fabric used as clothing materials, the surface friction properties of skin and the
friction between clothing materials and skin were measured. As the results, the tendency
was that MIU and MMD of filament fiber were lower than staple fiber. And it was
remarkable that the higher density showed the higher MIU and MMD in the case of filament
yarns. Friction between human skin and fabrics were measured, and the effects of the
moisture regain of human skin and the friction of fabrics were shown from the results. Our
group will develop the new apparatus which the width of the part of contactor are wider
one at present. On the basis of the results of this study, we would like to develop the
apparatus which are close to human sense for friction properties.
5. References
[1] Sueo Kawabata, “The standardization and analysis of hand evaluation (second edition)”, The
Hand Evaluation and Standardization Committee and The Textile Machinery
Society of Japan, 1980
[2] Harumi Morooka and Masako Niwa, Jpn. Res. Assn. Text. End-uses, Vol.29, No.11, 486-493, 1988
[3]A.J.P.Martin, J. Society of Dyers and Colourists, Vol.60, 325-328, 1944
[4] P.Grosberg, J. Text. Inst., Vol.46, T233-246, 1955
[5] B.Lincoln, J. Text. Inst., Vol.45, T92-107, 1954
[6] H.G.Howell, J. Text. Inst., Vol.44, T359-362, 1953
[7] C.Rubenstein, J. Text. Inst., Vol.49, T13-32, 1958
[8] C.Rubenstein, J. Text. Inst., Vol.49, T181-191, 1958
[9] E.J.Kaliski, Text. Res. J., Vol.28, 325-329, 1958
[10] M. Nakao, J. Text. Mach Soc. Jpn, Vol.17, 293-297, 1964
[11] Y. Miura, J. Seni Gakkai, Vol.10 558-563, 1954
[12] K. Hirata, M.Yoshida and A.Hanawa, Jpn, Res. Assn. Text. End-uses, Vol.15, 47-53, 1974
[13] M.Nakura and N.Imoto, Jpn, Res. Assn. Text. End-uses, Vol.18, 74-78, 1977
[14] S.Kobayashi, Jpn, Res. Assn. Text. End-uses, Vol.8, 264-270, 1967
[15] S.Kobayashi, Jpn, Res. Assn. Text. End-uses, Vol.7, 290-296, 1966
[16] H.L.Roader, J. Text, Inst, Vol.44, T247-265, 1953
[17] B.Olofsson and N.Gralen, Text. Res. J., Vol.20, 467-476, 1950
[18] M.Osawa and K.Namiki, J. Text. Mach. Soc. Jpn, Vol.19, T7-16, 1966
[19] M.Osawa, K.Namiki and H.Odaka, J. Text. Mach. Soc. Jpn, Vol.22, T31-38, 1969
14
Investigation of Road Surface
Texture Wavelengths
Chengyi Huang and Shunqi Mei
Department of EME, Wuhan Textile University, Wuhan
P. R. China
1. Introduction
It is generally realized that pavement texture plays a vital role in the development of both
pavement friction and tire wear. For the past several decades, pavement texture
measurements and modeling analysis have attracted considerable interest of many
researchers. Pavement profiles usually present many of the statistical properties of random
signals, it is very difficult to distinguish the different surfaces through texture analyses.
Based on ASTM E 867, pavement texture can be grouped into two classes micro- and macro-
texture in terms of the deviations of pavement surface with characteristic dimensions of
wavelength and amplitude. Pavement macrotexture has a substantial influence on the
friction between tire and road surfaces, especially at high speeds and in wet pavement
conditions. Kokkalis(1998) has shown a relationship between wet pavement accident rate
and pavement macrotexture. As expected, the accident rate is reduced as macrotexture
increases. Gunaratne et al. (1996) used an electro-mechanical profilometer to record the
surface profiles made of asphalt and concrete. The data were later modeled using Auto
Regressive (AR) models, where a Fast Fourior Transform (FFT) technique was used to
graphically regenerate the pavement surface. Since the order of the models used in these
studies was very low (AR(3)), they were able to only model macrotexture and could not
capture the characteristics of microtexture. Fülöp et al. (2000) investigated the relationship
between International Friction Index (IFI) and skid resistance and between IFI and surface
macrotexture. It was found that the macrotexture relates to the hysteresis effects in the tire
tread rubber and absorbs some of the kinetic energy of the vehicle. Hence, they concluded
that macrotexture has a direct effect on skid resistance.
Today with the advance of measurement technology, by means of a sensor-measured
texture meter, profile heights related to both microtexture and macrotexture can be obtained
easily. Researchers have focused on the effect of microtexture on friction between the tire
and the road surfaces. The investigations by Kokkalis (1998) classified the microtexture and
macrotexture as the first and second order of pavement surface irregularities, respectively.
Rohde (1976) demonstrated the importance of microtexture pattern as well as its amplitude
on the load-carrying capability and the descent time of the tread element. Taneerananon and
Yandell (1981) developed a model to simulate a rigid tread element sinking onto a cover of a
road surface having microtexture and studied the effect of microtexture roughness on the
braking force coefficient. They found that this effect becomes more important when the
pavement surface is wet. Persson and Tosatti (2000) presented a comprehensive treatment of
New Tribological Ways
274
the hysteric contribution to the friction for viscoelastic solids sliding on hard substrates with
different types of (idealized) surface roughness. They discussed qualitatively how the
resulting friction force depends on the nature of the surface roughness. It was found that,
when rubber is slowly sliding on the surface, at velocity less than 1cm/s (as in the case to
ABS-braking of automotive tires on dry and wet road surface), the rubber will deform and
fill out the nanoscale cavities associated with the short-ranged surface roughness and this
gives an additional contribution to the sliding friction.
With increase in number of vehicles and increase in speed limits and the subsequent traffic
fatalities, tire-road friction estimation has become an important research issue with
Department of Transportation (DOT). In particular, researchers have paid more attention to
the investigation of elevation road surface texture as a function of Average Daily Traffic
(ADT). In the first part of this article, to further understand the features of polishing process
on pavement surfaces, experimental texture measurements and Data Dependent Systems
(DDS) approach were utilized to model and analyze the elevation profiles collected from
polished and unpolished aggregate surfaces of Aggregate Wear Index (AWI) wear track. A
key problem in texture measurement was how to determine sampling step sizes so as to
reveal the properties of tire polishing process. Three step sizes were adopted to measure the
aggregate surfaces. The DDS approach was then used to model and analyze those elevation
profiles collected from polished and unpolished AWI wear track surface. It was found that
the DDS approach was able to capture both the characteristics of the evolved macrotexture
and microtexture and the polishing effect on the aggregate surfaces is found to reduce the
microtexture roughness significantly. The second part in this article is to exhibit a texture
analysis from several bituminous pavement surfaces obtained from Michigan, USA. Since
traffic abrades the pavement surface, exposing aggregates and makes aggregates worn and
polished, the polishing properties of coarse aggregates play a significant role in determining
skid resistance. Therefore, 1 micron step size scan was used to collect the elevation profile
from exposed aggregates and 45 micron step size scan was arranged to collect data from
texture surface on each core surface, respectively. DDS approach was utilized to model and
analyze the data for both 1 micron and 45 micron step size scans. The characteristics of both
microtexture and macrotexture were derived by applying different criteria to DDS modeling
analysis and they were correlated to the British Pendulum Tester numbers (BPNs)
Laboratory Friction Tester values (LBF) and obtained on the same core. A good correlation
was found from some mixed type of pavements.
2. Surface texture measurements
In order to simplify the analyses of road surfaces, aggregate surface textures on AWI wear
track were investigated first. Figure 1 shows several polished aggregate on a portion of the
AWI wear track obtained from Michigan Department of Transportation (MDOT). Since
1971, MDOT has been using a laboratory wear track to quantify the tendency of individual
coarse aggregate sources to polish under the action of traffic (Dewey, et. al., 2001). The wear
track consists of a pair of diametrically opposite wheels each attached to a common center
pivot point. An electric motor is used to apply a driving force to the wheels through the
center pivot point. The aggregate test specimens used on the wear track are trapezoidal in
shape. Uniformly graded aggregates are placed in a layer directly against the mold and then
covered by portland cement mortar. When 16 of the test specimens are placed end to end,
they form a circular path about 2.13 meter in diameter. The surface of the wear track is
consisted of limestone aggregate (from Port Inland, MI) of around 10mm size.
Investigation of Road Surface Texture Wavelengths
275
Fig. 1. Polished AWI wear track surface
The purpose of this section is to characterize the macrotexture and the microtexture present
on both the polished (smooth) and the rough (unpolished or original) AWI aggregate
surface. A laser profilometer was used to collect the elevation profiles on the surfaces. The
profilometer can scan a 50.8×50.8 mm square area on any given sample surface. However,
due to the restriction on the number of data points that can be effectively used in the
subsequent DDS analysis, a maximum of 1024 points were collected for each scan length.
Therefore, higher resolution scans were used for short scan lengths and vice versa. For
example, if one micron step size is adopted to scan a surface, then the maximum scan length
allowed is around one millimeter, in which the scan included 1024 data points.
Since the optimum step size for a given pavement is not known a priori, a number of step
sizes (from 1 micron in Do, et. al.,(2000) to 20 millimeters in Perera, et. al., (1999)) have been
chosen to measure road surface irregularities. Most of the texture measurements were
characterized by Mean Texture Depth (MTD) (Gunaratne, et. al., (1996)) or Root Mean
Square (RMS) of texture profile (Fülöp, et. al., 2000). Those measurement analyses seemed to
have a good relationship with other road surface friction tests. In this paper, three step sizes,
1micron, 30micron and 45micron, were chosen to scan both the smooth and rough aggregate
surfaces spanning 1mm, 7mm and 45mm, respectively. Typically, the 1μm and 30μm scans
were limited to one aggregate surface and hence can provide the microtexture present on
the individual aggregate, whereas the 45μm scans sampled several aggregates and the
spaces in between, and therefore, were able to capture the features of both macrotextural
and microtextural features of the wear surface. In addition, the 30micron scans can also
provide a criterion for distinguishing between polished and unpolished aggregate surfaces
for large scan step size. A total 10 scans were collected for each step size, 5 from polished
surfaces and 5 from unpolished surfaces. Each scan data was imported into a DDS program
so that parameters of the model such as frequency, wavelength, damping ratio and variance
New Tribological Ways
276
contribution could be determined. Comparisons of the model parameters from the polished
and unpolished scans can reveal the differences between them.
3. Data Dependent System (DDS) methodology
DDS approach is commonly used for time series analysis of sequentially sampled data. The
methodology provides an effective approach to model such series in a statistically optimal
manner. The elevation profile collected by the laser profilometer is essentially a uniformly
sampled time series or space series data. The DDS modeling of the texture of the aggregate
surface is aimed at a complete frequency or wavelength decomposition of the surface.
The DDS approach for modeling the elevation profiles utilizes the Autoregressive Moving
Average model, represented as ARMA(2n,2n-1) (Pandit and Wu, 1983) and is given by
1 1 2 2 2 2 1 t-1 2 t-2 2n-1 t-2n 1
-a-a a
tt t ntnt
XX X X a
ϕϕ ϕ θθ θ
−
−− +
=+++ + −−"" (1)
where the variable X
t
denotes the “state” of a system at time t, i.e., the profile height in this
analysis. The adequacy of the model implies that a single state X
t
completely characterizes
the behavior of the system by expressing the dependence of the present state, i.e., the
current profile height X
t
on past states X
t-1
, X
t-2
, …, X
t-2n
. The remainder a
t
’s are independent
or uncorrelated random variables with zero mean and are often called as white noise. The
order n of the model is increased until an adequate model is found, which will be explained
later. In Eq. (1), the
ϕ
i
’s are autoregressive parameters.
If the ARMA(2n, 2n-1) model is adequate, the roots
λ
i
(i=1, 2, 3,…, 2n) can be found from the
characteristic equation
22122
12 2
0
nn n
n
λϕλ ϕλ ϕ
−−
−
−=" (2)
where a real root provides a decaying exponential dynamic mode and a complex conjugate
pair of roots provide a decaying (damped or undamped) sinusoidal mode with certain
decay rate and frequency or wavelength. Using the backshift operator
BX
t
=X
t-1,
221
12 21
12 1 1 2
0
1
(1 )(1 ) (1 )(1 )(1 ) (1 )
n
n
t t
j
t
j
iii n
j
BB B
XaGa
BB BB B B
θθ θ
λλ λ λλ λ
−
∞
−
−
−+
=
−− −−
==
−− − −− −
∑
"
""
(3)
where
12 2
12 2
jj j
jn
n
Gg g g
λ
λλ
=++" (4)
is called as Green’s function and the coefficients corresponding to the root
λ
i
are given by
21 22
121
12 1 1 2
1,2,3, 2
()()( )( )( )
nn
ii n
i
ii iiiiin
gin
λθλ θ
λλλλ λλ λλ λλ
−−
−
−+
−−−
==
−− − − −
"
"
""
(5)
The
g
i
terms simply scale the magnitude of the response from the ith mode and can also
introduce a phase shift when that mode is sinusoidal . To better clarify the role of complex
conjugate pairs of roots, each
λ
i,
*
i
λ
and associated g
i,
*
i
g
can be expressed in the form of
*
*
2cos()
j
jj
ii ii ii
ii
gg g j
λ
λλωβ
+= + (6)
Investigation of Road Surface Texture Wavelengths
277
where the damped frequency
ω
i
and phase shift
β
i
come from the root
λ
i
and the
corresponding scaling factor
g
i
respectively (Pandit and Wu, 2001). The damped frequency
can further be expressed in terms of the damping ratio
ζ and natural frequency
ω
n
as
21
Re( )
1cos
i
in
i
λ
ωω ζ
λ
−
=−= (7)
where the damped angular frequency
ω
i
and the natural frequency
ω
n
are expressed as angle
per sampling interval, and can be converted into cycles per second (Hz) by dividing 2
π
or
can be converted into wavelength by using the constant speed of the profilometer. For a real
root, the break or pseudo-frequency defined by the half power point in the spectral
domaine.
Once the model has been fitted to the corresponding elevation profile data, the variance can
be written in terms of the roots as
2
0122
() ( )
tt n
Variance X E X d d d
γ
===+++" (8)
where
2
2
1
, 1, 2, , 2
1
n
ij
ia
ij
j
gg
din
σ
λλ
=
==
−
∑
" (9)
Thus, the power of a particular root, that is its contribution to the variance γ
0,
is represented
by the corresponding d
i
.
The choice ARMA(2n,2n-1) sequence is mainly based on the configuration of the
characteristic roots
λ
i
. Since the autoregressive parameters
ϕ
i
’s are always real, the complex
roots can occur only in conjugate pairs. For example, for an ARMA(2,1) model, we have
2
12 1 2
2
12
1
1, 2
(1 ) (1 )(1 )
4
22
BB B B
ϕϕ λ λ
ϕϕ
ϕ
λλ
−− =− −
+
=±
and
112 2 12
,
κ
λλ ϕ λλ
=
+=− (10)
If
2
12
40
ϕϕ
+<, then the roots
λ
1
and
λ
2
must be a complex conjugate pair. Therefore, if we
increase the order by one, allowing odd autoregressive orders, one of the roots will be
forced to be real. Another reason is that increasing the autoregressive order in steps of two is
more economical than in step of one. One fits only half the number of models compared to
the increase by step of one.
Using the above formulation, the experimentally obtained elevation profiles for each scan
were modeled. The critical issue in modeling is to identify the correct model order 2n, that
completely captures the trends (or correlations) in the experimental data. To achieve this,
the model order is continuously increased until the adequate order of the model is
determined based on three criteria (Pandit and Wu, 2001): (1) Verify the independence of the
residuals (the a
t
‘s) of the fitted model by using the autocorrelations of the residuals, i.e., the
chosen model is deemed to completely charaterize the data if the unified correlations
(sample correlation divided by its standard deviation) are less than two which correspond
to 95% probability in a normal distribution; (2) Once the data have been characterized
New Tribological Ways
278
completely, the residual sum of squares (RSS) is made as low as possible by introducing an
F-test parameter that relates the RSS from the current model order 2n to the previous model
order (2n-1) in the computer program. The F-test parameter value is smaller value than the
one from an F-table corresponds to a statistically insignificant reduction in RSS; (3) The
adequate model should capture an obviously known physical frequency, such as the one
corresponding to the size of aggregate on the surface.
4. Analysis of polished and unpolished aggregate surface profiles
4.1 One micron step size scan
Figures 2a and 2b present two typical elevation profiles collected at 1micron step size from
polished and unpolished surfaces of AWI wear track, respectively. Clearly, the vertical scale
in these two plots indicates that the magnitudes of the elevations are significantly different
in both the data, and hence the variance (averaged square deviation from the mean) is
essentially higher for the unpolished surface compared to that on the polished surface. The
unpolished scan also appears to have a more complicated profile than the polished scan.
This is an important physical characteristic that will be utilized in interpreting the model
order in the following DDS analyses.
The data for each scan from the polished and unpolished surfaces was modeled by the DDS
program. The starting model for every scan was ARMA(2,1) and the model order was
increased in steps of 2, until the adequate model that satisfies the three criteria mentioned
above was found. Table 1 and Table 2 present the modeling results for the two scans in
Figures 2a and 2b respectively, with adequate models ARMA(12,11) (for 01a polished
profile) and ARMA(22,21) (for 011 unpolished profile), respectively. Note that since
unpolished scan is generally more complicated than polished one, the adequate model for
unpolished scan usually has a higher order compared to that of the polished surface. In
these tables, the frequency refers to number of cycles per millimeter. The wavelength is the
inverse of this spatial frequency. The damping ratio indicates how well a given wavelength
component of the profile repeats at that frequency in the scan. For example, a damping ratio
of zero indicates a perfect sinusoidal wave extending for infinite time or length. The
maximum damping ratio tending to unity implies that the wavelength component does not
repeat at all. In Figure 2a, there exits a dominant peak that shows up at half shape of a wave
crest at the end. Generally, the dominant peak has the largest height and the largest
wavelength compared to other wave crests or wave troughs, may not repeat in the same
elevation profile and will show up as a real root with very large wavelength in DDS
analysis. The DDS analysis can capture these features effectively. For 1mm scan, this
dominant peak also provides a way to distinguish the difference between polished and
unpolished surfaces in the DDS analysis. These dominant peaks are indicated by bold in the
Tables. In Table 1, the dominant wavelength is 0.433839mm and the corresponding variance
contribution is 2.01E-4 mm
2
, which is less than the dominant contribution of 1.42E-3 mm
2
from the unpolished scan in Table 2. All other wavelengths given in these tables are
significantly smaller with low variance contribution and typically have much smaller
damping ratio indicating that these wavelengths repeat over a long period time. Thus, the
1mm scans capture the microntextural features effectively.
Table 3 presents the modeling results from 10 scans. It is clear that both the variances and
the dominant variance contributions for unpolished surfaces are consistently larger
compared to those of the polished surfaces. Comparison of the dominant wavelengths
Investigation of Road Surface Texture Wavelengths
279
Fig. 2a. 1 micron scan from polished aggregate surface
Fig. 2b. 1 micron scan from unpolished aggregate surface
New Tribological Ways
280
Fig. 3. Microstructure of Port Inland aggregate
obtained from the polished and unpolished surfaces reveals that these wavelengths do not
present any trend implying that the tire polishing did not change the dominant wavelengths
but only the overall variance contribution. Further analysis of Port Inland aggregate reveals
that the dominant wavelengths have a strong relationship with the grain size of the
aggregate. The grain size of the Port Inland aggregate used in this AWI wear track is usually
in the range of 100micron to 500micron and this range seems to agree well with the
dominant wavelengths in Table 3. Figure 3 presents the microstructure of Port Inland
aggregate (The dark area is composed of algae lumps and they have a very fine grain size
around of 2-10 micron, the white area is composed of calcite crystals with grain size around
20-500 micron). It is worth mentioning that for other shorter wavelengths, no trend can be
found from the corresponding contributions when comparing between polished and
unpolished aggregate surfaces is made. Therefore, the dominant wavelengths are the
minimum wavelengths that can provide a trend between the polished and the unpolished
aggregate surfaces in 1mm scans.
4.2 Thirty micron step size scan
In order to explore the effect of other larger wavelengths on the roughness of aggregate
surfaces, 30 micron step size scans were collected from smooth and rough aggregate
surfaces (5 scans from polished, 5 scans from unpolished). Because of the limited size of
each aggregate, the 30 micron step size scans were composed of only 234 sampling points
Investigation of Road Surface Texture Wavelengths
281
Fig. 4a. 30 micron scan from polished aggregate surface
Fig. 4b. 30 micron scan from unpolished aggregate surface
New Tribological Ways
282
extending over 7.02mm in length and were limited to one aggregate surface. Figures 4a and
4b present two typical elevation profiles collected from polished and unpolished surfaces.
Similar to the 1micron step size scans, the vertical scale in these two plots indicates that the
magnitudes of the elevations are significantly different and hence the variance of
unpolished scan is essentially higher than that of the typical polished scan. However, since
aggregate surface is not a flat plane naturally, even on the fully polished surface there still
exist some significant irregularities where the tire rubber neither could contact aggregate
surface entirely nor polish to reduce the height of irregularities. Figure 4a presents the
situation where there are two large wave troughs that are hardly affected by the tire
polishing action. These kinds of troughs may become the dominant wavelengths and affect
the variance of elevation profiles significantly.
Another feature that affects the value of variance contributions may come from a slope in an
elevation profile. In Table 4 and 5, the values of variance seem to present a trend between
polished and unpolished surfaces. However, in Table 5, there are two real roots, one at
1.293mm and the others at 82.44mm wavelength. The dominant wavelength of 82.44mm is
11.7 times the scan length. This indicates that there is a slope in the overall elevation profile
(Figure 4b) which has been effectively captured by the DDS program. Even in a 1mm scan, if
a slope exits for the overall scan, a dominant root will reflect that feature. However, by
carefully selecting a small flat region, likelihood of such a slope in a 1mm scan can be
minimized. This can not be done in a 30mm scan, therefore, the value of variance does not
present a criterion to distinguish the polished and unpolished surfaces. This can also be
confirmed by the variance values in Table 6, where the variances are of comparable order
between polished and unpolished aggregate surfaces. Therefore, the criterion used in
1micron step size scans to distinguish the difference between rough and smooth scans is not
applicable to 30micron step size scans.
Usually, if the damping ratio is less than 10%, Eq. (7) shows that the frequency is nearly
undamped and the component repeats regularly. Its contribution to the variance is given by
Eq.(8) as d
i
for a real root
λ
i
and d
i
+d
i+1
for a complex conjugate pair
λ
i
,
λ
i+1
. Since a 30micron
step size scan is 7 times the scan length of 1micron step size, it is possible that the dominant
wavelength in 1micron step size scan may also appear several times in 30micron step size
scans. Therefore, a new criterion based on damping ratio is introduced in 30micron step size
scan analyses, i. e., contributions from all the wavelengths that have a damping ratio less
than 10%, (see the column “criterion” in Table 4 and 5) are summed up to obtain a partial
contribution (see the column “partial” in Table 4 and 5). Table 6 presents those partial
contributions obtained from 10 such scans as well as the variation ranges of corresponding
wavelengths. Since most of the wavelengths are less than 0.5mm, the texture can be depicted
as ‘microtexture’ and the associated partial contributions physically describe the averaged
squared microtexture roughness. In Table 6, there are two ‘negative’ partial contributions;
the negative signs imply that these contributions have phase opposite to those with positive
contribution. Comparison of the partial contributions between the polished and unpolished
surfaces clearly indicates that polished aggregate line scans have significantly lower ‘partial
contributions’ than those on the unpolished scans. This means that polishing wears away
the micro-roughness present on the original aggregate surfaces. It is also interesting to note
that the microtexture wavelengths satisfying the damping ratio criterion in 30micron step
size are close to the dominant wavelengths in 1micron step size. Thus, both 1micron and
30micron step size scans capture the microtextural features effectively. Another interesting
Investigation of Road Surface Texture Wavelengths
283
feature is that the microtexture wavelengths in the polished scan have a much smaller range
and smaller wavelengths than in the unpolished scans. This means that the polishing effect
is to either chip away or break the larger grains from the original surface due to the traffic.
4.3 Forty-five micron step size scan
In the above 1micron and 30micron step size analyses, the characteristics related to
macrotexture have not been found. The reason is that 1micron or 30micron scan lengths are
too short and span only one aggregate. Therefore, 45micron step size scan was adopted
which spans over 45mm length encompassing several aggregates. Figure 5a and 5b present
two typical elevation profiles collected at 45micron step size from polished and unpolished
surfaces, respectively. It is clear that there are several profiles of aggregate in the two plots
and they all have an average size of around 10 millimeters. Comparison of two elevation
profiles reveals that the scans obtained from unpolished aggregate surfaces appear to be
rougher than those from the polished surfaces. Also, due to the inherent irregularities
present on any aggregate surface, they do not get polished uniformly. Hence every scan
includes some portion of unpolished surface. This will increase the complexity of DDS
model analysis.
It is required to choose every scan line carefully so as to reduce the rough portions included
in any given scan on a polished surface.
Table 7 and Table 8 present the modeling results corresponding to Figure 5a and 5b,
respectively. Note that the model order is significantly smaller for polished scans compared
to that of unpolished scans. The dominant contributions correspond to the largest
wavelengths in these tables are 10.4 mm and 6.64 mm, respectively resulting from real roots.
Fig. 5a. 45 micron scan from polished aggregate surface
New Tribological Ways
284
Fig. 5b. 45 micron scan from unpolished aggregate surface
These two wavelengths indicate physically the average size of the aggregates appearing in
Figure 5. Considering the two tables, except for the largest wavelengths, the other
wavelengths appear to be in the range of microtexture varying from 0.1mm to 0.5mm. It is
once again verified that polishing the aggregate surface dose not change the wavelengths in
the microtexture. To determinate contributions, the same criterion based on damping ratio
as depicted in 30micron step size scans was used to distinguish the contributions between
smooth and rough aggregate surfaces. It can be found from the tables that, when the value
of ‘damping ratio’ is less than 0.1, the corresponding wavelengths are always less than
0.5mm, and these wavelengths agree well with the dominant wavelengths in 1micron step
size scans or the grain size on aggregate surfaces. Therefore the characteristics of the
microtexture can be captured by prescribing the small damping ratio criterion and the
corresponding contribution describes the microtexture roughness. Comparing the two
tables, it is clear that the polished surface has a smaller partial contribution (of the order of
around 10
-7
) and the unpolished one has a higher partial contribution (of the order of
around 10
-4
). Therefore, it appears that polishing reduces the microtexture roughness, but
does not change the microtexture wavelengths significantly.
Table 9 summarizes the modeling results from 10 scans. It is clear that the variance does not
show any trend between polished and unpolished surfaces. This is expected because of the
large contributions that arise from the aggregate surfaces and spaces (troughs) in between
the aggregates in addition to any contribution that may arise from any slope of the overall
surface. These features completely mask the minor contributions arising from the polished
regions. However, the partial contributions that are based on 10% damping ratio criterion
reveal a clear trend between polished and unpolished surfaces, where the unpolished
surface scans have contributions of the order 10
-3
to 10
-4
and the polished surface scans have
Investigation of Road Surface Texture Wavelengths
285
contributions of order 10
-4
to 10
-7
. However, the range of microtexture wavelengths as well
as their overall values is significantly smaller on the polished surfaces indicating that the
polishing effect due to traffic is to either chip away the large particles (or grains) or break
them into smaller fragments.
As mentioned in the introduction, most of the previous publications in the literatures have
focused on obtaining a single number either in terms of MTD or RMS to distinguish
between polished and unpolished surfaces. Although, such a size single number is desirable
for simplicity, it can not provide a more in-depth description of the micro- as well as macro-
textural features that are characteristics of any polishing process. Moreover, comprehensive
descriptions of the evolving wavelengths are desirable for more precise correlations with
any other laboratory of field measurements such as British Pendulum Number (BPN) or
field friction number (FFN) on pavements. Characterization of the evolving micro-texture is
also essential for identification of the wear mechanisms on a given aggregate surface due to
the type or the level traffic, type of mix-designs and age of pavement, the weather
conditions over a period of time or a combination of the above.
However, the aim of the current paper is to introduce a methodology that can be effectively
used on aggregate surfaces to capture the induced micro- as well as the macro-textural
features due to tire polishing. Similar method can be easily extended to analyze the induced
the topological features on the on the pavement surfaces. Pavement surface texture can be
thought of as a combination of microtexture and macrotexture. Friction between tire and
road surface is strongly dependent on surface texture. Microtexture, in particular, plays a
significant role in this interaction. In the previous sections, experimental texture
measurements and DDS modeling methodology were introduced to analyze the polished
and unpolished aggregate surfaces on AWI wear track. The elevation profiles collected from
AWI wear track surface by a laser sensor were modeled and analyzed by use DDS
methodology. Comparison of the modeling results leads to the following conclusions which
are applicable to road pavement surface analyses.
1.
Microtexture with a wavelength in the range of 0.1~0.5mm (which corresponds to the
grain size of Port Inland aggregate) has a significant effect on the roughness of the
aggregate surfaces. All the DDS modeling results for 1micron, 30micron and 45micron
step size scans present the difference of microtexture between polished and unpolished
aggregate surfaces.
2.
For different step size scans, in order to obtain a consistent modeling results, different
criteria have been adopted. For short scans, the dominant wavelength should be
considered (when there is no overall slope in the elevation profile), but for longer scans
the damping ratio criterion should be used.
3.
Compared with other step size scans, 45 micron step size scan can capture both the
macrotexture and the microtexture characteristics and can provide more texture
information than other two scan sizes.
4.
Since the unpolished surface is much more complex than the polished one, the
modeling of the former surface requires a higher order of ARMA model than the latter.
5.
The damping ratio criterion used in this paper is useful in microtexture analysis,
especially for larger scan lengths. It will provide with the microtexture information,
such as wavelengths and roughness resulting from DDS analysis.
6.
Based on DDS analysis, the polishing effect due to traffic is to reduce the microtexture
roughness of aggregate surfaces as well as the range of microtexture.
New Tribological Ways
286
5. Investigation of road surface texture wavelengths
Pavement surface characteristics and traffic conditions are generally recognized as the major
contributors to pavement friction. Statistic on pavement accidents indicates that each year
approximately 15% of accidents that result in injury or fatality occurred during wet weather
conditions. Some of these accidents resulted from loss of friction at the tire-pavement
interface. The tire-pavement interaction has two contributions arising from adhesion and
hysteric components. The adhesion term is interpreted as a thermally-activated molecular
stick-slip action, which is described by a stationary stochastic process. The stationary
stochastic process consists in the formation and breakage of adhesive linking chains that
bind the rubber body to the textured surface (Schallamach, 1963; Chernyak and Leonow,
1986). The hysteric component results from the internal friction and subsequent dissipation
of energy during cyclic deformation of sliding rubber arising from the asperities of rough
substrate which exerting oscillating forces on the rubber surface. Kummer (1966) proposed a
model for rubber friction that considered the above two components of the friction: the
adhesion component based on microtexture and the hysteresis component based on the
macrotexture. Persson (1998) qualitatively presented that the hysteric contribution was
associated with the long wavelength roughness of substrate. The interaction between tire
and substrate deformed the rubber so that it could ‘follow’ the short wavelength roughness
of the substrate when the rubber slid at a low velocity. This deformation would provide an
additional adhesion contribution to the friction. However, recent investigations indicated
that for different type of tires, for example smooth and ribbed tires which are widely
adopted for friction measurements on road surface, the friction measured on the same road
surface will be significantly different. Generally the ribbed tire will present a higher friction
and the smooth tire will result in a lower friction. Yandell and Sawyer (1994) pointed out
that there was seldom agreement between any two different devices that measured friction
on the same surfaces. For example, a runway friction tester and a pavement friction tester
yielded an R-squared value of 0.02 for readings on about 25 wet open-graded textured roads
using ribbed tires and an R-squared value of 0.75 on a large variety of wet asphalt surfaces
using a smooth tire. Whitehurst (1978) also showed a 30 percent variation among seven
different ASTM skid trailers reading identical surfaces. There are many reasons for this poor
agreement, among which are the vagaries of tread rubber behavior. Due to the complexity
of analysis in the tire characteristics of every vehicle to determine the friction between tire
and road surface, it is imperative that pavement surfaces should be designed and
constructed to provide adequate friction to minimize the accident rate as a result of
frictional deficiencies.
Pavement texture is a feature of the road surface that ultimately determines most tire/road
interactions, including wet friction, noise, splash and spray, rolling resistance and tire wear.
The characteristics of pavement texture that affect tire and pavement interactions are
arbitrarily categorized as microtexture, consisting of wavelengths (characteristic
dimensions) of 1 μm to 0.5 mm, and macrotexture, consisting of wavelengths of 0.5 mm to
50 mm. It has been demonstrated that at low slip speeds the effect of microtexture
dominates the friction measurement, whereas at high slip speeds the effect of macrotexture
becomes important. Therefore, if both microtexture and macrotexture are maintained at
high levels, they can provide sufficient resistance to skidding. A recent European study
reports that increased macrotexture reduces total accidents, under both wet and dry
conditions. Kokkalis (1998) also presented a relationship between wet pavement accident
Investigation of Road Surface Texture Wavelengths
287
rate and pavement macrotexture. As expected, when macrotexture increases, the accident
rate is reduced. Fülöp et al. (2000) investigated the relationship between International
Friction Index (IFI) and skid resistance and the relationship between IFI and surface
macrotexture. They developed a relation that the IFI threshold value of friction is a function
of the macrotexture parameter. The theoretical estimations corresponded well to their
experimental results.
On the other hand, more and more researchers believe that microtexture has a substantial
effect on skid resistance and various methods are proposed to evaluate microtexture. Forster
(1994) conducted a study to investigate the quantitative role played by small-scale surface
texture (microtexture) in determining the skid resistance of a pavement. A non contact
image analysis system was used to measure the microtexture profiles on a series of
pavement cores. The measurements of microtexture were correlated to the British Portable
Tester numbers (BPNs) obtained on the same cores. A linear regression fit of these data
based on 87 cores yielded a correlation coefficient (R-squared value) of 0.68. Do et. al. (2000)
adopted the ideas from Fahl (1982) who emphasized that large profile peaks and valleys
play an important role in functional applications and developed a ‘theta angle’ to measure
the microtexture of road surface. The ‘theta angle’ was derived from the two consecutive
peaks and the horizontal between every segment on road surface profile. The theta angle
distribution was used to characterize the microtexture roughness. Correlation between theta
values and friction gave a correlation coefficient R-squared value of 0.8 for 24 data points.
Rohde (1976) demonstrated the importance of microtexture pattern as well as its amplitude
on the load-carrying capability and the descent time of the tread element. Persson and
Tosatti (2000) presented a comprehensive treatment of the hysteric contribution to the
friction for viscoelastic solids sliding on hard substrates with different types of (idealized)
surface roughness. They found that, when rubber is slowly sliding on the surface, at velocity
less than 1cm/s (as in the case to ABS-braking of automotive tires on dry and wet road
surface), the rubber will deform and fill out the nanoscale cavities associated with the short-
ranged surface roughness and this gives an additional contribution to the sliding friction.
Huang (2010) utilized Data Dependent Systems (DDS) approach to model and analyze the
elevation profiles collected from polished and unpolished aggregate surfaces of Aggregate
Wear Index (AWI) wear track. It was revealed that the microtexture roughness of aggregate
surfaces was influenced significantly by tire polishing effect and the DDS approach was able
to capture both the characteristics of microtexture and macrotexture.
Due to the vital role of pavement texture in both pavement friction and tire wear, Michigan
Department of Transportation (MDOT) initiated a research program of pavement texture
analysis in the Center of Transportation Materials Research at Michigan Technological
University. As the second part of this research program, the current work presents a texture
analysis from several bituminous pavement surfaces obtained from Michigan. A total 212
road surface cores from 29 sites on suburban and rural lanes were obtained. From each site,
samples of 6 inch diameter were cored from shoulder, both wheel paths and between wheel
paths. A laser profilometer was used to collect elevation profiles on each core. The Data
Dependent Systems (DDS) methodology (Pandit, 1991) was introduced to model and
analyze the elevation profiles. Similar to the previous investigations on the aggregate
surfaces of AWI wear track, 1 micron and 45 micron step sizes were chosen to measure the
texture. A total of 1,024 readings were taken per individual line scan along the traffic
direction. For bituminous pavement, skid resistance gradually decreases by the polishing
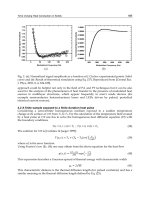
action of traffic. A generally accepted explanation concerning the reduction process is that