Waste Water Evaluation and Management Part 11 potx
Bạn đang xem bản rút gọn của tài liệu. Xem và tải ngay bản đầy đủ của tài liệu tại đây (484.1 KB, 30 trang )
Water Quality of Streams Receiving Municipal Waste Water in Port Harcourt, Niger Delta, Nigeria
289
(R
2
= 0.59). Correspondingly, the faecal coliform concentrations followed similar seasonal
and spatial pattern as observed but concentrations were lower by a magnitude of about 4
times with concentrations for dry season (63.22 ± 7.64 – 103.85 ± 12.83cfu/100ml) being
higher than of the wet season (114.85 ± 7.25 – 155.34 ±28.01cfu/100ml) Table 1.
3.2 Agbonchia
Temperature values were high with wet season (26.43 ± 1.13 - 26.47 ± 1.12
o
C) values not
remarkably different from the dry season (26.83 ± 1.38 - 27.17 ± 0.73
o
C) but spatially
distribution amongst the study stations indicated significant difference in wet season (R
2
=
0.75) while dry season temperature distributions were not significant (R
2
= 0.39) Table 1. In
dry season water pH ranged from slightly acidic to neutral while wet season pH was for all
the stations, above neutral value. Spatial distributions amongst the stations were significant
in dry season (R
2
= 0.99) indicating differences in distribution while wet season values were
not significant (R
2
= 0.25).
Carbon dioxide concentrations were considerably higher in the dry season than in the wet
season with values almost increasing down stream for both seasons and differences between
the stations were significant for wet (R
2
= 0.79) and dry season (R
2
= 0.60). Dy season
concentrations demonstrated closer affinity than that of wet season (Table 1).
Alkalinity values for both seasons increased down stream and were relatively higher in the
dry season (4.50 ± 1.45 - 7.0 ± 3.05 mg/l) than during the wet season (4.22 ± 2.1 - 6.57 ±
2.46mg/l). Spatial differences between stations were positively significant for wet (R
2
= 0.95)
and dry season (R
2
= 0.93). Similarly water hardness increased down stream for both
seasons and concentrations were higher in the wet season (4.93 ± 4.50 - 107.66 ± 131.78mg/l)
than during the dry season (5.12 ± 2.87 - 60.80 ± 76.12mg/l). The distribution between the
stations were significant for wet (R
2
= 0.75) and dry (R
2
= 0.76) seasons.
Highest conductivity concentrations were observed at the down stream stations which are
about 40 - 50 times higher than values observed for the other stations for both seasons.
Concentrations for wet season were relatively higher in the wet (27.67 ± 30.88 - 459 ±
755.54µS/cm) than in the dry season (22.50 ± 8.48 - 409 ± 459.15 µS/cm). Spatial differences
between the stations was significant in wet season (R
2
= 0.56) but not significant in the dry
season (R
2
= 0.20) Table 1.
Dissolved oxygen concentrations were low and generally increased down stream for both
seasons with dry season concentrations generally higher (2.88 ± 0.94 - 5.46± 1.21mg/l) than
in the wet (2.97 ± 0.85 - 4.90 ± 0.64mg/l). Spatial differences between the stations for wet (R
2
= 0.78) and dry seasons were significant (R
2
= 0.87) Table 1.
BOD
5
values were considerably high for both wet (5.75 ± 3.77 - 16.83 ± 5.90mg/l) and dry
(9.62 ± 0.95 - 17.32 ± 0.90mg/l) seasons. The values consistently season increased down
stream in dry season, similarly wet season concentrations at the down stream stations the
recorded highest values. However spatial variations between the stations indicated marked
differences between the stations for dry (R
2
= 0.92) and wet season (R
2
= 0.69) Table 1.
Ammonia concentrations were low for both seasons with wet season (0.26 ± 0.20 - 0.31 ±
0.23mg/l) concentrations being higher than in of the dry season (0.20 ± 0.19 - 0.25 ±
0.22mg/l). However spatial distribution of concentrations amongst stations were significant
in the wet season (R
2
= 0.66) but not significant during the dry season (R
2
= 0.16) Table 1.
Conversely, nitrate concentrations were relatively higher in the dry season (0.53 ± 0.28 - 0.60
± 0.23mg/l) than during the wet season (0.33 ± 0.19 - 0.45 ± 0.51mg/l) and difference
amongst stations were not significant for wet (R
2
= 0.01) and dry season (R
2
= 0.43) Table 1.
Waste Water - Evaluation and Management
290
Sulphate concentrations did not demonstrate any defined spatial distribution pattern within
the seasons but wet season concentrations (1.36 ± 0.76 - 57.51 ± 38.72mg/l) were observably
higher than that of dry season (1.69 ± 1.58 - 21.90 ± 24.24 mg/l). However, the distribution of
concentrations for dry season amongst the stations was significant (R
2
= 0.89) but wet season
distribution was not significant (R
2
= 0.01) Table 1.
Amongst the nutrient variables phosphate had the highest concentrations and values
increased down stream especially during the wet season (Table 1). In addition, wet season
concentrations (3.9 ± 2.4 - 60.25 ± 59.35 mg/l) were higher than values observed for dry
season (8.80 ± 1.65 - 10.25 ± 8.90 mg/l) and the variations amongst the stations for wet (R
2
=
0.76) and dry (R
2
= 0.95) seasons were significant.
The microbial properties defined by total coliform concentrations were relatively higher in
the wet season (85.43 ± 23.78 – 299.51 ± 68.42cfu/100ml) than during the dry season (78.69 ±
34.12 – 210.63 ± 98.57cfu/100ml). The spatial distribution of concentrations amongst the
zones for both seasons demonstrated significant positive relationship with the wet season
(R
2
= 0.83) having closer affinity than the dry season (R
2
= 0.78) The faecal coliform
concentrations demonstrated similar increasing concentration down stream and
concentrations were higher in the wet season (28.66 ± 6.99 – 100. 56 ± 20.12 cfu/100ml) than
during the dry (26.23 ± 7.58 – 70.21 ± 21.90cfu/100ml) with affinity between zones being
significant for both season
3.3 Miniokoro
Temperature values as characteristics of equatorial tropical latitude were high for both dry
(26.84 + 1.04 - 30.33 ± 1.12
o
C) and wet ( 26.22 ± 1.42 - 29.25 ± 1.40
o
C) seasons with dry season
values being relatively higher than in the wet season. The values also increased slightly down
stream (Table 1). Regression analysis indicated that dry and wet season distributions between
the locations were positively significant with affinity between the stations in the dry (R
2
- 0.98)
than in the wet (R
2
= 0.97). pH was acidic and values were almost uniform for dry (5.9 ± 0.54-
6.57 ± 0.41) and wet (6.0 ± 0.41 - 6.35 ± 0.45) seasons(Table 1). The distribution amongst the
stations were not significant for both seasons but dry season values (R
2
= 0.46) demonstrated
closer affinity between stations than during the wet season (R
2
= 0.23).
Carbon dioxide concentration a measure of water acidity was considerably high with values
relatively higher in the wet season (25.23 ± 6.23 - 39.67 ± 26.97mg/l) than in the dry season
(18.57 ± 5.50 - 31.75 ± 12.28mg/l). The distribution of values amongst the stations was not
significant in the dry season (R
2
= 0.16) but significant in the wet season (R
2
= 0.69) Table 1.
Conductivity values increased consistently down stream for both seasons and dry season
(33.34 ± 7.34 - 1831.67 ± 1223.84 µS/cm) values were higher than wet season (35.72 ± 16.22 -
1053.57 ±1205. 89 µS/cm). Similarly alkalinity values increased down stream with dry
season ( 7.17 ± 1.87 - 31.84 ± 8.31mg/l) concentrations being higher than that of wet season
(7.0 ± 2.56 - 23.86 ± 10.31mg/l) Table 1.
Chloride concentrations increased down stream by several magnitudes as was observed for
alkalinity and conductivity. However, wet season (1.0 ± 0.65 - 314.66 ±
133.93mg/l)concentrations were higher than dry season (1.07 ± 0.74 - 192.48 ± 167.27mg/l)
and distribution amongst the stations were similar for wet (R
2
= 0.76) and dry (R
2
=
0.77)seasons were significant . Hardness concentrations were higher in the dry season (10.88
± 9.88 - 161.20 ± 80.45mg/l) than in the wet (19.06 ± 18.4 - 137.62 ± 86.91mg/l). The
relationship between the stations indicated significance between the stations for both
Water Quality of Streams Receiving Municipal Waste Water in Port Harcourt, Niger Delta, Nigeria
291
seasons but dry season (R
2
= 0.86) had closer affinity between the stations than in the wet
season (R
2
= 0.76)
Dissolved oxygen concentrations were generally high and increased exponentially from
upstream to the down stream for dry and wet seasons. Concentrations were slightly higher
in the dry season than in the wet season (2.56 ± 0.88 - 5.12 ± 1.55mg/l) and distribution for
both dry(R
2
= 0.80) and wet ( R
2
= 0.79) seasons demonstrated similar close affinity between
station (Table 1).
Biochemical oxygen demand followed a similar sequence of increased concentrations down
stream relatively higher concentration being observed in the dry season (23.28 ± 3.59 - 33.85
± 5.85mg/l)than in the wet (12.92± 4.67 - 22.66 ± 5.63mg/l) Table 1.
Generally nutrient concentrations are low and amongst the nutrient variables only Sulphate
demonstrated increasing concentrations from up to down stream. Others such as Phosphate,
and Ammonia, had higher concentrations upstream than in other stations. Sulphate had the
highest concentrations amongst the nutrient variables with dry season (0.91 ± 0.2 - 45.53 ±
29.30mg/l) concentrations being higher than the wet season (0.92 ± 0.19 - 34.25 ± 21.78mg/l)
concentrations and distribution of concentrations amongst the stations for both season were
significant (R
2
= 0.75) Table 1.
Nitrate concentrations for dry and wet seasons, were 0.55 ± 0.24 - 0.66 + 0.28mg/l and 0.35 ±
0.16 - 0.49 ± 0.22mg/l respectively. The differences in distribution for wet and dry seasons
were not significant with wet season (R
2
= 0.22) demonstrating closer affinity between the
stations than the dry season (R
2
= 0.09). Ammonia concentrations were higher in the dry
season (0.42 ± 0.5 - 0.91 ± 0.39mg/l) than in wet season (0.35 ± 0.16 - 0.49 ± 0.22mg/l) with
the middle reach stations having the highest concentrations for both seasons. The
relationship between the stations for wet (R
2
= 0.89) and dry (R
2
= 0.99) seasons where
significant with dry season having closer affinity than the wet season. The differences in
phosphate concentrations for dry (0.12 ± 0.09 - 0.2 ± 0.26mg/l) and wet season (0.10 ± 0.38 ±
0.29mg/l) seasons were not remarkable but the affinity between the stations were more in
the wet season (R
2
= 0.95) than in the dry season (R
2
= 0.50)
As was observed in the other stream systems total coliform concentrations recorded higher
counts during the wet season (302.33 ± 52.18 – 588.77 ± 96.42cfu/100ml) than in the dry
(235.12 ± 45.23 – 466.81 ± 56.41cfu/100ml) and spatial distribution of concentrations
amongst the three zones for both wet (R
2
=0.91) and dry(R
2
=0.94) seasons were
significant(Table 1). The faecal coliform count followed the same increasing concentration
pattern down stream in dry season with somewhat different order in the wet season but
wet season (201.45± 15.34 – 197.56 ± 28.35cfu/100ml ) concentrations being higher than those
of dry season (78.37 ± 10.05 – 155.60 ± 12.56 cfu/100ml). In spite of the relative high values
recorded in the wet season differences between the zones were not significant (R
2
= 0.02) but
dry season distribution were significant(R
2
= 0.94) Table 1.
3.4 Miniweja
Surface water temperatures were high with dry season (28.13±0.98 – 30.58±1.49
o
C) values
being relatively higher than in the wet season (26.72±1.13 -28.29±2.49
o
C) and temperature
tended to increase down stream for both seasons (Table 1). Dry season values (R
2
= 0.87)
amongst the stations displayed closer affinity than during the wet season (R
2
= 0.76). pH
was slightly acidic for wet(6.25 ± 0.27- 6.37 ± 0.34) and dry (6.24 ± 0.35 - 6.58) seasons and
differences between stations were significant with wet season(R
2
= 0.95) demonstrating
Waste Water - Evaluation and Management
292
closer affinity between stations than the dry season (R
2
= 0.80) Table 1. Carbon dioxide
concentrations were higher in wet season (36.74 ± 17.07 - 40.88 ± 13.37mg/l) than during the
dry season (26.39 + 4.63 - 35.10 + 9.59mg/l) and distribution of concentrations between the
stations showed closer affinity in the wet season (R
2
= 0.91) than in the dry season (R
2
=
0.89). Surface water alkalinity generally increased down stream and ranged from 11.84 ±
2.86 - 32.50 ± 23.65mg/l and 12.07 ±3.22 - 24.72 ± 10.88mg/l for dry and wet seasons
respectively (Table 1). The relationships between the stations were positively significant
with stations in the wet season (R
2
= 0.;96) having closer affinity than in the dry season (R
2
=
0.90). Similarly conductivity values were exceptionally high and increased down stream
with higher concentrations occurring during the dry season (2263.85 ± 2433.75 - 17190.85 ±
16075.35µS/cm) than at the wet period (543 ± 1196.95- 7888.60 ± 9742.30µS/cm) Table 1.
Affinity between stations was significant for wet (R
2
= 0.93) and dry (R
2
= 0.93) season.
Hardness concentrations were high and spatial and seasonal concentrations pattern of
increasing values down stream and higher concentrations in the dry season (333.12 ± 335.97
- 1438.72 ± 1367.80mg/l) against the wet season ( 183.41 ± 287.88 - 1380.35 ± 1575mg/l)as
was observed for conductivity. The relationships between the stations for wet (R
2
= 0.99)
and dry (R
2
= 0.96) seasons were positively significant.
Dissolved oxygen concentrations for wet and dry seasons were in the ranges of 3.64 ± 1.20 -
6.44± 2.93mg/l and 3.24 ± 1.01 - 6.91 ± 3.01mg/l respectively (Table 1) Differences between
stations were significant with dry season (R
2
= 0.93) having closer affinity than wet season
values (R
2
= 0.80). Similarly BOD
5
concentrations increased downstream and concentrations
were relatively higher during the dry season (18.72 ± 5.74 - 25.56 + 6.58mg/l) than in the wet
season (11.65 ± 5.83 - 14.62 ± 6.67mg/l) Table 1.
High chloride concentrations were observed with relatively higher concentrations in the dry
season (446.03 ± 495.13 - 2708.49 ± 2391.26mg/l) than during the wet season (99.15 ± 243.18 -
1380.35 ± 2118.31mg/l) and differences between stations for wet (R
2
= 0.99) and dry (R
2
=
0.97) seasons were significant. Suphate for dry season ( 61.81 ± 70.84 - 603.01 ± 486.05mg/l)
were higher than concentrations in the wet season (18.64 ± 42.17 - 199.91 ± 272.36mg/l) and
variations amongst stations for wet (R
2
= 0.89) and dry (R
2
= 0.97) seasons were significant.
Ammonia concentrations were relatively higher in the dry season ( 0.19 ± 0.18 - 0.45 ±
0.42mg/l) than during the wet season (0.29 ± 0.21 - 0.38 ± 0.42mg/l) and variations between
stations were only significant in the wet season (R
2
= 0.55) but not significant during the dry
season (R
2
= 0.22). Nitrate concentrations appeared relatively higher in the wet season than
in the dry and ranged from 0.68 ±0.18 - 0.81 ± 0.31mg/l and 0.61 ± 0.27 - 0.91 ± 1.33mg/l for
dry and wet seasons respectively. The affinity between stations were higher in the dry
season (R
2
= 0.93) than during the wet season (R
2
= 0.50). Similarly phosphate concentrations
spatially tended to increase down stream and wet season concentrations were higher than
that of the dry season (0.13 ± 0.12 - 0.15 ± 0.14mg/l),seasonal differences amongst the
stations were significant (R
2
= 0.99) for both seasons(Table 1).
Total coliform distributions exhibited obvious seasonal changes (Table 1) with Dry season
(342.00 ± 45.34 – 533.00 ± 76.80cfu/100ml) concentrations being relatively lower than wet
season concentration (621.86 ± 76.33 – 782.15 ± 95.83cfu/100ml). However the distribution of
concentrations amongst the stream course was significant in dry season (R
2
= 0.98) but not
significant in wet season (R
2
= 0.98). Faecal coliform recorded lower concentrations against
the total coliform with similar seasonal trend such that dry season (114.00 ± 10.07 – 177.54 ±
17.06 cfu/100ml; R
2
= 0.98) concentrations were lower than that of wet season (208.63 ± 22.45
– 296.39 ± 28.18 cfu/100ml; R
2
= 0.37)
Water Quality of Streams Receiving Municipal Waste Water in Port Harcourt, Niger Delta, Nigeria
293
3.5 Ntawogba
surface water temperature values were generally high with mean values ranging from 26.83
± 0.44 -27.08 ± 0.21 in wet season while dry season values ranged from 27.75 ± 0.32o -28.17
± 0.31oC(Table 1). Spatial variation between stations demonstrated significance for both
seasons with affinity between the stations being closer in the wet season ( R
2
= 0.96) than
during the dry season (R
2
= 0.57).
The pH was slightly acidic for both seasons and differences between the seasons were
minimal and values ranged from 6.46 ± 0.16 - 6.57 ± 0.18 and 6.17 ±0.03 - 6.29± 0.05 for wet
and dry seasons respectively (Table 1). Spatial differences between the study stations for wet
(R
2
= 0.10) and dry (R
2
=0.10) seasons were not significant. Carbon dioxide concentrations for
wet and dry seasons stood at 25.82 ± 11.88 - 38.1 ± 19.52mg/l and 11.79 ± 4.49 - 24.42 ±
16.48mg/l and differences amongst the stations were significant demonstrating more
affinity in the dry season (R
2
= 0.69) than during the wet season (R
2
= 0.67).
Conductivity values were high, ranging from 188.25 +15.17 - 265.0 ±25µS/cm in the wet
season and 251.67 ± 17.69 - 375.08µS/cm in dry season (Table 1). There were relative
differences on spatial basis with values increasing down stream and seasonal differences
amongst stations were significant with dry season (R
2
= 0.90) demonstrating closer affinity
amongst the stations than during the wet season (R
2
= 0.90).
Alkalinity values for wet and dry seasons increased down stream with higher
concentrations recorded in the dry (62.83 + 13.10 - 89.67 + 16.67mg/l) than during the wet
season (10.08 ± 1.76 - 14.00 ± 2.25mg/l) and spatial differences between the stations
demonstrated significance for wet (R
2
= 0.96) and dry season (R
2
= 0.97).
There was no clear spatial trend demonstrated in the dissolved oxygen distribution other
than the fact that the highest concentrations occurred at the upper limit station for both
seasons (Table 1) differences between the stations were significant (R
2
=0.61) while dry
season differences between stations were not significant (R
2
= 0.26). In all, concentrations
were relatively higher in the wet season (6.50 ± 0.50 - 8.42 ± 0.80 mg/l) than during the dry
(5.55 ± 0.48 - 7.35 ± 0.65mg/l). BOD
5
concentrations increased almost exponentially down
stream with differences in concentrations between wet and dry seasons being 13.45 ± 3.50 -
37.86 ± 8.54mg/l and 26.45 ± 9.67 - 55.25 ± 7.44mg/l respectively. The stations demonstrated
similar significant differences for wet (R
2
= 0.98) and dry (R
2
= 0.99) seasons
Ammonia concentrations similarly increased downstream for wet and dry seasons and
concentrations were higher in the dry season (0.85±0.14 - 2.10 ± 0.22mg/l) than during the
wet season (0.41 ± 0.15 - 0.47± 0.23mg/l) Table 1. Spatially, concentrations between stations
were significant during both seasons with stations having closer affinity during the wet
season (R
2
= 0.98) than during the dry season (R
2
= 0.57). Sulphate concentrations were in
magnitude of about two times higher in the dry (10.40 ± 2.40 - 13.69 ±3.99mg/l) than in the
wet season (4.34 ± 1.60 - 5.78 + 1.36mg/l) and concentrations increased down stream during
both seasons. Significant differences were observed amongst the stations for both seasons
with affinity between stations being observed during the dry season (R
2
= 0.98) than during
the wet season (R
2
= 0.53). Nitrate concentrations were comparably high with steady
increase in concentration from upstream to down stream station. The differences between
stations were significant with closer affinity being observed in the dry season (R
2
= 99) than
in the wet (R
2
= 98). Similarly, phosphate concentrations demonstrated an increasing
concentrations from upstream to the downstream limit and differences between stations
were significant with closer affinity being observed in the wet season (R
2
= 0.91) than during
Waste Water - Evaluation and Management
294
the dry (R
2
= 0.81). Dry season (0.62 ± 0.09 - 0.99 ± 0.20mg/l) concentrations were higher
than that of the wet season (0.41 ± 0.15 - 0.70 ± 0.23mg/l) Table 1.
4. Discussion
Generally, the stream systems maintained high temperature values for both wet and dry
seasons and this is a common characteristic reported for the Niger Delta waters (RPI, 1985,
NES, 2000) which are located at the equatorial latitude where temperature is consistently high
all the year round. In all, a number of associations emerged with temperature such that during
the wet season, a strong positive correlation between temperature and Alkalinity (r = 0.69),
conductivity (r
2
=0.61), hardness (r =0.60), DO (r
2
=0.73), BOD (r
2
=0.55), So
4
(r
2
=0.61) TC (r
2
=0.76) and FC (r
2
=0.58) Table 2. Similarly, in dry season temperature had significant positive
correlation with conductivity (r
2
=0.82), Hardness (r
2
=0.82), DO (r
2
=0.63), BOD (r
2
=0.72), SO4
(r
2
=0.76) Total coliform (r
2
=0.77) and faecal coliform (r
2
=0.78) but negative association was
observed for dry season period between temperature and carbon dioxide (r
2
= -0.56) Table 3.
The acidity of a water body is an important factor that determines the suitability of water for
various purposes, including toxicity to animals and plants. With the exception of Agbonchia
stream whose ph varied from slightly acidic to neutral, the stream systems under study
were slightly acidic , showing no consistent spatial and seasonal trends. It is pertinent to
observe that while the general values of the water bodies may appear alright comparable to
WHO (19 84)limits for potable water the values for such systems in the past had been in the
range of 4.5 – 6.0 and 4.8 – 6.5 for wet and dry seasons respectively(NDBDA,1987, Igbinosa
and Okoh, 2009). The present pH values are considered high for such soft acid water bodies
draining forested wet land with leaf litter that impact humic acid substances that give it the
low acidity. The change in pH observed which rather tended toward neutrality might be
due to decreased forest floor drainage area, washing of concrete structures during storm
and increasing draining of domestic effluent water to the stream.as well as influence of
brackish water. pH in the wet season was observed to have significant positive correlation
with PO
4
(r
2
=0.58), and negatively correlated with total coliform (r
2
=-0.61) and FC ( r
2
=-
0.65)Table 2 while in the dry season, pH positively correlated only with PO
4
(r
2
=0.53) and
negatively correlated with CO
2
(r
2
=-0.57) Table 3.
Conductivity is a measure of the ability of an aqueous solution to carry an electric current.
This ability depends on the presence of ions; on their total concentration, mobility, as well as
valence; and the temperature of measurement. The relationship with other parameters of
note are the positively correlated with hardness (r
2
=0.97), DO (r
2
=0.65), BOD
5
(r
2
=0.58),
NO
3
(r
2
=0.55), SO
4
(r
2
=0.96), TC (r
2
=0.69) in the wet season but in the dry season, significant
positive associations were observed between conductivity and DO (r
2
=0.60), BOD
5
(r
2
=0.64), SO
4
(r
2
=0.84), TC (r
2
=0.72) and FC (r
2
=0.72) (Table 2 and 3)
Total hardness of all the water bodies showed higher concentration in the dry season than in
the wet season. this is primarily due to reduced inflow and evaporation, while the relative
lower concentrations observed may be attributed to increasing inflow and dilution.
However to high hardness generally observed in the water bodies may in part be associated
the the concrete structure covering the path of the stream. Hardness was found to positively
correlation with DO (r
2
=0.67), NO3 (r
2
=0.60), SO4 (r
2
=0.97),TC (r
2
=0.69), and FC (r
2
=0.50)
in wet season but in dry season slight variation in the relationships between the attributes
such as the positive correlation with DO (r
2
=0.58), BOD (r
2
=0.66), SO4 (r
2
=0.81), TC (r
2
=0.74) and FC (r
2
=0.75) Tables 2 and 3.
Water Quality of Streams Receiving Municipal Waste Water in Port Harcourt, Niger Delta, Nigeria
295
Negatively significant
Positively significant
Wet season
T
o
C pH CO
2
ALKALINITY CONDUCTIVITY HARDNESS DO BOD
5
NH
4
-N NO
3
-N SO
4
2
- PO
4
- P Total Coliform Faecal Coliform
T
o
C 1
pH -0.33 1
CO
2
-0.21 -0.49 1
ALKALINITY 0.69 -0.14 -0.12 1
CONDUCTIVITY 0.61 -0.11 -0.22 0.66 1
HARDNESS 0.60 -0.14 -0.12 0.60 0.97 1
DO 0.73 0.05 -0.03 0.54 0.65 0.67 1
BOD
5
0.55 -0.13 -0.21 0.81 0.58 0.47 0.42 1
NH
4
-N 0.31 -0.06 0.07 0.82 0.20 0.14 0.21 0.63 1
NO
3
-N 0.41 -0.24 0.23 0.53 0.55 0.60 0.43 0.26 0.23 1
SO
4
2- 0.61 -0.05 -0.15 0.58 0.96 0.97 0.72 0.43 0.09 0.58 1
PO
4
- P -0.32 0.58 -0.12 -0.25 -0.14 -0.13 0.06 0.07 -0.21 -0.29 -0.15 1
Total Coliform 0.76 -0.61 0.25 0.70 0.69 0.69 0.56 0.58 0.35 0.68 0.65 -0.32 1
Faecal Coliform 0.58 -0.65 0.49 0.59 0.44 0.50 0.37 0.38 0.41 0.58 0.45 -0.35 0.87 1
Table 2. The correlation coefficient between the physicochemical and biological variables in
the wet season
Waste Water - Evaluation and Management
296
T
o
C pH CO
2
ALKALINITY CONDUCTIVITY HARDNESS DO BOD
5
NH
4
-N NO
3
-N SO
4
2
- PO
4
- P Total Coliform Faecal Coliform
T
o
C 1
pH 0.25 1
CO
2
-0.56 -0.57 1
ALKALINITY 0.40 0.46 -0.67 1
CONDUCTIVITY 0.82 0.33 -0.43 0.25 1
HARDNESS 0.82 0.34 -0.44 0.28 1.00 1
DO 0.63 0.28 -0.19 -0.17 0.60 0.58 1
BOD
5
0.72 0.17 -0.63 0.56 0.64 0.66 0.22 1
NH
4
-N 0.16 0.38 -0.57 0.95 0.11 0.14 -0.40 0.47 1
NO
3
-N 0.27 -0.31 0.23 -0.30 0.06 0.05 0.52 -0.04 -0.41 1
SO
4
2- 0.76 0.18 -0.24 0.13 0.84 0.81 0.65 0.29 -0.08 0.21 1
PO
4
- P -0.42 0.53 0.02 -0.26 -0.26 -0.26 0.21 -0.49 -0.23 -0.14 -0.24 1
Total Coliform 0.77 0.26 -0.59 0.57 0.72 0.74 0.18 0.88 0.49 -0.01 0.47 -0.55 1
Faecal Coliform 0.78 0.29 -0.64 0.67 0.72 0.75 0.16 0.90 0.58 -0.06 0.47 -0.55 0.99 1
Table 3. The correlation coefficient between the physicochemical and biological variables in
the dry season
Water Quality of Streams Receiving Municipal Waste Water in Port Harcourt, Niger Delta, Nigeria
297
Dissolved oxygen is one of the most vital factors in assessing stream quality. Its deficiency
directly affects the ecosystem of a stream due to several factors which include physical,
chemical, biological and microbiological processes. DO is needed to support biological life
in aquatic systems. The levels observed for the study streams are so low that they may not
sufficiently support aquatic life including fish. This objectionable low concentration
occurred at both seasons, may be associated with the municipal discharges and the
attendant organic load and utilization in bacterial decomposition of organic matter. DO in
wet season correlated significant with SO
4
(r
2
=0.72), and TC (r
2
=0.56) and in the dry season
such associations were observed with NO
3
(r
2
=0.52) and So
4
(r
2
=0.65) Tables 2 and 3.
Biological oxygen demand, being a measure of the oxygen in the water that is required by
the aerobic organisms and the biodegradation of organic materials exerts oxygen pressure
in the water and increases the biochemical oxygen demand (Abida, 2008). Streams with low
BOD
5
have low nutrient levels; and this may account for the general low nutrient status of
the stream in most cases.
The increased concentration of BOD
5
implies that oxygen is swiftly depleted in the streams.
The consequences of high BOD
5
concentrations are the same as those for low dissolved
oxygen: thus organisms are prone to stress, suffocate, and possibly death. In wet season,
BOD
5
correlated with NH
4
(r
2
=0.63)and TC (r
2
=0.58) while in dry season the relationships
that emerged were significant positive correlation with TC (r
2
=0.88) and Fc (r
2
=0.90) Tables
2 and 3.
Ammonia, a transitional nutrient, generally recorded higher values in the dry season than in
the wet season. The distribution of concentration followed a pattern of Nta Wogba >
Minchida > ,Minweja > Minikoro > Agboncha in the dry season and in the wet season a
slight shift was observed such that the concentration sequence being Nta Wogba >
Miniokoro> Minichida > Miniweja > Agboncha
Similarly the same seasonal differences were observed in the distribution of nitrate with
higher concentrations in the dry season than in the wet season and the distribution of
concentrations being in the decreasing order of Miniweja > miniokoro > Agboncha > Nta
wogba > Minichida and Minweja > Ntawogba > Miniokoro >Minichida =Agboncha for dry
and wet season periods respectively
The sulphate was the highest of all the nutrients in the different stream and it is considered
major composition of seawater following the role of municipal and industrial wastes on
sulphate addition to of surface water bodies. The distribution of sulphate concentrations
followed a decreasing order of Miniweja stream > Ntawogba stream > Miniokoro stream >
Aboncha stream > Minichida stream and Miniweja stream > Ntawogba stream > Agbonchia
stream > Miniokoro stream > Minichida stream for dry and wet seasons. However, it is
pertinent to note that values observed for Miniweja and Ntawogba were by hundreds of
magnitude higher than values observed in the other stream systems
Phosphates as with nitrates are important in assessing the potential biological productivity
of surface waters. Increasing concentration of phosphorus and nitrogen compounds in
streams or rivers may lead to eutrophication. In this study higher concentrations were
recorded in the wet season than in the dry seasons for all the streams and concentrations
were considered normal for all the streams except at Agboncha stream in which the
distribution of concentration followed a declining order of Agboncha stream > Nta wogba
stream > Miniokoro stream >Miniweja stream > Minichida stream and Agboncha stream >
Ntawogba stream > Miniokoro stream > Miniweja stream > Minichida stream for dry and
wet seasons respectively. The high phosphate value in Agboncha stream may be related in
part to Abattoir discharges and petrochemical waste discharges into the system.
Waste Water - Evaluation and Management
298
The comparison of the variables for the streams using 2 -way Analysis of variance
(ANOVA) for the upper limit stations in the wet season demonstrated non significance
between the variables (ANOVA = 2.06 , < F (2.08
(0.05)
) and between streams (ANOVA = 1.88
< F = 2.61
(0.05)
) Table 4. The middle reach limits of the streams also demonstrated non
significance for the variables (ANOVA= 1.15 < F = 2.08
(0.05)
) and between streams (ANOVA
= 1.34 < F = 2.61
(0.05)
) Table 4. The downstream limits demonstrated a contrary pattern with
significance been observed for the variables (ANOVA = 3.06 > F = 2.15
(0.05))
but stream
differences were also not significant (ANOVA = 1.33 < F = 2.63
(0.05)
) Table 4.
Upstream limits
Source of Variation SS df MS F P-value F crit
Variables
97035.61 10 9703.561 2.06 0.05 2.08
Water bodies
35111.77 4 8777.944 1.879257 0.13 2.61
Error
186838.6 40 4670.966
Total
318986 54
Middle Reach limits
Source of Variation SS df MS F P-value F crit
Variables
7180969 10 718096.9 1.15 0.35 2.08
Streams
3346749 4 836687.2 1.34 0.27 2.61
Error
24964554 40 624113.9
Total
35492272 54
Down Stream limits
Source of Variation SS df MS F P-value F crit
Variables
87980538 9 9775615 3.06 0.01 2.15
Stream
16958067 4 4239517 1.325206 0.28 2.63
Error
1.15E+08 36 3199139
Total
2.2E+08 49
Table 4. The 2 way Analysis of variance comparing the variables and the streams at different
limits in the wet season
Similar trend was observed in the dry season with differences between variables (ANOVA =
1.38 < F = 2.08
(0.05
) and the streams (ANOVA = 1.40 < F = 2.61
(0.05
) for the upper limit
stations were not significant. The middle reach limits also demonstrated same pattern as
observed with the upper limit with differences between the variables (ANOVA = 1.30 < F =
2.08
(0.05
) and the streams (ANOVA = 1.25 < F = 2.61
(0.05
) not being significant. The down
stream limit demonstrated that the differences between the variable (ANOVA = 2.96 <
F = 2.08
(0.05
) were significant but differences between the streams (ANOVA = 1.24 <
F = 2.61
(0.05
) were not significant (Table 5).
Water Quality of Streams Receiving Municipal Waste Water in Port Harcourt, Niger Delta, Nigeria
299
Upstream limits
Source of Variation SS df MS F P-value F crit
Parameters
1185660 10 118566 1.38 0.23 2.08
Streams
482331.8 4 120582.9 1.40 0.25 2.61
Error
3441178 40 86029.46
Total
5109170 54
Middle stream limits
Source of Variation SS df MS F P-value F crit
Parameters
38261014 10 3826101 1.30 0.27 2.08
Streams
14808576 4 3702144 1.25 0.30 2.61
Error
1.18E+08 40 2950478
Total
1.71E+08 54
Down stream limits
Source of Variation SS df MS F P-value F crit
Parameters
3.63E+08 10 36281955 2.96 0.01 2.08
Streams
60805895 4 15201474 1.24 0.31 2.61
Error
4.91E+08 40 12271158
Total
9.14E+08 54
Table 5. The 2 way Analysis of variance comparing the variables and the streams at
different limits in the dry season
The five streams have similar physiochemical characteristics apparently because they drain
from analogous freshwater systems upstream through the stretch of the city into brackish
water systems of the Bonny estuary downstream. The study shows that conductivity values
are only higher in dry season in Miniweja out of other streams where the values are
generally lower in dry season. The reason could be as a result of the study area of Miniweja
being more influenced by brackish water than in any other stream. Minichinda, Nta wogba,
Miniokoro and Agboncha streams appear to have more influence of the municipal waste
water during wet season.
The similarities in characteristics of the streams are further demonstrated by apparently
similar pH values obtained. Naturally, the upstream stations are expected to have much
more acidic pH values as a result of vegetation and humic substance released into the forest
systems (RPI, 1985, Chindah et. al., 1999, Chindah, 2003, Obunwo, et. al., 2004). Then the pH
value increases gradually to become more alkaline as the down stream stations of are
approached to the influence of brackish water (RPI, 1985, NDES, 2000, NDDC, 2004 and
Izonfuo et. al., 2005). However, in the study, the pH values are apparently uniform with only
slight spatial differences indicating that the wastes along the course of the stream have
altered the characteristics (Brion and Billen (2000).
Nutrient concentrations are generally low except at the down stream of Miniweja stream
where phosphate concentrations were very high. The reason for the general low nutrient
concentrationin-spite of the organic load received by the systems may be due to both the
Waste Water - Evaluation and Management
300
high temperature and microbial properties of the water body. Organisms in tropical water
bodies are known to quickly use up the nutrients under high temperature condition
(Chindah and Braide, 2004 and Chindah et. al., 2005).
This effect is also observed in other parameters. For example, the general low dissolved
oxygen concentrations in most streams and the relatively higher values of oxygen recorded
in the upstream stations comparative to the mid and down stream stations implies the
depletion of oxygen along the water course as it flows down stream. This may suggest that
the more waste inputs are received by the streams the more its dissolved oxygen
concentration declines. Conversely the BOD
5
values are very high and generally increased
down stream. This supports the contention that the increased waste load into the system
degrades the water quality as the BOD
5
values far exceed concentrations reported in the
baseline studies of some of these streams (NDBDA 1987, and Ogan 1988) Therefore it is our
contention that the low oxygen concentrations recorded and the high BOD
5
values for all the
streams are strong evidence to suggest the impact of organic load introduced from
municipal waste into the streams (Rim-Rukeh et. al., 2007, Hill et. al., 2005 and Chen, 2010).
Similarly other indices implicating municipal waste discharges on the stream systems are
the high total coliform and faecal coliform concentrations observed in the water bodies
which are below concentrations recorded in most of the systems in the past studies (Amadi
et. al., 1997, Odokuma and Okpokwasili, 1997 and Ogan 1988). The present total coliform
and faecal coliform concentrations indicate the seriousness of the impact of municipal waste
water on receiving surface waters and the health hazards implication to ignorant users
especially children (Braide et. al., 2004, Okoh et. al., 2005 and 2007). The study shows that the
rapid growth of Port Harcourt and associated municipal wastes introduced into the five
main steams have caused the deterioration of the water quality of the streams and therefore
presents the need for a better waste management system (Chen, 2010).
5. References
Amadi, E. N., Chindah, A. C and Ugoh C. C. (1997). The Effect of Municipal Profainage on
The Microflora Of A Black Water Stream In Port Harcourt, Nigeria. Niger Delta
Biologia , 2 (1 ) , 125 – 139.
APHA- American Public Health Association (1998). Standard methods for the examination
of water and waste water. 20
th
ed. APHA-AWWA-WPCF. Washington DC. 1220p.
Braide, S.A., Izonfuo, W.A.L., Adiukwu,P.U., Chindah, A.C., and Obunwo, C.C.
(2004).Water quality of Miniweja stream, a swamp forest stream receiving non
point source waste discharges in eastern Niger Delta, Nigeria. Scientia Africana,
3(1) 1-8.
Brion, N. and Billen, G. (2000). Wastewater as a source of nitrifying bacteria in river
systems: the case of the River Seine downstream from Paris. Wat. Res. 34, (12):.
3213-3221,
Chen G., Cao X. Song C. and Zhou Y. (2010). Adverse Effects of Ammonia on Nitrification
Process: the Case of Chinese Shallow Freshwater Lakes. Water Air Soil Pollut.
210:297–306.
Chindah, A. C; Hart A. I. and Atuzie B (1999). A preliminary investigation on the effects of
municipal waste discharge on the macrofauna associated with macrophytes in a
small fresh water stream in Nigeria. Afri. J of Applied Zool. 2, 29 - 33.
Water Quality of Streams Receiving Municipal Waste Water in Port Harcourt, Niger Delta, Nigeria
301
Chindah, A.C. (2003). The physico-chemistry phytoplankton and periphyton of a swamp
forest streams in the lower Niger Delta. Scientia Africana 2(1&2) 106-116.
Chindah, A.C. and Braide, S. A (2004). The physicochemical quality and phytoplankton
community of tropical waters: A case of 4 biotopes in the lower Bonny River, Niger
Delta, Nigeria. Caderno de Pesquisa . Ser. Bio. Santa Cruz do Sul Vol 16 (2), 7-37.
Chindah, A. C., Braide, S. A. and Izundu, E. (2005). Treatment Of Municipal Wastewater
Quality Using Sunlight. Caderno de Pesquisa . Ser. Bio. Santa Cruz do Sul Vol 17 (2),
27-45.
Chindah, A.C., Braide, S.A., Amakiri, J., Izundu, E. (2007).Succession of phytoplankton in a
municipal waste water treatment system under sunlight. Revista Cientifica UDO
Agricola 7(1): 258-273.
Chindah, A.C., Braide S.A, Amakiri J.and Ajibule O.O.K. (2009). Periphyton Succession in a
waste water treatment pond. Revista UDO Agricola 9(3): 672 – 680.
Gobo, A.E.(1988) Relationship Between Rainfall Trends And Flooding In The Niger -Benue
River Basins J. Meteorol U.K.; 13 (132): 220-24.
Gobo, A.E., Ubong, I.U., Ede, P.N . (2008). Rainfall intensity analysis as a tool for
hydrological and agricultural practises in Southern Nigeria. The internat J.
Meterol.; 33(334): 343-50.
Hill, D.D., Owens, W.E., and Tchounwou, P.B.C. (2005). Comparative assessment of the
physico-chemical and bacteriological qualities of selected streams in Louisiana. Int J
Environ Res Public Health. 2(1):94-100.
Igbinosa, E. O. and Okoh, A. I. (2009) Impact of discharge wastewater effluents on the
physico-chemical qualities of a receiving watershed in a typical rural community.
Int. J. Environ. Sci. Tech., 6 (2), 175-182.
Izonfuo, W.A.L., Chindah, A. C., Braide, S.A., and Lawson D. A.(2005). Physicochemical
Characteristics of Different Ecotonal Streams In A Rapidly Developing Metropolis
In The Niger Delta, Nigeria . Caderno de Pesquisa . Ser. Bio. Santa Cruz do Sul Vol
17 (2), 91-105.
Lakatos G.; M. K. Kiss, M. Kiss and P. Juha´sz. (1997). Application of constructed wetlands
for wastewater treatment in Hungary. Wat. Res. 15 (5): 341-346. laundary
detergents. Chemosphere 17: 2175-2182.
Musaddiq, M.(2002). Surface water quality of Morna river at Akolaa. Pollut. Res.,19(4), 685-
691.
NDBDA- Niger Delta Basin Development Authority (1987). The Chemical composition of
Niger Delta Rivers. Final report on the Environmental Pollution Monitoring of the
Niger Delta basin of Nigeria. Vol 5.i-xvii, 1-145.
NDDC- Niger Delta Development Commission (2004).Biodiversity of the Niger Delta
Environment Niger Delta Development commission master plan Project Final
report.
NDES- Niger Delta Environmental Survey (2000). Ecological zonation and habitat
classification. 2
nd
Phase Report 2, Vol.1: 1-66.
Obunwo, C.C., Braide, S.A., Izonfuo,W.A.L., and Chindah, A.C (2004) Influence of urban
activities on the water quality of fresh water streams in the Niger Delta, Nigeria.
Journal of Nigerian Environmental Society (JNES) 2: (2) 196-209.
Waste Water - Evaluation and Management
302
Odokuma , l. O. and Okpokwasili, G. C. (1997). Seasonal influences of the organic pollution
monitoring of the New Calabar River, Nigeria Environmental Monitoring and
Assessment 45, (1), 43-56.
Ogan, M T (1988). Examination of surface waters used as sources of supply in the Port
Harcourt area. II. Chemical hydrology. Archiv fuer Hydrobiologie, Supplement.
Vol. 79, no. 203, pp. 325-342.
Ogamba, E.N. Chindah, A.C., Ekweozor, I.K.E., Onwuteaka, J. N (2004). Water quality and
phytoplankton in Elechi creek complex of the Niger Delta. Journal of Nigerian
Environmental Society (JNES) 2: (2) 121-130.
Okoh, A. I.; Barkare, M. K.; Okoh, O. O.; Odjadjare, E., (2005). The cultural microbial and
chemical qualities of some waters used for drinking and domestic purpose in a
typical rural setting of Southern Nigeria. J. Appl. Sci., 5 (6), 1041- 1048.
Okoh, A. I.; Odjadjare, E. E.; Igbinosa, E. O.; Osode, A.N., (2007). Wastewater treatment
plants as a source of microbial pathogens in the receiving watershed. Afr. J.
Biotech. 6 (25), 2932-2944.
Onderka, M., Pekarova, P., Miklanek, P. Halmova, D. and Pekar, J. (2010). Examination of
the Dissolved Inorganic Nitrogen Budget in Three Experimental Microbasins with
Contrasting Land Cover—A Mass Balance Approach. Water Air Soil Pollut .
210:221–230.
Onuoha, G.C., Chindah, A.C. Oladosu, G.A. and Ayinla O.A (1991). Effect of organic
fertilization on pond productivity and water quality of fish ponds at Aluu, Nigeria.
NIOMR 74, 1 - 12.
Pandey, R. (2007). Some effects of untreated wastewater of Bombay (India) on Brassica and
Spinacea oleracea. Agr. Res., 12(2): 34-41.
Pekarova, P., Miklanek, P., Onderka, M., & Kohnova, S. (2009). Water balance comparison of
two small experimental basins with different vegetation cover. Biologia, 64 (3), 487–491.
Qureshi, A. A. and Dutka, B. J. (1979). Microbiological studies on the quality of urban
storm water runoff in Southern Ontario, Canada. Water Research, 13, (10), 977-985.
Rafiu A. O., Roelien D. P. and Isaac R. (2007). Influence of discharged effluent on the quality
of surface water utilized for agricultural purposes African Journal of
Biotechnology. 6 (19), 2251-2258.
Rim-Rukeh, A. , Ikhifa, G. O. and Okokoyo, P. A. (2007). Physico-Chemical Characteristics
of Some Waters Used for Drinking and Domestic Purposes in the Niger Delta,
Nigeria. Environmental Monitoring and Assessment. 128 (1-3), 475-482,
RPI –Research Planning Institute (1985) Environmental Baseline Studies for the
establishment of Control Criteria and Standards against Petroleum Related
Industries in Nigeria, RPI- Columbia South Carolina, USA. RPI/R/84/4/15-1
Sheikh, K.H. and Irshad, M. (1980). Wastewater effluents from a tannery: Their effects on
soil and vegetation in Pakistan. Envi. Conser., 7(4): 319-324.
Soler, A.; Saez, J., Llorens, M.,. Martinez, I., Torrella, F., and. Berna, L. ( 1991). Changes in
physico-chemical parameters and photosynthetic microorganisms in a deep
wastewater self-depuration lagoon. Wat. Res.,25 (6): 689-695.
World Health Organization (WHO), (1984). Guidelines Wastewater. 19th Edn. American
water Works for Drinking Water Quality. Health Criteria and other Association,
Water Environment Federation. Supporting Information, WHO, Geneva, Vol: 1.
Wahid, A., S.S. Ahmad, M.G.A. Nasir. (1999). Water pollution and its impact on fauna and
flora of a polluted stream of Lahore. Acta Scient., 9(2): 65-74.
15
Impact of Municipal Waste Water on Growth and
Nutrition of Afforested Pinus eldarica Stands
Masoud Tabari, Azadeh Salehi and Jhangard Mohammadi
Tarbiat Modares University
Iran
1. Introduction
As a whole, water is a most important source for plantations particularly in the dry regions
(Mosadegh, 1999). In other hand, wastewater can be used to cover the needs of urban and
rural areas and parks as well as industrial complexes to develop green space and to reduce
air pollution (Al-Jamal et al., 2000; Singh and Bhati, 2005; Sharma, et al., 2007). In reality,
wastewater except the water resource for irrigating the plantations is an enormous nutrient
source, too (Meli et al., 2002; Rattan et al., 2005). Of course, establishment of trees plantation
for waste water irrigation has been a common practice for many years. The practice not only
defers ecological degradation by the pollutants in the soil, because trees are long-living
organisms which can take up trace elements from the soil, water or air and retain them for a
long time (Madejo´n et al., 2006). But it also creates opportunities for commercial biomass
production and sequestration of excess minerals in the plant system (Sharma and Ashwath,
2006). Therefore, the use of waste water in growing woodlots is a viable option for the
economic disposal of waste water (Neilson et al., 1989). Moreover, waste water from
municipal origin is rich in organic matter and also contains appreciable amounts of macro
and micro-nutrients (Gupta et al., 1998). Accordingly nutrients levels of soil are expected to
improve considerably using continuous irrigation with municipal waste water (Ramirez-
Fuentes et al., 2002; Rattan, et al., 2005). Apart from this, in the case of the utilization of
wastewater mixed with harmful heavy metals lead to decrease the toxicity, through a
developed rooting system in plantations (Karpiscak et al., 1996) and as such, play the
important and fundamental role for the environmental protection (Cromer et al., 1987;
Stewart et al., 1990). However, this can not be ignored that the use of wastewater for
irrigation purposes might damage the ecosystem because the high toxic concentration and
heavy metals (Gupta et al., 1998; Brar et al., 2000; Yadav et al., 2002). The accumulation of
heavy metals in soil is related to pH, texture and cation exchange capacity of soil (Datta et
al., 2000). Therefore, decision about the application of wastewater should be made based on
the views of specialties of water, soil, plant and environment of every location
(Nagshinepour, 1998).
Iran is a part of arid regions in the world being encountered acute crises owing to the
increased population and need of water resources (Tabatabaei, 1998). It is noteworthy
saying that thousands liters of domestic, industrial and hospital effluents are daily flowing
from Tehran metropolitan area and influence the underground water resources. In the same
way, 80 percent of the useful water of the citizens in Tehran is also transformed as
Waste Water - Evaluation and Management
304
municipal effluent (Tajrishi, 1998). On the other side, unplanned expansion and air pollution
of Tehran make it unavoidable to increase the green space. In reality, urban green space and
green belt around the city can play an effective role in air purification and climate health.
Since the lack of water is a limiting factor for development of green space, therefore
municipal effluent may be suitable (Torabian and Hashemi, 1999).
Till now inside the country several researches have been conducted about effect of
municipal effluent on soil and agricultural crops, but not on softwoods. The objective of this
study was to investigate the effects of the 15 years municipal waste water application on the
growth of Pinus eldarica Medw. trees and the minerals accumulation in the trees needles.
2. Materials and methods
The study site is an abandoned agriculture site located in Shahr-e Rey, 5 Km south of
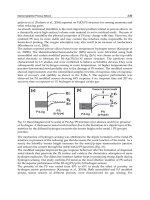
Tehran-Iran (Latitude 35° 37' N, Longitude 51° 23' E, 1005 m above sea level). The climate of
the site is semi-arid with mild-cold winters and 7 months (Mid April-Mid November) dry
season (Fig. 1). Average annual rainfall and average annual temperature are 232 mm and
13.3° C, respectively. The highest rainfall appears in March and the lowest in August. The
warmest month occurs in August and the coldest in January. Experiment was conducted at
two 4 hectare even-aged (15 years) artificial stand of Pinus eldarica Medw. The first stand
was irrigated with municipal waste water and the second with well water since plantation.
The irrigation was applied daily based on tree water-use and the potential evapo-
transpiration, which varied seasonally in response to the climate. The soils of both fields
were clay-loam with 32.5% clay, 34.12% silt and 33.38% sand in the field irrigated with
municipal waste water and 28.52% clay, 36% silt and 35.48% sand in the field irrigated with
well water
Fig. 1. Embrothermic curve of the study site
The study was established in October 2006. Data was collected using technique of systematic
random sampling (Jayaraman, 2000) with 4 replications in either of both fields. Therefore,
four plots were identified in each field of irrigated with municipal waste water and well
water. Plots were 30 m × 30 m, with tree spacing of 3 m × 4 m (833/ha). In each plot,
diameter at breast height (d.b.h.), total height, crown length and crown diameter of total
trees were measured and basal area computed. Standing volume of each tree was
determined by using form factor (~0.5) and formula V = 0.4 × D
2
× H, made by Zobeyri
Impact of Municipal Waste Water on
Growth and Nutrition of Afforested Pinus eldarica Stands
305
(1994). Where, D is diameter at breast height (d.b.h.), H is total height and V is standing
volume.
In each plot, four trees were selected and at the end of growing season needle samples of P.
eldarica trees taken from the top of crown and the part affected by sunlight (Letacon, 1969;
Habibi Kaseb, 1992). This collection provided 16 needle samples in each treatment. At the
end of the sampling, one representative needle sample from each plot (by mixing of four
samples of each plot) was taken (due to decreasing of samples quantity for chemical
analysis). Municipal waste water and well water were sampled daily (3 days in each month)
from early June to late November, at three times per day (morning, noon and evening) to
make a composite sample of each day.
Water samples were brought to the laboratory in resistant plastic bottles to avoid adherence
to the container wall. They were filtered through 42 mm filter paper and stored at 4 °C to
minimize microbial decomposition of solids (Yadav et al., 2002; Bhati and Singh, 2003).
Several parameters were measured separately, pH and EC by the procedure described using
OMA (1990), NH
4
-N, NO
3
-N, PO
4
-P, K, Ca, Mg and Na as per the method given by APHA
(1992) and Yadav et al. (2002).
Fresh weight of some needles from each treatment was recorded immediately after harvest.
Dry weight was recorded after oven drying of needles for 72 h at 80 °C (Bhati and Singh,
2003). Samples of needle were washed using tap water, rinsed with distilled water, oven
dried at 80 °C for 24 h (Singh and Bhati, 2005), ground in a stainless steel mill and retained
for mineral analysis. For determination of macro and micro-nutrients exception P and N, the
needle samples were wet digested as per Jackson (1973) and estimated using an Atomic
Absorption Spectrophotometer (AAS). Measurement of P content was performed after a wet
digestion using UV–VIS spectrophotometer at 450 nm (Singh and Bhati, 2005). The N
content of needle samples digested in concentrate sulfuric acid was determined by the
Kjeldahl method (Bhati and Singh, 2003; Bozkurt and Yarilga, 2003).
Average growth parameters and needle nutrients of two irrigation treatments (T
1
: irrigation
by municipal waste water; T
2
: irrigation by well water) were compared using independent-
samples t-test. The variations in characteristics of municipal waste water and well water
were firstly tested for normality using Shapiro-Wilk’s test and then by independent-samples
t-test. All the data were analyzed using the SPSS statistical package.
3. Results and discussion
3.1 Waste water and well water
Results indicated that the waters were alkaline in reaction (Table 1). The pH of the
municipal waste water in various months ranged from 7.51 to 7.75 and for well water 6.69 to
7.62. Based on results of Patel et al. (2004), in our examination the tolerance limit of pH for
irrigation ranged from 6.0 to 9.0. The electrical conductivity (EC) of municipal waste water
ranged from 1.78 to 2.12 dS m
-1
with the greatest value detected in August. Average EC of
municipal waste water (mean of 18 samples) exceeded 1 dS m
-1
(1.91 dS m
-1
) indicating the
waste water was saline in nature (Rattan et al., 2005). The pH and EC of the municipal waste
water were greater than those of the well water. The concentration of all the nutrient
elements was higher in municipal waste water, with NO
3
-N content (1.63 mg l
-1
) being 6.8
times the content in well water (0.24 mg l
-1
). The content of NH
4
-N in municipal waste water
(9.05 mg l
-1
) was also 4.2 times the content in well water (2.15 mg l
-1
). On average, available
content of PO
4
-P, K
+
, Ca
2+
, Mg
2+
, Na
+
in municipal waste water were greater compared to
Waste Water - Evaluation and Management
306
those in the well water. The most nutrients concentration of municipal waste water were
reduced in autumn and increased in summer because of high temperature and evaporation
losses of water (Singh and Bhati, 2005).
Although municipal waste water elevated significantly (P < 0.01) in all values compared to
well water, but the analysis showed that pH, EC, NO
3
-N, PO
4
-P, K
+
, Na
+
of well water
samples were within the limits as per the standard prescribed for land disposal and should
not pose any serious hazard according to threshold values of WHO (Hach, 2002). However,
the contents of NH
4
-N and Ca
2+
of municipal waste water and well water and Mg
2+
of
municipal waste water were on the higher side (Table 1).
Well water
Municipal waste water
WHO
*
Mean ± SE
Range
(Min Max.)
Mean ± SE
Range
(Min Max.)
Parameters
6.5 -
8.5
7.32 ± 0.05
b
6.69 - 7.62 7.63 ± 0.01
a
7.51 - 7.75 pH
3
0.590 ± 0.008
b
0.54 - 0.67 1.91 ± 0.02
a
1.78 - 2.12 EC (dS m
-1
)
1.5 2.15 ± 0.19
b
1.83 - 2.49 9.05 ± 0.11
a
8.1 - 10.24 NH
4
-N (mg l
-1
)
3 0.24 ± 0.08
b
0.19 - 0.33 1.63 ± 0.09
a
1.58 - 1.89 NO
3
-N (mg l
-1
)
-
5.03 ± 0.01
b
4.62 - 5.64 12.69 ± 0.16
a
11.45 -14.13 PO
4
-P (mg l
-1
)
-
19.72 ± 0.36
b
17.48 - 22.75 39.93 ± 0.83
a
33.06 - 46.31 K (mg l
-1
)
75 96.77 ± 1.26
b
66.70-101.57
255.22 ± 4.57
a
235.54 -
296.20
Ca (mg l
-1
)
50 35.22 ± 0.79
b
28.9 - 42
109.85 ± 1.83
a
100.9 - 124 Mg (mg l
-1
)
200 35.18 ± 0.13
b
30.18 - 41.03
140.45 ± 0.20
a
135.90 -
150.22
Na (mg l
-1
)
Different superscripts in row indicate significant (P < 0.01) difference. Values are mean of eighteen
replications (3 days × 6 months) with ± SE;
*
World Health Organization (WHO): Hach, 2002
Table 1. Characteristics of municipal waste water and well water
3.2 Tree growth
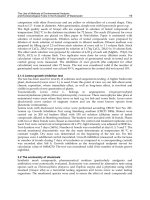
Irrigation with municipal waste water for 15 years produced the largest trees in this
treatment. The most frequent trees were found at diameter class of 20 cm and 14 cm,
respectively grown on field irrigated with municipal waste water and well water (Fig. 2). In
fact, tree growth was greater (P < 0.01) in the field irrigated using municipal waste water
than in plots irrigated with well water, as indicated by the 17.95 ± 1.33 cm diameter at breast
height, 10.04 ± 0.15 m height, 8 ± 0.27 m crown length, 2.53 ± 0.17 m crown average
Impact of Municipal Waste Water on
Growth and Nutrition of Afforested Pinus eldarica Stands
307
diameter, 264.20 ± 30.02 cm
2
basal area and 0.139 ± 0.013 m
3
standing volume of the trees in
waste water irrigated field (Table 2). Similarly, an increase in the growth of olive (Olea
europaea) trees due to irrigation with municipal waste water has been reported by
Aghabarati et al. (2008). The study of Stewart et al. (1990) also suggested that the addition of
municipal waste water on Eucalyptus grandis has been resulted in a doubling of growth rate
when compared to E. grandis grown in a rain fed site in four years.
The increased growth may be linked to sufficient availability of water and better status of
nutrients in soil (Larchevêque et al., 2006). Since municipal waste water contains plant
nutrients and organic matter, it may improve the properties of soil for increase in growth
and biomass production (Guo et al., 2002; Egiarte et al., 2005; Lopez et al., 2006). The increase
in growth indicates that waste water application influenced the physiological processes,
facilitated early needle initiation and resulted in a net increase in the number of needles. An
increase in needles could have captured more solar energy for metabolic use, fixed more
CO
2
, and produced greater photosynthesis, and growth. This hypothesis is supported by
Ceulemans et al. (1993) and Myers et al. (1996).
0
20
40
60
80
100
120
140
0 2 4 6 8 10121416182022242628
Diameter class (cm)
N. tree of ha.
sew age well water
Fig. 2. Distribution of diameter classes for P. eldarica trees in two irrigation types
Irrigation type
Diameter at
breast
height (cm)
Height
(m)
Crown
length
(m)
Crown
diameter
(m)
Basal
area
(cm
2
)
Standing
volume
(m
3
)
Trees irrigated
with waste water
17.95
a
(1.33)
10.04
a
(0.15)
8.0
a
(0.27)
2.53
a
(0.17)
264.20
a
(30.02)
0.139
a
(0.013)
Trees irrigated
with well water
13.50
b
(0.5)
9.02
b
(0.10)
7.3
b
(0.12)
1.90
b
(0.20)
135.0
b
(20.5)
0.65
b
(0.09)
-Different superscripts in column indicate significant difference of each tree attribute between two
irrigation types.
-Values in parenthesis are ± SE.
Table 2. Effect of municipal waste water and well water on growth of P. eldarica trees
3.3 Mineral composition of needles
The application of municipal waste water significantly increased the macro-elements (N, P,
K, Ca, Mg, Na concentration of P. eldarica trees needle as compared with well water (Table
Waste Water - Evaluation and Management
308
3). Increases in minerals concentration may have been due to the effect of nutrients addition
through municipal waste water (Meli et al., 2002). This result is in agreement with Singh and
Bhati (2005) and Aghabarati et al. (2008), whereas a substantially greater above-mentioned
minerals concentration were observed in leaf of Dalbergia sissoo seedlings and Olea europaea
trees irrigated with municipal waste water compared to control. However, Guo et al. (2002)
and Aghabarati et al. (2008) had also suggested that a decrease of Mg and Ca, and no
difference of Na concentration in leaf of eucalypt and olive tree were treated by municipal
waste water. In fact, quantity of nutrients absorption using plant depends upon the total
quantity of the nutrients applied through waste water application, soil properties and type
of plant (Bozkurt and Yarilga, 2003). The minerals concentration of needle may be ranked
from greatest to least as N > Ca > K > Mg > P > Na.
N P K Ca Mg Na
gr kg
-1
Soil treated with T
1
16. 41
a
(0.27)
0.865
a
(0.058)
5.79
a
(0.50)
6.08
a
(0.27)
1.51
a
(0.12)
0.320
a
(0.027)
Soil treated with T
2
15.47
b
(0.35)
0.710
b
(0.014)
4.49
b
(0.42)
4.64
b
(0.26)
1.28
b
(0.11)
0.198
b
(0.034)
p-value <0.01 <0.05 <0.01 <0.01 <0.05 <0.01
Range
*
5-30 1-5 3-30 10-40 1-7
Abbreviations: T
1
: municipal waste water; T
2
: well water; values are mean of four replications with ± SD
in parentheses; different superscripts in column indicates significant difference between T
1
and T
2
;
*
Salardini (1992)
Table 3. Mineral composition of P. eldarica trees needle by affected by municipal waste water
and well water
4. Conclusion
Our study displayed that all growth parameters measured in P. eldarica trees were
statistically greater in effluent-irrigated area than in well-watered area. As a whole, the use
of municipal effluent in irrigations can be an overflowing resource from the nutrient
elements required for plants (Yadav et al., 2002; Mapanda et al., 2005; Toze, 2006). As a
matter of fact, high nutrient concentrations in effluent, compared to those in well water,
cause the nutrient accumulation in the soil (Stewart and Flinn, 1984; Phillips et al., 1986;
Stewart et al., 1990; Keller et al., 2002; Selivanovskaya et al., 2002; Emongor and
Ramolemana, 2004) and makes easy the access of plants to the high nutrient concentration
(macro and micro elements) and increases their growth. Accordingly, in agreement with our
findings the results of Stewart and Flinn (1984, on Pinus eldarica), Phillips et al. (1986, Pinus
eldarica), Ostos et al. (2007, on Pistacia lentiscus) show that faster growth of tree occurs in the
effluent-irrigated areas. This is mostly due to high nutrient concentration in effluent. It may
be also noted that the nutrient contents in the municipal effluent is more than needed by
plants whereas in the such conditions trees can produce greater biomass (Fitzpatrick et al.,
1986; Martinez et al., 2003; Sing and Bhati, 2005; Guo et al., 2006). Regarding the differences
indicated above and positive effects of effluent on the growth of P. eldarica, it can be
recommended that the produced huge municipal effluent in south of Tehran can be used for
accomplishment of plantation projects and for development of rural and urban green spaces
and green belts around the city and for reduction of air pollution, too. It is necessary to
Impact of Municipal Waste Water on
Growth and Nutrition of Afforested Pinus eldarica Stands
309
clarify that the decision for each location should be made based on accurate management,
chemical, physical and microbial characteristics of water, soil and plant, according to
international standards.
5. Acknowledgement
Authors are thankful to Natural Resources Faculty of Tarbiat Modares University for
providing research facilities and funding of this research and to Department of Forestry for
technical and scientific assistance. We gratefully acknowledge Shahr-e-Ray Municipality for
their support on field assistance of this research.
6. References
Aghabarati, A.; Hosseni, S.M, Esmaeili, A. & Maralian, H. (2008). Growth and mineral
accumulation in Olea europaea L. trees irrigated with municipal effluent. Res. J.
Environ. Sci., 2 (4): 281-290.
Al-Jamal, A.M.S.; Sammis, T.W.; Mexal, J.G.; Picchioni G.A. & Zachritz, W.H. (2000). A
growth irrigation scheduling model for wastewater use in forest production.
Agricultural Water Management, 56: 57-79.
APHA. (1992). Standard Methods For The Examination OF Water And Wastewater. APHA,
AWWA and WPCF. 16th ed.
Bhati, M. & Singh, G. (2003). Growth and mineral accumulation in Eucalyptus camaldulensis
seedlings irrigated with mixed industrial effluents. Bioresource Technol., 88: 221-228.
Bozkurt, M.A. & Yarilga, T. (2003). The effects of waste water sludge applications on the
yield, growth, nutrition and heavy metal accumulation in apple trees growing in
dry conditions. Turk. J. Agric. For,. 27: 285-292.
Brar, M.S., S.S. Mahli, A.P. Singh, C.L. Arora and K.S. Gill, 2000. Sewer water irrigation
effects on some potentially toxic trace elements in soil and potato plants in
northwestern India. Can. J. Soil Sci., 80: 465–471.
Ceulemans, R.J.; Pontailler, F.M. & Guittet, J. (1993). Leaf allometry in young poplar stands:
reliability of leaf area index estimation, site and clone effects. Biomass Bioenerg., 4:
769-776.
Cromer, R.N., P. Tompkins and N.J. Barr, 1987. Irrigation of Pinus radiata with waste water:
tree growth in response to treatment. Aus. Forest Res., 13: 57-65.
Datta, S.P.; Biswas, D.R.; Saharan, N.; Ghosh, S.K. & Rattan, R.K. (2000). Effect of long-term
application of sewage effluents on organic carbon, bioavailable phosphorus,
potassium and heavy metals status of soils and uptake of heavy metals by crops. J.
Indian Soc. Soil Sci., 48: 836–839.
Egiarte, G.; Arbestian, C.M.; M., Alonso, A.; Rui´Z-Romera E. & Pinto, M. (2005). Effect of
repeated applications of waste water sludge on the fate of N in soils under
Monterey pine stands. For. Ecol. Manage. 216: 257-269.
Emongor, V.E. & Ramolemana, G.M. (2004). Treated sewage effluent (water) potential to be
used for horticultural production in Botswana. Physics and Chemistry of the Earth, 29:
1101–1108.
Waste Water - Evaluation and Management
310
Fitzpatrick, G.E., Donselman H. & Carter, N.S. (1986). Interactive effects of sewage effluent
irrigation and supplemental fertilization on container - grown trees. Hort. Science,
21(1): 92–93.
Guo, L.B.; Sims, R.E.H.; Horne, D.J. (2002). Biomass production and nutrient cycling in
Eucalyptus short rotation energy forests in New Zealand. I: biomass and nutrient
accumulation. Bioresource Technol., 85: 273-283.
Guo, L.B.; Sims, R.E.H. and Horne, D.J. (2006). Biomass production and nutrient cycling in
Eucalyptus short rotation energy forests in New Zealand: II. Litter fall and nutrient
return. Biomass and Bioenergy, 30: 393–404.
Gupta, A.P.; Narwal, R.P.; Amtil, R.S. (1998). Sewer water composition and its effect on soil
properties. Bioresource Technol., 65: 171-173.
Habibi Kaseb, H. (1992). Forest Pedology. Tehran University Press, 424 pp.
Hach, C. (2002). Water Analysis Handbook, Loveland, Colorado, USA, p. 61-62.
Jackson, M.L. (1973). Soil Chemical Analysis. Prentice Hall of India Private Ltd., New Delhi.
Jayaraman, K. (2000). A Statistical Manual for Forestry Research. FORESPA Publication., 240
pp.
Karpiscak, M.M.; Gerba, C.P.; Watt, P.M.; Foster K.E. & Falabi, J.A. (1996). Multi-species
plant systems for wastewater quality improvement and habitat enhancement.
International association on water quality. Water Sci. Technol., 33: 231–236.
Keller, C.; Grath, S.P.Mc. & Dunham, S.J. (2002). Trace metal leaching through a soil
grassland system after sewage sludge application. J. Environ. Qual., 31: 1550-1560.
Larchevarcheveque, M.; Ballini, C., Korboulewsky N. & Montes, N. (2006). The use of
compost in afforestation of Mediterranean areas: Effects on soil properties and
young tree seedlings. Sci. Total Environ., 369: 220-230.
Letacon, F. (1969). Une methode originale de prelevemennts foliaires, R.F.F. 3: 196-197.
Lopez, A.; Pollice, A.; Lonigro, A.; Masi, S.; Palese, A.M.; Cirelli, G.L.; Toscano, A. & Passino,
R. (2006). Agricultural wastewater reuse in southern Italy. Desalination. 187: 323-
334.
Madejon, P.; Maranon, T. & Murillo, J.M. (2006). Biomonitoring of trace elements in the
leaves and fruits of wild olive and holm oak trees. Sci. Total Environ. 355: 187-203.
Martinez, F.; Cuevas, G.; Calvo R. & Walter, I. (2003). Biowaste effects on soil and native
plants in semiarid ecosystem. J. Environ. Qual., 32: 472–9.
Meli, S.; Porto, M.; Bellingo, A.; Bufo, S.A.; Mazzatura, A. & Scopa, A. (2002). Influence of
irrigation with lagooned urban wastewater on chemical and microbiological soil
parameters in a citrus orchard under Mediterranean condition. Sci. Total Environ.,
285: 69-77.
Mosadegh, A. (1999). Plantation and Forest Nurseries. University of Tehran Press. 516 pp.
Myers, B.J.; Theiveyanath, S.O.; Brian, N.O. & Bond, W.J. (1996). Growth and water use of
Eucalyptus grandis and Pinus radiata plantations irrigated with effluent. Tree Physiol.,
16: 211-219.
Naghshinehpour, B. (1998). Application of effluent in agriculture productions and soil
rehabilitation. First congress on the programming and policy in infrastructural
matter (water and soil), Ministry of Agriculture.
Impact of Municipal Waste Water on
Growth and Nutrition of Afforested Pinus eldarica Stands
311
Neilson, G.H.; Stevenson, D.S.; Fitzpatrick, J.J. & Brownlee, C.H. (1989). Nutrition and yield
of young apple trees irrigated with municipal waster water. J. Am. Soc Hortic. Sci.,
114: 377-383.
OMA, (1990). Official Methods of Analysis. 15th ed. Association of Official Analytical
Chemists, Arlington, Virginia, USA.
Ostos, J.C.; Pez-Garrido, R.Lo.; Murillo, J.M. & Lo´pez, R. (2007). Substitution of peat for
municipal solid waste- and sewage sludge-based composts in nursery growing
media: Effects on growth and nutrition of the native shrub Pistacia lentiscus L.
Bioresource Technology.
Patel, K.P.; Pandaya, R.R.; Maliwal, G.L.; Patel, K.C.; Ramani, V.P. & George, V. (2004).
Heavy metal content of different effluents and their relative availability in soils
irrigated with effluent waters around major industrial cities of Gujarat. J. Ind. Soc.
Soil Sci., 52: 89-94.
Phillips, R.; Fisher J.T. & Mexal, J.G. (1986). Fuelwood production utilizing Pinus eldarica and
sewage sludge fertilizer. Forest Ecology and Management, 16: 95-102.
Ramirez-Fuentese, Lucho-Constsntino, C.; Escamilla-Silva, E. & Dendooven, L. (2002).
Characteristics and carbon and nitrogen dynamics in soil irrigated with waste
water for different lengths of time. Bioresource Technol., 85: 179-187, 2002.
Rattan, R.K.; Datta, S.P.; Chhonkar, P.K.; Suribabu, K. & Singh, A.K. (2005). Long-term
impact of irrigation with waste water effluents on heavy metal content in soils,
crops and groundwater-a case study. Agr. Ecosyst. Environ. 109: 310-322.
Salardini, A. (1992). Soil Fertility. Tehran University Press, 440 pp.
Selivanovskaya, S.Y.; Latypova, V.Z.; Kiyamova S.N. & Alimova, F.K. (2001). Use of
microbial parameters to access treatment methods of municipal sewage sludge
applied to grey forest soils of Tatars tan. Agriculture, Ecosystem and Environment, 86:
145-153.
Sharma, A. & Ashwath, N. (2006). Land disposal of municipal effluents: Importance of
choosing agroforestry systems. Desalination, 187: 361-374.
Sharma, R.K.; Agrawal, M. & Marshall, F. (2007). Heavy metal contamination of soil and
vegetables in suburban areas of Varanasi, India. Ecotox. Environ. Safe., 66: 258-266.
Singh, G. & Bhati, M. (2005). Growth of Dalbergia sissoo in desert regions of western India
using municipal effluent and plant chemistry. Bioresource Technology, 69: 1019-1028.
Stewart, H.T.L. & Flinn, D.W. (1984). Establishment and early growth of trees irrigated with
wastewater at four sites in Victoria, Australia. Forest Ecology and Management, 8:
243-256.
Stewart, H.T.L.; Hopmans, P.; Flinn, D.W. and Hillman, T.J. (1990). Nutrient accumulation in
trees and soil following irrigation with municipal effluent in Australia.
Environmental Pollution, 63: 155-177.
Tabatabaei, M. (1998). Sustainability in irrigation designs with wastewater. Journal of water
and Environment, 31: 28-35.
Tajrishi, M. (1998). New and comprehensive outlook to the problem of municipal effluent of
Tehran. The Journal of Water and Effluent, 28: 16-30.
Torabian, A. & Hashemi, F. (1999). Irrigation of green space with treated wastewater of
Tehran. The Journal of Water and Effluent, 29: 31-36.
Waste Water - Evaluation and Management
312
Toze, S. (2006). Reuse of effluent water-benefits and risks. Agr. Water Manage., 80: 147-159.
Wheeler, P.M.; Edmeades, D.C. & Christie, R.A. (1992). Effect of aluminum on relative yield
and plant chemical concentrations of cereals grown in solution culture at low ionic
strength. J. Plant Nutr., 15: 403-418.
Yadav, R.K.; Goyal, B.; Sharma, R.K., Dubey, S.K. & Minhas, P.S. (2002). Post-irrigation
impact of domestic waste water effluent on composition of soils, crops and ground
water-a case study. Environ. Int., 28: 481-486.
Zobeyri, M. (1994). Forest Inventory. Tehran University Press, 401 pp.
16
Parasitological Contamination in Organic
Composts Produced with Sewage Sludge
Eduardo Robson Duarte
1*
,
Flávia Oliveira Abrão
1,
Neide Judith Faria de Oliveira
1
and Bruna Lima Cabral
1
1
Instituto de Ciências Agrárias da Universidade Federal de Minas Gerais
Montes Claros,
Brazil,
1. Introduction
The activities performed daily by humans generate large volumes of waste from various
areas, increasing environmental pollution and public health problems. According to the
recommendations of the World Health Organization (WHO), the reactor effluent treatment
from domestic sewages can be used in agriculture, since it applied to cultures that provide
little risk of contamination with pathogens (Ayres & Mara, 1996). The sewage sludge is
classified as class A when origins of processes with effective reduction of pathogens and can
be used without restrictions in horticulture, and in the class B if results of processes of
moderate reduction of pathogens, with more restricted use and be applied in reforestation
and other cultures in which the risk of environmental and human contamination can be
better controlled (Fernandes, 2000; David, 2002).
Sewage sludge must have characteristics that allow its setting within the parameters set for
each class (David, 2002). For class A, the most probable number of coliforms per gram of
dried sludge must be less than 1000, and the parasitic contamination should be less than one
viable egg of helminths in four grams of dried sludge and less than one egg per litre of
effluent (WHO, 1989; Fernandes, 2000).
The processes most often employed for the stabilization of sewage include the aerobic and
anaerobic digestion. The application of lime and the composting are also recommended in
some countries like USA, France and Brazil. However, the efficiency of the stabilization
processes depends of the operational quality and of the pathogen characteristics present in
the sewage sludge (Paulino et al., 2001).
2. Parasites presented in sewage sludge
Several countries have researched alternatives for final disposal of the waste from water
sewage and sludge treatment. The sewage, prior to the stabilization treatment and
disinfection, can contain macro and micronutrients and many pathogenic microorganisms
and parasites. The handling and use of sewage and sludge obtained, without prior
treatment, may promote severe infection to humans and animals (Paulino et al., 2001).
According to WHO, 25% of the world's hospital beds are occupied by patients with diseases