Waste Water Treatment and Reutilization Part 5 docx
Bạn đang xem bản rút gọn của tài liệu. Xem và tải ngay bản đầy đủ của tài liệu tại đây (2.43 MB, 30 trang )
6
Measurement Techniques for
Wastewater Filtration Systems
Robert H. Morris
1
and Paul Knowles
2
1
Nottingham Trent University,
2
Aston University
UK
1. Introduction
Filter-based microbiological wastewater treatment systems (such as subsurface flow
constructed wetlands, trickling filters and recirculating sand filters) require a thorough
understanding of system hydraulics for their correct design and efficient operation. As part of
the treatment process, the filter media will gradually become clogged through a combination
of solids filtration and retention, biomass production and chemical precipitation. Eventually
the media may become so clogged that hydraulic malfunctions ensue, such as untreated
wastewater bypassing the system. To achieve good asset lifetime a balance must be struck
between these essential treatment mechanisms and the hydraulic deterioration that they cause.
For many wastewater filtration systems the exact mechanism of clogging is not obvious, and
few specialised techniques have been developed which allow the cause and extent of
clogging to be measured in typical systems. The resultant lack of understanding regarding
clogging hinders the ability of operators to maintain good hydraulic performance. In this
chapter, for the first time, we compare three different families of standard hydraulic
measurement techniques and discuss the information that they can provide: hydraulic
conductivity measurements; clog matter characterisation and hydrodynamic visualisation.
Each method is assessed on its applicability to typical wastewater filtration systems using
horizontal subsurface flow constructed wetlands as a case study.
Furthermore, several new techniques will be considered which have been specifically
developed to allow in situ determination of hydraulic health for subsurface flow constructed
wetland wastewater filtration systems. These include in situ constant and falling head
permeameter techniques and embeddable magnetic resonance probes.
Discussion is given to the ways in which different methods can be combined to gather
detailed information about the hydraulics of wastewater filtration systems before exploring
methods for condensing heterogeneous hydraulic conductivity survey results (that vary by
several orders of magnitude) into a single representative value to describe the overall
hydraulic health of the system.
2. Mechanisms of clogging
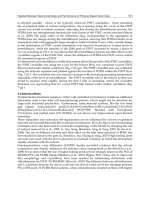
A typical subsurface flow wetland comprises a layered structure as seen in figure 1. Such a
system usually comprises a gravel matrix in which Phragmites australis (the common reed)
Waste Water - Treatment and Reutilization
110
is grown. These systems are used as an environmentally friendly method for wastewater
sanitisation before eventual discharge into a watercourse. The wastewater flows under
gravity through the gravel (below the surface), where it encounters optimum conditions for
purification: solids are removed by the gravel substrate and the root network of the reeds,
which also provide a surface on which to trap particulates and promote biofilms. Removal
of organic material, pathogens and nutrients is predominantly due to biofilms. Many
chemical compounds are absorbed or precipitated depending on the physicochemical
conditions of the wastewater constructed wetland (Brix, 1994). Over time this causes the
pore spaces between gravel grains to become occluded. A small amount of clogging will
occur due to biofilm growth which helps to improve the overall efficiency and functionality
of the system, although over time, excessive biofilm growth and retention of solids may lead
to bypass flow of untreated influent. The balance between these two dominant clogging
mechanisms often requires a multi-modal assessment methodology to elucidate the
complete nature and severity of the clogging.
Fig. 1. Cross sectional view of a typical subsurface flow constructed wetland.
3. Traditional measurement strategies
There are a variety of measurement techniques available to determine the hydraulic
conditions within the filter in situ (Knowles et al., 2009a; Lin et al, 2003), whilst
determination of the composition and quantity of clog matter usually requires samples of
the gravel matrix to be extracted prior to laboratory analysis. Each of these measurement
techniques is discussed in this section along with the weaknesses and strengths of each
strategy, which are summarised in Table 1. Whilst no individual technique is suitable for
gaining a full insight into the true extent of clogging, they may be useful to understand
individual contributions of system clogging or be used in combination for an understanding
of the interplay between different factors.
3.1 Hydraulic conductivity measurements
Traditional measurements of hydraulic conductivity share two common elements. The first
is that a test well or sample core must be made either in situ or remotely in a laboratory. The
second is that the hydraulics of the system must be tested in some repeatable or measurable
way to determine the hydraulic properties of the sample under test. In this section seven
common hydraulic conductivity measurement techniques will be briefly discussed.
Measurement Techniques for Wastewater Filtration Systems
111
Test Family Test Description
Slug Test
A piezometer tube (devoid of media) is inserted into
the media. The water level is rapidly changed by
addition of water or a metal slug. The evolution of
the water level back to equilibrium is used to
calculate the permeability.
Pumping Test
Water is pumped at a constant rate into or out of a
well, and the resulting cone of depression in the
filtration medium is monitored over time.
Steady State
Test
Flow through the filter medium results in a
hydraulic gradient. Differences in the height of the
water table are observed in different wells.
Unlined
Auger Hole
A borehole is made into the media and water is
either added or removed. The recharge rate or flow
rate into the media is measured.
Infiltration
Tests
A ring is impressed into the surface of the filtration
medium and water is added to measure the
infiltration rate through the surface.
Laboratory
Permeameter
A sample of the media is placed into a laboratory
permeameter cell. A constant or variable head of
water is then applied across the media. Manometer
take off points allow the variation in resistivity
across the sample to be determined.
Hydraulic
Conductivity
Modified
Cube Method
A cubic sample of the filtration media is sealed in
wax before removing single sets of opposing faces
and passing flow through the media, the hydraulic
conductivity in different planes can be determined.
Direct
Porosity
Measurements
Either saturated or drainable porosity of an
extracted sample is measured in the laboratory. This
approximates the ratios of free to interstitial water.
Time Domain
Reflectometry
Capacitance
Probe
Ground
Penetrating
Radar
A family of methods which rely on the dielectric
constant of a medium being proportional to water
saturation. Each method uses a different approach
to measure this property. TDR and CP are inserted
at various points and give readings in the
immediate locality whilst the GPR is swept over the
surface providing a subsurface image.
Clog Matter
Characterisation
Solids Assays
Total and volatile solids of the interstitial clog
matter are determined by drying the samples.
Suspended fractions in interstitial water may also be
measured.
Breakthrough
Curve
The breakthrough of a pulse of tracer added to the
system inlet is monitored at the outlet of the system
Hydrodynamic
Visualisation
Internal
Tracing
The dynamics of an inlet injected tracer are
monitored at different points in the system.
Table 1. Summary of available hydraulic measurement techniques separated into families.
Waste Water - Treatment and Reutilization
112
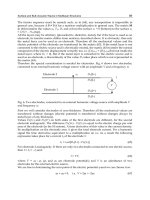
3.1.1 Slug test
To perform a slug test, a hollow tube perforated at the lower end or a piezometer is inserted
into the gravel substrate. A rapid and temporary change in water level, followed by return
to the equilibrium state is used to determine the hydraulic conductivity of the substrate near
the tube. This is achievable in one of two ways: the first (and the origin of its name) is shown
in figure 2 and requires the introduction of a metal slug into the water which infiltrates the
tube thus displacing some of it. The second is to add a known amount of water to the well.
Measurements of the water level (or air pressure above the water) will show a sudden
increase corresponding to the volume of the slug followed by an exponential decay back to
the natural level of the water table. The hydraulic conductivity of the surrounding gravel
can then be determined.
Fig. 2. Schematic representation of the measurement phases in the slug test used in a gravel
substrate.
The analysis of the relaxation curve from the slug test relies on two assumptions. The first is
that the water and gravel in the area around the tube is incompressible, which is typically a
reasonable assumption in an established water saturated wetland. The second is that the
surrounding medium is completely homogeneous which unfortunately is rarely the case.
The method for determining the hydraulic conductivity is based on a modified Thiem
equation (equation 1)
(
)
2
0
ln
,
Wt
Rhh
K
Ft
=
(1)
where K is the hydraulic conductivity of the gravel substrate, R
W
is the radius of the well,
h
0
and h
t
are the height of the water relative to the equilibrium level at the start and end of
Measurement Techniques for Wastewater Filtration Systems
113
the experiment lasting time t and F is a shape factor determined by the dimensions of the
well using one of several methods. The shape factor presented in equation 2 is valid only
for a well which has a perforated section with a length, L
P
, shorter than sixteen times its
radius. The reader is referred to the work of Hvorslev (1951) for more unusual well
geometries.
()
2
.
20.25
L
P
F
LR
P
W
π
=
+
(2)
For gravel substrates which contain fractions of different gravel sizes, the hydraulic
conductivity determined using the slug test is often not representative and an alternative
technique is required.
3.1.2 Pumping test
The pumping test is typically performed on aquifers but is equally applicable (with careful
consideration of error) to water saturated gravel substrates. The pumping test can be
performed either by pumping water into or out of the gravel substrate. In a clogged system
this can be quite disruptive if the flow rates are too high and in shallower systems, it may
not be possible to withdraw a sufficiency of water to yield valid results in the case where the
water is pumped out. The test is set up as in figure 3 with at least one test well, although the
results are more reliable with several.
As water is withdrawn (or added) to the substrate, a cone of depression develops (for water
withdrawal), the geometry of which corresponds to the flow rate out of (into) the well and
hydraulic resistance to flow offered by the substrate. By measuring the height of the water
table at several places along the radius of the cone it is possible to determine the hydraulic
conductivity of the gravel substrate. Most often this test is performed with a constant
pumping flow rate and the changing geometry of the cone of depression is plotted against
time. It is also possible however to repeat this test several times in succession with
increasing pump rates to improve the quality of the analysis. The hydraulic conductivity is
again determined from the measurements using a steady state solution to the Thiem
equation (eq. 3)
0
ln ,
2( )
Qr
K
dh h R
π
⎛⎞
=
⎜⎟
−
⎝⎠
(3)
where Q is the flow rate of the pump, d is the depth of the substrate, h-h
0
is the drawdown
(i.e. the difference between the depth of the water before and after the pump is started)
measured at a distance r from the pumping well. R is the distance from the pumping well at
which the water level is unaffected. In a small wastewater treatment system, where the cone
of depression may quickly extend to the inlet, R can be assumed as the distance to the inlet
of the system with a usually small experimental error.
The results from this test are only truly representative of the actual hydraulics of the system
when it has undergone little clogging and is relatively deep in comparison to the depth of
the wells and the depth of the cone of depression.
Waste Water - Treatment and Reutilization
114
Fig. 3. Schematic of pump test set up. The right hand side is the pumping well whilst the left
and centre are two test wells.
3.1.3 Steady state test
The steady state test is one of the least disruptive hydraulic conductivity tests. It requires
only the insertion of several test wells (pipes with part perforation as used previously) at
various lengths along the bed. The flow of water from one side of the bed to the other will
result in a hydraulic gradient along its length, causing a variation in the height of the water
table which can be measured in each test well. The determination of the hydraulic
conductivity is then relatively simple using Darcy's law as in equation 4.
,
Qr
K
Ah
=
(4)
where h is the difference in height between the water table in each well separated by
distance r, and A is the cross sectional area through which the flow has taken place. This
analysis relies on a homogeneous flow path between the wells and assumes that the flow
uses the whole of the cross sectional area. Although the impact of these assumptions can be
minimised by keeping the test wells relatively close together, the extra number of wells that
are required may cause too great a disturbance to the substrate to be fully representative.
This test is best performed in a system which has not undergone long term clogging to
ensure that the results are as reliable as possible.
Measurement Techniques for Wastewater Filtration Systems
115
3.1.4 Unlined auger hole
The unlined auger test is a means of measuring the hydraulic conductivity in a constructed
wetland which has undergone a sufficient degree of clogging that the gravel matrix has
become stabilised by clog matter. This allows an unlined bore hole to be made without too
great a risk of the walls collapsing into it. The three tests discussed so far can all be
performed in an unlined auger hole with the benefit of complete confidence that the whole
surface of the bore hole is participating in the method thus ensuring complete assessment of
the local environment. The drawback of this method is however ensuring that the walls do
not become weakened to the point of collapse and to avoid the build up of silt and sediment
in the base of the well. This is particularly critical for the pumping test in which the large
flow rates increase the likelihood of this occurring.
3.1.5 Infiltration test
The testing strategies discussed in the previous sections are primarily affected by horizontal
hydraulic conductivity only. As this is the typical direction of fluid flow in a typical
horizontal constructed wetland this is acceptable. In many situations, particularly clogged
gravel beds, overland flow occurs which results in a dual flow regime with vertical and
horizontal components. Additionally, vertical flow constructed wetlands are also becoming
more popular thanks to their smaller footprint and thus methods for measuring the vertical
hydraulic conductivity are required. In the infiltration test, the vertical infiltration rate of
flow across the surface of the system is measured. This is normally performed by burying
two concentric metal rings partially in the surface of the gravel (the rings are typically 60cm
and 30cm in diameter and about 25cm in height buried 15cm into the gravel) as in figure 4.
Both the central ring and the space between the two rings are filled with water. The drop in
water level is monitored every few minutes. The water level is kept relatively constant and
Fig. 4. Schematic representation of equipment used for infiltration testing before and after
filling with water (left and right).
Waste Water - Treatment and Reutilization
116
measurements are made frequently. Once the water is seen to be falling at a constant rate the
value is noted as the basic infiltration rate. The time that this takes is also of some relevance,
particularly on dry samples as it allows the tester to determine the wetability.
This test only indicates the infiltration rate through the surface of the substrate and does not
indicate the hydraulic conductivity of the bulk substrate. It is worth noting that the test is
only valid so long as the water between the two rings is at a similar level as that inside the
inner ring, as it is used to prevent horizontal motion of the water from the centre.
3.1.6 Laboratory permeameter
The laboratory permeameter is often considered the most accurate means of assessing gravel
permeability. However, to use a traditional permeameter, a sample of the gravel substrate
must be extracted, in tact with the surrounding clog matter and transported to a laboratory.
The sample is then loaded into the permeameter system and, using one of two techniques,
the permeability is assessed. The standard setup for a laboratory permeameter is as shown
in figure 5. A constant head of water is produced by using a top reservoir with a connection
to the permeameter and a much larger overflow drain. Water is fed into the device at a rate
that the overflow drain is utilised to a small degree, such that a constant flow rate into the
permeameter is maintained. A bottom reservoir is used to create a water-lock and ensure
that the sample remains saturated. The height difference between the water level in the top
and bottom reservoir forces flow through the sample, with a flow-rate that corresponds to
the hydraulic conductivity of the media. By measuring the outlet flow-rate, Darcy's law can
be used to determine the hydraulic conductivity of the sample as in equation 5.
,
QL
K
Ah
=
Δ
(5)
where Δh is the distance between the bottom of the reservoir overflow and the bottom of the
sample overflow and L is the vertical length of the sample with cross sectional area A. In this
experiment Q is calculated using the volume of water collected per unit time.
The accuracy of this method can be somewhat improved by varying the value of ∆h and
measuring Q. If Q is then plotted against (A∆h)/L, a linear relationship with gradient K is
found.
An alternative set up which allows a similar measurement accuracy in a shorter time is
known as a falling head permeameter. The equipment is the same as in the static head
permeameter only instead of keeping the level of the cup constant, it is allowed to drop with
time from a height h
0
to a height of h
t
at time t. Typically the cup is narrower than the
sample in this experiment to allow the height of the liquid to be measured easily. The
experimental protocol is to monitor the height of the liquid in the reservoir over time. A
rearrangement of Darcy's law can then be used to determine the value of the hydraulic
conductivity. If ln(h
0
/h
t
) is plotted against t, the slope will be KA/aL, where a is the cross
sectional area of the cup.
The main drawback of this technique is that the samples must be extracted from the
wetland. Careful measurements do however give reliable assessment of the hydraulic
conductivity using both protocols which are often used as benchmarks for alternative
testing strategies.
Measurement Techniques for Wastewater Filtration Systems
117
Fig. 5. Schematic representation of laboratory permeameter setup.
Waste Water - Treatment and Reutilization
118
3.1.7 Measurements of anisotropic hydraulic conductivity
Hydraulic conductivity is a tensor with three nodes that represent hydraulic conductivity in
different directions of flow. In an anisotropic medium, hydraulic conductivity at a point
may vary depending on the flow direction. A simple example of this is whereby particle
size stratification has created horizontal layers that encourage horizontal flow channelling,
and do not encourage vertical flow across the layers. The previously discussed methods are
axial tests which only allow measurement of hydraulic conductivity in one direction. Recent
laboratory methods have been developed to allow anisotropic hydraulic conductivity to be
evaluated in extracted soil samples (Renard et al., 2001). One such method called the
Modified Cube Method has been applied to measure anisotropy in natural wetland peat
samples (Beckwith et al.; 2003, Kruse et al.; 2008, Rosa and Larocque, 2008). The test involves
cutting a cube of material from an extracted core and coating it in paraffin wax. One set of
opposing sides of the wax case are removed and the sample subjected to an axial hydraulic
conductivity test, such as the constant head laboratory permeameter test. After
measurement the wax case is restored and a different set of opposing sides is removed, and
the test repeated across this flow direction. This is performed for all three flow directions
such that the hydraulic conductivity tensor can be ascertained.
3.2 Clog matter characterisation
The techniques described in the previous section are used to assess the hydraulic properties
of the clogged porous media flow system. However, these tests cannot reveal information
about the cause of clogging and the nature of the clog matter, which is often key in
determining the health of a system. In this section we will consider the range of common
tools available to determine the properties of the clog matter fraction in the system.
3.2.1 Direct porosity measurements
There are numerous methods for measuring the porosity of a sample directly. In this section
we will discuss the two most commonly used for samples collected from constructed
wetlands. This is a highly invasive technique and requires the extraction of sample cores
from the gravel substrate. Once these cores are extracted, they are analysed in the laboratory
using two tests to determine the amount of water which is free and the amount that is
associated, that is to say the amount that is associated with the surface of the grains in
biofilms for example. The first test is relatively straightforward and relies on taking a known
volume of the core sample which is allowed to drain of water for a few minutes, possibly
during gentle agitation, whilst preventing the loss of any clog matter. The sample is placed
in a container and the amount of water needed to fill the sample (again with or without
agitation) divided by the total apparent volume of the sample is the free water porosity. This
measure is reliable in samples with well connected pores so that all of the free water is able
to drain unhindered from the sample. The water is then drained again from the sample in
preparation for the second test. Collection and determination of the volume of this second
drain of water is advisable as a means to check the reliability of the first measurement.
Determination of the remaining, and hence associated, water in the sample can be achieved
using one of two methods. The longer of the two methods allows the remaining water to
drain slowly from the sample in a sealed vessel (as evaporation will result in much of the
loss) until it is completely dry, the volume of the collected water then represents the pore
space occupied by interstitial water in the sample. This is a lengthy process and requires a
careful set up to avoid disrupting the sample. The alternative technique, which is often
Measurement Techniques for Wastewater Filtration Systems
119
combined with a solids assay as described in section 3.2.5 is to weigh the sample before and
after gentle heating to evaporate the interstitial water fraction. The mass change is then used
to determine the volume of water lost. This method may give unpredictable results in a
sample which contains volatile solids which will contribute to the mass of the sample.
Although these techniques both offer useful results, the need to collect a core of the gravel
substrate often makes them less attractive than their in situ counterparts.
3.2.2 Time domain reflectometry
Time domain reflectometry is a technique which relies on the relationship between the
dielectric properties of different materials and their water content. The principal for
measuring clogging using Time Domain Reflectometry and the next two techniques to be
reviewed; Capacitance Probes and Ground Penetrating Radar; is that they all measure
properties that will vary depending on the amount of interstitial water in a sample.
Therefore, it would be possible to detect where accumulation of clog matter has reduced the
interstitial water volume compared to a calibrated clean sample. This, in itself, is an inherent
limitation of these techniques as clog matter is typically well hydrated (often above 95%
water by volume) and as such very small variations in water volume must be measured. The
complexity of the system used to perform the measurements is such that a detailed
description is beyond the scope of this chapter. Instead, the basic operating principles of the
technology will be provided along with the relationship between the results and the
physical properties of the sample. The technique is particularly difficult to use in a gravel
substrate as the grains disrupt its underlying mechanism. Its use in heavily clogged media is
however still valuable as a method for assessing water content.
The underlying principle of time domain reflectometry is similar to that of radar. An
electromagnetic wave pulse is produced and transmitted into the gravel substrate, often using
metal electrodes. The wave will propagate through the medium at a speed which is
determined by the dielectric constant of the medium which is dependent on the water content.
The wave will be reflected and picked up by the same electrodes as were used to deliver it into
the medium. The time between the emission and absorption of this pulse is used to determine
the speed with which it travelled through the medium. This is then converted to water content
using a calibration produced from samples with known water content. Whilst the technique
may offer very accurate results, it is heavily influenced by spurious reflections caused by local
heterogeneities, may be affected by changes in electrical conductivity (such as those caused by
salinity) and relies on calibration in similar samples to those under test to be representative.
An alternative technique which relies on the same underlying principle is known as time
domain transmissometry. In this technique, instead of using the same electrodes to generate
and measure the pulse, separate electrodes are used. In this way it is possible to somewhat
reduce the influence of local inhomogeneity on the results although this is often of little benefit
in a filtration system containing gravel which is still highly reflective to the wave.
3.2.3 Capacitance probe
The operation of the capacitance sensor is similar in some respects to time domain
reflectometry in that electrodes are used to determine the dielectric properties of the gravel
substrate. In this technique however, the two electrodes are commonly metallic plates
wrapped around a cylinder (see Figure 6). In combination with the surrounding gravel
substrate, clog matter and water, a capacitor is formed. The capacitance of this arrangement
is dependent on the size and spacing of the plates and the dielectric permittivity of the
Waste Water - Treatment and Reutilization
120
surrounding medium. The dielectric permittivity is in turn dependent predominantly on the
water content and salinity. Several of these probes are often included on a single plastic
cylinder to maximise the measurements that can be made for a single insertion.
Fig. 6. Schematic of capacitance sensor. Right hand figure is front view of left hand figure
showing the area in which measurements are made.
The measurement of the capacitance is typically made by including the capacitance probe as
an element of a resonant circuit. The frequency at which the circuit resonates is determined by
the value of the capacitor and thus may be used to determine the dielectric permittivity in the
region of influence (see figure 6). The size of, and spacing between the plates may be adjusted
to optimise the penetration distance from the cylinder into the medium based on the intended
usage. For example, the plates would ideally be separated by a greater distance for
measurements in gravel where the particle size is large in comparison to a measurement in a
sand filter. As with time domain reflectometry, the capacitance probe must be calibrated.
Owing to its considerably lower cost however, it is quite practical to have several probes along
the bed including one in the influent, thus compensating for the effect of salinity.
3.2.4 Ground penetrating radar
Ground penetrating radar is a technique which uses pulses of microwaves to determine the
properties of a sample non-destructively. The instruments are relatively expensive and
complex but offer an unprecedented measure of the dielectric properties of a sample without
requiring its extraction. In a typical setup, a unit is moved along the surface of a bed whilst the
measurement is made. Microwave pulses are transmitted by a coil in contact with the surface
of the ground. At changes in dielectric constant (such as different media or different water
content) the microwaves are reflected back and picked up by the instrument. The use of
ground penetrating radar in a typical constructed wetland is very challenging given the reed
growth above ground making it difficult to place the equipment on the surface and the
propensity for gravel to cause a great number of reflections before any measurements have
been made. For this reason it is not usually practical for the majority of situations.
3.2.5 Solids assays
In order to assess the quantity of clog matter in an extracted sample from a wetland, solids
assays may be used. The typical procedure is to extract a known volume or mass of sample
Measurement Techniques for Wastewater Filtration Systems
121
from a wetland and collect the water which drains from it. This sample is then dried and the
remaining solids are weighed to determine the free particulates in the sample. In the case of
a gravel substrate, the sample is washed to allow the clean gravel to be sieved out and
removed. The accumulated solids fraction is then dried (often in an oven at a low
temperature) and the remaining solid fraction weighed to determine the quantity of the clog
matter. Whilst this method offers a good measure of the total quantity of solids in the
sample, as a single measurement it may not offer much insight into the actual clogging
process. This is because a large contribution of the clogging comes from biofilms which may
contain up to 80% water by volume. When this water is removed, the volume occupied by
the biofilm will be greatly reduced thus giving a misleading result in terms of the extent of
the clogging. This test is best performed with the direct porosity measurements detailed in
section 3.2.1 to provide a fuller understanding. If desired, ignition tests above 550°C can
then be used to calculate the volatile fraction of the sample (BS-EN-872, 2005).
3.3 Hydrodynamic visualisation
All of the techniques presented thus far in this chapter have been localised measurements
which rely on studying the material directly around a probe or the extraction of samples for
laboratory analysis. In systems in which the flow path is in some way defined (as it is in
constructed wetlands) hydrodynamic visualisation techniques are useful for determining
how flow responds to clogging. Two strategies are discussed in this section both of which
rely on injecting a tracer (for example rhodamine dye) near the inlet and then monitoring for
its presence at one or more locations in the bed.
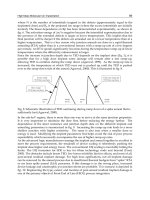
3.3.1 Breakthrough curve
The basic measurement using a tracer method is the breakthrough curve. In this technique, a
tracer such as rhodamine dye is injected at the inlet of the bed. A specific sensor for the dye
to be used (an optical fluorescence detector in the case of rhodamine dye) is installed at a
location in the bed (typically the outlet in the case of breakthrough) and is monitored from
the time of injection, through detection of the dye, when it passes through the sensor, until
the detection level returns to that at the start of the test. A plot of the detected dye from
injection to end is known as the breakthrough curve and will typically have a single peak of
given amplitude and breadth. The integral of this curve should equal the amount of dye
injected. Should this not be the case, it is likely that there are features of the flow path that
result in stagnant water. Occasionally distinct peaks will be picked up other than the main
peak which indicates flow short-circuiting along multiple preferential flow-paths and
resulting in multiple peaks. The treatment performance of the system is directly linked to
the hydraulic performance. Ideally, the system behaves as a Plug Flow Reactor which means
that all of the fluid remains in the system for the same duration, the design retention time;
which would correspond to a sharp pulse of tracer being detected at the outlet. The broader
the breakthrough curve, the greater the extent of mixing and short-circuiting within the
system, and the more likely that some flow will prematurely discharge before sufficient time
for treatment has elapsed (Figure 7). It is always wise to repeat the measurement with the
sensor at several outlet locations on several different occasions as there are many factors
which affect the flow path including temperature, humidity and precipitation. The reader is
Waste Water - Treatment and Reutilization
122
referred to Appendix B in Kadlec and Wallace (2009) for more information on such an
analysis in constructed wetlands.
Fig. 7. Breakthrough curves from a direct (solid line) and tortuous (dashed line) system.
3.3.2 Internal tracing
If repeatedly monitored over the lifetime of the bed, the breakthrough curve method can be
a good indicator of bed health. For a single or short term measurement, it can be beneficial
to use a setup with several sensors to gain a better understanding of the local variations in
the flow path. Such a setup is known as internal tracing. The same equipment is used as in
the breakthrough curve system with a single injection of dye which is monitored over a grid
or line of sensors. Typically at least three will be used in a line or nine in a grid. The analysis
is very similar to that used for the breakthrough curve method only this time the dye front
can be followed along the bed. As can be seen in the example in figure 8, it is common for
the dye to arrive first at the detector nearest the injection with a sharp peak, as there has
been little diffusion on the flow path. With high short circuiting a broader peak may then
picked up on the next in line before the other two on the same row (detector 5 before 1 and 3
on figure 8) as the dye is carried primarily along the bed rather than across it. Ideally, the
flow will be detected simultaneously across the width of the bed (detectors 1, 2 and 3) before
advancing to the next row, which indicates good volumetric efficiency. In older, more
clogged systems, this test often reveals areas of subsurface stagnation, bypass flows and
blockages which core sampling using other techniques would not have found. The
equipment is however quite costly and the analysis of many probes to achieve an in depth
understanding is often challenging.
4. New Techniques for in situ measurements
Measurements made using more than one traditional method are often poorly correlated.
This has lead scientists to conclude that it is the form and not the quantity of the clogging
that is of primary importance (Caselles-Osorio et al., 2007). To improve the reliability of the
Measurement Techniques for Wastewater Filtration Systems
123
measurements made and ensure that the information collected is as useful as possible, two
new techniques have been developed. The first of these is the in situ permeameter which
allows localised measurements of hydraulic conductivity to be performed at several bed
locations. The second uses embeddable magnetic resonance probes to determine localised
relative ratios of biofilm and particulate clogging. Combination of these two techniques
shows good promise as a method for fully determining the clog state of a constructed
wetland and indeed any other large scale waste water filtration system.
4.1 In situ Permeameter tests
By using an adaptation of the Hvorslev Test, as proposed in the Naval Facilities Soil
Mechanics Design Manual (NAVFAC, 1986), it has been possible to directly determine
gravel conductivity in Horizontal Subsurface Flow Constructed Wetlands (Caselles-Osorio
and García, 2007, Caselles-Osorio et al., 2007, Pedescoll et al., 2009). Here an open ended
tube is used such that the piezometer encases the sample to be tested. In this way, the
ability to easily delineate variations in vertical conductivity is sacrificed as the test measures
the vertical conductivity of the entire gravel core. Regardless, these authors consider the
method introduced by Caselles-Osorio and García (2007) to be highly preferable to
laboratory based hydraulic conductivity studies, as direct measurements of substrate
conductivity are made, thus removing the discussed uncertainties associated with sample
extraction and transportation.
Recently, a novel method has been devised to allow the three dimensional hydraulic
conductivity of HSSF TWs to be determined in situ. The method recreates the laboratory
constant head permeameter test in situ by using a submersible permeameter cell that
encapsulates a test specimen of media, and a Mariotte Siphon actuated recharge reservoir to
maintain constant head conditions in the cell (figure 9). The apparatus is designed for use
by one person in remote locations, weighing approximately 10 kg and utilising 10 L of water
for one test, and is sized to be appropriate for the range of media hydraulic conductivities
typically encountered in mature subsurface flow wetlands (from 0 to 10,000 m/d, Pedescoll
et al., 2009). Manometer take off tubes are immersed to different depths within the
permeameter cell so that the vertical variation of hydraulic conductivity can be found. By
repeating the test at different locations over the surface of the bed and interpolating between
results it is possible to generate a three-dimensional hydraulic conductivity profile for the
wetland. The apparatus design and methodology are elaborated upon in Knowles and
Davies (2009b).
4.2 Magnetic resonance probes
Magnetic resonance is a technique which is most often found in a medical setting. It is
however also useful as a tool for making measurements in any aqueous environment. Its use
for the study of porous media is well published in the literature although this usually
involves the extraction of a sample core (typically under 10cm diameter and 70cm long)
from the system of interest and measurement in a laboratory. An alternative system is used
when prospecting for oil which involves an inside out magnetic resonance device that
interrogates the physical properties of the rocks surrounding a trial bore hole. More recently
a device has been produced (Morris, et al. 2009) which allows in situ determination of the
relative ratios of particulate anvd biological clogging in porous filtration systems. The
principles of operation and its benefits are discussed in this section.
Waste Water - Treatment and Reutilization
124
Fig. 8. Top: nine probe internal tracing setup. The grey shaded areas are flow paths, the
darker the shade, the faster the flow it represents. Bottom: simulated results for each probe.
Measurement Techniques for Wastewater Filtration Systems
125
Fig. 9. Experimental set-up for the in situ determination of the vertical hydraulic
conductivity profile of high porous media (not to scale). Reproduced from Knowles and
Davies (2009b).
4.2.1 Theory
Magnetic resonance is a measurement technique which relies on the intrinsic properties of
water molecules [9]. When in a magnetic field, the nuclei of hydrogen molecules align with
the field in a process known as diamagnetism. This alignment can be perturbed by applying
a time varying magnetic field. By applying such a field at an appropriate frequency, the
nuclei can be made to rotate. Once the nuclei have been rotated away from the static
magnetic field, they will attempt to realign. As this occurs, a process known as precession
takes place in which the nuclei rotate about the axis of the static field much like a spinning
top. Because each of the nuclei behaves like a tiny magnet, a very small current can be
induced in a conducting coil placed around the sample. In combination, these effects can
provide information about the properties of the molecules in the sample. The magnetic
resonance probe developed for determining the ratios of biological and particulate clogging
uses a series of applied time varying magnetic fields known as a spin echo sequence. This
allows averaging of the signal before the system has returned to equilibrium. If the delay
between repeating this sequence is not longer than the time it takes for the system to return
to equilibrium, there will be a loss in signal. This characteristic is used to measure the ‘spin
lattice relaxation time’ or T
1
. By systematic variation of this delay (a process known as
saturation recovery) an exponential relationship is found with time constant T
1
[11]. This
time constant is dependent on the molecular environment and hence can be used to
determine the local association of water. In the presence of several different water
associations, the resulting data will be multi-exponential allowing the ratios of each
environment to be determined.
Waste Water - Treatment and Reutilization
126
4.2.2 Practical implementation
The magnetic resonance probes are produced with permanent magnets to generate the static
magnetic field. This allows the probes to be sufficiently small that they can be embedded in
the filtration system. Within these magnets is an insulated copper coil which is used to
apply the time varying magnetic field to the sample and is also used to collect the resulting
signal. This probe is attached to an electronic system which generates the required time
varying fields, averages the resulting signals and processes the results to determine the
ratios of the clogging components. The clog state of the medium under interrogation is then
provided to the user. Probes have been produced which can be used to make individual
localised measurements or to make several measurements at different heights (Figure 9)
thus limiting the disturbance to the filter medium.
4.2.3 Data collection
For a typical subsurface flow constructed wetland, at least six of these probes would be
placed at various locations across the bed (see figure 10). The relative ratios of biological and
particulate clogging are determined at each of these locations over time from the saturation
recovery curves. The ratios (R
BP
) are determined from the curves automatically using the
relationship in equations 5 and 6.
0
0
,
B
BP
P
M
R
M
= (5)
0
1
1
1exp ,SM
T
⎡
⎤
⎛⎞
=−
⎜⎟
⎢
⎥
⎝⎠
⎣
⎦
(6)
where M
0
is proportional to the number of protons contributing to the signal, S, from that
environment, T
1
is the spin lattice relaxation time and subscripts B and P represent the
contributions from biological and particulate clogging respectively. Curves representative of
the situations of dominant particulate clogging, dominant biological clogging and an equal
ratio of the two are shown in figure 11. Although in established systems these are almost
never seen as there are often as many as four water environments in the pore spaces of the
gravel, the simple curves are presented here to give the reader a fundamental
understanding of the process.
Fig. 9. Magnetic resonance probe used to determine the ratios of particulate and biological
clogging. This version has three sensors spaced along its length.
Measurement Techniques for Wastewater Filtration Systems
127
Fig. 10. Cross sectional view of subsurface flow wetland showing six submersible analysers
each with three probes at different heights.
The time evolution of the clogging ratios and individual values should be monitored to
provide an indication of the bed health. Typically the inlet plots will show a more rapid
increase in biological clogging than those near the outlet of the system. A typical monitoring
plot which would be obtained from a six probe system is shown in figure 12.
4.2.4 Limitations
The technique is intrinsically limited to dealing with filtration of aqueous systems which are
free from magnetic compounds. Although this is not a concern in municipal waste water
treatment, it may be an issue for the treatment of industrial run off, particularly ochre rich
mine water. As the probes are embedded into the actual filter medium which is typically
outdoors, temperature correction is a key issue which must be compensated for regularly.
The current system relies on experiencing temperature changes less than 5K about the
average for the system into which it is installed. A second generation probe system which
automatically corrects for changes in temperature up to 20K about the average is currently
under development.
5. Dealing with heterogeneous survey results
One of the challenges when performing measurements on several porous media filtration
systems is the comparison of filters with different construction. It is often the case,
particularly with industrial waste water treatment, that there will be several stages of
filtration utilising different filter media, to remove a range of undesirable content to meet
preset consents.
Recently a method has been introduced which allows several factors of a given filtration
system to be considered and, in combination with measured parameters permits the
determination of a clog factor. This numerical value provides a means of comparing the
clog state of several diverse treatment stages thus allowing hydraulic health to be
monitored over time. This information can then be fed back into the design of a new
system which will last longer or operate more effectively. In this section we consider how
the clog factor can be applied to wetlands for the measurement techniques discussed in
the previous sections.
Waste Water - Treatment and Reutilization
128
5.1 Clog factor
Due to the vide variation in hydraulic conductivity which occurs in clogged filters, the
arithmetic mean of measurements may not provide a very representative indication of the
hydraulic health of the system. A common practice in hydrology is to use the geometrical
mean of the dataset as a more representative improvement on either the arithmetic or
harmonic means (Binley et al., 1989). Representative homogeneous values for hydraulic
conductivity are however generally misleading, as in actuality hydraulic conductivity spans
several orders of magnitude. A single value model cannot capture the influence of varying
hydraulic conductivity on the subsurface water table profile: a function that is imperative
for determining wetted volume and hence predicting treatment performance (Persson et al.,
1999). In response, the Clog Factor (CF) has recently been developed.
The CF is a novel metric that converts hydraulic conductivity, an intensive physical
property, into an extensive bulk property that can be representatively averaged for
subsequent analysis. It can be used to describe the state of clogging in any porous media
flow system but has been derived intentionally to explore clogging dynamics in subsurface
flow wetlands. The CF is based on the Kozeny-Carman equation (equation 7) which
describes the theoretical hydraulic conductivity of porous media, based on the assumption
of ideal spherical media of homogeneous diameter d and porosity θ. The fluid density ρ,
dynamic viscosity μ and gravity g are also included in the Kozeny Carman equation.
Applying this formulation in reverse, experimentally measured values of hydraulic
conductivity and the median particle diameter of the sampled gravel are used to calculate
corresponding theoretical clogged porosities θ
E
.
()
23
2
150 1
gd
k
ρθ
μ
θ
=
−
(7)
0 400 800
0
0.5
1
1.5
2
T
R
, ms
Signal Intensity, a.u.
mainly particulate clogging
mainly biological clogging
mixed clogging
Fig. 11. Typical saturation recovery curves for three different clogging cases.
Measurement Techniques for Wastewater Filtration Systems
129
Fig. 12. Simulated results of typical monitored output for six probe system. Grey is
biological clogging whilst black represents particulate clogging. The dashed line is 10 times
the ratio between them.
The ratio of clogged to experimental clean porosity allows the CF to be calculated (equation
8), whereby a value of 0 indicates zero clogging and a value of 1 indicates complete
clogging. It is important to emphasise that the CF may not represent the practical clogged
porosity, as it has been shown that reductions in hydraulic conductivity often do not
correspond to reductions in porosity, and rather it is the form and nature of clogging that
are important (Caselles-Osorio et al., 2007; Platzer and Mauch, 1997; Tanner et al., 1998). In
this way the CF actually represents the effective or relative reactor volume that has been lost
to clogging.
1
E
I
CF
θ
θ
=− (8)
The advantages of the Clog Factor are:
•
It is an extensive bulk property so it can be applied to any scale porous media flow
system
•
Removes dimensions from the data so that comparisons can be performed between
systems with different physical and media sizes
•
Highlights deviations from theoretical clean conductivity due to both clogging and
media non-ideality
•
Allows reasonable statistical comparisons where orders of magnitude changes in
hydraulic conductivity would skew a data set
•
Allows single-parameter values to be published to indicate health of bed at a point in
time
The Clog Factor provides a useful tool with which the inter- and intra-system variations of
filter system hydraulic health can be objectively compared.
Waste Water - Treatment and Reutilization
130
6. Conclusion
In this chapter we have detailed the various methods currently available to determine the
extent to which a large scale porous media based filtration system has become clogged. By
considering the traditional methods available to measure the clogging it has been shown
that any single technique cannot provide a sufficiently detailed picture of the state of the
system. We have presented two recent developments for in situ measurements of the
clogging and have shown that they both provide more relevant information than their
laboratory based counterparts. By combining these two techniques, the full nature of the
clogging can be elucidated and used to inform remedial action leading to a life extension.
7. References
Binley, A., Beven, K. & Elgy, J. (1989). Physically Based Model of Heterogeneous
Hillslopes: 2. Effective Hydraulic Conductivities. Water Resources Research, 25 (6),
1227-1233.
Brix, H. (1994) Functions of Macrophytes in Constructed Wetlands. Water Science and
Technology. 29, 71.
Caselles-Osorio, A., Puigagut, J., Segu, E., Vaello, N., Granés, F., García, D. & García, J.
(2007). Solids accumulation in six full-scale subsurface flow constructed wetlands.
Water Research, 41 (6), 1388-1398.
Cooper, D., Griffin, P. & Cooper, P. (2005). Factors affecting the longevity of sub-surface
horizontal flow systems operating as tertiary treatment for sewage effluent. Water
Science and Technology, 51 (9), 127-135.
Cooper, P. F., Job, G. D. & Green, M. B. (1996). Reed beds and constructed wetlands for
wastewater treatment. Water Research Centre.
EC/EWPCA (1990). European Design and Operations Guidelines for Reed Bed Treatment Systems.
Swindon, UK: WRc.
García, J., Ojeda, E., Sales, E., Chico, F., Píriz, T., Aguirre, P. & Mujeriego, R. (2003). Spatial
variations of temperature, redox potential, and contaminants in horizontal flow
reed beds. Ecological Engineering, 21 (2-3), 129-142.
Green, M. B. & Upton, J. (1995). Constructed reed beds: Appropriate technology for small
communities. Water Science and Technology, 32 (3), 339-348.
Griffin, P., Wilson, L. & Cooper, D. (2008). Changes in the use, operation and design of
sub-surface flow constructed wetlands in a major UK water utility. 11th
International Conference on Wetland Systems for Water Pollution Control, Indore,
India, 419-426.
Hvorslev, M.J. (1951). Time Lag and Soil Permeability in Ground-Water Observations,
Bulletin Number 36, Waterways Experimental Station Corps of Engineers.
Kadlec, R. H. & Watson, J. T. (1993). Hydraulics and Solids Accumulation in a Gravel Bed
Treatment Wetland. In: MOSHIRI, G. A. E. (ed.). Constructed wetlands for water
quality improvement : Conference : Selected papers. Boca Raton: Lewis Pub, pp 227-
235.
Knowles, P. R. (2010). Clogging and Hydraulics in Horizontal Subsurface Flow Constructed
Wetlands. Doctorate in Mechanical Engineering and Design Thesis, Aston
University.
Measurement Techniques for Wastewater Filtration Systems
131
Knowles, P. R., Griffin, P. & Davies, P.A. (2009a). Complementary methods to investigate
the development of clogging within a horizontal sub-surface flow tertiary
treatment wetland. Water Research. 44, 320.
Knowles, P. R. & Davies, P. A. (2009b). A method for the in-situ determination of the
hydraulic conductivity of gravels as used in constructed wetlands for wastewater
treatment. Desalination and Water Treatment, 1 (5), 257–266.
Knowles, P. R. & Davies, P. A. (2010). A Finite Element Approach to Modelling the
Hydrological Regime in Horizontal Subsurface Flow Constructed Wetlands for
Wastewater Treatment In: VYMAZAL, J. (ed.). Water and Nutrient Management in
Natural and Constructed Wetlands. Dordrecht: Springer Science+Business Media
B.V.
Knowles, P. R., Dotro, G. C., Nivala, J. & García, J. (2010a). Clogging in subsurface-flow
treatment wetlands: Occurrence, contributing factors, and management strategies.
Ecololgical Engineering, Submitted.
Knowles, P. R., Griffin, P. & Davies, P. A. (2010b). Complementary methods to investigate
the development of clogging within a horizontal sub-surface flow tertiary
treatment wetland. Water Research, 44 (1), 320-330.
Lin, A., Debroux, J., Cunningham, J. & Reinhard, M. (2003). Comparison of rhodamine WT
and bromide in the determination of hydraulic characteristics of constructed
wetlands. Ecological Engineering
Madigan, M. T., Martinko, J. M. & Brock, T. D. B. O. M. (2006). Brock biology of
microorganisms. 11th ed. ed. Upper Saddle River, NJ: Pearson Prentice Hall.
Morris, R.H., Newton, M.I., Bencsik, M., Knowles, P.R., Davies, P.A. & Griffin, P. (2009).
Long term monitoring of constructed wetlands using an NMR sensor. IEEE Sensors.
1733-1737.
Murphy, C. & Cooper, D. (2010). The Evolution of Horizontal Sub-Surface Flow Reed Bed
Design for Tertiary Treatment of Sewage Effluents in the UK. In: VYMAZAL, J.
(ed.). Water and Nutrient Management in Natural and Constructed Wetlands.
Dordrecht: Springer.
Pedescoll, A., Uggetti, E., Llorens, E., Granés, F., García, D. & García, J. (2009). Practical
method based on saturated hydraulic conductivity used to assess clogging in
subsurface flow constructed wetlands. Ecological Engineering, 35 (8), 1216-1224.
Persson, J., Somes, N. L. G. & Wong, T. H. F. (1999). Hydraulic efficiency of constructed
wetlands and ponds. Water Science and Technology, 40 (3), 291-300.
Platzer, C. & Mauch, K. (1997). Soil clogging in vertical flow reed beds - Mechanisms,
parameters, consequences and solutions? Water Science and Technology, 35 (5),
175-181.
Speer, S., Champagne, P., Crolla, A. & Kinsley, C. (2004). Hydrodynamic Pathways in a
Maturing Constructed Wetland. 8th International Conference on Wetland Systems for
Water Pollution Control, Avignon, France.
Suliman, F., Futsaether, C., Oxaal, U., Haugen, L. E. & Jenssen, P. (2006). Effect of the inlet-
outlet positions on the hydraulic performance of horizontal subsurface-flow
wetlands constructed with heterogeneous porous media. Journal of Contaminant
Hydrology, 87 (1-2), 22-36.
Waste Water - Treatment and Reutilization
132
Tanner, C. C., Sukias, J. P. S. & Upsdell, M. P. (1998). Organic matter accumulation during
maturation of gravel-bed constructed wetlands treating farm dairy wastewaters.
Water Research, 32 (10), 3046-3054.
USEPA (2000). Constructed wetlands treatment of municipal wastewaters. U.S. EPA Office
of Research and Development: Washington, D.C., United States.
7
Excess Sludge Reduction in Waste Water
Treatment Plants
Mahmudul Kabir, Masafumi Suzuki and Noboru Yoshimura
Akita University
Japan
1. Introduction
Household waste water is taken under WWT (Waste Water Treatment) process and treated
water is removed to the nature. Biological analysis method using activated sludge is well
known and used method for the treatment of waste water as the running cost is cheap. But,
a large amount of excess sludge is produced in the W
aste Water Treatment Plants (WWTPs)
which is a great burden in both economical and environmental aspects. Fig.1 is an example
of annual industrial waste of Japan (Ministry of the Environment, Government of Japan,
2010). Sludge related garbage occupied 44.2% of the total industrial waste. In which about
86,860,000 ton of sludge related to WWTPs was produced in 2007. The excess sludge
contains a lot of moisture and which is not easy to treat. There are several works done by
many scientists to treat the excess sludge (Ide, 1990; Eckenfelder & Grau, 1998; Miyoshi,
2006; Sawada et al., 2005; Wei et al., 2003). These byproducts of WWTPs are dewatered,
dried and finally burnt into ashes. Some are used in farm lands as compost fertilizer. The
less dump places for ashes and the high cost to treat the excess sludge are huge burdens to
our society. In Japan, an average of Yen 20,000/t is needed to treat of excess sludge. Again,
burning of excess sludge evacuates the CO
2
in air, which is a cause of global warming. So,
the reduction of excess sludge is a growing demand to the modern society. It is not only a
headache of Japan, but also to the rest of the world.
2. Excess sludge reduction
There are some reports informing the success in order to reduce the excess sludge by adding
fallen leaves in the aeration tank where activated sludge is kept (Yoshida, 2000). But, the
mechanism is no yet clearly understood. Some efforts were carried out to increase the self
decay of activated sludge prolonging the aeration period (Yoshida, 2000). However, these
attempts are dependant on biological properties of activated sludge and difficult to achieve
good results at every time. Again, prolonging of the aeration period brings the excess
economical burdens. However, recently, a new approach has been started to minimize the
excess sludge of WWTPs. A part of activated sludge is treated under cell lysis. The treated
sludge or a part of the treated sludge can be decomposed by non-treated sludge when they
are sent to the aeration tank and thus the excess sludge can be minimized. Several reports
regarding to cell lysis in order to reduce excess sludge were published including ozonation,
milling process with beads, revolving disks methods etc. (Ide, 1990; Eckenfelder & Grau, 1998;