Wireless Sensor Networks Part 4 pot
Bạn đang xem bản rút gọn của tài liệu. Xem và tải ngay bản đầy đủ của tài liệu tại đây (1.85 MB, 25 trang )
Wireless Sensor Networks 68
Each of these signals is incorporated in the design for different reasons. Firstly, driving the off-
line controller with the DC component of the on-line control signal will ensure both controller
outputs will be approximately equal or
)()(
21
kuku
. Retaining the high frequency
component of the off-line feedback signal enables the off-line controller with the ability to
compensate for deep fades in the associated feedback signal. Should handoff then occur, a
large transient is avoided as the feedback conditions are sufficiently close to each other.
Fig. 18. The proposed modified WP-AW scheme, 2 Base Station Scenario.
Should base station 2 become on-line equation (21) becomes,
)()()()()()()()()(
222222
2mod
kyzWkyzWkykykykyky
linlinlinlindifflin
(22)
hence the modification will have no effect on the system and the AWBT scheme operates as
normal. This approach adds a filtered additional disturbance to the system that is intuitively
appealing given that a perturbation of the disturbance feedforward portion of the plant
G
1
will have no bearing on the stability properties of the system (Turner et al., 2007).
7. An 802.15.4 Compliant Testbed for Practical Validation
Employing the IEEE 802.15.4 compliant Tmote Sky platform (Polastre et al., 2007) operating
using TinyOS, the goal is to construct a testbed for realistic highly repeatable and rigorous
experiments. A fully scalable realistic scenario is envisaged where Line-Of-Sight (LOS) and
non-LOS occurrences are frequently observed inducing a Ricean and Rayleigh fading
channel respectively. The testbed must therefore include randomly located obstructions.
Stationary or embedded deployments are used to analyze the Additive White Gaussian
Noise channel and mobility must be introduced to examine multipath fading characteristics.
The physical makeup of the testbed is illustrated in Fig. 19 where the idea is to emulate a
scaled model of a building. The structure measures 2 meters squared and has re-
configurable partitioning to introduce obstructions for non-LOS experiments. This simple
scenario consists of three stationary nodes, a coordinator connected to a PC and two nodes
mounted on autonomous robots thereby introducing mobility into the system. Up to five of
mobiles can be introduced at any one time. A versatile robot, the MIABOT Pro, fully
autonomous miniature mobile robot is employed for this purpose. Dataflow withing the
network is illustrated in Fig. 20.
Fig. 19. Testbed Architecture
Fig. 20.
Dataflow within the nework.
Addressing Non-linear Hardware Limitations and Extending
Network Coverage Area for Power Aware Wireless Sensor Networks 69
Each of these signals is incorporated in the design for different reasons. Firstly, driving the off-
line controller with the DC component of the on-line control signal will ensure both controller
outputs will be approximately equal or
)()(
21
kuku
. Retaining the high frequency
component of the off-line feedback signal enables the off-line controller with the ability to
compensate for deep fades in the associated feedback signal. Should handoff then occur, a
large transient is avoided as the feedback conditions are sufficiently close to each other.
Fig. 18. The proposed modified WP-AW scheme, 2 Base Station Scenario.
Should base station 2 become on-line equation (21) becomes,
)()()()()()()()()(
222222
2mod
kyzWkyzWkykykykyky
linlinlinlindifflin
(22)
hence the modification will have no effect on the system and the AWBT scheme operates as
normal. This approach adds a filtered additional disturbance to the system that is intuitively
appealing given that a perturbation of the disturbance feedforward portion of the plant
G
1
will have no bearing on the stability properties of the system (Turner et al., 2007).
7. An 802.15.4 Compliant Testbed for Practical Validation
Employing the IEEE 802.15.4 compliant Tmote Sky platform (Polastre et al., 2007) operating
using TinyOS, the goal is to construct a testbed for realistic highly repeatable and rigorous
experiments. A fully scalable realistic scenario is envisaged where Line-Of-Sight (LOS) and
non-LOS occurrences are frequently observed inducing a Ricean and Rayleigh fading
channel respectively. The testbed must therefore include randomly located obstructions.
Stationary or embedded deployments are used to analyze the Additive White Gaussian
Noise channel and mobility must be introduced to examine multipath fading characteristics.
The physical makeup of the testbed is illustrated in Fig. 19 where the idea is to emulate a
scaled model of a building. The structure measures 2 meters squared and has re-
configurable partitioning to introduce obstructions for non-LOS experiments. This simple
scenario consists of three stationary nodes, a coordinator connected to a PC and two nodes
mounted on autonomous robots thereby introducing mobility into the system. Up to five of
mobiles can be introduced at any one time. A versatile robot, the MIABOT Pro, fully
autonomous miniature mobile robot is employed for this purpose. Dataflow withing the
network is illustrated in Fig. 20.
Fig. 19. Testbed Architecture
Fig. 20.
Dataflow within the nework.
Wireless Sensor Networks 70
7.1 Topological Support
As outlined in the IEEE 802.15.4 standard, the testbed must be capable of both star and peer-
to-peer type topological deployments.
Star Topology
To enable realtime control and data management over a star topological deployment, an
interface between Matlab and TinyOS has been established using TinyOS-Matlab tools
written in Java. The dataflow within the WBAN is illustrated in Fig. 21. The WSN nodes
gather sensor data from their surrounding environment. This information is then forwarded
to the PAN coordinator in packet format. The PAN coordinator upon receiving a packet,
takes a channel quality measurement e.g., RSSI or data-rate and attaches the result to the
packet. The packet is then bridged over a USB/Serial connection to a personal computer.
The realtime Matlab application identifies this connection by its phoenixSource name, e.g.,
'network@localhost:9000' or by its serial port name, e.g., 'serial@COM3:tmote' and imports
the packet directly into the Matlab environment for further processing. The channel quality
measurement taken by the coordinator is then used to implement a control strategy, the
result of which is packaged in a suitable message and forwarded via the PAN coordinator to
the WSN node. The node can subsequently update its control variable e.g. transceiver
output power or transmission frequency. An advantage of using this approach lies in the
fact that most of the processing occurs within the Matlab environment and at the PAN
coordinator. Reduced Functional Devices (RFDs) nodes can therefore be employed if
required by the application.
Fig. 21. IEEE 802.15.4 Testbed Dataflow with Matlab/TinyOS interface for Star Topology.
Peer-to-Peer Topology
The peer to peer configuration is also supported by the testbed. Fig. 22 illustrates a simple
peer-to-peer network scenario where C is the PAN coordinator again assumed to be
connected to a PC. N
1
and N
2
are Full Functional Devices (FFD) capable of communicating
with any device in the network. Initially in Fig. 22, both N
1
and N
2
are communicating with
C therefore the PAN coordinator is responsible for processing forwarded information and
implementing control strategies for both devices. N
2
then becomes mobile and moves out of
range of C. Subsequently, N1 multihops N
2
's sensor readings to the PAN coordinator.
Handoff has therefore occurred between C and N
1
, who now also has the responsibility for
implementing control decisions based on channel quality measurements taken when a
packet is received from N
2
. Each FFD in the network is therefore programmed with similar
capabilities to that of the PAN coordinator.
Fig. 22.
Simple Peer to Peer Topology Handoff Scenario.
8. Practical Evaluation of the Proposed Methodologies
This section is organized as follows: Firstly, a number of system parameters and
performance criteria specific to this scenario are outlined. Experimental results are then
presented to highlight the improvements afforded by AWBT. Simulation is employed to
emphasize how the modified AWBT scheme can improve performance at handoff, when the
inherent saturation constraints are ignored. Further, practical validation of the modified
AWBT scheme is then carried out on the testbed introduced previously. Where applicable,
the system response is analysed firstly without AWBT, then with AWBT in place and finally
with the modified AWBT design in place. Note: The QFT pre-filter and feedback controllers
in equations (10) and (11) and the AW controller (17) are tested in these experiments.
8.1 System Parameters and Performance Criteria
A sampling frequency of T
s
= 1(sec) is used throughout and a target RSSI value of −55dBm is
selected as a tracking floor level, guaranteeing a PER of
< 1%, verified using equations (2),
(3) and (4). The standard deviation of the RSSI tracking error is chosen as the performance
criterion in this work.
2
1
1
2
)]()([
1
S
k
e
kRSSIkr
S
(23)
where S is the total number of samples and k is the index number of the sample. Outage
probability is defined as,
100(%)
k
RSSImesRSSInumberofti
P
th
o
(24)
Addressing Non-linear Hardware Limitations and Extending
Network Coverage Area for Power Aware Wireless Sensor Networks 71
7.1 Topological Support
As outlined in the IEEE 802.15.4 standard, the testbed must be capable of both star and peer-
to-peer type topological deployments.
Star Topology
To enable realtime control and data management over a star topological deployment, an
interface between Matlab and TinyOS has been established using TinyOS-Matlab tools
written in Java. The dataflow within the WBAN is illustrated in Fig. 21. The WSN nodes
gather sensor data from their surrounding environment. This information is then forwarded
to the PAN coordinator in packet format. The PAN coordinator upon receiving a packet,
takes a channel quality measurement e.g., RSSI or data-rate and attaches the result to the
packet. The packet is then bridged over a USB/Serial connection to a personal computer.
The realtime Matlab application identifies this connection by its phoenixSource name, e.g.,
'network@localhost:9000' or by its serial port name, e.g., 'serial@COM3:tmote' and imports
the packet directly into the Matlab environment for further processing. The channel quality
measurement taken by the coordinator is then used to implement a control strategy, the
result of which is packaged in a suitable message and forwarded via the PAN coordinator to
the WSN node. The node can subsequently update its control variable e.g. transceiver
output power or transmission frequency. An advantage of using this approach lies in the
fact that most of the processing occurs within the Matlab environment and at the PAN
coordinator. Reduced Functional Devices (RFDs) nodes can therefore be employed if
required by the application.
Fig. 21. IEEE 802.15.4 Testbed Dataflow with Matlab/TinyOS interface for Star Topology.
Peer-to-Peer Topology
The peer to peer configuration is also supported by the testbed. Fig. 22 illustrates a simple
peer-to-peer network scenario where C is the PAN coordinator again assumed to be
connected to a PC. N
1
and N
2
are Full Functional Devices (FFD) capable of communicating
with any device in the network. Initially in Fig. 22, both N
1
and N
2
are communicating with
C therefore the PAN coordinator is responsible for processing forwarded information and
implementing control strategies for both devices. N
2
then becomes mobile and moves out of
range of C. Subsequently, N1 multihops N
2
's sensor readings to the PAN coordinator.
Handoff has therefore occurred between C and N
1
, who now also has the responsibility for
implementing control decisions based on channel quality measurements taken when a
packet is received from N
2
. Each FFD in the network is therefore programmed with similar
capabilities to that of the PAN coordinator.
Fig. 22.
Simple Peer to Peer Topology Handoff Scenario.
8. Practical Evaluation of the Proposed Methodologies
This section is organized as follows: Firstly, a number of system parameters and
performance criteria specific to this scenario are outlined. Experimental results are then
presented to highlight the improvements afforded by AWBT. Simulation is employed to
emphasize how the modified AWBT scheme can improve performance at handoff, when the
inherent saturation constraints are ignored. Further, practical validation of the modified
AWBT scheme is then carried out on the testbed introduced previously. Where applicable,
the system response is analysed firstly without AWBT, then with AWBT in place and finally
with the modified AWBT design in place. Note: The QFT pre-filter and feedback controllers
in equations (10) and (11) and the AW controller (17) are tested in these experiments.
8.1 System Parameters and Performance Criteria
A sampling frequency of T
s
= 1(sec) is used throughout and a target RSSI value of −55dBm is
selected as a tracking floor level, guaranteeing a PER of
< 1%, verified using equations (2),
(3) and (4). The standard deviation of the RSSI tracking error is chosen as the performance
criterion in this work.
2
1
1
2
)]()([
1
S
k
e
kRSSIkr
S
(23)
where S is the total number of samples and k is the index number of the sample. Outage
probability is defined as,
100(%)
k
RSSImesRSSInumberofti
P
th
o
(24)
Wireless Sensor Networks 72
where RSSI
th
is selected to be −57dBm, a value below which performance is deemed
unacceptable in terms of PER. This can be easily verified again using equations (2), (3) and
(4). To fully assess each paradigm, some measure of power efficiency is also necessary and
here the average power consumption in milliwatts is defined as,
)(10
10/)(
1
1
mWPav
S
k
dBm
kp
S
(25)
where p
dBm
(k) is the output transmission power in dBm, S is the total number of samples and
k is the index of these samples.
8.2 Justification and Improvements afforded by Anti-Windup
To validate the use of AWBT, a number of experiments were conducted using the repeatable
scenario outlined above. Firstly, in order to justify the use of the standard deviation
performance criterion (23), the results for a single experiment are shown in Fig. 23. This
experiment consists of one mobile node and uses the QFT controller design without AW but
with pre-filter. It can be observed that, without AWBT, the controller output when saturated
begins to increase or `wind-up' and as a result the system upon re-entry to the linear region
of operation, a substantial period of time is necessary for the actuator signal to 'unwind'
back down to normal levels. This results in performance degradation in terms of standard
deviation away from the setpoint. This feature wherein the operation of the system is in
linear mode but the actuator variable is still higher than is necessary, translates into real
energy loss that can be treated using AW methods.
Fig. 23.
System response without AWBT.
Fig. 24 displays the results of the same experiment with AW in place. It is clear that while
saturation cannot be avoided, the 'wind-up' exhibited previously without AW is no longer
present. Note: there is no handoff induced in this experiment therefore the modified AWBT
scheme is not required for validation purposes.
Fig. 24. System response with AWBT.
8.3 Benchmark Comparative Study
In this section the performance of the AWBT methodology is compared with fixed step,
H∞/LMI and adaptive step active power control methods. A brief description of these
alternative methods is now presented.
Fixed Step (Conventional) Size Power Control
This method is widely used in CDMA IS-95 systems due to its rapid convergence
(Goldsmith, 2006). This strategy also assumes that the plant is modelled as an integrator.
The approach is implemented using the following power control law
))()(()1()( kRSSIkrkyky
(26)
where y(k) is the transmission power and δ is the fixed step size (1 for the purposes of this
experiment).
H∞/LMI Power Control
The LMI based approach outlined by (Ho, 2005) is also included in the study. Given the
relative low order of the proposed distributed system, this approach will yield the controller
K = 1, this is equivalent to the conventional approach with step size equal to one. These two
methods are therefore analyzed as one.
Adaptive Step Size Power Control
This method uses the same power control law as the fixed step approach (Goldsmith, 2006),
however the parameter δ needs to be updated depending on local system requirements
according to the following,
2
1
22
])1()1([)(
e
kk
(27)
Addressing Non-linear Hardware Limitations and Extending
Network Coverage Area for Power Aware Wireless Sensor Networks 73
where RSSI
th
is selected to be −57dBm, a value below which performance is deemed
unacceptable in terms of PER. This can be easily verified again using equations (2), (3) and
(4). To fully assess each paradigm, some measure of power efficiency is also necessary and
here the average power consumption in milliwatts is defined as,
)(10
10/)(
1
1
mWPav
S
k
dBm
kp
S
(25)
where p
dBm
(k) is the output transmission power in dBm, S is the total number of samples and
k is the index of these samples.
8.2 Justification and Improvements afforded by Anti-Windup
To validate the use of AWBT, a number of experiments were conducted using the repeatable
scenario outlined above. Firstly, in order to justify the use of the standard deviation
performance criterion (23), the results for a single experiment are shown in Fig. 23. This
experiment consists of one mobile node and uses the QFT controller design without AW but
with pre-filter. It can be observed that, without AWBT, the controller output when saturated
begins to increase or `wind-up' and as a result the system upon re-entry to the linear region
of operation, a substantial period of time is necessary for the actuator signal to 'unwind'
back down to normal levels. This results in performance degradation in terms of standard
deviation away from the setpoint. This feature wherein the operation of the system is in
linear mode but the actuator variable is still higher than is necessary, translates into real
energy loss that can be treated using AW methods.
Fig. 23.
System response without AWBT.
Fig. 24 displays the results of the same experiment with AW in place. It is clear that while
saturation cannot be avoided, the 'wind-up' exhibited previously without AW is no longer
present. Note: there is no handoff induced in this experiment therefore the modified AWBT
scheme is not required for validation purposes.
Fig. 24. System response with AWBT.
8.3 Benchmark Comparative Study
In this section the performance of the AWBT methodology is compared with fixed step,
H∞/LMI and adaptive step active power control methods. A brief description of these
alternative methods is now presented.
Fixed Step (Conventional) Size Power Control
This method is widely used in CDMA IS-95 systems due to its rapid convergence
(Goldsmith, 2006). This strategy also assumes that the plant is modelled as an integrator.
The approach is implemented using the following power control law
))()(()1()( kRSSIkrkyky
(26)
where y(k) is the transmission power and δ is the fixed step size (1 for the purposes of this
experiment).
H∞/LMI Power Control
The LMI based approach outlined by (Ho, 2005) is also included in the study. Given the
relative low order of the proposed distributed system, this approach will yield the controller
K = 1, this is equivalent to the conventional approach with step size equal to one. These two
methods are therefore analyzed as one.
Adaptive Step Size Power Control
This method uses the same power control law as the fixed step approach (Goldsmith, 2006),
however the parameter δ needs to be updated depending on local system requirements
according to the following,
2
1
22
])1()1([)(
e
kk
(27)
Wireless Sensor Networks 74
where as before σ
e
, is the sampled standard deviation of the power control tracking error
and α is the forgetting factor, (assumed to be 0.95 here), introduced to smooth the measured
RSSI signal which may be corrupted by noise.
Fig. 25.
Comparison between adaptive, conventional/H∞ and AWBT Hybrid schemes.
Benchmark Comparative Study Results
Fig. 25 illustrates how the proposed AWBT system performs when compared with the
approaches outlined above. Clearly the hybrid design outperforms the adaptive approach
for all of the stated criteria and exhibits substantial improvement over a conventional/H∞
approach in terms of standard deviation and outage probability when low levels of mobility
exist in the system. However, with fewer mobile nodes in the system, the conventional/H∞
approach consumes less power. This is due to the aggressive action of the pre-filter that
results in improved tracking performance. As the number of mobile users is increased the
standard deviations of the AWBT design and the conventional/H∞ converge, however the
hybrid design continues to exhibit improved outage probability.
The average power consumption for the three approaches also converges, highlighting the
improved power efficiency characteristics that are achieved for the hybrid design with
increased levels of mobility. This is to be expected given that AW inherently seeks to
dynamically decrease the magnitude of the controller output. It should be noted that the
vast majority of the complexity of the proposed hybrid solution lies in the synthesis
routine,and that very little additional computational overhead was a feature of the practical
implementation. Empirical evidence suggests little or no difference between the AWBT
approach and a more conventional adaptive step size power control approach in terms of
microcontroller activity during realtime experiments.
8.4 Stand-Alone Bumpless Transfer performance
Due to the naturally occurring output power saturation constraints that arise in the system,
which cannot be removed, it is difficult to ascertain the performance improvements afforded
by the BT method as a stand alone handoff scheme. Simulation can be a useful tool in this
regard. Fig. 25 illustrates some results where at time index 35 sec, handoff occurs between
two base stations. In this instance there is a difference of 20 dBm in the RSSI, between the
signal received at the on-line base station and the RSSI signal observed at the off-line base
station. As mentioned earlier, this dissimilarity in observed RSSI is due to the propagation
environment and is a realistic value based on the experimental observations in the indoor
environment that was used in this study.
From Fig. 25, it is clear that the system without AWBT exhibits an extremely large transient
response and following handover never achieves steady state prior to the completion of the
simulation. The system with AWBT in place exhibits some improvement, however there is
significant time spent below RSSIth and as a result outage probability is still at an
unacceptable level. When the modified AWBT solution is added, the outage probability is
dramatically reduced highlighting the improved performance afforded by the new
approach. The modified solution also improves the transient response by considering the
off-line high frequency component and compensating accordingly. The performance is
summarized in Table 1.
Without AWBT
(QFT Only)
With AWBT Modified AWBT
Standard Deviation
e
30.59 4.445 1.603
Outage Probability P
o
63.77 31.88 8.696
Average Power
Consumption P
av
1 0.199 0.158
Table 1. Simulation Results.
Fig. 26.
Modified AWBT performance ignoring saturation constraints and where handoff
occurs at 100 (sec)
Addressing Non-linear Hardware Limitations and Extending
Network Coverage Area for Power Aware Wireless Sensor Networks 75
where as before σ
e
, is the sampled standard deviation of the power control tracking error
and α is the forgetting factor, (assumed to be 0.95 here), introduced to smooth the measured
RSSI signal which may be corrupted by noise.
Fig. 25.
Comparison between adaptive, conventional/H∞ and AWBT Hybrid schemes.
Benchmark Comparative Study Results
Fig. 25 illustrates how the proposed AWBT system performs when compared with the
approaches outlined above. Clearly the hybrid design outperforms the adaptive approach
for all of the stated criteria and exhibits substantial improvement over a conventional/H∞
approach in terms of standard deviation and outage probability when low levels of mobility
exist in the system. However, with fewer mobile nodes in the system, the conventional/H∞
approach consumes less power. This is due to the aggressive action of the pre-filter that
results in improved tracking performance. As the number of mobile users is increased the
standard deviations of the AWBT design and the conventional/H∞ converge, however the
hybrid design continues to exhibit improved outage probability.
The average power consumption for the three approaches also converges, highlighting the
improved power efficiency characteristics that are achieved for the hybrid design with
increased levels of mobility. This is to be expected given that AW inherently seeks to
dynamically decrease the magnitude of the controller output. It should be noted that the
vast majority of the complexity of the proposed hybrid solution lies in the synthesis
routine,and that very little additional computational overhead was a feature of the practical
implementation. Empirical evidence suggests little or no difference between the AWBT
approach and a more conventional adaptive step size power control approach in terms of
microcontroller activity during realtime experiments.
8.4 Stand-Alone Bumpless Transfer performance
Due to the naturally occurring output power saturation constraints that arise in the system,
which cannot be removed, it is difficult to ascertain the performance improvements afforded
by the BT method as a stand alone handoff scheme. Simulation can be a useful tool in this
regard. Fig. 25 illustrates some results where at time index 35 sec, handoff occurs between
two base stations. In this instance there is a difference of 20 dBm in the RSSI, between the
signal received at the on-line base station and the RSSI signal observed at the off-line base
station. As mentioned earlier, this dissimilarity in observed RSSI is due to the propagation
environment and is a realistic value based on the experimental observations in the indoor
environment that was used in this study.
From Fig. 25, it is clear that the system without AWBT exhibits an extremely large transient
response and following handover never achieves steady state prior to the completion of the
simulation. The system with AWBT in place exhibits some improvement, however there is
significant time spent below RSSIth and as a result outage probability is still at an
unacceptable level. When the modified AWBT solution is added, the outage probability is
dramatically reduced highlighting the improved performance afforded by the new
approach. The modified solution also improves the transient response by considering the
off-line high frequency component and compensating accordingly. The performance is
summarized in Table 1.
Without AWBT
(QFT Only)
With AWBT Modified AWBT
Standard Deviation
e
30.59 4.445 1.603
Outage Probability P
o
63.77 31.88 8.696
Average Power
Consumption P
av
1 0.199 0.158
Table 1. Simulation Results.
Fig. 26.
Modified AWBT performance ignoring saturation constraints and where handoff
occurs at 100 (sec)
Wireless Sensor Networks 76
8.5 Modified Anti-Windup-Bumpless-Transfer performance
Fig. 26 illustrates the experimental system response without AWBT or with QFT only.
Clearly, without AWBT there is significant integral windup in the system, keeping both the
controller at BS
1
and at BS
2
saturated for the entire duration of the experiment and making it
impossible for the system to track its reference RSSI accurately. In Fig. 27, AWBT is added to
the system and some improvement is observed in tracking performance, however upon
closer inspection it is apparent that when handoff occurs an undesirable transient is
imposed on the system. The off-line controller output also exhibits an undesirable increase
in magnitude, for instance the controller at BS
2
between 0 and 50 (sec). This is due to the
discrepancy in the feedback signals or as
)()(
21
kdkd
and results in excess power
consumption in the network.
Fig. 28 highlights significant improvement when the modified AWBT solution is employed.
Windup is almost entirely eliminated and the transient overshoot that occurs at handover is
decreased. This can be attributed to the ability of the modified compensator, when off-line,
to keep its control signal sufficiently close in magnitude to the signal entering the plant
despite the presence of uncertainty in the feedback signal. The results are summarized in
Fig. 29.
Fig. 27. Experimental results without AWBT where RSSI is the overall tracking signal, the
dashed (bold) line is the saturated/actual controller output for BS
1
and the solid line is the
saturated/actual controller output for BS
2
.
Fig. 28. Experimental results where RSSI is the overall tracking signal, the dashed (bold) line
is the saturated/actual controller output for BS
1
and the solid line is the saturated/actual
controller output for BS
2
. System response with AWBT compensation
Fig. 29. Experimental results where RSSI is the overall tracking signal, the dashed (bold) line
is the saturated/actual controller output for BS
1
and the solid line is the saturated/actual
controller output for BS
2
. System response with modified AWBT compensation
Fig. 30. Results in terms of the performance criteria. Standard deviation has units dBm.
Average power consumption is given in milliwatts.
Addressing Non-linear Hardware Limitations and Extending
Network Coverage Area for Power Aware Wireless Sensor Networks 77
8.5 Modified Anti-Windup-Bumpless-Transfer performance
Fig. 26 illustrates the experimental system response without AWBT or with QFT only.
Clearly, without AWBT there is significant integral windup in the system, keeping both the
controller at BS
1
and at BS
2
saturated for the entire duration of the experiment and making it
impossible for the system to track its reference RSSI accurately. In Fig. 27, AWBT is added to
the system and some improvement is observed in tracking performance, however upon
closer inspection it is apparent that when handoff occurs an undesirable transient is
imposed on the system. The off-line controller output also exhibits an undesirable increase
in magnitude, for instance the controller at BS
2
between 0 and 50 (sec). This is due to the
discrepancy in the feedback signals or as
)()(
21
kdkd
and results in excess power
consumption in the network.
Fig. 28 highlights significant improvement when the modified AWBT solution is employed.
Windup is almost entirely eliminated and the transient overshoot that occurs at handover is
decreased. This can be attributed to the ability of the modified compensator, when off-line,
to keep its control signal sufficiently close in magnitude to the signal entering the plant
despite the presence of uncertainty in the feedback signal. The results are summarized in
Fig. 29.
Fig. 27. Experimental results without AWBT where RSSI is the overall tracking signal, the
dashed (bold) line is the saturated/actual controller output for BS
1
and the solid line is the
saturated/actual controller output for BS
2
.
Fig. 28. Experimental results where RSSI is the overall tracking signal, the dashed (bold) line
is the saturated/actual controller output for BS
1
and the solid line is the saturated/actual
controller output for BS
2
. System response with AWBT compensation
Fig. 29. Experimental results where RSSI is the overall tracking signal, the dashed (bold) line
is the saturated/actual controller output for BS
1
and the solid line is the saturated/actual
controller output for BS
2
. System response with modified AWBT compensation
Fig. 30. Results in terms of the performance criteria. Standard deviation has units dBm.
Average power consumption is given in milliwatts.
Wireless Sensor Networks 78
9. Conclusion
This chapter has presented a new strategy for power control in WSNs where operational
longevity is an issue. An a priori level of performance is achieved in terms of packet error
rate using minimum power where significant quantisation noise exists in the selection of the
appropriate transmission power. Robustness to a variety of communication constraints have
been illustrated using an AWBT scheme. The new approach provides a methodology for the
rigorous assessment of the effect that a general class of static memory-less nonlinearity can
have on overall system performance in a wireless power control problem setting.
Also presented in this chapter was a novel modified AWBT scheme that enables smooth,
power aware handoff. The new technique facilitates floor levels on the flow of information
to be maintained in a wireless network that arises quite naturally in an ambulatory setting.
Feedback discrepancies, hardware limitations and propagation phenomena that are posed
by the use of commercially available wireless communication devices were addressed using
new signal processing and robust AW design tools. The technique was validated using a
fully scalable 802.15.4 compliant wireless testbed that has been a feature of this work. The
new AWBT schemes have exhibited significant performance improvements, particularly in
terms of transient behaviour at handoff, when compared with analogous systems operating
with simple dynamic control only or when AW methods alone were applied within the
testbed.
10. Acknowledgements
This work is supported by Science Foundation Ireland under grant 07/CE/I1147 and by the
IRCSET Embark Initiative.
11. References
Alavi S.M.M., Walsh M. J. and Hayes M. J. (2008). Distributed power control technique for
802.15.4 wireless sensor networks, based on quantitative feedback theory. Proc. IET
Irish Signals and Systems Conference, Pages 260-267, Galway, Ireland.
Andersin M., Rosberg Z., and Zander J. (1998). Distributed discrete power control in cellular
pcs, Wireless Personal Communications, Vol. 3, No. 6.
Bernstein D.S. and Michel A.N. (1995). A chronological bibliography on saturating actuators,
International Journal of Robust and Nonlinear Control, Vol. 5, Pages 375-380.
Goldsmith A. (2006). Wireless Communications. Cambridge University Press, 2006.
Grandhi S. A., Zander J., and Yates R. (1995). Constrained power control, Wireless Personal
Communications, Vol. 2, No. 3.
Gunnarsson F., Gustafsson F. and Blom J. (1999). Pole placement design of power control
algorithms, In Proc. IEEE Vehicular Technology Conference, Houston, TX, USA.
Hanus R, Kinnaert M, Henrotte J. (1987) Conditioning technique a general anti-windup and
bumpless transfer method. Automatica, Vol. 23, Pages 729–739.
Ho Y., lee C. and Chen B. (2006). Robust Hind Power Control for CDMA Cellular
Communication Systems, IEEE Transactions on Signal Processing, Vol. 54, No. 10,
Pages 3947-3956.
Horowitz I. (2001). Survey of quantitative feedback theory (QFT), Int. J. Robust Nonlinear
Control, Vol. 11, Pages 887-921.
IEEE 802.15.4 Standard (2006). Wireless lan Medium Access Control (MAC) and Physical
layer (PHY) specifications for Low-Rate Wireless Personal Area Networks (LR-
WPANs), IEEE Std 802.15.4.
IMS Research (2009). Wireless in industrial systems: Cautious enthusiasm. Industrial
Embedded Systems, Winter, 2006, Available: ustrial-
embedded.com/columns/Market_Pulse/2006/FallWinter/.
Mobihealthnews. Analyst: Wireless health can’t be homebound. March, 2009, Available:
[Accessed March 2009].
Otto C., Milenkovi A., Sanders C., and Jovanov E. (2006). System architecture of a wireless
body area sensor network for ubiquitous health monitoring. Journal of Mobile
Multimedia, Vol. 1, No. 4, Pages 307-326.
Polastre J., Szewczyk R., and Culler D. (2005). Telos: enabling ultra-low power wireless
research. Proceedings of the 4th international symposium on Information
processing in sensor networks, Los Angeles, California, USA.
Rappaport T.S. (2002). Wireless Communications principles and practice. Prentice Hall,
second edition.
Srinivasan K. and Levis P. (2006). RSSI is Under Appreciated, Third Workshop on
Embedded Networked Sensors (EmNets)
Turner M., Herrmann G. and Postlethwaite I (2007). Incorporating robustness requirements
into anti-windup design, IEEE Transactions on Automatic Control, Vol. 52, No. 10,
Pages 1842-1855.
Turner M, Postlethwaite I. (2004). A new perspective on static and low-order anti-windup
synthesis. International Journal of Control, Vol. 77, Pages 27–44.
Walsh M., Alavi S. M. M. and Hayes M. (2008). On the effect of communication constraints
on robust performance for a practical 802.15.4 Wireless Sensor Network Benchmark
problem. Proc. 47th IEEE Conference on Decision and Control (CDC08), Pages 447-
452, Cancun, Mexico.
Walsh M. J., Alavi S.M.M. and Hayes M. J. Practical assessment of hardware limitations on
power aware 802.15.4 wireless sensor networks- an anti- wind up approach.
International Journal of Robust and Nonlinear Control (in press 2009).
Weston P. F. and Postlewaite I. (2000). Analysis and design of linear conditioning schemes
for systems containing saturating actuators, Automatica, Vol. 36, No. 9.
Zurita Ares B., Fischione C., Speranzon A., and Johansson K. H. (2007). On power control for
wireless sensor networks: system model, middleware component and experimental
evaluation. European Control Conference, Kos, Greece.
Addressing Non-linear Hardware Limitations and Extending
Network Coverage Area for Power Aware Wireless Sensor Networks 79
9. Conclusion
This chapter has presented a new strategy for power control in WSNs where operational
longevity is an issue. An a priori level of performance is achieved in terms of packet error
rate using minimum power where significant quantisation noise exists in the selection of the
appropriate transmission power. Robustness to a variety of communication constraints have
been illustrated using an AWBT scheme. The new approach provides a methodology for the
rigorous assessment of the effect that a general class of static memory-less nonlinearity can
have on overall system performance in a wireless power control problem setting.
Also presented in this chapter was a novel modified AWBT scheme that enables smooth,
power aware handoff. The new technique facilitates floor levels on the flow of information
to be maintained in a wireless network that arises quite naturally in an ambulatory setting.
Feedback discrepancies, hardware limitations and propagation phenomena that are posed
by the use of commercially available wireless communication devices were addressed using
new signal processing and robust AW design tools. The technique was validated using a
fully scalable 802.15.4 compliant wireless testbed that has been a feature of this work. The
new AWBT schemes have exhibited significant performance improvements, particularly in
terms of transient behaviour at handoff, when compared with analogous systems operating
with simple dynamic control only or when AW methods alone were applied within the
testbed.
10. Acknowledgements
This work is supported by Science Foundation Ireland under grant 07/CE/I1147 and by the
IRCSET Embark Initiative.
11. References
Alavi S.M.M., Walsh M. J. and Hayes M. J. (2008). Distributed power control technique for
802.15.4 wireless sensor networks, based on quantitative feedback theory. Proc. IET
Irish Signals and Systems Conference, Pages 260-267, Galway, Ireland.
Andersin M., Rosberg Z., and Zander J. (1998). Distributed discrete power control in cellular
pcs, Wireless Personal Communications, Vol. 3, No. 6.
Bernstein D.S. and Michel A.N. (1995). A chronological bibliography on saturating actuators,
International Journal of Robust and Nonlinear Control, Vol. 5, Pages 375-380.
Goldsmith A. (2006). Wireless Communications. Cambridge University Press, 2006.
Grandhi S. A., Zander J., and Yates R. (1995). Constrained power control, Wireless Personal
Communications, Vol. 2, No. 3.
Gunnarsson F., Gustafsson F. and Blom J. (1999). Pole placement design of power control
algorithms, In Proc. IEEE Vehicular Technology Conference, Houston, TX, USA.
Hanus R, Kinnaert M, Henrotte J. (1987) Conditioning technique a general anti-windup and
bumpless transfer method. Automatica, Vol. 23, Pages 729–739.
Ho Y., lee C. and Chen B. (2006). Robust Hind Power Control for CDMA Cellular
Communication Systems, IEEE Transactions on Signal Processing, Vol. 54, No. 10,
Pages 3947-3956.
Horowitz I. (2001). Survey of quantitative feedback theory (QFT), Int. J. Robust Nonlinear
Control, Vol. 11, Pages 887-921.
IEEE 802.15.4 Standard (2006). Wireless lan Medium Access Control (MAC) and Physical
layer (PHY) specifications for Low-Rate Wireless Personal Area Networks (LR-
WPANs), IEEE Std 802.15.4.
IMS Research (2009). Wireless in industrial systems: Cautious enthusiasm. Industrial
Embedded Systems, Winter, 2006, Available: ustrial-
embedded.com/columns/Market_Pulse/2006/FallWinter/.
Mobihealthnews. Analyst: Wireless health can’t be homebound. March, 2009, Available:
[Accessed March 2009].
Otto C., Milenkovi A., Sanders C., and Jovanov E. (2006). System architecture of a wireless
body area sensor network for ubiquitous health monitoring. Journal of Mobile
Multimedia, Vol. 1, No. 4, Pages 307-326.
Polastre J., Szewczyk R., and Culler D. (2005). Telos: enabling ultra-low power wireless
research. Proceedings of the 4th international symposium on Information
processing in sensor networks, Los Angeles, California, USA.
Rappaport T.S. (2002). Wireless Communications principles and practice. Prentice Hall,
second edition.
Srinivasan K. and Levis P. (2006). RSSI is Under Appreciated, Third Workshop on
Embedded Networked Sensors (EmNets)
Turner M., Herrmann G. and Postlethwaite I (2007). Incorporating robustness requirements
into anti-windup design, IEEE Transactions on Automatic Control, Vol. 52, No. 10,
Pages 1842-1855.
Turner M, Postlethwaite I. (2004). A new perspective on static and low-order anti-windup
synthesis. International Journal of Control, Vol. 77, Pages 27–44.
Walsh M., Alavi S. M. M. and Hayes M. (2008). On the effect of communication constraints
on robust performance for a practical 802.15.4 Wireless Sensor Network Benchmark
problem. Proc. 47th IEEE Conference on Decision and Control (CDC08), Pages 447-
452, Cancun, Mexico.
Walsh M. J., Alavi S.M.M. and Hayes M. J. Practical assessment of hardware limitations on
power aware 802.15.4 wireless sensor networks- an anti- wind up approach.
International Journal of Robust and Nonlinear Control (in press 2009).
Weston P. F. and Postlewaite I. (2000). Analysis and design of linear conditioning schemes
for systems containing saturating actuators, Automatica, Vol. 36, No. 9.
Zurita Ares B., Fischione C., Speranzon A., and Johansson K. H. (2007). On power control for
wireless sensor networks: system model, middleware component and experimental
evaluation. European Control Conference, Kos, Greece.
Cooperative Beamforming and Modern Spatial Diversity
Techniques for Power Efcient Wireless Sensor Networks 81
Cooperative Beamforming and Modern Spatial Diversity Techniques for
Power Efcient Wireless Sensor Networks
Tommy Hult, Abbas Mohammed and Zhe Yang
0
Cooperative Beamforming and Modern
Spatial Diversity Techniques for Power
Efficient Wireless Sensor Networks
Tommy Hult
Lund University
Sweden
Abbas Mohammed and Zhe Yang
Blekinge Institute of Technology
Sweden
1. Introduction
Wireless Sensor Networks (WSN) have been attracting great attention recently. They are
relatively low cost to be deployed and to be used in many promising applications, such as
biomedical sensor monitoring (e.g., cardiac patient monitoring), habitat monitoring (e.g., an-
imal tracking), weather monitoring (temperature, humidity, etc.), low-performance seismic
sensing, environment preservation and natural disaster detection and monitoring (e.g., flood-
ing and fire) Lewis (2004); Tubaishat & Madria (2003); Stankovic et al. (2003); Akyildiz (2002);
Rashid-Farrokhi et al. (1998).
The WSN applications analyzed in this chapter have a topology where a large number of wire-
less sensor nodes are spread out over a large or small geographic area (e.g., disaster regions,
indoor factory, large sports event areas, etc.). In this topology, an inefficient use of bandwidth
and transmitter power resources is resulted if each wireless sensor is transmitting its measure-
ment data to the base station (processing central). In this case, each sensor node would have
to be assigned its own frequency channel and, if the base station is located a long distance
from the sensor nodes, it would also demand a higher than average sensor node transmitter
power. By using a coordinating cluster head, for each cluster of wireless sensor nodes, we can
instead use the combined transmitter power of the node cluster through the use of beamform-
ing to increase the transmitter-receiver separation and/or to improve the signal-to-noise ratio
(SNR) of the communication link. Another advantage of using this cooperative transmission
is that we can exert power control to minimize the power consumption of each individual
sensor node, and thus maximizing network lifetime. In addition, in a cooperative network
the measurement data could be sent by using Time Division Multiplexing (TDM) instead of
Frequency Division Multiplexing (FDM) which improves the overall bandwidth efficiency of
the system.
The spatial properties of wireless communication channels are extremely important in deter-
mining the performance of the systems. Thus, there has been great interest in the application
of beamforming and modern spatial diversity techniques (or multiantenna systems) since they
4
Wireless Sensor Networks 82
can offer a broad range of ways to improve wireless systems performance. For instance, di-
versity techniques such as multiple-input single-output (MISO), single-input multiple-output
(SIMO) and multiple-input multiple-output (MIMO) can enhance the capacity, coverage, qual-
ity and energy efficiency of of wireless systems.
Energy efficiency is one of the key requirements in many WSN applications. This is partic-
ularly crucial for WSN deployed in inaccessible or disaster environments in which battery
recharging and replacement is not a viable option. Thus, in this chapter we first propose to
use a cooperative beamforming approach in wireless sensor networks to increase the trans-
mission range, minimize power consumption and maximize network lifetime. This will be of
particular interest for outdoor applications, especially when monitoring remote areas using
aerial vehicle, such as a High Altitude Platform (HAP) or Unmanned Aerial Vehicle (UAV), as
a platform for the data collecting base station. We will investigate how the required transmit-
ter power of each sensor node is affected by the number of cooperating transmission nodes in
the network. In addition, we present a comparison in the use of beamforming with the differ-
ent forms of modern spatial diversity techniques for the same purpose of achieving a longer
transmission distance (or range) while maintaining a low energy consumption. Beamforming
can of course be interpreted as a form of MISO system although it differs from the normal
view of how a diversity system operates.
This chapter is organized as follows: Section 2 presents an overview and analysis of coop-
erative beamforming using a large aperture random array. In section 3, the MISO, SIMO
and MIMO diversity schemes are introduced and analysed using the Rician fading channel
employed in the simulations. Section 4 present numerical results and comparisons of the sim-
ulated beamformer and modern diversity systems. Finally, section 5 concludes the chapter.
2. Traditional Cooperative Beamforming
In this chapter we use the delay-and-sum beamforming technique which is the oldest and
simplest algorithm for Space-Time processing. This beamforming is done through coherent
excitation/reception of amplitude and phase of the signal transmitted/received from each
individual antenna element in a collection or cluster of similar antenna elements also known
as an antenna array Johnson (1993). Antenna arrays can have different configurations (e.g.,
linear, planar, circular, triangular, rectangular or spherical). Extensive research has been done
on uniform array beamforming using one (linear) or two (planar) dimensional equi-distant
element arrays Johnson (1993); Hansen & Woodyard (1938); Drane (1968). In addition, there
is also work done on beamforming using circular, triangular and rectangular arrays Johnson
(1993); Balanis (1997).
The antenna array formed by individual sensor node antennas is assumed to be a planar ar-
ray, of randomly positioned sensor node antennas, which is parallel with the plane containing
all sensor nodes so that the sensor nodes are only extended in x and y direction and not in z
direction. This is a valid assumption in most cases since the elongation of the networks in z
direction in most cases is very small compared to the distance between the network cluster
and the base station we want to communicate with Jenkins (1973). The design of this type
of cooperative array is similar to the design of large aperture arrays where we have an inter-
element spacing that is random and larger than half the wavelength. There are no known
simplifying techniques for synthesis of randomly spaced arrays, like Schelkunoffs polyno-
mial method Johnson (1993); Balanis (1997) or the Fourier Transform method Johnson (1993);
Balanis (1997). In the random array all properties, e.g., array pattern, beamwidth, sidelobe
level and gain are stochastic variables.
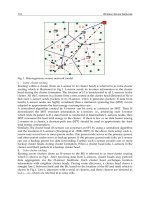
In figure 1, we show a scenario with N = 50 sensor nodes deployed inside a circular boundary
in the x-y plane with a radius R. The sensor nodes are independent and uniformly distributed
within the cluster area. The n
th
sensor then has the polar coordinates (r
n
,φ
n
) .
Fig. 1. The positioning of the employed sensor nodes within a cluster area of radius R accord-
ing to an independent uniform distribution.
The signal y
n
(t) at the array sensor node n can then be expressed as,
y
n
(t) = s(t − α
0
α
0
α
0
· x
0
), (1)
where s
(t) is the signal to be transmitted/received and the n
th
sensor at location x
n
trans-
mits/receives the electromagnetic signal y
n
(t). The slowness vector α
0
α
0
α
0
is the required delay
for each sensor to steer the array in a specific direction toward the signal source or target, and
is defined as,
α
0
α
0
α
0
=
d
0
c
(2)
where d
0
is the direction of the wave propagation and c is the speed of light. The total output
of the delay-and-sum algorithm can be expressed by,
z
(t) =
N−1
∑
n=0
w
n
s(t + (α
α
α − α
0
α
0
α
0
)· x
0
), (3)
where w
n
is the amplitude weights of the array tapering and α
α
α is the slowness vector for the
direction of observation. If we assume that all the sensor nodes are approximately located in
the same plane (i.e., the x-y plane) and the source/target is located at the spherical coordinates
d
0
= (d
0
,φ
0
,θ
0
) in the far-field, and we are transmitting a narrow band signal then we can
approximate equation (3) as, (see appendix)
G
(φ, θ) =
1
N
N−1
∑
n=0
w
n
e
jω(t−
r
n
c
(cos(φ
n
)u+sin(φ
n
)v)
, (4)
where u
= sin(θ) cos(φ) − sin(θ
0
)cos(φ
0
) and v = sin(θ) sin(φ) − sin(θ
0
)sin(φ
0
) for the direc-
tion of the incoming/outgoing wave
(φ
0
,θ
0
) and the direction of observation (φ, θ). The func-
tion G
(φ, θ) is then one ensemble of the array amplitude gain function for one set of stochastic
Cooperative Beamforming and Modern Spatial Diversity
Techniques for Power Efcient Wireless Sensor Networks 83
can offer a broad range of ways to improve wireless systems performance. For instance, di-
versity techniques such as multiple-input single-output (MISO), single-input multiple-output
(SIMO) and multiple-input multiple-output (MIMO) can enhance the capacity, coverage, qual-
ity and energy efficiency of of wireless systems.
Energy efficiency is one of the key requirements in many WSN applications. This is partic-
ularly crucial for WSN deployed in inaccessible or disaster environments in which battery
recharging and replacement is not a viable option. Thus, in this chapter we first propose to
use a cooperative beamforming approach in wireless sensor networks to increase the trans-
mission range, minimize power consumption and maximize network lifetime. This will be of
particular interest for outdoor applications, especially when monitoring remote areas using
aerial vehicle, such as a High Altitude Platform (HAP) or Unmanned Aerial Vehicle (UAV), as
a platform for the data collecting base station. We will investigate how the required transmit-
ter power of each sensor node is affected by the number of cooperating transmission nodes in
the network. In addition, we present a comparison in the use of beamforming with the differ-
ent forms of modern spatial diversity techniques for the same purpose of achieving a longer
transmission distance (or range) while maintaining a low energy consumption. Beamforming
can of course be interpreted as a form of MISO system although it differs from the normal
view of how a diversity system operates.
This chapter is organized as follows: Section 2 presents an overview and analysis of coop-
erative beamforming using a large aperture random array. In section 3, the MISO, SIMO
and MIMO diversity schemes are introduced and analysed using the Rician fading channel
employed in the simulations. Section 4 present numerical results and comparisons of the sim-
ulated beamformer and modern diversity systems. Finally, section 5 concludes the chapter.
2. Traditional Cooperative Beamforming
In this chapter we use the delay-and-sum beamforming technique which is the oldest and
simplest algorithm for Space-Time processing. This beamforming is done through coherent
excitation/reception of amplitude and phase of the signal transmitted/received from each
individual antenna element in a collection or cluster of similar antenna elements also known
as an antenna array Johnson (1993). Antenna arrays can have different configurations (e.g.,
linear, planar, circular, triangular, rectangular or spherical). Extensive research has been done
on uniform array beamforming using one (linear) or two (planar) dimensional equi-distant
element arrays Johnson (1993); Hansen & Woodyard (1938); Drane (1968). In addition, there
is also work done on beamforming using circular, triangular and rectangular arrays Johnson
(1993); Balanis (1997).
The antenna array formed by individual sensor node antennas is assumed to be a planar ar-
ray, of randomly positioned sensor node antennas, which is parallel with the plane containing
all sensor nodes so that the sensor nodes are only extended in x and y direction and not in z
direction. This is a valid assumption in most cases since the elongation of the networks in z
direction in most cases is very small compared to the distance between the network cluster
and the base station we want to communicate with Jenkins (1973). The design of this type
of cooperative array is similar to the design of large aperture arrays where we have an inter-
element spacing that is random and larger than half the wavelength. There are no known
simplifying techniques for synthesis of randomly spaced arrays, like Schelkunoffs polyno-
mial method Johnson (1993); Balanis (1997) or the Fourier Transform method Johnson (1993);
Balanis (1997). In the random array all properties, e.g., array pattern, beamwidth, sidelobe
level and gain are stochastic variables.
In figure 1, we show a scenario with N = 50 sensor nodes deployed inside a circular boundary
in the x-y plane with a radius R. The sensor nodes are independent and uniformly distributed
within the cluster area. The n
th
sensor then has the polar coordinates (r
n
,φ
n
) .
Fig. 1. The positioning of the employed sensor nodes within a cluster area of radius R accord-
ing to an independent uniform distribution.
The signal y
n
(t) at the array sensor node n can then be expressed as,
y
n
(t) = s(t − α
0
α
0
α
0
· x
0
), (1)
where s
(t) is the signal to be transmitted/received and the n
th
sensor at location x
n
trans-
mits/receives the electromagnetic signal y
n
(t). The slowness vector α
0
α
0
α
0
is the required delay
for each sensor to steer the array in a specific direction toward the signal source or target, and
is defined as,
α
0
α
0
α
0
=
d
0
c
(2)
where d
0
is the direction of the wave propagation and c is the speed of light. The total output
of the delay-and-sum algorithm can be expressed by,
z
(t) =
N−1
∑
n=0
w
n
s(t + (α
α
α − α
0
α
0
α
0
)· x
0
), (3)
where w
n
is the amplitude weights of the array tapering and α
α
α is the slowness vector for the
direction of observation. If we assume that all the sensor nodes are approximately located in
the same plane (i.e., the x-y plane) and the source/target is located at the spherical coordinates
d
0
= (d
0
,φ
0
,θ
0
) in the far-field, and we are transmitting a narrow band signal then we can
approximate equation (3) as, (see appendix)
G
(φ, θ) =
1
N
N−1
∑
n=0
w
n
e
jω(t−
r
n
c
(cos(φ
n
)u+sin(φ
n
)v)
, (4)
where u
= sin(θ) cos(φ) − sin(θ
0
)cos(φ
0
) and v = sin(θ) sin(φ) − sin(θ
0
)sin(φ
0
) for the direc-
tion of the incoming/outgoing wave
(φ
0
,θ
0
) and the direction of observation (φ, θ). The func-
tion G
(φ, θ) is then one ensemble of the array amplitude gain function for one set of stochastic
Wireless Sensor Networks 84
sensor locations. To find the ensemble mean of the array amplitude gain functions, we assume
an independent uniform distribution of the sensor locations within the radius R,
E
{G(φ, θ)} =
G(φ, θ)p
R,φ
(r
n
,φ
n
), (5)
where p
R,φ
(r
n
,φ
n
) is the probability density function (PDF) of the sensor locations.
In figure 2 we show the absolute squared average array gain function
|E{G(φ, θ)}|
2
of 250 re-
alizations of the array amplitude gain function G
(φ, θ), and in figure 3 we show the standard
deviation for the distribution of the amplitude sidelobe levels. From figure 2 we can also esti-
mate a mean sidelobe level that will converge toward
≈ −17 dB which is consistent with the
theoretical value, N
−1
. The average signal-to-noise ratio of the array is defined as SNR
array
=
SNR
node
· G(φ, θ) which means that the array average SNR is SNR
array
= N · SNR
node
when
we are aiming the array toward the incoming assumed plane wave. The SNR
array
is a Gaus-
sian distributed parameter with a mean of 17 dB, and a 95% confidence that the SNR of the
array will be higher than 7 dB.
Fig. 2. The absolute squared average array pattern of 250 realizations of the random sensor
locations. Only a small part around the main lobe is shown in the figure.
3. Modern Spatial Diversity Techniques
Another recently popular technique to improve the signal to noise ratio of the long range
transmission is to use some form of spatial multiantenna diversity system. In this chapter,
we employ modern diversity techniques which have gained great interest in the past decade
or so. These are: multiple-input single-output (MISO), single-input multiple-output (SIMO)
and multiple-input multiple-output (MIMO) antenna systems. Multiple transmit and receive
antenna systems allow increased data rates and enhanced link reliability of wireless com-
munication systems while reducing the transmission power requirements. In the following
analysis of these diversity techniques, we will assume a perfect knowledge of the propagation
channel.
3.1 Cooperative Multiple-Input Single-Output
Consider a frequency flat fading propagation model with N
tx
antenna elements at the trans-
mitter and one antenna element at the receiver. To take full advantage of the antenna transmit
Fig. 3. A plot showing a cross-section of the main lobe of all 250 realizations of the array
amplitude gain pattern.
diversity we send multiple weighed copies of the signal sample through all the transmitting
antenna elements. The received baseband signal sample can then be expressed as,
r
[m] =
E
s
N
tx
L
−1
∑
l=0
h
l
w
l
s[m] + n[m ], (6)
where r
[m] ∈C is the received sample, s[m] ∈C is the transmitted sample and n[m] is a noise
sample with n
[m] ∼ CN(0,σ
2
n
). The coefficient w
l
is the channel weight for channel l and E
s
is
the transmitted average symbol energy. This can be expressed in vector notation as,
r
=
E
s
N
tx
hws + n, (7)
where h
∈ C
N
tx
×1
is the frequency of flat fading channel vector with a Rice distribution. The
normalized Rician channel vector h can then be defined as, (McKay et al., 2006)
h
√
c
1
l +
√
c
2
R
tx
h
n
, (8)
where l is the line-of-sight (LOS) component represented as a mean value that satisfies the
condition
|l|
2
= N
tx
, and R
tx
is the transmit correlation vector. R
tx
is assumed to be pos-
itive definite full rank matrix. h
n
∼ CN
N
tx
(0
N
tx
,1
N
tx
) is a complex valued Gaussian vector
representing the non line-of-sight (NLOS) component. The coefficients c
1
= K/(K + 1) and
c
2
= 1/(K + 1) are normalizing factors, where K is the Rice factor which represents the power
ratio between the LOS and NLOS components. The weight vector w that maximizes the re-
ceived SNR is given by,
w
=
N
tx
h
H
h
, (9)
which is the transmit maximum ratio combining (MRC) method and is also known as matched
beamforming. The SNR of the received signal can then be expressed as,
γ
rx
=
E
s
·|h|
2
N
0
. (10)
Cooperative Beamforming and Modern Spatial Diversity
Techniques for Power Efcient Wireless Sensor Networks 85
sensor locations. To find the ensemble mean of the array amplitude gain functions, we assume
an independent uniform distribution of the sensor locations within the radius R,
E
{G(φ, θ)} =
G(φ, θ)p
R,φ
(r
n
,φ
n
), (5)
where p
R,φ
(r
n
,φ
n
) is the probability density function (PDF) of the sensor locations.
In figure 2 we show the absolute squared average array gain function
|E{G(φ, θ)}|
2
of 250 re-
alizations of the array amplitude gain function G
(φ, θ), and in figure 3 we show the standard
deviation for the distribution of the amplitude sidelobe levels. From figure 2 we can also esti-
mate a mean sidelobe level that will converge toward
≈ −17 dB which is consistent with the
theoretical value, N
−1
. The average signal-to-noise ratio of the array is defined as SNR
array
=
SNR
node
· G(φ, θ) which means that the array average SNR is SNR
array
= N · SNR
node
when
we are aiming the array toward the incoming assumed plane wave. The SNR
array
is a Gaus-
sian distributed parameter with a mean of 17 dB, and a 95% confidence that the SNR of the
array will be higher than 7 dB.
Fig. 2. The absolute squared average array pattern of 250 realizations of the random sensor
locations. Only a small part around the main lobe is shown in the figure.
3. Modern Spatial Diversity Techniques
Another recently popular technique to improve the signal to noise ratio of the long range
transmission is to use some form of spatial multiantenna diversity system. In this chapter,
we employ modern diversity techniques which have gained great interest in the past decade
or so. These are: multiple-input single-output (MISO), single-input multiple-output (SIMO)
and multiple-input multiple-output (MIMO) antenna systems. Multiple transmit and receive
antenna systems allow increased data rates and enhanced link reliability of wireless com-
munication systems while reducing the transmission power requirements. In the following
analysis of these diversity techniques, we will assume a perfect knowledge of the propagation
channel.
3.1 Cooperative Multiple-Input Single-Output
Consider a frequency flat fading propagation model with N
tx
antenna elements at the trans-
mitter and one antenna element at the receiver. To take full advantage of the antenna transmit
Fig. 3. A plot showing a cross-section of the main lobe of all 250 realizations of the array
amplitude gain pattern.
diversity we send multiple weighed copies of the signal sample through all the transmitting
antenna elements. The received baseband signal sample can then be expressed as,
r
[m] =
E
s
N
tx
L
−1
∑
l=0
h
l
w
l
s[m] + n[m ], (6)
where r
[m] ∈C is the received sample, s[m] ∈C is the transmitted sample and n[m] is a noise
sample with n
[m] ∼ CN(0,σ
2
n
). The coefficient w
l
is the channel weight for channel l and E
s
is
the transmitted average symbol energy. This can be expressed in vector notation as,
r
=
E
s
N
tx
hws + n, (7)
where h
∈ C
N
tx
×1
is the frequency of flat fading channel vector with a Rice distribution. The
normalized Rician channel vector h can then be defined as, (McKay et al., 2006)
h
√
c
1
l +
√
c
2
R
tx
h
n
, (8)
where l is the line-of-sight (LOS) component represented as a mean value that satisfies the
condition
|l|
2
= N
tx
, and R
tx
is the transmit correlation vector. R
tx
is assumed to be pos-
itive definite full rank matrix. h
n
∼ CN
N
tx
(0
N
tx
,1
N
tx
) is a complex valued Gaussian vector
representing the non line-of-sight (NLOS) component. The coefficients c
1
= K/(K + 1) and
c
2
= 1/(K + 1) are normalizing factors, where K is the Rice factor which represents the power
ratio between the LOS and NLOS components. The weight vector w that maximizes the re-
ceived SNR is given by,
w
=
N
tx
h
H
h
, (9)
which is the transmit maximum ratio combining (MRC) method and is also known as matched
beamforming. The SNR of the received signal can then be expressed as,
γ
rx
=
E
s
·|h|
2
N
0
. (10)
Wireless Sensor Networks 86
3.2 Cooperative Single-Input Multiple-Output
The second type of spatial diversity is receive diversity in which we are utilizing a single-input
multiple-output (SIMO) frequency flat fading propagation channel model with N
rx
receiving
antenna elements and a single transmitting antenna element. To fully exploit the receive di-
versity we will receive multiple copies of the transmitted signal through all the N
rx
receiving
antenna elements. The received baseband signal sample can then be expressed as,
r
[m] =
E
s
N
rx
L
∑
l=1
(w
l
h
l
)s[m] +
L
∑
l=1
w
l
n
l
[m], (11)
where r
l
[m] ∈ C is the received sample from receiving antenna element l, s [m] ∈ C is the
transmitted sample and n
l
[m] is a noise sample at receiving antenna element l with n
l
[m] ∼
CN(
0,σ
2
n
). the coefficient w
l
is the channel weight at receiving antenna element l and E
s
is the
transmitted average symbol energy. This can be expressed in vector notation as,
r
=
√
E
s
w
H
hs + w
H
n, (12)
where h
∈ C
N
tx
×1
is the frequency flat fading channel vector with a Rice distribution. The
normalized channel vector h can then be defined as, (McKay et al., 2006)
h
√
c
1
l +
√
c
2
R
rx
h
n
, (13)
where l is the line of sight (LOS) component represented as a mean value that satisfies the
condition
|l|
2
= N
rx
, and R
rx
is the receive correlation vector. R
rx
is assumed to be a positive
definite full rank matrix. h
n
∼ CN
N
rx
(0
N
rx
,1
N
rx
) is a complex valued Gaussian vector repre-
senting the nnon-line-of-sight (NLOS) component. The weight vector w that maximize the
received SNR at each antenna element is given by,
w
=
√
N
rx
h
H
h
. (14)
The SNR of the received signal after we have performed a maximum ratio combining (MRC)
can then be expressed as
γ
rx
=
E
s
·|h|
2
N
0
. (15)
3.3 Cooperative Multiple-Input Multiple-Output
By combining the MISO and SIMO diversity techniques we create a system of (N
tx
and N
rx
)
transmitting and receiving antenna elements, respectively, which is known as a multiple-input
multiple-output (MIMO) system. If we consider a frequency flat fading
(N
tx
× N
rx
) MIMO
propagation model, the received signal can be written in vector notation as,
r
=
E
s
N
tx
w
H
rx
Hw
tx
s + w
rx
n. (16)
In the MIMO case, the Rice distributed channel matrix H can be derived as,
H
√
c
1
L +
√
c
2
R
1
2
rx
H
n
R
1
2
tx
, (17)
where L represents the LOS component and is the arbitrary rank mean value matrix with the
condition that Tr
(LL
H
) = N
rx
·N
tx
, R
rx
and R
tx
are the correlation matrices on the transmitter
and receiver side respectively. H
n
∼ CN
N
rx
,N
tx
(0
N
rx
×N
tx
,I
N
rx
⊗I
N
rx
).
To maximize the combined SNR at the receiver antenna elements we maximize,
γ
rx
=
E
s
N
0
·
w
H
rx
Hw
tx
2
N
tx
w
rx
2
. (18)
γ
rx
is then maximized when w
rx
and w
tx
/N
tx
are equal to the singular input and output
vectors of the channel matrix H corresponding to the maximum singular value of the channel
matrix H. Equation 16 can then be written as,
r
[m] =
√
E
s
σ
max
s[m] + n[m ]. (19)
where σ
max
is the maximum singular value of the channel matrix H and since σ
2
max
is the
same as the maximum eigenvalue λ
max
of HH
H
. We can now express the received SNR of the
MIMO diversity technique as,
γ
rx
=
E
s
N
0
·λ
max
. (20)
4. Simulation Results
In this section we assess the performance of beamforming technique and modern spatial di-
versity techniques and compare the results with the nondiversity single antenna (or SISO)
system. If we consider a base station mounted on an aerial platform such as a HAP or a UAV
to collect data from remote sensor networks, then the amount of obstructions in the trans-
mission path would depend on the type of environment at the sensor locations, although it
can still generally be assumed that the number of obstructions will increase with a decreasing
antenna elevation angle. Therefore, the propagation effect of the change in elevation can be
translated into a change of the Rice distribution K-factor.
In the presented simulations, the Rician K-factor was varied over an interval of K
∈
1
·10
−8
,1 · 10
+8
, where the low value represents a channel with no LOS component and
very little correlation between the different signal paths and therefore resembles a Rayleigh
fading channel. When the Rician K-factor is gradually increased the correlation between the
signal paths will increase and the Direction of Departure (DoD)/Direction of Arrival (DoA)
of the signals will narrow into a smaller and smaller angular sector, until the K-factor asymp-
totically goes toward infinity and all signal paths will be correlated and pointing in the same
direction.
In figure 4 we see the comparison between the ordinary random array beamformer perfor-
mance and the MISO/SIMO diversity systems performance. Inspecting figure 4, we can see
that the MISO/SIMO diversity system seems to maintain a constant low node transmitter
power P
tx
even in a NLOS scenario by spreading the energy over multiple paths instead of
transmitting it all in one direction. Furthermore, we can see from figure 4 that if the distance
between the transmitting nodes and the basestation is increased from 1 km to 10 km, the nodes
need a 100 fold increase of the total transmitted power to maintain the same capacity. This is
independent of whether we are using the nodes as a beamforming array or a diversity system,
which is consistent with the inverse square law of the free space loss.
Finally, we assess the performance of the full multiantenna diversity system (or MIMO) where
we have multiple antenna nodes on both the transmitting and receiving end of the link. In
Cooperative Beamforming and Modern Spatial Diversity
Techniques for Power Efcient Wireless Sensor Networks 87
3.2 Cooperative Single-Input Multiple-Output
The second type of spatial diversity is receive diversity in which we are utilizing a single-input
multiple-output (SIMO) frequency flat fading propagation channel model with N
rx
receiving
antenna elements and a single transmitting antenna element. To fully exploit the receive di-
versity we will receive multiple copies of the transmitted signal through all the N
rx
receiving
antenna elements. The received baseband signal sample can then be expressed as,
r
[m] =
E
s
N
rx
L
∑
l=1
(w
l
h
l
)s[m] +
L
∑
l=1
w
l
n
l
[m], (11)
where r
l
[m] ∈ C is the received sample from receiving antenna element l, s [m] ∈ C is the
transmitted sample and n
l
[m] is a noise sample at receiving antenna element l with n
l
[m] ∼
CN(
0,σ
2
n
). the coefficient w
l
is the channel weight at receiving antenna element l and E
s
is the
transmitted average symbol energy. This can be expressed in vector notation as,
r
=
√
E
s
w
H
hs + w
H
n, (12)
where h
∈ C
N
tx
×1
is the frequency flat fading channel vector with a Rice distribution. The
normalized channel vector h can then be defined as, (McKay et al., 2006)
h
√
c
1
l +
√
c
2
R
rx
h
n
, (13)
where l is the line of sight (LOS) component represented as a mean value that satisfies the
condition
|l|
2
= N
rx
, and R
rx
is the receive correlation vector. R
rx
is assumed to be a positive
definite full rank matrix. h
n
∼ CN
N
rx
(0
N
rx
,1
N
rx
) is a complex valued Gaussian vector repre-
senting the nnon-line-of-sight (NLOS) component. The weight vector w that maximize the
received SNR at each antenna element is given by,
w
=
√
N
rx
h
H
h
. (14)
The SNR of the received signal after we have performed a maximum ratio combining (MRC)
can then be expressed as
γ
rx
=
E
s
·|h|
2
N
0
. (15)
3.3 Cooperative Multiple-Input Multiple-Output
By combining the MISO and SIMO diversity techniques we create a system of (N
tx
and N
rx
)
transmitting and receiving antenna elements, respectively, which is known as a multiple-input
multiple-output (MIMO) system. If we consider a frequency flat fading
(N
tx
× N
rx
) MIMO
propagation model, the received signal can be written in vector notation as,
r
=
E
s
N
tx
w
H
rx
Hw
tx
s + w
rx
n. (16)
In the MIMO case, the Rice distributed channel matrix H can be derived as,
H
√
c
1
L +
√
c
2
R
1
2
rx
H
n
R
1
2
tx
, (17)
where L represents the LOS component and is the arbitrary rank mean value matrix with the
condition that Tr
(LL
H
) = N
rx
·N
tx
, R
rx
and R
tx
are the correlation matrices on the transmitter
and receiver side respectively. H
n
∼ CN
N
rx
,N
tx
(0
N
rx
×N
tx
,I
N
rx
⊗I
N
rx
).
To maximize the combined SNR at the receiver antenna elements we maximize,
γ
rx
=
E
s
N
0
·
w
H
rx
Hw
tx
2
N
tx
w
rx
2
. (18)
γ
rx
is then maximized when w
rx
and w
tx
/N
tx
are equal to the singular input and output
vectors of the channel matrix H corresponding to the maximum singular value of the channel
matrix H. Equation 16 can then be written as,
r
[m] =
√
E
s
σ
max
s[m] + n[m ]. (19)
where σ
max
is the maximum singular value of the channel matrix H and since σ
2
max
is the
same as the maximum eigenvalue λ
max
of HH
H
. We can now express the received SNR of the
MIMO diversity technique as,
γ
rx
=
E
s
N
0
·λ
max
. (20)
4. Simulation Results
In this section we assess the performance of beamforming technique and modern spatial di-
versity techniques and compare the results with the nondiversity single antenna (or SISO)
system. If we consider a base station mounted on an aerial platform such as a HAP or a UAV
to collect data from remote sensor networks, then the amount of obstructions in the trans-
mission path would depend on the type of environment at the sensor locations, although it
can still generally be assumed that the number of obstructions will increase with a decreasing
antenna elevation angle. Therefore, the propagation effect of the change in elevation can be
translated into a change of the Rice distribution K-factor.
In the presented simulations, the Rician K-factor was varied over an interval of K
∈
1
·10
−8
,1 · 10
+8
, where the low value represents a channel with no LOS component and
very little correlation between the different signal paths and therefore resembles a Rayleigh
fading channel. When the Rician K-factor is gradually increased the correlation between the
signal paths will increase and the Direction of Departure (DoD)/Direction of Arrival (DoA)
of the signals will narrow into a smaller and smaller angular sector, until the K-factor asymp-
totically goes toward infinity and all signal paths will be correlated and pointing in the same
direction.
In figure 4 we see the comparison between the ordinary random array beamformer perfor-
mance and the MISO/SIMO diversity systems performance. Inspecting figure 4, we can see
that the MISO/SIMO diversity system seems to maintain a constant low node transmitter
power P
tx
even in a NLOS scenario by spreading the energy over multiple paths instead of
transmitting it all in one direction. Furthermore, we can see from figure 4 that if the distance
between the transmitting nodes and the basestation is increased from 1 km to 10 km, the nodes
need a 100 fold increase of the total transmitted power to maintain the same capacity. This is
independent of whether we are using the nodes as a beamforming array or a diversity system,
which is consistent with the inverse square law of the free space loss.
Finally, we assess the performance of the full multiantenna diversity system (or MIMO) where
we have multiple antenna nodes on both the transmitting and receiving end of the link. In
Wireless Sensor Networks 88
addition, we compare the results with the conventional array beamformer, with its subsets
(SIMO/MISO) and the nondiversity single antenna (or SISO) system. In the results shown
in figure 5 we increase the number of receiving antenna nodes to be equal to the number of
transmitting antenna nodes to get a (50
× 50) MIMO system which will increase the array and
diversity gains even further. This effect can clearly be seen in figure 5 where the performance
of the MIMO system outperforms the other systems in both LOS and NLOS scenarios. It is also
clear from this figure that the nondiversity SISO system and the conventional beamformer will
not function properly in this setting and in particular in NLOS conditions. These initial results
suggest that the application of modern spatial diversity systems is expected to improve the
energy efficiency, lifetime and the overall performance of the wireless sensor network.
×
Fig. 4. Comparison between of the Array Beamformer and MISO/SIMO system for different
K-factor values for a distance from the base station of 1 km and 10 km, respectively.
×
Fig. 5. Performance of the Array Beamformer, MISO/SIMO and MIMO systems for different
K-factor values and compared with a single antenna SISO system. The performance results
are normalised against SISO in this figure.
5. Conclusions
In this chapter we have investigated how the required transmitter power of each sensor
node is affected by the number of cooperating transmission nodes in a traditional random
beamformer array. Due to the randomness of the sensor node positions, there is no simple
algorithm for mitigation of interference from a fixed direction. This is because the sidelobe
levels and the sidelobe positions are random. A comparison in the use of beamforming with
modern diversity systems such as MISO/SIMO and MIMO for the same purpose of achieving
a longer transmission distance or maintaining a low energy consumption is also presented.
It is clear from these investigations that the MISO/SIMO and MIMO diversity systems are
superior in performance to both the SISO link and the traditional form of array beamforming,
especially when the LOS component is small or non-existent. Even one extra antenna at the
receiving base station will increase the performance of the system two-fold in a LOS scenario
and give an improved performance in NLOS as well. The best performance though, is given
by the MIMO system where we have multiple antenna nodes on both the transmitting and re-
ceiving end of the link. Initial results suggest that the application of modern spatial diversity
systems is expected to improve the energy efficiency and lifetime of wireless sensor network.
Appendix: Derivation of Equation (3)
The slowness vector α
α
α in (2) is defined as,
α
α
α
=
d
c
. (21)
The d vector represents the direction of observation and can be expressed in cartesian coordi-
nates as,
d
= d ·
{
−sin(θ)cos(ϕ), − sin(θ) sin(ϕ ), cos(θ)
}
. (22)
Assuming that the sensor nodes are only distributed in the x
− y plane. In addition, if we
assume a far-field plane wave solution, then the individual propagation induced time delay
∆t
n
is calculated from the slowness vector α
α
α and the position vector x
n
of each node n as,
∆t
n
= α
α
α · x
n
=
r
n
c
(
−
sin
(
θ
)
cos
(
ϕ
)
cos
(
ϕ
n
)
−
sin
(
θ
)
sin
(
ϕ
)
sin
(
ϕ
n
)
−
0
)
(23)
∆t
n
= −
r
n
c
(
sin(θ)cos(ϕ − ϕ
n
)
)
(24)
The actual direction of propagation d
0
is used to calculate the slowness vector α
α
α
0
of the centre
point of the array,
∆t
0
=
r
n
c
(
sin(θ)cos(ϕ
0
− ϕ
n
)
)
(25)
Substituting (24) and (25) into (3) results in,
z
(t) =
N−1
∑
n=0
w
n
s(t −
r
n
c
(
(
sin(θ)cos(ϕ − ϕ
n
)
)
−
(
sin(θ)cos(ϕ
0
− ϕ
n
)
)
)). (26)
Denoting u
= sin(θ)cos(φ) − sin(θ
0
)cos(φ
0
), v = sin(θ) sin(φ) − sin(θ
0
)sin(φ
0
) and assuming
a sinusoidal signal s
(t), (26) can be expressed as a time harmonic solution,
G
(φ, θ) =
1
N
N−1
∑
n=0
w
n
e
jω(t−
r
n
c
(cos(φ
n
)u+sin(φ
n
)v)
. (27)
Cooperative Beamforming and Modern Spatial Diversity
Techniques for Power Efcient Wireless Sensor Networks 89
addition, we compare the results with the conventional array beamformer, with its subsets
(SIMO/MISO) and the nondiversity single antenna (or SISO) system. In the results shown
in figure 5 we increase the number of receiving antenna nodes to be equal to the number of
transmitting antenna nodes to get a (50
× 50) MIMO system which will increase the array and
diversity gains even further. This effect can clearly be seen in figure 5 where the performance
of the MIMO system outperforms the other systems in both LOS and NLOS scenarios. It is also
clear from this figure that the nondiversity SISO system and the conventional beamformer will
not function properly in this setting and in particular in NLOS conditions. These initial results
suggest that the application of modern spatial diversity systems is expected to improve the
energy efficiency, lifetime and the overall performance of the wireless sensor network.
×
Fig. 4. Comparison between of the Array Beamformer and MISO/SIMO system for different
K-factor values for a distance from the base station of 1 km and 10 km, respectively.
×
Fig. 5. Performance of the Array Beamformer, MISO/SIMO and MIMO systems for different
K-factor values and compared with a single antenna SISO system. The performance results
are normalised against SISO in this figure.
5. Conclusions
In this chapter we have investigated how the required transmitter power of each sensor
node is affected by the number of cooperating transmission nodes in a traditional random
beamformer array. Due to the randomness of the sensor node positions, there is no simple
algorithm for mitigation of interference from a fixed direction. This is because the sidelobe
levels and the sidelobe positions are random. A comparison in the use of beamforming with
modern diversity systems such as MISO/SIMO and MIMO for the same purpose of achieving
a longer transmission distance or maintaining a low energy consumption is also presented.
It is clear from these investigations that the MISO/SIMO and MIMO diversity systems are
superior in performance to both the SISO link and the traditional form of array beamforming,
especially when the LOS component is small or non-existent. Even one extra antenna at the
receiving base station will increase the performance of the system two-fold in a LOS scenario
and give an improved performance in NLOS as well. The best performance though, is given
by the MIMO system where we have multiple antenna nodes on both the transmitting and re-
ceiving end of the link. Initial results suggest that the application of modern spatial diversity
systems is expected to improve the energy efficiency and lifetime of wireless sensor network.
Appendix: Derivation of Equation (3)
The slowness vector α
α
α in (2) is defined as,
α
α
α
=
d
c
. (21)
The d vector represents the direction of observation and can be expressed in cartesian coordi-
nates as,
d
= d ·
{
−sin(θ)cos(ϕ), − sin(θ) sin(ϕ ), cos(θ)
}
. (22)
Assuming that the sensor nodes are only distributed in the x
− y plane. In addition, if we
assume a far-field plane wave solution, then the individual propagation induced time delay
∆t
n
is calculated from the slowness vector α
α
α and the position vector x
n
of each node n as,
∆t
n
= α
α
α · x
n
=
r
n
c
(
−
sin
(
θ
)
cos
(
ϕ
)
cos
(
ϕ
n
)
−
sin
(
θ
)
sin
(
ϕ
)
sin
(
ϕ
n
)
−
0
)
(23)
∆t
n
= −
r
n
c
(
sin(θ)cos(ϕ − ϕ
n
)
)
(24)
The actual direction of propagation d
0
is used to calculate the slowness vector α
α
α
0
of the centre
point of the array,
∆t
0
=
r
n
c
(
sin(θ)cos(ϕ
0
− ϕ
n
)
)
(25)
Substituting (24) and (25) into (3) results in,
z
(t) =
N−1
∑
n=0
w
n
s(t −
r
n
c
(
(
sin(θ)cos(ϕ − ϕ
n
)
)
−
(
sin(θ)cos(ϕ
0
− ϕ
n
)
)
)). (26)
Denoting u
= sin(θ)cos(φ) − sin(θ
0
)cos(φ
0
), v = sin(θ) sin(φ) − sin(θ
0
)sin(φ
0
) and assuming
a sinusoidal signal s
(t), (26) can be expressed as a time harmonic solution,
G
(φ, θ) =
1
N
N−1
∑
n=0
w
n
e
jω(t−
r
n
c
(cos(φ
n
)u+sin(φ
n
)v)
. (27)
Wireless Sensor Networks 90
6. References
Akyildiz, I.; Su, W.; Sankarasubramaniam, Y. & Cayirci, E. (2002). A survey on wireless sensor
networks. IEEE Communications Magazine, Vol. 40, No. 8, August 2002, 102-114.
Balanis, C. (1997). Antenna Theory: Analysis and Design, Chapter 6, John Wiley, 1997.
Cui, S.; Goldsmith, A. & Bahai, A. (2004). Energy-efficiency of MIMO and cooperative MIMO
techniques in sensor networks. IEEE Journal on Selected Areas in Communications,
Vol. 22, No. 6, August 2004, 1089-1098.
Drane, C. Jr. (1968). Useful approximations for the directivity and beamwidth of large
scanning Dolph-Chebyshev arrays. IEEE Proceedings, Vol. 56, No. 11, November 1968,
1779-1787.
Hansen, W. & Woodyard, R. (1938). A New Principle in Directional Antenna Design,
Proceedings IRE, Vol. 26, No. 3, March 1938, 333-345.
Jenkins, J. (1973). Some properties and examples of random listening arrays. IEEE Oceans,
Vol. 5, September 1973, 466-469.
Johnson, D. & Dudgeon, D. (1993). Array Signal Processing: concepts and techniques, Prentice-
Hall Inc., 1993, ISBN 0-13-048513-6.
Lewis, F. (2004). Wireless sensor networks, In: Smart Environments: Technologies, Protocols, and
Applications, Cook, D. & Das, S. (Editors), John Wiley, New York, 2004.
McKay, M. & Collings, I. (2006). Improved general lower bound for spatially-correlated Rician
MIMO capacity. IEEE Communications Letters, Vol. 10, No. 3, March 2006, 162-164.
Pillutla, L. & Krishnamurhty, V. (2005). Joint rate and cluster optimization in cooperative
MIMO sensor networks. IEEE 6th Workshop on Signal Processing Advances in Wireless
Communications, June 2005, 265-269.
Rashid-Farrokhi, F.; Tassiulas L. & and Liu, K. (1998). Joint power control and beamforming in
wireless networks using antenna arrays. IEEE Transactions on Communication, Vol. 46,
No. 10, October 1998, 1313-1324.
Stankovic, J.; Abdelzaher, T.; Lu, C.; Sha, L. & Hou, J. (2003). Realtime communication and
coordination in embedded sensor networks. Proceedings of The IEEE, Vol. 91, No. 7,
July 2003, 1002-1022.
Tubaishat, M. & Madria, S. (2003). Sensor networks: an overview. IEEE Potentials, Vol. 22,
No. 2, April 2003, 20-23.
Energy Efcient Cooperative MAC Protocols in Wireless Sensor Networks 91
Energy Efcient Cooperative MAC Protocols in Wireless Sensor Networks
Mohd Riduan Ahmad, Eryk Dutkiewicz and Xiaojing Huang
X
Energy Efficient Cooperative MAC
Protocols in Wireless Sensor Networks
Mohd Riduan Ahmad
1
, Eryk Dutkiewicz
2
and Xiaojing Huang
3
1
Universiti Teknikal Malaysia Melaka,
2
Macquarie University,
3
CSIRO ICT Centre
1
Malaysia,
2,3
Australia
1. Introduction
Multiple sensor nodes can be used to transmit and receive cooperatively and such a
configuration is known as a cooperative Multiple-Input Multiple-Output (MIMO) system.
Cooperative MIMO systems have been proven to reduce both transmission energy and
latency in Wireless Sensor Networks (WSNs). However, most current work in WSNs
considers only the energy cost for the data transmission component and neglects the energy
component responsible for establishing a cooperative mechanism. In this chapter, both
transmission and circuit energies for both components are included in the performance
models.
Furthermore, in previous work, all sensor nodes are assumed to be always on which could
lead to a shorter lifetime due to energy wastage caused by idle listening and overhearing.
Low duty cycle Medium Access Control (MAC) protocols have been proposed to tackle this
challenge for non-cooperative systems. In this chapter, we propose a new Cooperative low
duty cycle MAC protocol (CMAC) for two cooperative MIMO schemes: Beamforming
(CMAC
BF
) and Spatial Multiplexing (CMAC
SM
). Performance of the proposed CMAC
protocol is evaluated in terms of total energy consumption and packet latency for both
synchronous and asynchronous scenarios. All the required energy components are taken
into consideration in the system performance modelling
and a periodic monitoring
application model is used. The impact of the clock jitter, the check interval and the number
of cooperative nodes on the total energy consumption and latency is investigated. The
CMAC
BF
protocol with two transmit nodes is suggested as the optimal scheme when
operating at the 250 ms check interval with the clock jitter difference below 0.6Tb where Tb
is the bit period corresponding to the system bit rate.
The rest of the chapter is organized as follows. In Section 2, we briefly describe the related
work. Section 3 describes the system model considered in this chapter and explains the low
duty cycle protocols that we propose for cooperative transmission. Sections 4 and 5 model
the system performances and the analytical results for the two cooperative MIMO schemes
(BF and SM) in terms of total energy consumption and latency are presented in Section 6.
Finally, in Section 7 we conclude the chapter.
5
Wireless Sensor Networks 92
2. Related Work
A practical MAC that can suit cooperative transmission is required. Also, a combination of a
practical MAC protocol and an efficient MIMO scheme for cooperative transmission leads to
a more energy efficient and lower latency cooperative MIMO system. A combination of a
MAC protocol and a virtual SM scheme for cooperative MIMO transmission has been
proposed in (Yang et al., 2007) where the combined scheme achieves significant energy
efficiency and lower latency. Further study has been done in (Ahmad et al., 2008a)
evaluating the MAC protocol in (Yang et al., 2007) using the other two cooperative schemes:
BF and Space-Time Block Coding (STBC). The authors in (Ahmad et al., 2008a) proposed
that the optimal scheme for the Cooperative always on MAC (CMAC
ON
) is the BF scheme
with M = 2. However, the MAC protocols for all the schemes considered the transceivers as
always being on and the networks are perfectly synchronized. Although the transmission
energy is reduced and the deep fading threat is reduced, the idle listening problem is not
tackled in previous research work. Also, the imperfect synchronization due to clock jitter is
not considered.
Most of the duty cycle MAC protocols are designed for non-cooperative Single-Out Single-
In (SISO) schemes. Polastre in 2004 introduces B-MAC or Berkeley MAC (Polastre et al.,
2004). The protocol is a variant of Carrier Sense Multiple Access (CSMA) with a preamble
sampling mechanism. The preamble sampling is improved with a selective sampling
method where only energy above the noise floor is considered as useful. However B-MAC
experiences a long preamble problem which leads to higher transmission and reception
powers. In order to reduce the long preamble problem, X-MAC (Buettner et al., 2006)
proposed the use of a series of short preamble packets with the destination address
embedded in the packet. The X-MAC protocol provides more energy efficient and lower
latency operation by reducing the transmission energy and period burdens, idle listening at
the intended receiver and overhearing by the neighbouring nodes. One concern is that the
gaps between transmissions of a series of preamble packets can be mistakenly understood
by the other contending nodes as an idle channel and they would start to transmit their own
preamble packets which can lead to collision. One solution is to ensure that the length of the
gaps must be upper bounded by the length of the listen interval.
In the same year, SpeckMAC (Wong & Arvind, 2006) was introduced as a variation of B-
MAC with the idea of redundant transmission of short packets and an embedded
destination address. There are two variants: SpeckMAC-Back-off (SpeckMAC-B) and
SpeckMAC-Data (SpeckMAC-D). SpeckMAC-B sends short wake-up frames with an
embedded target destination address many times. The problem with this scheme is that the
sender wastes its transmission power by still sending the short frames although the receiver
has already received it. Meanwhile, SpeckMAC-D sends the data packet which is preceded
with a short preamble many times until the packet hits the receiver.
In this chapter, we propose redundant transmission of Ready-to-Send (RTS) and Clear-to-
Send (CTS) packets to hit the intended receiver. The cyclic RTS-CTS transmission scheme is
used also for other purposes such as collision avoidance, cooperative nodes selection and
channel state information (CSI) sharing between nodes. A combination of low duty cycle
MAC with cyclic RTS-CTS transmission scheme is believed to reduce further the energy
consumption in cooperative MIMO transmission. In addition, an imperfect synchronisation
scenario due to clock jitter differences is investigated. The major contribution of this chapter
is the proposal of CMAC with embedded low duty cycle mechanism which implements
cyclic RTS-CTS transmission scheme and acknowledgement (ACK) reply to ensure higher
reliability. The CMAC is suggested to be used with two cooperative schemes: optimal BF
and Spatial Multiplexing. We compare the performance of both these schemes in terms of
energy consumption and latency. We also include a comparison with CMAC
ON
, B-MAC and
always on SISO MAC. The impact of the jitter difference, the check interval and the number
of cooperative nodes on the total energy consumption and latency are investigated.
3. System Model
3.1 System Description
The baseline system for cooperative MIMO communication with the transceivers being
always on is equipped with CMAC
ON
protocol as proposed and evaluated in (Jagannathan
et al., 2004). Meanwhile, the baseline system for cooperative MIMO with a periodic wake-up
cycle for the transceiver is equipped with the CMAC protocol as proposed and explained in
sub-section 3.2. The baseline MAC for the SISO scheme with the transceiver being always on
is CSMA-CA with RTS-CTS and ACK packets transmissions. For simplicity of notation, we
denote the SISO scheme with this MAC protocol as the SISO always on protocol or SISO
ON
protocol. Also in this chapter we consider the impact of imperfect synchronization which is
caused by clock jitter alone. The detailed modelling of the impact of clock jitter is given in
sub-section 3.3.
The network configurations for all the schemes considered in this work are as shown in
Figures 1 and 2. The network is assumed to be distributed without any infrastructure. A
new node can join or leave the network at any time because the knowledge of neighbours is
not important due to the fact that the selection of cooperative nodes is done during the
control packets communication. We assume that there are M cooperative transmitting nodes
and one receiving node. A special case for the spatial multiplexing scheme is used where the
number of the cooperative receivers is assumed to be N. Both the source and destination
nodes have n neighbours in their vicinity. The distance between the cooperating nodes
either at the transmitting or receiving side is assumed to be very small compared to the
distance between the source node and the destination node, d. In the case of the cooperative
BF scheme, the channel information is estimated and optimized from the CTS packet by all
the M nodes. As for the cooperative SM scheme, the recovered data from N-1 nodes is
forwarded to the destination node. Both schemes utilize a Maximum Likelihood (ML)
detector and use a coherent receiver.
3.2 Protocol Description
The proposed CMAC protocol combines the advantages of the cooperative MAC with
always on radios and a low duty cycle mechanism. The basic structure of the protocol is
given in Algorithm 1. A node may respond to three events for the case of the BF scheme
(CMAC
BF
) and to four events for the case of the SM scheme (CMAC
SM
). In case a node has a
data packet to send where the node is acting as the source node, the basic operations for
both schemes are shown in Algorithm 2.
A node starts by sending RTS packets followed by an inter-frame spacing (IFS) for a period
of the length of the check interval, T
i
after sensing the channel idle. When a CTS packet is
received, the source sets a timer to wake up later (the sleep duration is T
i
-T
cts
-T
transient
) in
order to transmit a broadcast packet at source (BS) immediately followed by the data packet