Wind_Farm Technical Regulations Potential Estimation and Siting Assessment Part 3 doc
Bạn đang xem bản rút gọn của tài liệu. Xem và tải ngay bản đầy đủ của tài liệu tại đây (2.49 MB, 20 trang )
Technical and Regulatory Exigencies for Grid Connection of Wind Generation
29
Systems for the Grid Integration of Renewable Energy Sources: A Survey. IEEE
Trans. on Industrial Electronics, Vol. 53, No. 4, pp. 1002-1016.
Chen, Z. & Blaabjerg, F. (2009). Wind Farm – A Power Source in Future Power Systems.
Renewable and Sustainable Energy Reviews, Vol. 13, No. 6-7, pp. 1288–1300.
Eltra & Ekraft System (2004). Regulation TF 3.2.5: Wind Turbines Connected to Grids with
Voltages Above 100 kV. Tecnical Regulation for the Properties and the Regulation of Wind
Turbines. Technical Report.
E.ON Netz (2006). Grid Code High and Extra High Voltage. Technical Report.
Erlich, I.; Bachmann, U. (2005). Grid Code Requirements Concerning Connection and
Operation of Wind Turbines in Germany, Proceeding of the IEEE Power Engineering
Society General Meeting, Vol. 2, pp. 1253-1257.
Freris, L. L. (1990). Wind Energy Conversion Systems, Prentice-Hall, 1st Ed., New Jersey, USA.
Guerrero, J. M.; Blaabjerg,F.; Zhelev, T.; Hemmes, K.; Monmasson, E.; Jemei, S.; Comech, M.
P.; Granadino, R. & Frau, J. I. (2010). Distributed Generation: Toward a New
Energy Paradigm. IEEE Industrial Electronics Magazine, Vol. 4, No. 1, pp. 52-64.
Hansen, A. D.; Iov, F.; Blaabjerg, F. & Hansen L. H. (2004). Review of contemporary wind
turbine concepts and their market penetration, Journal of Wind Engineering, Vol. 28,
No. 3, pp. 247-263.
Heier, S. (2006). Grid Integration of Wind Energy Conversion Systems, John Wiley & Sons, 1st
ed., United Kingdom.
IEC 61000-4-7 (2008). Electromagnetic Compatibility (EMC) – Part 4-7: Testing and Measurement
Techniques – General Guide on Harmonics and Interharmonics Measurements and
Instrumentation, for Power Supply Systems and Equipment Connected Thereto.
IEC 61400-21 (2008). Wind Turbines – Part 21: Measurement and Assessment of Power Quality
Characteristics of Grid Connected Wind Turbines.
Jauch, C.; Sorensen, P. & Jensen, B.B. (2004), International Review of Grid Connection
Requirements for Wind Turbines. Proceedings of Nordic Wind Power Conference,
(NWPC 04), Göteborg, Sweden.
Kim, H. S. & Dah-Chuan Lu, D. (2010). Wind Energy Conversion System from Electrical
Perspective – A Survey. Smart Grid and Renewable Energy, Vol. 1, pp. 119-131.
Labriola, C. V. M. (2007). Wind Potential in Argentina, Situation and Prospects. Proceedings
of the International Conference on Renewable Energies and Power Quality (ICREPQ),
Sevilla, España.
Lalor, G.; Mullane, A. & O’Malley, M. (2005). Frequency control and Wind Turbine
Technologies, IEEE Trans. on Power Systems, Vol. 20, No. 4, pp. 1905-1913.
Li, S.; Haskew, T. A.; Muljadi, E. & Serrentino, C. (2009). Characteristic Study of Vector-
Controlled Direct-Driven Permanent Magnet Synchronous Generator In Wind
Power Generation. Electric Power Components and Systems, Vol. 37, No. 10, pp. 1162-
1179.
Martínez de Alegría, I.; Andreua, J.; Martína, J. L.; Ibañez, P., Villate, J. L. & Camblong, H.
(2007). Connection Requirements for Wind Farms: A Survey on Technical
Requirements and Regulation, Renewable and Sustainable Energy Reviews, Vol. 11,
No. 8, pp. 1858–1872.
Molina, M. G. & Mercado, P. E. (2011). Modelling and Control Design of Pitch-Controlled
Variable Speed Wind Turbines. In: Wind Turbines, Al-Bahadly, I. (Ed.),
1st ed., InTech,
Vienna, Austria, pp. 1-30.
Wind Farm – Technical Regulations, Potential Estimation and Siting Assessment
30
Muller, S.; Deicke, M. & De Doncker, R. W. (2002). Doubly Fed Induction Generator
Systems for Wind Turbines. IEEE Industry Applications Magazine, Vol. 8, No. 3,
pp. 26-33.
Qiao, W.; Harley, R. G. & Venayagamoorthy, G. K. (2007). Dynamic Modeling of Wind
Farms With Fixed-Speed Wind Turbine Generators, Proceedings of IEEE PES 2007
General Meeting, June 24-8, Tampa, USA.
Rahman, S. (2003). Going Green: The Growth of Renewable Energy, IEEE Power and Energy
Magazine, Vol. 1, No. 6, pp. 16-18.
Slootweg, J. G. & Kling, W. L. (2003). The Impact of Large Scale Wind Power Generation on
Power System Oscillations, Electric Power Systems Research, Vol. 67, No. 1, pp. 9-20.
Stiesdal, H. (1999). The Wind Turbine: Components and Operation, Special Issue of the Bonus
Energy A/S Info Newsletter, Vol. 1, No. 1, pp. 1-25.
Thomsen, H. J.; Forsberg, T. & Bittner, R. (2007). Offshore Wind Turbine Foundation: The
COWI Experience. Proceedings of the ASME 26th International Conference on Offshore
Mechanics and Arctic Engineering (OMAE), San Diego, California, USA.
Timbus, A.; Liserre, M.; Teodorescu, R.; Rodriguez, P. & Blaabjerg, F. (2009). Evaluation of
Current Controllers For Distributed Power Generation Systems, IEEE Transactions
on Power Electronics, Vol. 24, No. 3, pp. 654-664, March 2009.
Tsili, M. & Papathanassiou, S. (2009). A Review of Grid Code Technical Requirements for
Wind Farms. IET Renewable Power Generation, Vol. 3, No. 3, pp. 308-332.
Vestergaard, J.; Brandstrup, L. & Goddard, R. D. (2004). A Brief History of the Wind Turbine
Industries in Denmark and the United States. Proceedings of the Academy of
International Business (Southeast USA Chapter) Anual Meeting, Knozville, Tenesse,
USA.
Villalobos Jara, F. A. (2009). Foundations for Offshore Wind Turbines. Revista Ingeniería de
Construcción, Vol. 24, No. 1, pp. 33-48.
2
O&M Cost Estimation & Feedback of
Operational Data
Tom Obdam, Henk Braam, René van de Pieterman and Luc Rademakers
Energy research Centre of the Netherlands (ECN)
The Netherlands
1. Introduction
Several European countries have defined targets to install and to operate offshore wind
energy and according to these targets more than 40 GW offshore wind power is expected for
the year 2020. With an average turbine size of about 5 - 10 MW, four to eight thousand wind
turbines should be transported, installed, operated and maintained. When not only the
European plans are considered, but all international developments as well, these numbers
are much higher. So worldwide the required effort for operation and maintenance (O&M) of
offshore wind farms will be enormous, and control and optimisation of O&M during the
lifetime of these offshore wind turbines is essential for an economical exploitation. At the
moment O&M costs of offshore wind farms contribute substantially (2 to 4 ct/kWh) to the
life cycle costs, so it may be profitable to check periodically whether the O&M costs can be
reduced so that the total life cycle costs can be reduced (Rademakers, 2008b; Manwell)
During the planning phase of a wind farm an estimate of the expected O&M cost over the life
time has to be made to support the financial decision making, and furthermore quite often
an initial O&M strategy has to be set up. To support this process ECN has developed the
O&M Tool (Rademakers 2009a). With this computer program developed in MS-Excel it is
possible to calculate the average downtime and the average costs for O&M over the life time
of the wind farm. Both preventive and corrective maintenance can be considered. To analyse
corrective maintenance the failure behaviour of the wind turbine has to be modelled and a
certain maintenance strategy has to be set up , i.e. for each failure or group of failures it has
to be specified how many technicians are needed, how these technicians are transferred to
the wind turbine (small boats, helicopter, etc.) and whether a crane ship is needed. By
carrying out different scenario studies the most effective one can be considered for more
detailed investigations and technical assessment. The long term yearly costs and downtime
are calculated and for this purpose it is sufficient to assume a constant failure rate of the
wind turbines over the life time, hence it is assumed that the number of failures of a certain
type is constant over the years. With this assumption the annual cost and downtime for a
certain failure equals the product of number of failures of this type per year, and the
downtime or cost associated with this type of failure. The total cost is a simple summation
over all failures assumed to occur. So the determination of the annual cost and downtime is
a straightforward operation. Once the model has been set up, the effect of adjusting an input
parameter is visible immediately, which makes the O&M Tool a powerful tool commonly
used by the wind industry. However, the straightforward method based on long term
Wind Farm – Technical Regulations, Potential Estimation and Siting Assessment
32
average values introduces some limitations as well. As the actual variation in failure rate
from year to year is not considered, the tool is not really suitable to estimate the O&M effort
for the coming period of e.g. 1, 2 or 5 years, which is required to control and optimise O&M
of a wind farm in the operational phase. For this reason ECN initiated the idea of
developing the “O&M Cost estimator” (OMCE), as a tool that could be used by operators of
large offshore wind farms.
W.r.t. O&M during operation of a wind farm it is important (1) to monitor the actual O&M
effort and (2) to control and to optimise future O&M costs. For both aspects operational data
available for the wind farm are required. To be able to control the future costs and when
possible to optimise the O&M strategy a computer tool is desired to estimate and to analyse
the expected cost for the coming period. To support the process of monitoring, control, and
optimisation ECN has started the development of the O&M Cost Estimator (Rademakers
2009a, 2009b; Pieterman). To handle both aspects, processing of operational data and
prediction of future O&M costs two major parts can be distinguished:
1. OMCE Building Blocks for processing of operational data, where each building block
covers a specific data set. Currently BB’s are being developed for the following data
sets:
• Operation and Maintenance;
• Logistics;
• Loads and Lifetime;
• Health Monitoring;
The main objective of these building blocks is to process all available data in such a way
that useful information is obtained, which can be used on the one hand as input for the
OMCE-Calculator and on the other hand to monitor certain aspects of the wind farm.
2. OMCE-Calculator for the assessment of the expected O&M effort and associated costs
for the coming period, where amongst others all relevant information provided by the
OMCE Building Blocks is taken into account.
In contrary to the ECN O&M Tool, the OMCE-Calculator is meant to be used during the
operational phase of a wind farm, to estimate the required O&M effort for the coming
period, taking into account the operational experiences of the wind farm acquired during
the operation of the wind farm so far. This implies that for the OMCE model it is not
sufficient to determine long term yearly average numbers, but that another approach has to
be followed, viz. simulation in the time domain. Furthermore the feedback of operational
experience is of great importance for the OMCE model. This approach enables the
possibility to include features not straightforward possible in the O&M Tool, such as
clustering of repairs at different wind turbines, spare control, optimisation of logistics of
offshore equipment, and so on.
In the following sections firstly some more general information if provided on modelling the
O&M aspects of offshore wind farms. Secondly, the OMCE project is discussed in more
detail. In sections 3 and 4 some examples are provided to illustrate the possibilities of,
respectively, the OMCE-Calculator and the OMCE-Building Blocks. Finally, in section 5 the
main conclusions are summarised.
2. Modelling O&M of offshore wind farms
2.1 O&M aspects
A typical lay-out of an offshore wind farm is sketched in Figure 1. The wind farms consist of a
number of turbines, switch gear and transformers (mostly located within the wind farm) and a
O&M Cost Estimation & Feedback of Operational Data
33
substation onshore to feed in the electrical power into the grid. The first wind farms are
located in shallow waters at short distances from the shore in order to gain experiences with
this new branch of industry. Presently, most offshore wind farms are located at distances
typically 8 to 30 km from the shore in water depths of 8 to 30 m. Usually mono-piles are being
used as a sub-structure and the turbine towers are mounted to the mono-piles by means of
transition pieces. The size of an offshore wind farm is 50 to 200 MW and consists of turbines
with a rated power of typically 1 to 3 MW. Future wind farms are planned further offshore
and will consist of larger units, typically 5 MW and larger, and the total installed capacity will
be 200 to 500 MW, but also wind farms with a capacity in the order of 1 GW are considered.
New and innovative substructures are presently being developed to enable wind turbines to
be sited in deeper waters and to lower the installation costs, see Figure 2.
Fig. 1. Typical lay-out of an offshore wind farm (
All systems and components within the wind farm need to be maintained. Typically for
preventive maintenance, each turbine in a wind farm is being visited twice a year and each
visit has a duration of 3 to 5 days. In addition a number of visits for corrective maintenance
are needed due to random failures. Public information about corrective maintenance is very
limited, but numbers of 5 visits or more are not unrealistic. In the future it is the aim to
improve the turbine reliability and maintainability and reduce the frequency of preventive
maintenance to no more than once a year. The number and duration of visits for corrective
maintenance should be decreased also by improved reliability and improved
maintainability. With the use of improved condition monitoring techniques the effects of
random failures can be reduced by applying condition based maintenance. In addition to
the turbine maintenance, also regular inspections and maintenance are carried out for the
sub-structures, the scour protection, the cabling, and the transformer station. During the
first year(s) of operation the inspection of substructures, scour protection, and cabling is
done typically once a year for almost all turbines. As soon as sufficient confidence is
obtained that these components do not degrade rapidly operators may decide to choose
longer inspection intervals or to inspect only a sub-set of the total population.
The maintenance aspects relevant for offshore wind farms are among others:
• Reliability of the turbines. As opposed to onshore turbines, turbine manufacturers
design their offshore turbines in such a way that the individual components are more
reliable and are able to withstand the typical offshore conditions. This is being done by
reducing the number of components, choosing components of better quality, applying
Wind Farm – Technical Regulations, Potential Estimation and Siting Assessment
34
climate control, using automatic lubrication systems for gearboxes and bearings, etc.
Often, the turbine control is modified in such a way that not all single failures lead to a
stand still. Making better use of the diagnostics and using redundant sensors can assist
in this.
Fig. 2. Sub-structures (Roddier).
• Maintainability of the turbines. If offshore turbines fail, maintenance technicians need
to access the turbines and carry out maintenance. Especially in case of failures of large
components, offshore turbines are being modified to make replacements of large
components easy, e.g. by making modular designs, or by building in an internal crane
to hoist large components, see for example Figure 3.
Fig. 3. Examples of internal cranes in the Siemens 3.6 (left) and Repower 5M (right) turbines
• Weather conditions. The offshore weather conditions, mainly wind speeds and wave
heights, do have a large influence on the O&M procedures of offshore wind farms.
However, also fog or tidal flows may influence the accessibility. The maintenance
O&M Cost Estimation & Feedback of Operational Data
35
activities and replacement of large components can only be carried out if the wind
speed and wave heights are sufficiently low. Preventive maintenance actions are
therefore usually planned in the summer period. If failures occur in the winter season, it
does happen that technicians cannot access the turbines for repair actions due to bad
weather and this may result in long downtimes and thus revenue losses.
• Transportation and access vessels. For the nowadays offshore wind farms, small boats
like the Windcat, Fob Lady, or SWATH boats are being used to transfer personnel from
the harbour to the turbines. In case of bad weather, also helicopters are being used, see
Figure 4. RIB’s (Rigid Inflatable Boats) are only being used for short distances and
during very good weather situations. The access means as presented in Figure 4 can
also transport small spare parts. For intermediate sized components like a yaw drive,
main bearing, or pitch motor it is often necessary to use a larger vessel for
transportation, e.g. a supply vessel. New access systems are being developed to allow
personnel transfer even under harsh conditions. An example which has been developed
partly within the We@Sea program is the Ampelmann (www.ampelmann.nl).
Fig. 4. Examples of transportation and access equipment for maintenance technicians;
clockwise: Windcat workboat, Fob Lady, helicopter, and SWATH boat
• Crane ships and Jack-up barges. For replacing large components like the rotor blades,
the hub, and the nacelle and in some cases also for components like the gearbox and the
generator, it is necessary to hire large crane ships, see Figure 5.
Wind Farm – Technical Regulations, Potential Estimation and Siting Assessment
36
Fig. 5. Examples of external cranes for replacement of large components; Jack-up barge
ODIN (left) and crane ship
• Vessel and personnel on site all the time. When going further offshore the time to
travel from the harbour to the wind farm will increase, so that the technicians will have
only limited production time, may be less than 5 hours. Advantage of having a vessel
and personnel on-site all the time is that technicians are able to work a full day. For
corrective maintenance this will imply that the total downtime can be reduced while for
preventive maintenance less technicians are required. Figure 6 shows an impression of
the Sea energy’s Ulstein X-bow, which can take 24-36 technicians.
2.2 Types of maintenance
When looking at a general level, maintenance can be subdivided in preventive and
corrective maintenance. Corrective maintenance is necessary to repair or replace a
component or system that does not fulfil its designed purpose anymore. Preventive
maintenance is performed in order to prevent a component or system from not fulfilling its
designed purpose. Both preventive and corrective maintenance can be split up further and
depending on the type of application different levels of detail are used. In the CONMOW
project (Wiggelinkhuizen, 2007, 2008) it is shown that when considering wind turbine
technology the following categories seem appropriate, see also Figure 7.
• Preventive maintenance;
• Calendar based maintenance, based on fixed time intervals, or a fixed number of
operating hours;
• Condition based maintenance, based on the actual health of the system;
• Corrective maintenance;
• Planned maintenance, based on the observed degradation of a system or
component (a component is expected to fail in due time and should be maintained
before the actual failure does occur);
• Unplanned maintenance, necessary after an unexpected failure of a system or
component.
O&M Cost Estimation & Feedback of Operational Data
37
Fig. 6. Impression of Sea energy’s Ulstein X-bow
( />level).
Both condition based preventive maintenance and planned corrective maintenance are
initiated based on the observed status or degradation of a system. The main difference
between these two categories is that condition based preventive maintenance is foreseen in
the design, but it is not known in advance when the maintenance has to be carried out,
while the occurrence of planned corrective maintenance is not foreseen at all. This is
illustrated by the examples below.
Example condition based preventive maintenance
The oil filter has to be replaced several times during the lifetime of the turbine. To avoid
calendar based maintenance the oil filter is monitored and the replacement will be done
depending on the pollution of the filter. So it is not the question if this maintenance has to
be carried out, but when it has to be done.
Example planned corrective maintenance
During the lifetime of the turbine it appears that the pitch motors show unexpected wear
out and have to be revised in due time to avoid complete failure. Until this revision, if
carried out in due time, the pitch system is expected to function properly. On contrary to the
example above this type maintenance was initially not foreseen, but as it is not necessary to
shut down the turbine, the maintenance can be planned such that it can be carried out at
suitable moment.
Wind Farm – Technical Regulations, Potential Estimation and Siting Assessment
38
Fig. 7. Schematic overview of the different types of maintenance (Wiggelinkhuizen, 2008).
Considering the limited differences between condition based preventive maintenance and
planned corrective maintenance, the planning and execution of both categories will
probably be similar in practice. Hence, only three types of maintenance have to be
considered:
• Unplanned corrective maintenance
• Condition based maintenance
• Calendar based maintenance
For offshore wind energy, condition based maintenance is preferred above unplanned
corrective maintenance since it can be planned on time. Spare parts, crew and equipment
can be arranged on time and the turbine can continue running during bad weather
conditions. Consequently, revenue losses can be limited.
2.3 Cost estimation
Generally, the costs for maintaining an offshore wind farm will be determined by both
corrective and preventive maintenance. In Figure 8, the different cost components are
schematically drawn. The O&M costs consist of preventive maintenance costs which are
usually determined by one or two visits per year. After 3 or 4 years the preventive
maintenance costs can be somewhat higher due to e.g. oil changes in gearboxes. On top of
that there are corrective maintenance costs which are more difficult to predict. At the
beginning of the wind farm operation the corrective maintenance costs can be somewhat
higher than expected due to teething troubles. Finally, it might be that major overhauls (e.g.
replacement of gearboxes or pitch drives) are foreseen once or twice per turbine lifetime.
For many technical systems three phases can be identified over the lifetime and this is also
schematically drawn in Figure 8.
O&M Cost Estimation & Feedback of Operational Data
39
Fig. 8. Schematic overview of the maintenance effort over the lifetime of a turbine. In reality,
none of the lines is constant; the actual maintenance effort will vary from year to year.
Phase 1: During the commissioning period, the burn-in problems usually require additional
maintenance effort (and thus cost). Time should be spent on finding the right
settings of software, changing minor production errors, etc. During this period the
maintenance effort usually decreases with time.
The turbine manufacturer usually provides a contract to the customer with a fixed
price for the first five years of operation. The contract includes commissioning,
preventive and corrective maintenance, warranties and machine damage.
Phase 2: During this phase random failures might be expected, and the failure rate is more
or less constant over this period. However in reality the actual maintenance effort
will vary from year to year and will fluctuate around the long-tem average value,
which is displayed in Figure 8 by the red line.
After say about 10 years of operation, it is very likely that some of the main systems
of the turbines should be revised, e.g. pitch motors, hydraulic pumps, lubrication
systems, etc. With the offshore turbines, no experience is available up to now on
how often a major overhaul should be carried out. The exact point in time at which
the overhaul(s) should take place is presently not known, perhaps after 7 years, 15
years, or not at all. The major overhaul in fact is to be considered as “condition
based maintenance”.
Phase 3: At the end of the lifetime it is likely that more corrective maintenance is required
than in the beginning of the lifetime. It is presently unclear how much more this
will be.
Figure 8 schematically shows the variation in O&M effort over the years that should be
considered to assess the expected costs and downtime. If one is interested in the average
O&M costs over the lifetime the yearly variation is not of importance and the annual costs
can be determined based on long term average values of failure rate costs, etc. This
Lifetime
Maintenance
Effort
Major overhaul
Corrective maintenance
Preventive maintenance
Phase 1 Phase 2 Phase 3
Long term average
(planning phase)
Wind Farm – Technical Regulations, Potential Estimation and Siting Assessment
40
approach is used in the O&M Tool and is especially suitable in the planning phase of new
project.
It is clear from Figure 8 that the costs in a certain year may deviate significantly from the
long term average value. Due the randomness of the occurrences of failures it may occur
that in one year the number of failures is much higher than average and in another year
much less. In case the number of failures is higher than average it may occur that the
downtime per failure is higher than average due to the unavailability of ships or spares. On
the other hand if the number of failures is less than average the cost of equipment per failure
may be higher, because of overcapacity. In both situations it is assumed that the number of
ships is allocated based on the average failure rate. So if one is interested not only in the
average value of the cost but also in expected variation, the cost estimation should be based
on the actual occurrences of failures, which can be modelled by means of a Poisson process
(Vose) this implies that the cost estimation should be done based on time simulation taking
into account operational data, which has been applied in de OMCE-calculator.
3. OMCE project
In this section information is provided on the OMCE project, where the background and
objectives are listed, a description of the OMCE model is given and the position of the
OMCE within an integral wind farm monitoring system us discussed.
3.1 Background and objectives
As part of the Bsik programme ‘Large-scale Wind Power Generation Offshore’ of the
consortium We@Sea (www.we-at-sea.org) ECN initiated the idea of developing the
Operation & Maintenance Cost Estimator as a tool that could be used by operators of large
offshore wind farms to monitor the O&M effort for wind farms in operation already and to
control the costs of these wind farms for the coming period of e.g. 1,2 or 5 years. To be able
to control and subsequently to optimise the future O&M costs of these wind farms, it is
necessary to accurately estimate the O&M costs for the next coming period, taking into
account the operational experiences available at that moment. Several reasons are present
for making accurate cost estimates of O&M of (offshore) wind farms. Examples are:
• to make reservations for future O&M costs (this is especially important for the party
who is responsible for the financial management of the maintenance);
• operating experiences may give indications that changing the O&M strategy will be
profitable, and then the costs need to be determined accurately in order to compare the
adjusted strategy with the original one;
• before the expiration of the warrantee period, a wind farm owner needs to decide how
to continue with servicing the wind turbines (new contract with turbine supplier or to
take over the total responsibility) after the warranty period;
• if a wind farm is going to be sold to another investor, the new owner wants to have
detailed information on what O&M costs he can expect in the future.
It may be clear that such a tool with these features is not of interest for operators only, but
also for other stakeholders (owners of wind farm, wind turbine manufacturers, etc.).
The above mentioned initiative of ECN resulted in the OMCE-project with the main
objective to develop methods and tools that can be used to estimate the future O&M effort
and associated costs for the coming period of f.i. 1, 2 or 5 years, taking into account the
O&M Cost Estimation & Feedback of Operational Data
41
operational experiences of the wind farm acquired during the operation of the wind farm so
far. The objective is to determine not only the expected values for characteristic O&M
parameters, but also to quantify the effect of uncertainties due to the random occurrence of
failures, due to variability of the weather conditions, and the due to the uncertainty in the
operational data. The O&M Cost estimator is developed in such a way that cost estimates
can be made at any point in time during the operational phase. However, it is a prerequisite
that at least 2 to 3 years of operational data are available.
The development of the specifications for the OMCE was carried out within the Bsik
programme ‘Large-scale Wind Power Generation Offshore’ of the consortium We@Sea. At
the moment that the We@Sea project finished in 2009, the D OWES (Dutch Offshore Wind
Energy Services) project (DOWES, Leersum) was started, and within this project the
development of the event list and the programming of the OMCE-Calculator is carried out.
3.2 Description of the OMCE model
3.2.1 Overall structure
The OMCE is designed to determine the O&M effort and associated costs for the coming
period (say the next 1, 2 or 5 years) taking into account the operational experience available
at that moment. That’s why two major modules can be distinguished in the overall structure
of the OMCE as depicted in Figure 9.
1. The OMCE Building Blocks
To process operational data four so called OMCE Building Blocks (BB) have been
specified, each covering a specific data set.
- BB Operation and Maintenance;
- BB Logistics;
- BB Loads and Lifetime;
- BB Health Monitoring;
The main objective of these building blocks is to process all available data in such a way
that useful information is obtained, which on the one hand can be used for monitoring
purposes and which on the other hand can be used to specify the input for OMCE
calculator. If convenient other types of building blocks can be included.
2. The OMCE-Calculator
The main objective is to determine the expected O&M effort and associated costs for the
coming period, where amongst others all relevant information provided by the OMCE
Building Blocks is taken into account. Three types of maintenance are included, viz.
calendar based maintenance, condition based maintenance and unplanned corrective
maintenance.
3.2.2 Event list
Originally it was assumed that the different data sources would provide enough
information to execute the different BB’s. However, from previous studies it was concluded
that especially the O&M data and the logistics data were not available in a format suitable
for straightforward further processing. The main reasons for this are:
• During the first few years of operation, operators are not in charge of the maintenance.
Although they do receive copies of worksheets, SCADA data, and information on the
use of equipment and spare parts, it is in most cases not traceable why certain activities
are carried out and how some activities are linked to e.g. alarms or other activities.
Wind Farm – Technical Regulations, Potential Estimation and Siting Assessment
42
Fig. 9. OMCE concept including the process of structuring the raw data into an event list
• Since the operators are not in charge of the maintenance, there is not really a need to
analyse the O&M data in large detail and to determine the cost drivers. In most cases
long term contracts are signed with a service provider (usually the turbine supplier).
The operator is not forced to analyse the data and thus to set up a structured format for
data collection.
• The data are stored in different sources and in different formats, sometimes even
handwritten. This makes it difficult to automate the processing, especially because the
different data sources are generally not well correlated.
It was concluded that the acquisition of raw data generated by an offshore wind farm
should be structured such that the data stored in various data sources are correlated
uniquely. Based on the workflow controlled by the maintenance manager of a wind farm, a
possible method is outlined for O&M related data. According to this method all O&M
related data stored in the different data sources are correlated be means of the “initiating
event” for a certain maintenance activity. In case data are collected in such a structured
manner it should be possible to extract the so called “event list” from these data sources. Per
turbine the event list contains an overview of the different maintenance events that have
occurred in chronological order. Per event, relevant issues like the failed component, the
trigger for a repair action, the equipment and labour used need to be stored. The event list is
meant to structure and classify the raw data in such a way that it can be processed by the
OMCE BB’s “Operation and Maintenance” and “Logistics”. For further development of the
OMCE it is assumed that raw data can be imported in a relational database and that the
event list can be extracted from this database.
3.2.3 Interface between building blocks and calculator
As shown in Figure 9 the OMCE consists of 4 building blocks to process a specific data set
each. The objective of processing the operational data is in fact twofold:
BB
Operation &
Maintenance
BB
Loads
&
Lifetime
BB
Health Monitoring
BB
Logistics
BB
Operation &
Maintenance
BB
Logistics
Raw DATA
- SCADA
- Vessel transfers
- Maintenance sheets
- Monthly reports
- Weather reports
- CM data
- Production figures
- Spare parts
- Etc.
Structured
DATA
- Event list
INFO
INFO
-Failure rate
-Repair strategy
-Time to failure
(
Repair strateg
y
)
A
nnual
O&M
Costs
OMCE Calculato
r
Condition
Based
Maintenance
Unplanned
Corrective
Maintenance
Calenda
r
Based
Maintenance
OMCE Calculato
r
Condition
Based
Maintenance
Unplanned
Corrective
Maintenance
Calenda
r
Based
Maintenance
A
rea where specifications for
the event list apply to
Area where specifications for
the event list are a
pp
licable
O&M Cost Estimation & Feedback of Operational Data
43
1. To provide information to determine or to update the input values needed for the
calculation of the expected O&M effort.
2. To provide information that gives insight in the health of the wind turbines, for
example by means of trend analyses.
In this report special attention will be given to the first objective in order to specify in more
detail what kind of output is expected from the different building blocks in order to
generate input for the OMCE-Calculator. It is not expected that the input needed for the
calculations can be generated automatically in all cases. The opposite might be true, namely
that experts are needed to make the correct interpretations. It is important to realise that
there is a difference between the output of the different Building Blocks and the input
needed for the OMCE-Calculator. The input needed for the OMCE-Calculator should
represent the expected values for the coming period. The various BB’s describe the historical
situation. If the future situation is similar to the historic situation, the information of the BB’s
can be used to generate input data for the OMCE-Calculator. If the new situation has
changed, the information of the BB’s should be used with care or maybe not used at all.
Examples of changes are given below.
• The BB’s “Operation & Maintenance”, “Health Monitoring”, and “Loads & Lifetime”
generate data (failure rates and expected times to failure) at the level of main systems,
components or even (and most preferred) at the level of failure modes. If for instance
certain components have been replaced (or will be replaced soon) in all turbines (e.g. by
components from different suppliers), the data determined by the various BB’s do not
necessarily represent the new situation. In the case of failure rates, new estimates need
to be made for these components, e.g. by using data from generic databases, or by
means of engineering judgement.
• Costs of personnel, equipment, spares, etc are very important input for the OMCE-
Calculator to determine the (near) future O&M costs. Most of the cost items are very
dependent on the type of contract between operator and e.g. component supplier or
maintenance contractor. Such contracts, and thus the prices of spare parts or for renting
equipment will change over time. The input for the OMCE should represent the
contracts for the next coming period. Analysing the historical costs to generate input
data only makes sense if the new situation with new contracts is similar to the historical
situation.
So in general it can be said that it is not always necessary to extract all input data from
historical data. It is important that the new cost estimates are based on values that represent
the future developments best. This means that not all output of the BB’s can and will be
used as input data for the OMCE-Calculator. The BB’s can be used later on to assess if the
new situation indeed is an improvement as compared to the historical situation. E.g. the BB
“Operation & Maintenance” can be used to verify if the failure rate of a new component
indeed is less than the failure rate of the original component. Furthermore it is important to
realise that the BB’s “Operation & Maintenance”, “Health Monitoring”, and “Loads &
Lifetime” generate data at the level of components or even at the level of failure modes
whereas the OMCE-Calculator requires input data at the level of Fault Type Classes
(FTC’s).
3.3 Integral monitoring and control system
Although the OMCE is being developed as a standalone system it is expected that in the
future the OMCE will become part of integral information and decision support systems, f.i.
Wind Farm – Technical Regulations, Potential Estimation and Siting Assessment
44
an IT-system as being developed by Dutch Offshore Wind Energy Services DOWES
(Leersum). DOWES is a 4 year research project, which started in May 2009, and will stretch
until the end of 2013 and does focus on the development of an integral monitoring and
control system. The integration of the DOWES systems is twofold. On one hand the
development focuses on the raw data. The envisioned system is a platform which supports
and enables the monitoring and control functionalities of (offshore) wind turbines,
regardless of the type, manufacturer or capacity of the turbine. On the other hand the
development is focused on the integration of data and information obtained and provided by
parties in the value chain. This requires current insights and inclusion of detailed processes
and information down to the individual users whereas information and decision support on
strategic level requires overviews and extensive prognoses on the mid- and long-term.
The position of the OMCE BB’s and the OMCE-Calculator within the DOWES portal is
schematically depicted in Figure 10. The BB’s will be integrated within the IT-system.
However, the calculator is positioned as an add-in to the system. The input for the OMCE-
Calculator is provided by the system and the results obtained with the OMCE-Calculator
are stored in the integral system. In this way both the results of the BB’s and the results
generated by the calculator can be made available for long-term decision support. For
instance when optimization of the O&M strategy has to be considered, several scenarios can
be analysed by means of the calculator using data originating from the BB’s and other data
sources available. After the results of these analyses are stored in the system they can be
approached by the user in connection with all kind of other data to decide upon possible
improvements in the O&M strategy.
In case the OMCE has to be integrated in a client specific information and decision support
system a system similar to Figure 10 can be set up such that the client specific requirements
are fulfilled.
Fig. 10. Structure of the D OWES system for optimising O&M of offshore wind farms in the
long and short term making use of wind farm data. The green rectangle represents the
portal from which all data sources and models can be approached. The orange oval
represents the OMCE-Calculator, which uses the data processed by the OMCE BB’s as input.
O&M Cost Estimation & Feedback of Operational Data
45
4. OMCE-Calculator
In this section the functionality and capabilities of the OMCE-Calculator will be discussed in
some more detail. In the following sections firstly the starting points for the development of
the OMCE-Calculator as presented after which a number of examples are discussed which
indicate the functionality of the developed software demo of the OMCE-Calculator.
4.1 Starting points
The main objective of the OMCE-Calculator is to assess the total O&M effort and the
associated costs and downtime for the coming period of 1 to 5 years, where all aspects
affecting O&M should be considered. Starting point for the OMCE-Calculator are all three
types of maintenance described in section 2.2, where at least the following aspects should be
included:
• Random occurrence of failures.
• The number of failures in a certain year is a stochastic quantity.
• Failures in different wind turbines may coincide or may happen close together. On the
one hand repairs can probably be clustered (f.i. crane ship is mobilised only once to visit
a number of turbines) , or on the other hand some repairs need to be postponed due to
unavailability of equipment or spares.
• Flexibility w.r.t. maintenance strategies, because different types of failures may require
completely different approach.
• For some repairs a sequence of maintenance phases are required. F.i. after a failure of a
main component first two inspections have to be made and next the component has to
be replaced using a crane ship. After the replacement another inspection has to made
before commissioning can be started. So in total 5 different phases have to be
distinguished.
• Some phases have to be completed during one continuous operation, while other
phases can be carried out during a number of non successive days. For both situations it
should be optional to work in a number of shifts.
• Interaction between three types of maintenance.
• Availability of equipment may vary with time (more equipment is allocated during
summer for preventive maintenance, of during certain period in which condition based
maintenance is planned).
• Determination of waiting time due to bad weather and calculation of revenue losses
should be based on representative weather data. In this way the effect of the inherent
variability in weather data on waiting time can be quantified. Furthermore, a realistic
estimate of the revenue losses can be made by taking into account the effect of relatively
high wind speeds during the waiting period, and relatively low wind speeds during the
actual repair.
• Logistic aspects of offshore equipment and spares should be treated such that results
can be used for optimisation purposes. Stock control should be optional.
• Uncertainty in input parameters (cost, logistic etc.) may be time dependent, f.i. when
considering a period of three years, the uncertainty in year three probably is higher
than in year one).
• Reliability of wind turbines may be dependent on the location within the wind farm, f.i.
the failure behaviour of a wind turbine always operating in the wake may differ from a
wind turbine located at the edge of the wind farm, where this difference generally will
not be the same for all components.
Wind Farm – Technical Regulations, Potential Estimation and Siting Assessment
46
Considering these requirements it is clear that when analysing future O&M one has to deal
amongst others with the random occurrence of failures, the stochastic nature of the weather
conditions and furthermore a number of input variables are not known accurately but show
some uncertainty. Because the OMCE-Calculator is meant to make estimations for a
relatively short period (1 to 5 years) and because the random occurrence of failures in
combination with the actual weather conditions has to be taken into account, it may be
obvious to develop a time based simulation model and to quantify the uncertainties by
carrying out a (large) number of simulations. To model the simulation process an integral
maintenance plan will be elaborated as a function of time, taking into account the interaction
between the different maintenance types, the simultaneous maintenance actions on different
wind turbines, and the availability of resources.
4.2 Examples
To illustrate the capabilities of the OMCE-Calculator software a number of examples are
presented. These examples are not representative for an entire wind farm, but are
specifically defined to show how the OMCE-Calculator output can be used to optimise
O&M on an operational wind farm. This paragraph will focus on the following 3 examples:
1. Consider limitations in stock control of spare parts for unplanned corrective
maintenance and use this information to optimise the number of components on stock
with respect to downtime of the turbines in the wind farm.
2. Consider limitations in vessels available for unplanned corrective maintenance and
determine the optimal number of vessels to buy or hire with respect to total O&M costs
of the wind farm.
3. Perform condition based maintenance in the wind farm with different amounts of
dedicated equipment and show the advantage of having multiple vessels with respect
to the maintenance planning period.
4.2.1 Stock size optimisation
To illustrate how the limitations in the number of spare parts available influence the
downtime of the turbines in the wind farm, a simplified example is analysed. The objective
of this example is to investigate the relation between the number of spare parts in stock, the
total downtime, and to determine the optimal stock size. This example has the following
significant inputs:
• 12 wind turbines
• Failure rate per turbine = 2/year
• Historical wind en wave data at the ‘Munitiestortplaats IJmuiden’ is used to determine
site accessibility and revenues
• A work day has a length of 10 hours and starts at 6:00 am.
• 1 system with 1 fault type class for unplanned corrective maintenance, 1 corresponding
repair class and 1 corresponding spare part
• The repair class will contain a maintenance event with 1 mission phase (repair) which
can be split up in time.
• The reordering time of the spare part is set at 720 h (approximately 1 month), which is
much higher than the logistic time to transport the spare part from the warehouse to the
harbour at 2 h.
• The simulation will be run for a simulation period of 1 year with a start-up period of 1
year. The number of simulations performed is set at 100 to obtain statistically significant
results with respect to the downtime.
O&M Cost Estimation & Feedback of Operational Data
47
If the failure distribution were to be uniform in time, then logically the number of failures
will require 2 spare parts per month. With a reordering time of 1 month, a stock size of 2
spares would be sufficient. However, the failure distribution is a Poisson distribution. Now
by varying the stock size from 1 to 12 the relation between the stock size and the total
downtime of turbines in the wind farm can be set-up. A stock size of 0 spare parts is
simulated by disabling stock control and increasing the logistic time to 722 h, while similarly
an infinite stock size is simulated by simply disabling stock control and setting only the
logistic time at 2 h. The simulation results are depicted in Figure 11.
0
2000
4000
6000
8000
10000
12000
14000
16000
18000
20000
024681012
Downtime y
-1
[h]
Stock size [-]
Optimisation stock size wrt downtime
Avg. + St.Dev.
Avg. - St.Dev.
Average
No control Tlog = 722 h
No control Tlog = 2 h
Fig. 11. Results of stock size variation vs. total downtime of wind turbines
In the graph it can now be seen that for this example when 6 or more spares are kept in
stock, both the average downtime and the standard deviation in the results seem to
converge to the static value obtained without stock control (the data points for ‘no control
T
log
= 2 h’). The remainder of the downtime at this point is a combination of remaining
logistic downtime, waiting time for a suitable weather window and repair time (the applied
vessel for maintenance does not have mobilisation time.
Based on these observations the advantages of having spare parts (with high reordering
time) in stock for components which fail frequently become very clear and can be quantified
with the output of the OMCE-Calculator.
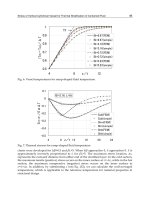
4.2.2 Equipment optimisation
To illustrate how the limitations in the number of vessels available for unplanned corrective
maintenance influence the downtime of the turbines in the wind farm, a second simplified
example is programmed in the OMCE-Calculator. Now the objective of this second example
is to investigate the relation between the number of vessels available and the total
downtime. This example has the following significant inputs:
Wind Farm – Technical Regulations, Potential Estimation and Siting Assessment
48
• 50 wind turbines
• Failure rate per turbine = 5/year
• Historical wind en wave data at the ‘Munitiestortplaats IJmuiden’ is used to determine
site accessibility and revenues
• A work day has a length of 10 hours and starts at 6:00 am.
• 1 system with 1 fault type class for unplanned corrective maintenance, 1 corresponding
repair class and 1 corresponding spare part
• The repair class will contain a maintenance event with 1 mission phase ‘Repair’, where
6 hours of work with 2 technicians are required.
• The vessel used for the repair will be of the ‘support vessel’ type, which can only apply
maintenance on a single wind turbine with a single crew when it travels to and from the
wind farm. The travelling time of this equipment is set at 1 hour. The mobilisation time
of this vessel will be set at 0 hours. In addition to hourly cost and fuel surcharges, fixed
yearly cost of 250 k€ are assigned to each vessel.
• The simulation will be run for a simulation period of 1 year with a start-up period of 1
year. The number of simulations performed is set at 100 to obtain statistically significant
results with respect to downtime and energy production.
The input details for the equipment defined are also shown in Table 1.
Project:
Equipment 1
Equipment no. Type Name
1 Support vessel Support 1 Unplanned corrective Condition based Calendar based
Logistics & availability Unit Input Weather limits Unit Input
Cost
Unit Input Input Input
Mobilisation time h 0 Wave height Travel m 2 Work Euro/h 300 300 0
Demobilisation time h 0 Transfer m 2 Euro/day 0 0 0
Travel time h 1 Positioning m 2 Euro/mission 0 0 0
Max. technicians - 6 Hoisting m 2 Wait Euro/h 0 0 0
Transfer category - single crew Wind speed Travel m/s 12 Euro/day 0 0 0
Travel category - daily Transfer m/s 12 Euro/mission 0 0 0
Vessels available corrective - 1 Positioning m/s 12 Fuel surcharge per trip Euro/trip 300 300 0
Vessels reserved condition - 0 Hoisting m/s 12 Mob/Demob Euro/mission 0 30000 0
Vessels reserved calendar - 0 Fixed yearly Euro/day 250000 0 0
Table 1. Reflection of equipment input optimisation project (1 equipment available)
Although the example objective is similar to the example as discussed in section 0, the
results are assumed to be different. The example inputs are set such that the average amount
of failures will approximate to 250 per simulation. If these 250 failures were to occur
independently on days where the defined support vessels’ weather limits are sufficient to
carry out all of the work, it would theoretically be possible to service the entire wind farm
with 1 vessel. However, the failures follow the Poisson distribution and the weather limits
set for this vessel are relatively strict with respect to the measured wave heights and wind
velocities. This is expected to lead to a large increase in resource-related downtime if only 1
vessel were to be available to perform maintenance.
Now, by varying the number of available support vessels from 1 to 6, the relation between
the number of vessels available and the total downtime of wind turbines can be set-up. The
simulation results are depicted in Figure 12. We see that if only one vessel is available, than
the average total downtime is more than doubled compared to the case when there are 2
vessels available. From 4 vessels onward, the decrease in downtime due to a lack of
resources becomes smaller.