Wireless Sensor Networks Part 8 potx
Bạn đang xem bản rút gọn của tài liệu. Xem và tải ngay bản đầy đủ của tài liệu tại đây (1.91 MB, 25 trang )
Wireless Sensor Networks 168
a mathematical model of conversion. For example, if ranging measure is done by RSS,
the source would likely be an acquisition via ADC (Analog to Digital Converter) of the
incoming signal strength.
At this interface several other internal parameters can be considered, due to the complexity of
the transceiver design. Most of these parameters are also handled by Res ource Management
Service “which allows an Application or a Service to get or set the state of the physical ele-
ments of the hardware” Sgroi et al. (2003). Due to likely tight constraints on spatial resolution
for ranging measurements, wideband or Ultra Wide–Band are interesting opportunities for
signal design at the physical layer. If compared to other technologies for ranging, e.g., ultra-
sound Calamari Project (n.d .), UWB may provide highest resolution because it relies on very
short impulses and large bandwidth, and ranging can be somehow embedded in a synchro-
nization process with tuneable settings
5
.
However, in the present contribution we consider the RSS measurements at the PhyGetRange()
function (and in turn at the RDLGetRange() function), as it is nowadays a measure easily avail-
able on many commercial off–the–shelf sensor node platforms, such as the CrossBow’s MICAz
and the TI/Chipcon’s CC2431 ones, which are used in our experimental activities and mea-
surements. To be used in practice (see Section 5.1), RSS–based techniques need a calibration
phase to estimate the path loss low, a relation between the received signal power and the ac-
tual distance between the nodes (by assuming the transmit power is known and fixed). These
calibration issues will be analyzed in the present paper, as well as the impact of outdated
measurements on the system performance.
3. ESD: A Novel Localization Algorithm for WSNs
3.1 Notation
The aim of this section i s to introduce a novel localization algorithm for WSNs. To do so, let
us first introduce some basic notations use f ul for analytical formulation. By assuming an area
with N
A
,
{
A
i
}
N
A
i=1
, “startup anchors” and N
U
,
U
j
N
U
j=1
, blind nodes , the following notation
will be used throughout this chapter: i) bold sy mbols will be used to denote vectors and ma-
trices, ii)
(
·
)
T
will denote transpose operation, iii) ∇
(
·
)
will be the gradient, iv)
·
will be the
Euclidean d istance and
|
·
|
the absolute value, v) ∠
(
·
, ·
)
will be the phase angle between two
vectors, vi)
(
·
)
−1
will denote matrix inversion, vii) ˆu
j
=
ˆ
u
j,x
,
ˆ
u
j,y
,
ˆ
u
j,z
T
will denote the esti-
mated position of the blind node
U
j
N
U
j=1
, viii) u
j
=
u
j,x
, u
j,y
, u
j,z
T
will be the trial solution
of the optimization algorithm, ix) ¯u
i
=
[
x
i
, y
i
, z
i
]
T
will be the positions of the reference nod es
{
A
i
}
N
A
i=1
, and x)
ˆ
d
j,i
will denote the estimated (via ranging measurements) di stance between
reference node
{
A
i
}
N
A
i=1
and blind node
U
j
N
U
j=1
. Moreover, for analytical simplicity, but with-
out loss of generality, we will present the optimization algorithms by assuming N
U
= 1 and
N
A
= 4.
5
At the receiver, synchronization can be done by using a correlation mechanism between the received
signal and a local signal (tem p late) Stiffler (1968) or a delayed version of the received signal itself (dif-
ferential receiver Alesii, Antonini, Di Renzo, Graziosi & Santucci (2004); Alesii, Di Renzo, Graziosi &
Santucci (2004))
Before going into the details of the novel ESD algorithm, let us also summarize some basic
localization methods with the aim to highlight the main advantages and superiority of the
proposed solution.
3.2 Triangulation Method
In this method, the position of node U
1
is obtained by inferring a geometric triangulation
among estimated and actual distances. Accordingly, the unknown position is obtained by
finding a solution that simultaneously solve the following set of equations:
(
x
1
− u
1,x
)
2
+
y
1
− u
1,y
2
+
(
z
1
− u
1,z
)
2
=
ˆ
d
2
1,1
(
x
2
− u
1,x
)
2
+
y
2
− u
1,y
2
+
(
z
2
− u
1,z
)
2
=
ˆ
d
2
1,2
(
x
3
− u
1,x
)
2
+
y
3
− u
1,y
2
+
(
z
3
− u
1,z
)
2
=
ˆ
d
2
1,3
(
x
4
− u
1,x
)
2
+
y
4
− u
1,y
2
+
(
z
4
− u
1,z
)
2
=
ˆ
d
2
1,4
(1)
This system of equations can be solved using a Least Squares solution, which yields ˆu
1
=
A
T
A
−1
A
T
b, where matrix A and vector b can be found in Savarese (2002). In general, tri-
angulation methods may fail to find a solution for the system in (1) when range and reference
position estimates are noisy. Multilateration methods are, in general, preferred in this case.
The triangulation method will be denoted as the INV method throughout the paper.
3.3 Multilateration Method
In this method, the position of node U
1
is obtained by minimizing the error cost function F
(
·
)
defined as follows:
F
(
u
1
)
=
N
A
∑
i=1
ˆ
d
1,i
−
u
1
− ¯u
i
2
(2)
such that ˆu
1
= arg min
u
1
{
F
(
u
1
)}
. The minimization of (2) can be done using a vari ety of nu-
merical optimization techniques, each one having its own advantages and disadvantages in
terms of accuracy, robustness, convergence speed, complexity, and storage requirements No-
cedal & Wright (2006). Note that as optimization methods are iterative by nature, we will
denote with index k the k–th iteration of the alg orithm and with F
(
u
1
(
k
))
and u
1
(
k
)
the error
cost function and the estimated p osition at the k–th iteration, respectively. The final estimated
position will be denoted by ˆu
1
= u
1
¯
k
, where
¯
k is such that:
F
u
1
¯
k
< Φ or
¯
k = MAX
iter
(3)
with Φ being the desired accuracy computed on the error function in (2) and MAX
iter
being
the maximum number of iterations allowed for the algorithm.
Basically, Equation (3) represents the stop criterion mentioned in Section 2.2; then both design
parameters Φ and MAX
iter
are application–dependent.
3.3.1 Classical Steepest Descent (SD)
The classical Steepest Descent (SD) is an iterative line search method which allows to find the
(local) minimum of the cost function in (2) at step k
+ 1 as follows (Nocedal & Wright, 2006,
pp. 22, sec. 2.2):
u
1
(
k + 1
)
=
u
1
(
k
)
+
α
k
p
(
k
)
(4)
Distributed Localization Algorithms for Wireless Sensor Networks:
From Design Methodology to Experimental Validation 169
a mathematical model of conversion. For example, if ranging measure is done by RSS,
the source would likely be an acquisition via ADC (Analog to Digital Converter) of the
incoming signal strength.
At this interface several other internal parameters can be considered, due to the complexity of
the transceiver design. Mos t of these p arameters are also handled by Resource Management
Service “which allows an Application or a Service to get or set the state of the physical ele-
ments of the hardware” Sgroi et al. (2003). Due to likely tight constraints on spatial resolution
for ranging measurements, wideband or Ultra Wide–Band are interesting opportunities for
signal design at the physical layer. If compared to other technologies for ranging, e.g., ultra-
sound Calamari Project (n.d .), UWB may provide highest resolution because it relies on very
short impulses and large bandwidth, and ranging can be somehow embedded in a synchro-
nization process with tuneable settings
5
.
However, in the present contribution we consider the RSS measurements at the PhyGetRange()
function (and in turn at the RDLGetRange() function), as it is nowadays a measure easily avail-
able on many commercial off–the–shelf sensor node platforms, such as the CrossBow’s MICAz
and the TI/Chipcon’s CC2431 ones, which are used in our experimental activities and mea-
surements. To be used in practice (see Section 5.1), RSS–based techniques need a calibration
phase to estimate the path loss low, a relation between the received signal power and the ac-
tual distance between the nodes (by assuming the transmit power is known and fixed). These
calibration issues will be analyzed in the present paper, as well as the impact of outdated
measurements on the system performance.
3. ESD: A Novel Localization Algorithm for WSNs
3.1 Notation
The aim of this section i s to introduce a novel localization algorithm for WSNs. To do so, let
us first introduce some basic notations use f ul for analytical formulation. By assuming an area
with N
A
,
{
A
i
}
N
A
i=1
, “startup anchors” and N
U
,
U
j
N
U
j=1
, blind nodes , the following notation
will be used throughout this chapter: i) bold sy mbols will be used to denote vectors and ma-
trices, ii)
(
·
)
T
will denote transpose operation, iii) ∇
(
·
)
will be the gradient, iv)
·
will be the
Euclidean d istance and
|
·
|
the absolute value, v) ∠
(
·
, ·
)
will be the phase angle between two
vectors, vi)
(
·
)
−1
will denote matrix inversion, vii) ˆu
j
=
ˆ
u
j,x
,
ˆ
u
j,y
,
ˆ
u
j,z
T
will denote the esti-
mated position of the blind node
U
j
N
U
j=1
, viii) u
j
=
u
j,x
, u
j,y
, u
j,z
T
will be the trial solution
of the optimization algorithm, ix) ¯u
i
=
[
x
i
, y
i
, z
i
]
T
will be the positions of the reference nod es
{
A
i
}
N
A
i=1
, and x)
ˆ
d
j,i
will denote the estimated (via ranging measurements) di stance between
reference node
{
A
i
}
N
A
i=1
and blind node
U
j
N
U
j=1
. Moreover, for analytical simplicity, but with-
out loss of generality, we will present the optimization algorithms by assuming N
U
= 1 and
N
A
= 4.
5
At the receiver, synchronization can be done by using a correlation mechanism between the received
signal and a local signal (template) Stiffler (1968) or a delayed version of the received signal itself (dif-
ferential receiver Alesii, Antonini, Di Renzo, Graziosi & Santucci (2004); Alesii, Di Renzo, Graziosi &
Santucci (2004))
Before going into the details of the novel ESD algorithm, let us also summarize some basic
localization methods with the aim to highlight the main advantages and superiority of the
proposed solution.
3.2 Triangulation Method
In this method, the position of node U
1
is obtained by inferring a geometric triangulation
among estimated and actual distances. Accordingly, the unknown position is obtained by
finding a solution that simultaneously solve the following set of equations:
(
x
1
− u
1,x
)
2
+
y
1
− u
1,y
2
+
(
z
1
− u
1,z
)
2
=
ˆ
d
2
1,1
(
x
2
− u
1,x
)
2
+
y
2
− u
1,y
2
+
(
z
2
− u
1,z
)
2
=
ˆ
d
2
1,2
(
x
3
− u
1,x
)
2
+
y
3
− u
1,y
2
+
(
z
3
− u
1,z
)
2
=
ˆ
d
2
1,3
(
x
4
− u
1,x
)
2
+
y
4
− u
1,y
2
+
(
z
4
− u
1,z
)
2
=
ˆ
d
2
1,4
(1)
This system of equations can be solved using a Least Squares solution, which yields ˆu
1
=
A
T
A
−1
A
T
b, where matrix A and vector b can be found in Savarese (2002). In general, tri-
angulation methods may fail to find a solution for the system in (1) when range and reference
position estimates are noisy. Multilateration methods are, in general, preferred in this case.
The triangulation method will be denoted as the INV method throughout the paper.
3.3 Multilateration Method
In this method, the position of node U
1
is obtained by minimizing the error cost function F
(
·
)
defined as follows:
F
(
u
1
)
=
N
A
∑
i=1
ˆ
d
1,i
−
u
1
− ¯u
i
2
(2)
such that ˆu
1
= arg min
u
1
{
F
(
u
1
)}
. The minimization of (2) can be done using a vari ety of nu-
merical optimization techniques, each one having its own advantages and disadvantages in
terms of accuracy, robustness, convergence speed, complexity, and storage requirements No-
cedal & Wright (2006). Note that as optimization methods are iterative by nature, we will
denote with index k the k–th iteration of the alg orithm and with F
(
u
1
(
k
))
and u
1
(
k
)
the error
cost function and the estimated p osition at the k–th iteration, respectively. The final estimated
position will be denoted by ˆu
1
= u
1
¯
k
, where
¯
k is such that:
F
u
1
¯
k
< Φ or
¯
k = MAX
iter
(3)
with Φ being the desired accuracy computed on the error function in (2) and MAX
iter
being
the maximum number of iterations allowed for the algorithm.
Basically, Equation (3) represents the stop criterion mentioned in Section 2.2; then both design
parameters Φ and MAX
iter
are application–dependent.
3.3.1 Classical Steepest Descent (SD)
The classical Steepest Descent (SD) is an iterative line search method which allows to find the
(local) minimum of the cost function in (2) at step k
+ 1 as follows (Nocedal & Wright, 2006,
pp. 22, sec. 2.2):
u
1
(
k + 1
)
=
u
1
(
k
)
+
α
k
p
(
k
)
(4)
Wireless Sensor Networks 170
where α
k
is a step length factor, which can be chosen as described in (Nocedal & Wright, 2006,
pp. 36, ch. 3) and p
(
k
)
= −∇
F
(
u
1
(
k
))
is the search direction of the algorithm.
In particular, when the optimization problem is linear, in the literature there exist some expres-
sions to compute the optimal step length to improve the convergence speed of the algorithm.
On the other hand, when the optimization problem is non–linear, as co nsidered in this co ntri-
bution, a fixed and small step value is in general preferred, in order to reduce the oscillatory
effect when the algorithm approaches the solution. In such a case, we have α
k
= 0.5µ, where
µ is the learning speed Santucci et al. (2006).
3.3.2 Enhanced Steepest Descent (ESD)
The SD method provides, in g eneral, a good accuracy in estimating the final solution. How-
ever, it may require a large number of iterations, which may result in a too slow convergence
speed, especially for mobile ad–hoc wireless networks. In order to improve such convergence
speed, we propose in this contribution an enhanced version of it, which we call Enhanced
Steepest Descent (E SD) .
The basic idea behind the ESD algorithm is to continuously adjust the step length value α
k
as
a function of the current and previous search directions p
(
k
)
and p
(
k − 1
)
, respectively. In
particular, α
k
is adjusted as follows:
α
k
= α
k−1
+ γ if θ
k
< θ
min
α
k
= α
k−1
δ if θ
k
> θ
max
α
k
= α
k−1
otherwise
(5)
where θ
k
= ∠
(
p
(
k
)
, p
(
k − 1
))
, 0 < γ < 1 is a linear increment factor, δ > 1 is a multiplicative
decrement factor, and θ
min
and θ
max
are two angular threshold values that control the step
length update.
By using the f our degrees of freedom γ, δ, θ
min
and θ
max
, we can simultaneously control
the convergence rate of the algorithm and the oscillatory phenomenon when approaching
the final solution in a simple way, and without appreciably increasing the complexity of the
algorithm when compared to the classical SD method. Basically, the main advantage of the
ESD algorithm is the adaptive optimization of the step length factor α
k
at run time, which
allows to dynamically either accelerate or deceler ate the convergence speed of the algorithm
as a function of the actual value of the function to be optimized. In the next sections we will
show the performance improvement introduced by this algorithm.
4. Proof–of–Concept via Computer–based Simulations
In the frame of PBD approach, performance evaluation is a fundamental concern in the map-
ping process between functional description and implementation and it is intended to verify that
a solution actually belongs to the design space defined by the platf orm, so that higher layer
functional requirements can be met Sgroi et al. (2000). Due to the complexity of network
scenario and the need of modeling various components, we have developed a flexible node
model. We can test algorithms with a full view of the network while abstracting lower proto-
col layer (e.g. datalink) details. Furthermore, with the same framework, we can test specific
node’s behavior by restricting the attention to a reduced number of nodes.
4.1 Atomic Localization
In this section, we will descri be some MATLAB simulation results with the aim to asse ss the
performance of the proposed E SD algorithm in several operating conditions and compare its
performance with other localization algorithms.
4.1.1 System Setup
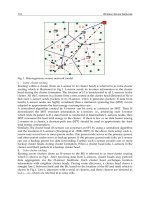
The scenario depicted in Fig. 3, is used to have a common reference environment to analyze
the improvement provided by the proposed ESD algorithm, and compare several optimiza-
tion algorithms. For this setup, we assume that the anchor nodes are all “startup anchors”,
which allows to investigate the so–called atomic location discovery problem, i.e., only Phase 1
described in Section 2.2.1 is implicitly considered in this system setup.
Fig. 3. Reference scenario and network topology (atomic localization step/phase).
In Fig. 3, we have three “startup” anchor nodes A
1
, A
2
, A
3
, a non–complanar “startup” an-
chor node A
4
, and a blind node U
1
, which may be located in one of the positions T
h
, with
h
= 1, 2, . . . , 9. In order to analyze the impact of the network geometry/topology on the
performance of the optimization algorithms, we have introduced a parameter similar to the
so–called geometric dilution of precision factor Savvides et al. (2001). In particular, in every T
h
position the unknown node sees the reference nodes with an increasing angle when moving
from T
1
to T
9
: this corresponds to moving from a scenario (T
1
) with a bad geometry where
ambiguities may arise during position estimation, towards a scenario (T
9
) where the unknown
node is surrounded by reference nodes, thus giving an ideally optimal network topology for
position estimation, regardless of the specific algorithm Wang & Xiao (2007).
The main parameters used to obtain simulation results are as follows: i) ¯u
1
=
[
0, 0, 0
]
T
m,
¯u
2
=
[
6, 0, 0
]
T
m, ¯u
3
=
[
3, 6, 0
]
T
m, and ¯u
4
=
[
3, 3, 1
]
T
m; ii) the blind node may occupy 9
positions, e.g., u
1
=
[
40, 4, 0
]
T
m in T
1
(9
◦
) and u
1
=
[
3, 4, 0
]
T
m in T
9
(216
◦
); iii ) the ranging
error will be modeled as a Gaussian random variable with mean value given by the actual
distance between reference and blind nodes and a fixed standard d eviation denoted by σ
R
,
which is supposed to be indipendent from the actual distance; iv) the position error statistics
are obtained by averaging over 2500 realizations of the ranging error for every position of
the blind node; v) in order to analyze the effect of both the initial g uess and the network
topology on the optimization algorithm, 36 starting points uniformly distributed on a circle
on the plane z
= 0 centered at
[
0, 0, 0
]
T
and with radius 50m are considered; vi) the max imum
number of iterations for each algorithm is MAX
iter
= 5000; vii) the tolerance on the minimum
of the error function is Φ
= 0.05; viii) the initial learning speed for SD and ESD is µ = 0.1;
and ix) the degrees of freedom for the ESD algorithm are: γ
= 0.1, δ = 1.75, θ
min
= 5
◦
and
θ
max
= 30
◦
.
Distributed Localization Algorithms for Wireless Sensor Networks:
From Design Methodology to Experimental Validation 171
where α
k
is a step length factor, which can be chosen as described in (Nocedal & Wright, 2006,
pp. 36, ch. 3) and p
(
k
)
= −∇
F
(
u
1
(
k
))
is the search direction of the algorithm.
In particular, when the optimization problem is linear, in the literature there exist some expres-
sions to compute the optimal step length to improve the convergence speed of the algorithm.
On the other hand, when the optimization problem is non–linear, as co nsidered in this co ntri-
bution, a fixed and small step value is in general preferred, in order to reduce the oscillatory
effect when the algorithm approaches the solution. In such a case, we have α
k
= 0.5µ, where
µ is the learning speed Santucci et al. (2006).
3.3.2 Enhanced Steepest Descent (ESD)
The SD method provides, in g eneral, a good accuracy in estimating the final solution. How-
ever, it may require a large number of iterations, which may result in a too slow convergence
speed, especially for mobile ad–hoc wireless networks. In order to improve such convergence
speed, we propose in this contribution an enhanced version of it, which we call Enhanced
Steepest Descent (E SD) .
The basic idea behind the ESD algorithm is to continuously adjust the step length value α
k
as
a function of the current and previous search directions p
(
k
)
and p
(
k − 1
)
, respectively. In
particular, α
k
is adjusted as follows:
α
k
= α
k−1
+ γ if θ
k
< θ
min
α
k
= α
k−1
δ if θ
k
> θ
max
α
k
= α
k−1
otherwise
(5)
where θ
k
= ∠
(
p
(
k
)
, p
(
k − 1
))
, 0 < γ < 1 is a linear increment factor, δ > 1 is a multiplicative
decrement factor, and θ
min
and θ
max
are two angular threshold values that control the step
length update.
By using the f our degrees of freedom γ, δ, θ
min
and θ
max
, we can simultaneously control
the convergence rate of the algorithm and the oscillatory phenomenon when approaching
the final solution in a simple way, and without appreciably increasing the complexity of the
algorithm when compared to the classical SD method. Basically, the main advantage of the
ESD algorithm is the adaptive optimization of the step length factor α
k
at run time, which
allows to dynamically either accelerate or deceler ate the convergence speed of the algorithm
as a function of the actual value of the function to be optimized. In the next sections we will
show the performance improvement introduced by this algorithm.
4. Proof–of–Concept via Computer–based Simulations
In the frame of PBD approach, performance evaluation is a fundamental concern in the map-
ping process between functional description and implementation and it is intended to verify that
a solution actually belongs to the design space defined by the platf orm, so that higher layer
functional requirements can be met Sgroi et al. (2000). Due to the complexity of network
scenario and the need of modeling various components, we have developed a flexible node
model. We can test algorithms with a full view of the network while abstracting lower proto-
col layer (e.g. datalink) details. Furthermore, with the same framework, we can test specific
node’s behavior by restricting the attention to a reduced number of nodes.
4.1 Atomic Localization
In this section, we will descri be some MATLAB simulation results with the aim to asse ss the
performance of the proposed E SD algorithm in several operating conditions and compare its
performance with other localization alg orithms.
4.1.1 System Setup
The scenario depicted in Fig. 3, is used to have a common reference environment to analyze
the improvement provided by the proposed ESD algorithm, and compare several optimiza-
tion algorithms. For this setup, we assume that the anchor nodes are all “startup anchors”,
which allows to investigate the so–called atomic location discovery problem, i.e., only Phase 1
described in Section 2.2.1 is implicitly considered in this system setup.
Fig. 3. Reference scenario and network topology (atomic localization step/phase).
In Fig. 3, we have three “startup” anchor nodes A
1
, A
2
, A
3
, a non–complanar “startup” an-
chor node A
4
, and a blind node U
1
, which may be located in one of the positions T
h
, with
h
= 1, 2, . . . , 9. In order to analyze the impact of the network geometry/topology on the
performance of the optimization algorithms, we have introduced a parameter similar to the
so–called geometric dilution of precision factor Savvides et al. (2001). In particular, in every T
h
position the unknown node sees the reference nodes with an increasing angle when moving
from T
1
to T
9
: this corresponds to moving from a scenario (T
1
) with a bad geometry where
ambiguities may arise during position estimation, towards a scenario (T
9
) where the unknown
node is surrounded by reference nodes, thus giving an ideally optimal network topology for
position estimation, regardless of the specific algorithm Wang & Xiao (2007).
The main parameters used to obtain simulation results are as follows: i) ¯u
1
=
[
0, 0, 0
]
T
m,
¯u
2
=
[
6, 0, 0
]
T
m, ¯u
3
=
[
3, 6, 0
]
T
m, and ¯u
4
=
[
3, 3, 1
]
T
m; ii) the blind node may occupy 9
positions, e.g., u
1
=
[
40, 4, 0
]
T
m in T
1
(9
◦
) and u
1
=
[
3, 4, 0
]
T
m in T
9
(216
◦
); iii ) the ranging
error will be modeled as a Gaussian random variable with mean value given by the actual
distance between reference and blind nodes and a fixed standard d eviation denoted by σ
R
,
which is supposed to be indipendent from the actual distance; iv) the position error statistics
are obtained by averaging over 2500 realizations of the ranging error for every position of
the blind node; v) in order to analyze the effect of both the initial g uess and the network
topology on the optimization algorithm, 36 starting points uniformly distributed on a circle
on the plane z
= 0 centered at
[
0, 0, 0
]
T
and with radius 50m are considered; vi) the max imum
number of iterations for each algorithm is MAX
iter
= 5000; vii) the tolerance on the minimum
of the error function is Φ
= 0.05; viii) the initial learning speed for SD and ESD is µ = 0.1;
and ix) the degrees of freedom for the ESD algorithm are: γ
= 0.1, δ = 1.75, θ
min
= 5
◦
and
θ
max
= 30
◦
.
Wireless Sensor Networks 172
Algorithm Comp. Time (s) Mean Error (m) Std. Error (m)
CG
1
0.0253 (T
1
)
0.0090 (T
5
)
0.0060 (T
9
)
7.47 (T
1
)
1.93 (T
5
)
1.21 (T
9
)
6.28 (T
1
)
1.17 (T
5
)
0.56 (T
9
)
CG
2
0.0255 (T
1
)
0.0090 (T
5
)
0.0058 (T
9
)
7.44 (T
1
)
1.93 (T
5
)
1.21 (T
9
)
6.23 (T
1
)
1.18 (T
5
)
0.56 (T
9
)
SD
0.2206 (T
1
)
0.0264 (T
5
)
0.0115 (T
9
)
6.65 (T
1
)
1.93 (T
5
)
1.26 (T
9
)
4.14 (T
1
)
1.07 (T
5
)
0.61 (T
9
)
ESD
0.0793 (T
1
)
0.0096 (T
5
)
0.0058 (T
9
)
6.79 (T
1
)
1.93 (T
5
)
1.23 (T
9
)
4.12 (T
1
)
1.06 (T
5
)
0.59 (T
9
)
NLS
0.2615 (T
1
)
0.0363 (T
5
)
0.0202 (T
9
)
6.72 (T
1
)
1.92 (T
5
)
1.23 (T
9
)
4.12 (T
1
)
1.03 (T
5
)
0.58 (T
9
)
INV
0.0001 (T
1
)
0.0001 (T
5
)
0.0001 (T
9
)
15.67 (T
1
)
3.50 (T
5
)
2.26 (T
9
)
9.96 (T
1
)
2.19 (T
5
)
1.36 (T
9
)
Table 1. Comparison of optimization algorithms (CG
1
and CG
2
are the Fletcher–Reeves Polak–
Ribière and Hestenes–Stiefel algorithms with secant method Tennina et al. (n.d.).
4.1.2 Numerical Results
In Table 1 we have reported a performance comparison of the optimization algorithms de-
scribed in Section 3 in terms of computational time, mean and standard de viation of the posi-
tioning error. We observe that: i) the positioning error increases when moving the blind node
from T
1
to T
9
due to network topology, as expected, ii) the triangulation algorithm (I NV) pro-
vides the worst performance in terms of error accuracy, iii) the ESD algorithm provides the
same accuracy as the SD and NLS
6
algorithms, but reaches the final solution faster (this is an
important result fo r, e.g., mobile networks), iv) the ESD performs as well as the CG
7
algo-
rithms in most scenarios, but outperforms them in those network topologies that are prone to
ambiguities (e.g., when the blind node is l ocated in T
1
–T
4
positions).
Fig. 4 shows the p erformance of all simulated algorithms with respect to the Cramer–Rao
Lower Bound ( CR LB) as defined in Dulman et al. (2008). The results are related to a blind
node located in position T
4
in Fig. 3, and the horizontal axis shows the starting position used
to initialize every algorithm (i.e, initial guess point), which is an impo rtant parameter to be
6
Non Linear Least Square Tennina et al. (n.d.). This is a sophisticated but quite complex solution, because
matrix factorization and Hessian computation are required.
7
Non–Linear Conjugate Gradient Tennina et al. (n.d.). These methods have been used extensively to
solve non–linear optimization problems as they do not require matrix storage and need, in general, a
smaller number of iterations than SD method.
investigated to analyze the robustness of every optimization algorithm. The results show
that: i) the I NV algorithm provides, on the average, the worst performance, which is also
independent from the actual initialization point of the algorithm, ii) CG algorithms are very
sensitive to the initial guess point, and i n some scenarios the algorithm may fail to converge
to the true position of the blind node (our experimental trials show that CG algorithms fail to
converge when the initial guess is mirrored by 180
◦
with respect to the true node’s position),
and iii) SD, ESD and NLS algorithms see m to perform globally better than the other ones, and
have similar performance. Moreover, these latter algorithms provide results very close to the
CRLB.
0 20 40 60 80 100 120 140 160 180 200 220 240 260 280 300 320335 350
0
1
2
3
4
5
6
Initial Guess Point [deg]
Standard Deviation of Positioning Error [m]
CramerRao
CG
NR−FR
CG
NR−PR
CG
NR−PR+
CG
NR−FR−PR
CG
NR−HS
CG
NR−DY
CG
NR−HZ
CG
SEC−FR
CG
SEC−PR
CG
SEC−PR+
CG
SEC−FR−PR
CG
SEC−HS
CG
SEC−DY
CG
SEC−HZ
SD
ESD
NLS
INV
Fig. 4. Performance of the optimization algorithms with respect to the CRLB, and as a function
of the initial guess point. The blind node is in position T
4
of Fig. 3.
4.2 Network–wide Localization
In this section we extend the results obtained at the atomic level to a network composed by
several blind nodes to evaluate the performance of our proposed ESD algorithm, i.e. consid-
ering all the phases described in Section 2.2.1.
4.2.1 System Setup and Numerical Results
Accordingly, moving from the architectural view of the nodes already presented in Sgroi et al.
(2003), we developed a node model as shown in Fig. 5, where at the application interface a set
of services for implementing e.g. several kinds of control algorithms over WSNs are exposed.
By focusing on the Network Platform, i.e. the blocks under such application interface, the
introduction of a vertical module should be noted. The vertical nature of this data structure
Distributed Localization Algorithms for Wireless Sensor Networks:
From Design Methodology to Experimental Validation 173
Algorithm Comp. Time (s) Mean Error (m) Std. Error (m)
CG
1
0.0253 (T
1
)
0.0090 (T
5
)
0.0060 (T
9
)
7.47 (T
1
)
1.93 (T
5
)
1.21 (T
9
)
6.28 (T
1
)
1.17 (T
5
)
0.56 (T
9
)
CG
2
0.0255 (T
1
)
0.0090 (T
5
)
0.0058 (T
9
)
7.44 (T
1
)
1.93 (T
5
)
1.21 (T
9
)
6.23 (T
1
)
1.18 (T
5
)
0.56 (T
9
)
SD
0.2206
(T
1
)
0.0264 (T
5
)
0.0115 (T
9
)
6.65 (T
1
)
1.93 (T
5
)
1.26 (T
9
)
4.14 (T
1
)
1.07 (T
5
)
0.61 (T
9
)
ESD
0.0793
(T
1
)
0.0096 (T
5
)
0.0058 (T
9
)
6.79 (T
1
)
1.93 (T
5
)
1.23 (T
9
)
4.12 (T
1
)
1.06 (T
5
)
0.59 (T
9
)
NLS
0.2615
(T
1
)
0.0363 (T
5
)
0.0202 (T
9
)
6.72 (T
1
)
1.92 (T
5
)
1.23 (T
9
)
4.12 (T
1
)
1.03 (T
5
)
0.58 (T
9
)
INV
0.0001
(T
1
)
0.0001 (T
5
)
0.0001 (T
9
)
15.67 (T
1
)
3.50 (T
5
)
2.26 (T
9
)
9.96 (T
1
)
2.19 (T
5
)
1.36 (T
9
)
Table 1. Comparison of optimization algorithms (CG
1
and CG
2
are the Fletcher–Reeves Polak–
Ribière and Hestenes–Stiefel algorithms with secant method Tennina et al. (n.d.).
4.1.2 Numerical Results
In Table 1 we have reported a performance comparison of the optimization algorithms de-
scribed in Section 3 in terms of computational time, mean and standard de viation of the posi-
tioning error. We observe that: i) the positioning error increases when moving the blind node
from T
1
to T
9
due to network topology, as expected, ii) the triangulation algorithm (I NV) pro-
vides the worst performance in terms of error accuracy, iii) the ESD algorithm provides the
same accuracy as the SD and NLS
6
algorithms, but reaches the final solution faster (this is an
important result fo r, e.g., mobile networks), iv) the ESD performs as well as the CG
7
algo-
rithms in most scenarios, but outperforms them in those network topologies that are prone to
ambiguities (e.g., when the blind node is located in T
1
–T
4
positions).
Fig. 4 shows the p erformance of all simulated algorithms with respect to the Cramer–Rao
Lower Bound ( CR LB) as defined in Dulman et al. (2008). The results are related to a blind
node located in position T
4
in Fig. 3, and the horizontal axis shows the starting position used
to initialize every algorithm (i.e, initial guess point), which is an impo rtant parameter to be
6
Non Linear Least Square Tennina et al. (n.d.). This is a sophisticated but quite complex solution, because
matrix factorization and Hessian computation are required.
7
Non–Linear Conjugate Gradient Tennina et al. (n.d.). These methods have been used extensively to
solve non–linear optimization problems as they do not require matrix storage and need, in general, a
smaller number of iterations than SD method.
investigated to analyze the robustness of every optimization algorithm. T he results show
that: i) the I NV algorithm provides, on the average, the worst performance, which is also
independent from the actual initialization point of the algorithm, ii) CG algorithms are very
sensitive to the initial guess point, and i n some scenarios the algorithm may fail to converge
to the true position of the blind node (our experimental trials show that CG algorithms fail to
converge when the initial guess is mirrored by 180
◦
with respect to the true node’s position),
and iii) SD, ESD and NLS algorithms seem to perform globally better than the other ones, and
have similar performance. Moreover, these latter algorithms provide results very close to the
CRLB.
0 20 40 60 80 100 120 140 160 180 200 220 240 260 280 300 320335 350
0
1
2
3
4
5
6
Initial Guess Point [deg]
Standard Deviation of Positioning Error [m]
CramerRao
CG
NR−FR
CG
NR−PR
CG
NR−PR+
CG
NR−FR−PR
CG
NR−HS
CG
NR−DY
CG
NR−HZ
CG
SEC−FR
CG
SEC−PR
CG
SEC−PR+
CG
SEC−FR−PR
CG
SEC−HS
CG
SEC−DY
CG
SEC−HZ
SD
ESD
NLS
INV
Fig. 4. Performance of the optimization algorithms with respect to the CRLB, and as a function
of the initial guess point. The blind node is in position T
4
of Fig. 3.
4.2 Network–wide Localization
In this section we extend the results obtained at the atomic level to a network composed by
several blind nodes to evaluate the performance of our proposed ESD algorithm, i.e. consid-
ering all the phases described in Section 2.2.1.
4.2.1 System Setup and Numerical Results
Accordingly, moving from the architectural view of the nodes already presented in Sgroi et al.
(2003), we developed a node model as shown in Fig. 5, where at the application interface a set
of services for implementing e.g. several kinds of control algorithms over WSNs are exposed.
By focusing on the Network Platform, i.e. the blocks under such application interface, the
introduction of a vertical module should be noted. The vertical nature of this data structure
Wireless Sensor Networks 174
is specifically intended to let all layers may have access to the information stored within (e.g.
distance, position estimation and residual energy o f batteries for each neighbor). This struc-
ture is intended to be shared also in the simulation code, since various layers use a pointer
for access. Performance evaluation at network level has been carried out by resorting to the
Discrete Event Simulator OMNeT++ Varga (n.d.), in which the node model shown in Fig . 5
has been i mp lemented.
Fig. 5. Reference node architecture Santucci et al. (2006).
As an example, numerical results have been obtained in a networ k scenario with 100 nodes
randomly (uniform distri bution) deployed over a squared area with side length equals to
30m. Five anchors are randomly placed alo ng the perimeter of the network area and have a
transmission range equal to 9m, as large as those exhibited by normal sensor nodes. Moreover,
the error on each distance measurement is modelled as a truncated (between
−3σ and 3σ)
zero–mean Gaussian random variable, with standard deviation σ
= 0.15m. Nodes implement
also the CSMA–CA algorithm whose primitives have been briefly depicted in Section 2.3.
While previous results showed that the proposed algorithm outperforms in many cases the
solutions existent, in Fig. 6 we show that it allows effectively nodes to obtain good final posi-
tion estimation. As a matter of fact, 83% of nodes has a final position estimation error less than
transmission range and 99% of nodes estimate their positio n with an error less than twice of
transmission r ange. Note that the density of nodes in this simulated scenario compensates for
the low number of anchors in the network.
Fig. 6. Cumulative distribution of position error (x –axis scale is normalized to the nodes’ radio
range). 83% of nodes have a position error equal or less than transmission range, while 99%
have a position error equal or less than twice of transmission range.
5. Proof–of–Concept via Experi mental Tesbeds
In order to assess both implementation issues and performance of the proposed ESD algo-
rithm via experiments besi des computer simulations, we have imp lemented a testbed plat-
form by using both CrossBow’s MICAz (see Cro (2008)) and Texas Instruments/Chipcon
CC2431 (see Tex (2007)) sensor nodes.
5.1 Ranging Model
Both sensor nodes platforms use a RSS–based ranging method, and requires a (known) RSS–
to–distance calibration curve to estimate the distance between pairs of nodes from a RSS mea-
surement Cro (2008), as follows:
d
= 10
[
RSS − A
10n
]
(6)
where d denotes the transmitter–to–receiver distance, n is the propagation path–loss expo-
nent, A represents the RSS value measured by a receiver that is located 1m away from the
transmitter (i.e., reference distance), and RSS is the actual measured value.
In order to estimate this calibration curve, we use the standard procedure described
in Aamodt (2008), which consists in deploying a grid of nodes in the area of interest and
extracting the desired parameters by post–processing the gathered data. Accordingly, a 6m
× 10m gri d of sensor nodes has been deployed in the NCSlab, as shown in Fig. 7. The sen-
sors located in the g round floor are receiver nodes, while transmitter node s are deployed at
the edge of the measurement area, thus yielding a minimum and maximum transmitter–to–
receiver distance of 0.5m and 11.7m, respectively. Moreover, the transmitters can be located at
different heights with respect to the ground floor (ranging from 5cm to 1.2m). To estimate the
calibration curve, the transmitters broadcast packets in a time–scheduled fashion such that
collisions are avoided, and the receivers co llect RSS values for each received packet, and then
send a report to the host PC.
Distributed Localization Algorithms for Wireless Sensor Networks:
From Design Methodology to Experimental Validation 175
is specifically intended to let all layers may have access to the information stored within (e.g.
distance, position estimation and residual energy o f batteries for each neighbor). This struc-
ture is intended to be shared also in the simulation code, since various layers use a pointer
for access. Performance evaluation at network level has been carried out by resorting to the
Discrete Event Simulator OMNeT++ Varga (n.d.), in which the node model shown in Fig . 5
has been i mp lemented.
Fig. 5. Reference node architecture Santucci et al. (2006).
As an example, numerical results have been obtained in a networ k scenario with 100 nodes
randomly (uniform distri bution) deployed over a squared area with side length equals to
30m. Five anchors are randomly placed alo ng the perimeter of the network area and have a
transmission range equal to 9m, as large as those exhibited by normal sensor nodes. Moreover,
the error on each distance measurement is modelled as a truncated (between
−3σ and 3σ)
zero–mean Gaussian random variable, with standard deviation σ
= 0.15m. Nodes implement
also the CSMA–CA algorithm whose primitives have been briefly depicted in Section 2.3.
While previous results showed that the proposed algorithm outperforms in many cases the
solutions existent, in Fig. 6 we show that it allows effectively nodes to obtain good final posi-
tion estimation. As a matter of fact, 83% of nodes has a final position estimation error less than
transmission range and 99% of nodes estimate their positio n with an error less than twice of
transmission r ange. Note that the density of nodes in this simulated scenario compensates for
the low number of anchors in the network.
Fig. 6. Cumulative distribution of position error (x –axis scale is normalized to the nodes’ radio
range). 83% of nodes have a position error equal or less than transmission range, while 99%
have a position error equal or less than twice of transmission range.
5. Proof–of–Concept via Experi mental Tesbeds
In order to assess both implementation issues and performance of the proposed ESD algo-
rithm via experiments besi des computer simulations, we have imp lemented a testbed plat-
form by using both CrossBow’s MICAz (see Cro (2008)) and Texas Instruments/Chipcon
CC2431 (see Tex (2007)) sensor nodes.
5.1 Ranging Model
Both sensor nodes platforms use a RSS–based ranging method, and requires a (known) RSS–
to–distance calibration curve to estimate the distance between pairs of nodes from a RSS mea-
surement Cro (2008), as follows:
d
= 10
[
RSS − A
10n
]
(6)
where d denotes the transmitter–to–receiver distance, n is the propagation path–loss expo-
nent, A represents the RSS value measured by a receiver that is located 1m away from the
transmitter (i.e., reference distance), and RSS is the actual measured value.
In order to estimate this calibration curve, we use the standard procedure described
in Aamodt (2008), which consists in deploying a grid of nodes in the area of interest and
extracting the desired parameters by post–processing the gathered data. Accordingly, a 6m
× 10m gri d of sensor nodes has been deployed in the NCSlab, as shown in Fig. 7. The sen-
sors located in the g round floor are receiver nodes, while transmitter node s are deployed at
the edge of the measurement area, thus yielding a minimum and maximum transmitter–to–
receiver distance of 0.5m and 11.7m, respectively. Moreover, the transmitters can be located at
different heights with respect to the ground floor (ranging from 5cm to 1.2m). To estimate the
calibration curve, the transmitters broadcast packets in a time–scheduled fashion such that
collisions are avoided, and the receivers co llect RSS values for each received packet, and then
send a report to the host PC.
Wireless Sensor Networks 176
Fig. 7. Deployed testbed usi ng CrossBow’s MICAz sensor nodes for ranging calibration.
The RSS–to–distance reference curve in Equation (6) is obtained via a least–squares best linear
fitting from se veral collected RSS values (every receiver node measures RSS values during
a 5 minutes acquisition window, resulting in approxi mately 2000 RSS values). The obtained
result is shown in Fig. 8 along with real measurements. Note that, in Fig. 8: i ) the RSS values
are represented as absolute values in arbitrary units, as provided by the receiver nodes, ii) the
distance d in the horizontal axis is normalized to the reference d istance of d
0
= 1m, and iii) the
computed fitting p ar ameters are A
= 59.66 and n = 1.84. Note that a path–loss exponent
smaller than free space propagation is obtained (i.e., n
< 2), which is probably due to the
fact that the receiver nodes are located very close to ground floor, which provides a strong
constructive reflected propagation path in addition to the direct one.
5.2 System Setup MICAz
In order to analyze implementation i ssues of the ESD algorithm, and validate si mulative re-
sults of atomic localization with experimental activities, we have deployed CrossBow’s MI-
CAz sensor nodes with a similar setup as the one s hown in Fig. 3. The testbed has been
deployed in an empty conference room of our NCSlab.
The main parameters used in this testbed setup are as follows: i) the reference nodes’ positions
are ¯u
1
=
[
2, 1, 0
]
T
m, ¯u
2
=
[
2, 3, 0
]
T
m, ¯u
3
=
[
4, 2, 0
]
T
m, and ¯u
4
=
[
3, 2, 0.5
]
T
m; ii) similar
to Fig. 3, the blind node may occupy 16 positions, e.g., u
1
=
[
3, 10, 0
]
T
m in T
1
and u
1
=
[
3, 2.5, 0
]
T
m in T
16
; iii) the statistics (e.g., mean value) of the positioning error are obtained by
averaging over 40 independent runs (i.e., acquisitio ns) of the algorithm for each blind node;
and iv) the maximum number of iterations for the ESD algorithm is 250. Finally, the ranging
error is obtained from RSS measurements as described in Section 5.1. In order to compare
experiments and simulations in a fair way, computer–based analysis having at the input the
−4 −2 0 2 4 6 8 10 12
40
50
60
70
80
90
100
RSS = 1.8479(10log
10
(d/d
0
)) + 59.6666
10log
10
(d/d0)
RSS [a. u.]
Linear Fitting path loss model
Testbed
Linear Fitting
Fig. 8. RSS–to–distance ranging model.
ranging model derived in Section 5.1, and consideri ng real RSS captures from each blind node
have been simulated as well.
5.3 Results MICAz
In Fig. 9 we have reported the mean value of the positioning error with respect to the an-
gle under which the unknown node sees the reference nodes (i.e., this curve is obtained by
averaging over the 40 acquisitions), along with its standard deviation. Super imposed to the
experimental results, we have also reported those obtained via computer–based simulations
using the same experimental ranging model obtained in Section 5.1, and having at the in-
put the real experimental captures taken with the testbed. The perfect overlap between the
two curves s ubstantiates the correct implementation of the ESD algorithm on the CrossBow’s
MICAz testbed platform using the NesC programming language Gay et al. (2003). This is an
important result to use the testbed for further analysis aiming at quantifying, via experimental
activities, other important performance indexes, such as power consumptions and complexity,
as well as at judging the overall performance of the ESD algorithm.
5.4 System Setup CC2431
In order to try to overcome the issues related to the off–line RSS–to–distance ranging model
calibration, we have deployed a second testbed in the NCSlab using TI/Chipcon’s CC2431
sensor nodes. The goal of this study is to analyze the impact of an erroneous or outdated es-
timate of the propagation–dependent parameters, propose novel solutions to counteract this
problem, and understand if the proposed ESD algorithm can be efficiently used to further re-
fine the position estimation provided by the location–finder engine, available on T I/Chipcon’s
CC2431 sensor nodes, in a scenario with dynamic changes of the propagation conditions. To
do so, and have a sound understanding of the performance of the ESD algorithm in a more
Distributed Localization Algorithms for Wireless Sensor Networks:
From Design Methodology to Experimental Validation 177
Fig. 7. Deployed testbed usi ng CrossBow’s MICAz sensor nodes for ranging calibration.
The RSS–to–distance reference curve in Equation (6) is obtained via a least–squares best linear
fitting from se veral collected RSS values (every receiver node measures RSS values during
a 5 minutes acquisition window, resulting in approxi mately 2000 RSS values). The obtained
result is shown in Fig. 8 along with real measurements. Note that, in Fig. 8: i ) the RSS values
are represented as absolute values in arbitrary units, as provided by the receiver nodes, ii) the
distance d in the horizontal axis is normalized to the reference d istance of d
0
= 1m, and iii) the
computed fitting p ar ameters are A
= 59.66 and n = 1.84. Note that a path–loss exponent
smaller than free space propagation is obtained (i.e., n
< 2), which is probably due to the
fact that the receiver nodes are located very close to ground floor, which provides a strong
constructive reflected propagation path in addition to the direct one.
5.2 System Setup MICAz
In order to analyze implementation i ssues of the ESD algorithm, and validate si mulative re-
sults of atomic localization with experimental activities, we have deployed CrossBow’s MI-
CAz sensor nodes with a similar setup as the one s hown in Fig. 3. The testbed has been
deployed in an empty conference room of our NCSlab.
The main parameters used in this testbed setup are as follows: i) the reference nodes’ positions
are ¯u
1
=
[
2, 1, 0
]
T
m, ¯u
2
=
[
2, 3, 0
]
T
m, ¯u
3
=
[
4, 2, 0
]
T
m, and ¯u
4
=
[
3, 2, 0.5
]
T
m; ii) similar
to Fig. 3, the blind node may occupy 16 positions, e.g., u
1
=
[
3, 10, 0
]
T
m in T
1
and u
1
=
[
3, 2.5, 0
]
T
m in T
16
; iii) the statistics (e.g., mean value) of the positioning error are obtained by
averaging over 40 independent runs (i.e., acquisitio ns) of the algorithm for each blind node;
and iv) the maximum number of iterations for the ESD algorithm is 250. Finally, the ranging
error is obtained from RSS measurements as described in Section 5.1. In order to compare
experiments and simulations in a fair way, computer–based analysis having at the input the
−4 −2 0 2 4 6 8 10 12
40
50
60
70
80
90
100
RSS = 1.8479(10log
10
(d/d
0
)) + 59.6666
10log
10
(d/d0)
RSS [a. u.]
Linear Fitting path loss model
Testbed
Linear Fitting
Fig. 8. RSS–to–distance ranging model.
ranging model derived in Section 5.1, and consideri ng real RSS captures from each blind node
have been simulated as well.
5.3 Results MICAz
In Fig. 9 we have reported the mean value of the positioning error with respect to the an-
gle under which the unknown node sees the reference nodes (i.e., this curve is obtained by
averaging over the 40 acquisitions), along with its standard deviation. Super imposed to the
experimental results, we have also reported those obtained via computer–based simulations
using the same experimental ranging model obtained in Section 5.1, and having at the in-
put the real experimental captures taken with the testbed. The perfect overlap between the
two curves s ubstantiates the correct implementation of the ESD algorithm on the CrossBow’s
MICAz testbed platform using the NesC programming language Gay et al. (2003). This is an
important result to use the testbed for further analysis aiming at quantifying, via experimental
activities, other important performance indexes, such as power consumptions and complexity,
as well as at judging the overall performance of the ESD algorithm.
5.4 System Setup CC2431
In order to try to overcome the issues related to the off–line RSS–to–distance ranging model
calibration, we have deployed a second testbed in the NCSlab using TI/Chipcon’s CC2431
sensor nodes. The goal of this study is to analyze the impact of an erroneous or outdated es-
timate of the propagation–dependent parameters, propose novel solutions to counteract this
problem, and understand if the proposed ESD algorithm can be efficiently used to further re-
fine the position estimation provided by the location–finder engine, available on T I/Chipcon’s
CC2431 sensor nodes, in a scenario with dynamic changes of the propagation conditions. To
do so, and have a sound understanding of the performance of the ESD algorithm in a more
Wireless Sensor Networks 178
15 21 28 45 55 97 135 180
0
2
4
6
8
10
12
14
16
18
Positioning Error [m]
Angle [deg]
TestBed
Simulation
Fig. 9. Mean value and standard deviation of the positioning er ror: comparison between
simulation and experimentation.
realistic scenario than the one analyzed in Section 5.2, we have conducted a campaign of mea-
surements during the o p ening ceremony day of the NCSlab on March 27, 2008. The event was
characterized by a half–day kick–off conference during which the past, present, and future
activities of the laboratory were presented. The ki ck–off conference was attended by several
people, and yi elded a good occasion to test the performance of the deployed WSN, and, in
particular, to test the achievable performance of the TI/Chipcon’s CC2431 location engine in a
realistic GPS–denied environment, where the propagation characteristics of the radio channel
changed appreciably during the event due to the people’s movement inside the room (i.e.,
dynamic indoor environment). The duration of the event was approximately three hours and
forty minutes, thus providing enough statistical data to well support our findings and conclu-
sions. The data collected during this measurement campaign have been used as an input to
the ESD algorithm and its performance has been quantified via o ff–line computer–based sim-
ulations, while ongoing research activities concern with an efficient implementation of our
ESD refinement algorithm onto the TI/Chipcon’s CC2431 sensor node platform.
5.4.1 NCSlab Opening Ceremony
The opening ceremony of the NCSlab was characterized by four main phases, which well
describe the dynamic nature of the event and, as a consequence, the dynamic nature of the
propagation environment to be analyzed. In what follo ws there is a brief des cription of each
phase:
1. The first phase, which took place before the starting of the ceremony, is characterized
by a progressive increase of the number of peo p le inside the room.
2. The second phase, which took place during the development of the ceremony, is char-
acterized by several people (staying either s eated or stand) inside the room, and some
people coming in and going out the room.
3. The third phase, which took place at the end of the ceremony, is characterized by the
vast majority of people staying stand and leaving the conference room.
4. The fourth p hase corresponds to the scenario with no people in the room, thus giving a
virtually static indoor scenario with almost fixed propagation characteristics.
The WSN’s setup us ed during the event is characterized by the following main setting: i) nine
anchor nodes distributed on the room’s perimeter (i.e. in direct communication each other)
broadcast their position every 800ms on a time division basis in order to avoid collisions, ii) a
blind node fixed in the middle of the room estimates its position every 8s, aver ag ing over
10 RSS acquisition p er anchor, iii) the anchor nodes are located at 115cm above the ground
floor on the top of wood suppo rts, i v) the bli nd node is located 115cm above the ground floor
during the first three phases, while it is 59cm above the ground floor during the last phase.
Moreover, four case studies have been investigated and briefly described in the following.
5.4.2 Static Calibration with Measurement Grid – Conference Room Empty (1)
The first case study is related to a static estimation of the propagation parameters needed by
the location engine. As described in Section 5.1, the parameters have been estimated in the
conference room when it was empty, i.e., no chairs and desks were in the room, and with a
grid of 44 “test” nodes deployed 115cm above the ground floor.
This off–line calibration leads to the definition of a curve similar to the one sown in Fig. 7, but
whose fitting parameters for the present testbed platform are A
= 39.29 and n = 2.23.
5.4.3 Static Calibration with Anchor Nodes – Conference Room with Furniture (2)
The s econd case study is still related to a static estimation of the propagation parameters
needed by the location engine. However, with respect to the first case study, the propagation
parameters are estimated in the conference room with furniture. Moreover, similar to the first
case study, the propagation parameters are estimated just once, and are not updated during
the progress of the opening ceremony.
However, the main difference with the previous case study is that A and n are not estimated
by resorting to a grid of “test” nodes. In contrast to the usual method described by Aamodt
(2008), we let anchor nodes performing an adaptive estimation of the propagation parameters
A and n, by resorting to the knowledge of their positions, thus their mutual distances, and
performing a least–squares best linear fitting of the couples
(RSS ; d) of the Equation 6 Tennina
et al. (n.d.).
5.4.4 Dynamic Calibration with Anchor Nodes – Continuous Training during the NCSlab
Opening Ceremony (3)
In this third case study, we use the same approach as in Case 2 for the estimation of parameters
A and n. However, these parameters are not estimated once, but are continuously updated
on a regular basis during the whole development of the opening ceremony. In Fig. 10, the
estimated propagation parameters are reported as a function of time. These p ar ameters are
those estimated by the blind node, and computed as the arithmetic average of those estimated
by the anchor nod es. We can readily figure out that there is a significant fluctuation of these
parameters during the progress of the conference. This figure qualitatively suggests that using
Distributed Localization Algorithms for Wireless Sensor Networks:
From Design Methodology to Experimental Validation 179
15 21 28 45 55 97 135 180
0
2
4
6
8
10
12
14
16
18
Positioning Error [m]
Angle [deg]
TestBed
Simulation
Fig. 9. Mean value and standard deviation of the positioning er ror: comparison between
simulation and experimentation.
realistic scenario than the one analyzed in Section 5.2, we have conducted a campaign of mea-
surements during the o p ening ceremony day of the NCSlab on March 27, 2008. The event was
characterized by a half–day kick–off conference during which the past, present, and future
activities of the laboratory were presented. The ki ck–off conference was attended by several
people, and yi elded a good occasion to test the performance of the deployed WSN, and, in
particular, to test the achievable performance of the TI/Chipcon’s CC2431 location engine in a
realistic GPS–denied environment, where the propagation characteristics of the radio channel
changed appreciably during the event due to the people’s movement inside the room (i.e.,
dynamic indoor environment). The duration of the event was approximately three hours and
forty minutes, thus providing enough statistical data to well support our findings and conclu-
sions. The data collected during this measurement campaign have been used as an input to
the ESD algorithm and its performance has been quantified via o ff–line computer–based sim-
ulations, while ongoing research activities concern with an efficient implementation of our
ESD refinement algorithm onto the TI/Chipcon’s CC2431 sensor node platform.
5.4.1 NCSlab Opening Ceremony
The opening ceremony of the NCSlab was characterized by four main phases, which well
describe the dynamic nature of the event and, as a consequence, the dynamic nature of the
propagation environment to be analyzed. In what follo ws there is a brief des cription of each
phase:
1. The first phase, which took place before the starting of the ceremony, is characterized
by a progressive increase of the number of peo p le inside the room.
2. The second phase, which took place during the development of the ceremony, is char-
acterized by several people (staying either seated or stand) inside the room, and some
people coming in and going out the room.
3. The third phase, which took place at the end of the ceremony, is characterized by the
vast majority of people staying stand and leaving the conference room.
4. The fourth p hase corresponds to the scenario with no people in the room, thus giving a
virtually static indoor scenario with almost fixed propagation characteristics.
The WSN’s setup us ed during the event is characterized by the following main setting: i) nine
anchor nodes distributed on the room’s perimeter (i.e. in direct communication each other)
broadcast their position every 800ms on a time division basis in order to avoid collisions, ii) a
blind node fixed in the middle of the room estimates its position every 8s, aver ag ing over
10 RSS acquisition p er anchor, iii) the anchor nodes are located at 115cm above the ground
floor on the top of wood suppo rts, i v) the bli nd node is located 115cm above the ground floor
during the first three phases, while it is 59cm above the ground floor during the last phase.
Moreover, four case studies have been investigated and briefly described in the following.
5.4.2 Static Calibration with Measurement Grid – Conference Room Empty (1)
The first case study is related to a static estimation of the propagation parameters needed by
the location engine. As described in Section 5.1, the parameters have been estimated in the
conference room when it was empty, i.e., no chairs and desks were in the room, and with a
grid of 44 “test” nodes deployed 115cm above the ground floor.
This off–line calibration leads to the definition of a curve similar to the one sown in Fig. 7, but
whose fitting parameters for the present testbed platform are A
= 39.29 and n = 2.23.
5.4.3 Static Calibration with Anchor Nodes – Conference Room with Furniture (2)
The s econd case study is still related to a static estimation of the propagation parameters
needed by the location engine. However, with respect to the first case study, the propagation
parameters are estimated in the conference room with furniture. Moreover, similar to the first
case study, the propagation parameters are estimated just once, and are not updated during
the progress of the opening ceremony.
However, the main difference with the previous case study is that A and n are not estimated
by resorting to a grid of “test” nodes. In contrast to the usual method described by Aamodt
(2008), we let anchor nodes performing an adaptive estimation of the propagation parameters
A and n, by resorting to the knowledge of their positions, thus their mutual distances, and
performing a least–squares best linear fitting of the couples
(RSS ; d) of the Equation 6 Tennina
et al. (n.d.).
5.4.4 Dynamic Calibration with Anchor Nodes – Continuous Training during the NCSlab
Opening Ceremony (3)
In this third case study, we use the same approach as in Case 2 for the estimation of parameters
A and n. However, these parameters are not estimated once, but are continuously updated
on a regular basis during the whole development of the opening ceremony. In Fig. 10, the
estimated propagation parameters are reported as a function of time. These p ar ameters are
those estimated by the blind node, and computed as the arithmetic average of those estimated
by the anchor nodes. We can readily figure out that there is a significant fluctuation of these
parameters during the progress of the conference. This figure qualitatively suggests that using
Wireless Sensor Networks 180
an outdated estimate for the channel parameters may certainly yield less accurate estimates
of the distances and thus of the final position estimation of the blind node.
0 10 21 32 42 53 64 74 85 96 117 138 160 181 202 224
30
35
40
45
50
Time [minutes]
Parameter A [dBm]
0 10 21 32 42 53 64 74 85 96 117 138 160 181 202 224
1.5
2
2.5
3
3.5
4
Time [minutes]
Parameter n
Ph1 Ph2 Ph3 Ph4
Fig. 10. Estimated propagation parameters during the NCSlab’s opening ceremony.
5.4.5 Dynamic Calibration with Anchor Nodes – Off–Line Refinement using the ESD Algo-
rithm (4)
The last case study foresees the same scenario and methods already described in Case 3. How-
ever, we introduce a refinement operation to improve the localization accuracy of the system.
In particular, the posi tio n estimated by the location engine in Case 3 is not considered as the
final estimated position of the blind node, but it represents the input for the ESD algorithm.
5.5 Results CC2431
In order to understand the improvement of dynamic updating the channel–dependent param-
eters, we can look at Table 2. The following conclusions can be drawn. i) For a fixed phase,
the performance i mp roves significantly when A and n are updated during the progress of the
conference (third column). ii) The imp rovement is more remarkable during phase two, which
is a very dynamic phase and where the dynamic adaptation is more important. iii) The con-
tinuous training is als o beneficial in phases one and three, but the improvement is less evident
due to the short duration of these two phases. iv) Apart from the case s tudy described in Case
1 (first column), using the ESD algorithm to refine the estimated position is always beneficial
to improve the accuracy. v) The reason why the ESD does not improve the performance in
the first case study is due to the fact that the ESD needs the RSSI–to–distance curve to refine
the position. Since this curve is not updated continuously in the first two case studies, the
algorithm may diverge from the actual solution, as we have in column one. This conclusion is
also confirmed by the fact that in an almost static scenario (phase four), the ESD improves the
overall accuracy also without updating the channel
˝
U-dependent parameters. vi) The larger
Phase Case 1 Case 2 Case 3 Case 4
1 2.69 (3.72) 2.85 (2.27) 2.20 2.00
2 3.04 (5.52) 3.19 (2.97) 1.22 1.03
3 2.77 (3.46) 2.94 (2.26) 2.72 1.93
4 3.04 (1.79) 3.04 (1.32) 2.11 1.28
Table 2. Aver ag e positioning error [meters] over the observation time. The value shown into
the parentheses in the first two columns represents the improvement that can be obtained
refining the search with the ESD algorithm (similar to Case 4).
error that can be observed in column two with respect to column one is probably due to the
smaller number of points used to estimate the calibration curve (in both cases A and n are
not updated during the progress of the conference). However, the difference is in the order
of few tens of centimeters, and thus can be acceptable. vii) Finally, we note that, as described
in Section 5.4, the results in phase four cannot be directly compared to the results in the other
phases as the position of the blind node was different. However, also in this case the accuracy
improves when moving from column one to column fo ur.
6. Conclusions
In the present chapter, we report our recent research advances along two main directions.
Firstly, we adopted the Platform Based Design methodology for the efficient design of ad-
˝
Uhoc WSNs with localization capabilities. In particular, the PBD paradigm has been used
to derive a fully distributed positioning algorithm, that we call ESD, and a general protocol
architecture for WSNs. The proposed solution has been compared with other well–known po-
sitioning algorithms available in the open technical literature, and the improvement provided
by the proposed ESD algorithm has been clearly assessed by resorting to computer–based
simulations in both network–wide and atomic scenarios. Secondly, we have validated the
suitability of a practical implementation of the proposed so lution onto commercially avail-
able WSN platforms, and analyzed their achievable performa nce in realistic propagation en-
vironments. Results have clearly shown that the ESD algorithm can be actually implemented
in CrossBow’s MICAz sensor node platforms with a modest computational complexity and
with good localization per f ormance even when using RSS–based ranging methods. The ex-
periments conducted with the TI/Chipcon’s CC2431 sensor node platform have confirmed
this in typical and dynamic environments with any a priori knowledge of channel behavior.
Although most of the results described in the present contribution are related to the perfor-
mance of the l ocalization algorithms in terms of accuracy, robustness, convergence speed,
complexity, and storage requirements of static nodes, we are currently deploying a WSN
testbed to focus our future analysis on i) the evaluation of the energy consumptions of the
ESD algorithm, and its comparison with other positioning algorithms, and ii) the analysis
of the performance when this solution is used to track people or objects moving in typical
GPS–less environments.
Distributed Localization Algorithms for Wireless Sensor Networks:
From Design Methodology to Experimental Validation 181
an outdated estimate for the channel parameters may certainly yield less accurate estimates
of the distances and thus of the final position estimation of the blind node.
0 10 21 32 42 53 64 74 85 96 117 138 160 181 202 224
30
35
40
45
50
Time [minutes]
Parameter A [dBm]
0 10 21 32 42 53 64 74 85 96 117 138 160 181 202 224
1.5
2
2.5
3
3.5
4
Time [minutes]
Parameter n
Ph1 Ph2 Ph3 Ph4
Fig. 10. Estimated propagation parameters during the NCSlab’s opening ceremony.
5.4.5 Dynamic Calibration with Anchor Nodes – Off–Line Refinement using the ESD Algo-
rithm (4)
The last case study foresees the same scenario and methods already described in Case 3. How-
ever, we introduce a refinement operation to improve the localization accuracy of the system.
In particular, the posi tio n estimated by the location engine in Case 3 is not considered as the
final estimated position of the blind node, but it represents the input for the ESD algorithm.
5.5 Results CC2431
In order to understand the improvement of dynamic updating the channel–dependent param-
eters, we can look at Table 2. The following conclusions can be drawn. i) For a fixed phase,
the performance i mp roves significantly when A and n are updated during the progress of the
conference (third column). ii) The imp rovement is more remarkable during phase two, which
is a very dynamic phase and where the dynamic adaptation is more important. iii) The con-
tinuous training is als o beneficial in phases one and three, but the improvement is less evident
due to the short duration of these two phases. iv) Apart from the case s tudy described in Case
1 (first column), using the ESD algorithm to refine the estimated position is always beneficial
to improve the accuracy. v) The reason why the ESD does not improve the performance in
the first case study is due to the fact that the ESD needs the RSSI–to–distance curve to refine
the position. Since this curve is not updated continuously in the first two case studies, the
algorithm may diverge from the actual solution, as we have in column one. This conclusion is
also confirmed by the fact that in an almost static scenario (phase four), the ESD improves the
overall accuracy also without updating the channel
˝
U-dependent parameters. vi) The larger
Phase Case 1 Case 2 Case 3 Case 4
1 2.69 (3.72) 2.85 (2.27) 2.20 2.00
2 3.04 (5.52) 3.19 (2.97) 1.22 1.03
3 2.77 (3.46) 2.94 (2.26) 2.72 1.93
4 3.04 (1.79) 3.04 (1.32) 2.11 1.28
Table 2. Aver ag e positioning error [meters] over the observation time. The value shown into
the parentheses in the first two columns represents the improvement that can be obtained
refining the search with the ESD algorithm (similar to Case 4).
error that can be observed in column two with respect to column one is probably due to the
smaller number of points used to estimate the calibration curve (in both cases A and n are
not updated during the progress of the conference). However, the difference is in the order
of few tens of centimeters, and thus can be acceptable. vii) Finally, we note that, as described
in Section 5.4, the results in phase four cannot be directly compared to the results in the other
phases as the position of the blind node was different. However, also in this case the accuracy
improves when moving from column one to column fo ur.
6. Conclusions
In the present chapter, we report our recent research advances along two main directions.
Firstly, we adopted the Platform Based Design methodology for the efficient design of ad-
˝
Uhoc WSNs with localization capabilities. In particular, the PBD paradigm has been used
to derive a fully distributed positioning algorithm, that we call ESD, and a general protocol
architecture for WSNs. The proposed solution has been compared with other well–known po-
sitioning algorithms available in the open technical literature, and the improvement provided
by the proposed ESD algorithm has been clearly assessed by resorting to computer–based
simulations in both network–wide and atomic scenarios. Secondly, we have validated the
suitability of a practical implementation of the proposed so lution onto commercially avail-
able WSN platforms, and analyzed their achievable performa nce in realistic propagation en-
vironments. Results have clearly shown that the ESD algorithm can be actually implemented
in CrossBow’s MICAz sensor node platforms with a modest computational complexity and
with good localization per f ormance even when using RSS–based ranging methods. The ex-
periments conducted with the TI/Chipcon’s CC2431 sensor node platform have confirmed
this in typical and dynamic environments with any a priori knowledge of channel behavior.
Although most of the results described in the present contribution are related to the perfor-
mance of the l ocalization algorithms in terms of accuracy, robustness, convergence speed,
complexity, and storage requirements of static nodes, we are currently deploying a WSN
testbed to focus our future analysis on i) the evaluation of the energy consumptions of the
ESD algorithm, and its comparison with other positioning algorithms, and ii) the analysis
of the performance when this solution is used to track people or objects moving in typical
GPS–less environments.
Wireless Sensor Networks 182
Acknowledgements
The authors would like to express their gratitude to the research and technical staff of the
Center of Excellence in Research DEWS and the Ne twor ked Control Systems Laboratory (NC-
Slab) for their assistance in conducting the experimental activity. Special thanks go to Alessia
D’Alessandro (B.Sc., ECE) and Andrea Scarinci (B.Sc., ECE) for conducting part of the experi-
mental measurements with the TI/Chipcon’s CC2431 testbed platform.
7. References
Aamodt, K. (2008). CC2431 l ocation engine, Application note AN042. Chipcon products for
Texas Instruments, 20 pages.
Alesii, R. , Antonini, F., Di Renzo, M. , Graziosi, F. & Santucci, F. (2004). Performance of a Chip–
Time Analog Differential Receiver for UWB Systems in a Log–Normal Frequency–
Selective Fading Channel, Wireless Personal Multimedia Communications WPMC04,
Abiano Terme, Ital y.
Alesii, R., Di Renzo, M., Graziosi, F. & Santucci, F. (2004). A Low-Compl exity Receiver for
Ultra Wide Band Communications, IEEE Euro Electromagnetics Congress, EuroEM04,
Magdeburg, Germany.
Bachrach, J. & Taylor, C. (2005). Handbook of Sensor Networks: Algorithms and Architectures -
Localization in Sensor Networks, Wiley.
Balluchi, A., Di Benedetto, M., Ferrari, A., Girasole, G., Graziosi, F., Parasiliti, F., Pinto, A.,
Pesserone, R., Petrella, R., Sangiovanni-Vincentelli, A., Santucci, F., Sgroi, M., Tursini,
M., Alesii, R. & Tennina, S. (2004). Platform Based Design: Applications and F low,
Deliverable DPBD2, Version 1, Project IST-2001-38314 COLUMBUS.
URL: />D
PBD2.pd f
Bhargahavan, V., Demers, A., Shenker, S. & Zhang, L. (1994). MACAW: a media access proto-
col for wireless LANs, ACM SIGCOMM.
Bonivento, A., Carloni, L. & Sangiovanni-Vincentelli, A. (2005). Rialto: a Bridge between De-
scription and Implementation of Control Algorithms for Wireless Sensor Networks,
ACM International Conference on Embedded Software, EMSOFT’05, Jersey City, NJ, USA.
Bulusu, N., Heidemann, J. & Estrin, D. (2000). GPS–less low–cost outdoor localization for very
small devices, IEEE Wireless Communications 7(10): 28–34.
Calamari Project (n.d.). .b erkeley.edu/~kamin/calamari.
Cro (2008). CrossBow’s Motes.
da Silva, J., Sgroi, M., De Bernardinis, F., Li, S F., Sangiovanni-Vincentelli, A. & Rabaey, J.
(2000). Wireless Protocols Design: Challenges and Opportunities, 8th IEEE Interna-
tional Workshop on Hardware/Software Codesign, S.Diego, CA, USA.
Dohler, M. (2008). Wireless sensor networks: the biggest cross–community de sign e xercise
to–date, Bentham Recent Patents on Computer Science, Vol . 1, p p . 9–25.
Dulman, S., Baggio, A., Havinga, P. & L angendoe n, K. (2008). A geometrical perspective on
localization, 1st ACM International Workshop on Mobile Entity Localization and Tracking
in GPS–less Environments, pp. 85–90.
Gay, D., Levis, P., von Behren, R., Welsh, M., Brewer, E. & Culler, D. (2003). The NesC lan-
guage: a holistic approach to networked embedded systems, ACM SIGPLAN Con-
ference on Programming Language Design and Implementation, pp. 1–11. ISBN:1–58113–
662–5.
Goldsmith, A. J. & Wicker, S. B. (2002). Design Challenges for Energy–Constrained Ad–Hoc
Wireless Networks, IEEE Communication Magazine 9: 8–27.
Hofmann-Wellenhof, B., Lichtenegger, H. & Collins, J. (1997). Global positioning system: theory
and practice.
IEEE S td 802.15.4: Wireless Medium Access Control (MAC) and Physical Layer ( PHY) Specifications
for Low-Rate Wireless Personal Area Networks (WPANs) (2006). IEEE Computer Society.
Kawadia, V. & Kumar, P. (2005). A Cautionary Perspective on Cross Layer Design, IEEE Com-
munications Magazine .
Langendoen, K. & Reijers, N. (2003). Distributed localization in wireless sensor networks: a
quantitative comparison, IEEE Computer Networks 43(4): 499–518.
Mauve, M. & Widmer, J. (2001). A survey on position–based routing in mobile ad hoc net-
works, IEEE Networks 15(6): 30–39.
Newport, C., Kotz, D., Yuan, Y., Gray, R., Liu, J. & Elliott, C. (2007). Experimental evaluation
of wireless simulation assumptions, Simulation 83(9): 643–661.
Nocedal, J. & Wright, S. (2006). Numerical Optimization, 2nd edn, Springer.
Patwari, N., As h, J. N., Kyperountas, S., Hero III, A. O. , Moses, R. L. & Correal, N. S. (2005).
Locating the Nodes, IEEE Signal Processing Magazine 22(4): 54–69.
Perkins, D. D., Tumati, R., Wu, H. & Ajbar, I. (2006). Localization in Wireless Ad Hoc Net-
works, Resource Management in Wireless Networking, Springer US, Vol. 16, pp. 507–542.
Pinto, A. (2008). COSI: COmmunication Synthesis Infrastructure, GSRC Annual Symposium.
Pinto, A., D’Angelo, M., Fischione, C., Scholte, E. & Sangiovanni-Vincentelli, A. (2008). Syn-
thesis of Embedded Networks for Buildi ng Automation and Control, American Con-
trol Conference (ACC 08), Seattle, Washington.
Sangiovanni-Vincentelli, A. (2002). Defining Platform–based Design, EEDesign of EETimes.
(available for download at www.gigascale.org/pubs/141.html).
Santucci, F., Graziosi, F. & Tennina, S. (2006). Location Service Design and Simulation in Ad-
Hoc Wireless Sensor Networks, Int ernational Journal on Mobi le Networks Design and
Innovation 1(3/4): 208–214.
Savarese, C. (2002). Robust positioning algorithms for distributed ad-hoc wireless sensor networks,
Degree of master of science, Department of Electrical Engineering and Computer
Sciences, University of California at Berk eley.
Savvides, A., Han, C C. & Srivastava, M. (2001). Dynamic Fine-Grained Localization in Ad-
Hoc Networks of Sensors, International Conference on Mobile Computing an d Network-
ing, Rome, Italy, pp. 166–179. ISBN: 1–58113–422–3.
Sgroi, M., da Silva, J., F., D. B. , Burghardt, F., Sangiovanni-Vincentelli, A. & Rabaey, J. (2000).
Designing Wireles s Protocols: Methodology and Applications, ICASSP.
Sgroi, M., Wolisz, A., Sangiovanni-Vincentelli, A. & Rabaey, J . (2003). A service-based univer-
sal application interface for ad-hoc wireless sensor networks (draft).
URL: />Srivastava, V. & Motani, M. (2005). Cross-laye r design: a survey and the road ahead, IEEE
Communications Magazine .
Stiffler, J. (1968). Rapid Acquisition Seq uences, IEEE Transactions on Information T heory IT-14(2).
Tennina, S., Di Renzo, M., Santucci, F. & Graziosi, F. (n.d.). ESD: A Novel Optimization Al-
gorithm for Positioning Estimation of WSNs in GPS–denied Environments – From
Simulation to Expe rimentation, I nternational Journal of Sensor Networks . (in press ).
Tex (2007). CC2431 Data Sheet: System–on–chip for 2.4 GHz zigbee/IEEE 802.15.4 with location
engine. Chipcon products for Texas Instruments, 15 pages.
Distributed Localization Algorithms for Wireless Sensor Networks:
From Design Methodology to Experimental Validation 183
Acknowledgements
The authors would like to express their gratitude to the research and technical staff of the
Center of Excellence in Research DEWS and the Ne twor ked Control Systems Laboratory (NC-
Slab) for their assistance in conducting the experimental activity. Special thanks go to Alessia
D’Alessandro (B.Sc., ECE) and Andrea Scarinci (B.Sc., ECE) for conducting part of the experi-
mental measurements with the TI/Chipcon’s CC2431 testbed platform.
7. References
Aamodt, K. (2008). CC2431 l ocation engine, Application note AN042. Chipcon products for
Texas Instruments, 20 pages.
Alesii, R. , Antonini, F., Di Renzo, M. , Graziosi, F. & Santucci, F. (2004). Performance of a Chip–
Time Analog Differential Receiver for UWB Systems in a Log–Normal Frequency–
Selective Fading Channel, Wireless Personal Multimedia Communications WPMC04,
Abiano Terme, Italy.
Alesii, R., Di Renzo, M., Graziosi, F. & Santucci, F. (2004). A Low-Compl exity Receiver for
Ultra Wide Band Communications, IEEE Euro Electromagnetics Congress, EuroEM04,
Magdeburg, Germany.
Bachrach, J. & Taylor, C. (2005). Handbook of Sensor Networks: Algorithms and Architectures -
Localization in Sensor Networks, Wiley.
Balluchi, A., Di Benedetto, M., Ferrari, A., Girasole, G., Graziosi, F., Parasiliti, F., Pinto, A.,
Pesserone, R., Petrella, R., Sangiovanni-Vincentelli, A., Santucci, F., Sgroi, M., Tursini,
M., Alesii, R. & Tennina, S. (2004). Platform Based Design: Applications and F low,
Deliverable DPBD2, Version 1, Project IST-2001-38314 COLUMBUS.
URL: />D
PBD2.pd f
Bhargahavan, V., Demers, A., Shenker, S. & Zhang, L. (1994). MACAW: a me dia access p roto-
col for wireless LANs, ACM SIGCOMM.
Bonivento, A., Carloni, L. & Sangiovanni-Vincentelli, A. (2005). Rialto: a Bridge between De-
scription and Implementation of Control Algorithms for Wireless Sensor Networks,
ACM International Conference on Embedded Software, EMSOFT’05, Jersey City, NJ, USA.
Bulusu, N., Heidemann, J. & Estrin, D. (2000). GPS–less low–cost outdoor localization for very
small devices, IEEE Wireless Communications 7(10): 28–34.
Calamari Project (n.d.). .b erkeley.edu/~kamin/calamari.
Cro (2008). CrossBow’s Motes.
da Silva, J., Sgroi, M., De Bernardinis, F., Li, S F., Sangiovanni-Vincentelli, A. & Rabaey, J.
(2000). Wireless Protocols Design: Challenges and Opportunities, 8th IEEE Interna-
tional Workshop on Hardware/Software Codesign, S.Diego, CA, USA.
Dohler, M. (2008). Wireless sensor networks: the biggest cross–community de sign e xercise
to–date, Bentham Recent Patents on Computer Science, Vol . 1, p p . 9–25.
Dulman, S., Baggio, A., Havinga, P. & L angendoe n, K. (2008). A geometrical perspective on
localization, 1st ACM International Workshop on Mobile Entity Localization and Tracking
in GPS–less Environments, pp. 85–90.
Gay, D., Levis, P., von Behren, R., Welsh, M., Brewer, E. & Culler, D. (2003). The NesC lan-
guage: a holistic approach to networked embedded systems, ACM SIGPLAN Con-
ference on Programming Language Design and Implementation, pp. 1–11. ISBN:1–58113–
662–5.
Goldsmith, A. J. & Wicker, S. B. (2002). Design Challenges for Energy–Constrained Ad–Hoc
Wireless Networks, IEEE Communication Magazine 9: 8–27.
Hofmann-Wellenhof, B., Lichtenegger, H. & Collins, J. (1997). Global positioning system: theory
and practice.
IEEE S td 802.15.4: Wireless Medium Access Control (MAC) and Physical Layer ( PHY) Specifications
for Low-Rate Wireless Personal Area Networks (WPANs) (2006). IEEE Computer Society.
Kawadia, V. & Kumar, P. (2005). A Cautionary Perspective on Cross Layer Design, IEEE Com-
munications Magazine .
Langendoen, K. & Reijers, N. (2003). Distributed localization in wireless sensor networks: a
quantitative comparison, IEEE Computer Networks 43(4): 499–518.
Mauve, M. & Widmer, J. (2001). A survey on position–based routing in mobile ad hoc net-
works, IEEE Networks 15(6): 30–39.
Newport, C., Kotz, D., Yuan, Y., Gray, R., Liu, J. & Elliott, C. (2007). Experimental evaluation
of wireless simulation assumptions, Simulation 83(9): 643–661.
Nocedal, J. & Wright, S. (2006). Numerical Optimization, 2nd edn, Springer.
Patwari, N., As h, J. N., Kyperountas, S., Hero III, A. O. , Moses, R. L. & Correal, N. S. (2005).
Locating the Nodes, IEEE Signal Processing Magazine 22(4): 54–69.
Perkins, D. D., Tumati, R., Wu, H. & Ajbar, I. (2006). Localization in Wireless Ad Hoc Net-
works, Resource Management in Wireless Networking, Springer US, Vol. 16, pp. 507–542.
Pinto, A. (2008). COSI: COmmunication Synthesis Infrastructure, GSRC Annual Symposium.
Pinto, A., D’Angelo, M., Fischione, C., Scholte, E. & Sangiovanni-Vincentelli, A. (2008). Syn-
thesis of Embedded Networks for Buildi ng Automation and Control, American Con-
trol Conference (ACC 08), Seattle, Washington.
Sangiovanni-Vincentelli, A. (2002). D efining Platform–based Design, EEDesign of EETimes.
(available for download at www.gigascale.org/pubs/141.html).
Santucci, F., Graziosi, F. & Tennina, S. (2006). Location Service Design and Simulation in Ad-
Hoc Wireless Sensor Networks, Int ernational Journal on Mobi le Networks Design and
Innovation 1(3/4): 208–214.
Savarese, C. (2002). Robust positioning algorithms for distributed ad-hoc wireless sensor networks,
Degree of master of science, Department of Electrical Engineering and Computer
Sciences, University of California at Berk eley.
Savvides, A., Han, C C. & Srivastava, M. (2001). Dy namic Fine-Grained Localization in Ad-
Hoc Networks of Sensors, International Conference on Mobile Computing an d Network-
ing, Rome, Italy, pp. 166–179. ISBN: 1–58113–422–3.
Sgroi, M., da Silva, J., F., D. B. , Burghardt, F., Sangiovanni-Vincentelli, A. & Rabaey, J. (2000).
Designing Wireles s Protocols: Methodology and Applications, ICASSP.
Sgroi, M., Wolisz, A., Sangiovanni-Vincentelli, A. & Rabaey, J . (2003). A service-based univer-
sal application interface for ad-hoc wireless sensor networks (draft).
URL: />Srivastava, V. & Motani, M. (2005). Cross-laye r design: a survey and the road ahead, IEEE
Communications Magazine .
Stiffler, J. (1968). Rapid Acquisition Seq uences, IEEE Transactions on Information Theory IT-14(2).
Tennina, S., Di Renzo, M., Santucci, F. & Graziosi, F. (n.d.). ESD: A Novel Optimization Al-
gorithm for Positioning Estimation of WSNs in GPS–denied Environments – From
Simulation to Expe rimentation, I nternational Journal of Sensor Networks . (in press ).
Tex (2007). CC2431 Data Sheet: System–on–chip for 2.4 GHz zigbee/IEEE 802.15.4 with location
engine. Chipcon products for Texas Instruments, 15 pages.
Wireless Sensor Networks 184
Tex (2008). TI’s website.
Varga, A. (n.d.). The OMNeT++ Discrete Event Simulation System, European Simulation Mul-
ticonference (ESM), Prague.
Wang, C. & Xiao, L. (2007). Sensor Localization under Limited Measurement Capabilities,
IEEE Networks 21(3): 16–23.
Lightweight Event Detection Scheme using Distributed
Hierarchical Graph Neuron in Wireless Sensor Networks 185
Lightweight Event Detection Scheme using Distributed Hierarchical
Graph Neuron in Wireless Sensor Networks
Asad I. Khan, Anang Hudaya Muhamad Amin and Raja Azlina Raja Mahmood
x
Lightweight Event Detection Scheme using
Distributed Hierarchical Graph Neuron in
Wireless Sensor Networks
Asad I. Khan, Anang Hudaya Muhamad Amin
and Raja Azlina Raja Mahmood
Monash University
Australia
1. Introduction
Existing breakthrough in communication technologies have lead to the rapid growth of
emerging networks in particular the wireless sensor networks (WSNs). These networks
emerged from the confluence of wireless communication technology, extensive
computational schemes, and advanced sensor technology. WSNs are created from a
collection of self-organised wireless and battery-powered devices with sensing capabilities.
The future of this kind of networks is promising, as been mentioned by (Stankovic, 2008),
“The potential of these systems is nothing short of revolutionary. This technology will affect
all aspects of our lives, bringing about substantial improvements in a broad spectrum of
modern technologies ranging from healthcare to military surveillance”.
The current scenario of WSN deployment is however is still far away from its fullest
potential. To date, WSN has only been demonstrated for humble applications such as meter
reading in buildings and basic form of ecological monitoring. In order to achieve its fullest
potential, WSN requires an intelligent computational scheme which at present is still
lacking.
Common approach implemented within existing WSN applications usually involve a
number of processing steps including sensory data capture and conveyance of these data to
a central entity known as the base station for further refinement and analysis. Consequently,
this approach would lead to a system bottleneck, if it is scaled up for widespread use.
Furthermore, processing delays would intermittently occur due to the high latency between
data capture/aggregation and processing time. These limitations make WSN less suitable
for real-time monitoring applications. We require a new approach for an improved data
processing within WSN that has the abilities to process sensory data in situ within
decentralised manner and to generate highly condensed and sophisticated outputs
internally. These abilities will alleviate the bottleneck problem within WSN through on-site
computations, and improve the detection performance by reducing the processing delays.
In this chapter, we will describe a lightweight and distributed event detection scheme
within WSN infrastructure with one-shot learning pattern recognition capability. This
9
Wireless Sensor Networks 186
scheme is comprised of a distributed associative memory algorithm known as Distributed
Hierarchical Graph Neuron (DHGN) (Khan and Muhamad Amin, 2007). It has the potential
to recognise and classify multi-dimensional sensory input for identifying natural or man-
made phenomena through clustered and hierarchical graph-based representation of input
patterns for use within fully decentralized networks. In addition, DHGN divide and
distribute recognition tasks throughout the network in a fine-grained manner for minimise
the energy use. Thus, such scheme is highly-suited for resource-constrained networks such
as WSN. In addition, DHGN is capable of integrating vast networks of sensors into
intelligent macroscopes to observing our surroundings. These will bring unprecedented
capabilities within the reach that transform the way we deal with phenomena occurring
over large distances and inaccessible regions.
The outline for this chapter is as follows. Section 2 provides an overview of WSN technology
and its current research trends. Section 3 explains the current event detection schemes
within WSN and some significant issues related to it. Details of our proposed DHGN
distributed pattern recognition scheme will be further described in section 4. Section 5
reports on our case study on forest fire detection using DHGN-WSN scheme. Section 6
entails further discussion on our proposed scheme and future direction of this research.
Finally, section 7 concludes the chapter.
2. WSN Overview
The advancement of Wireless Sensor Network (WSN) technology has been driven by a
massive development of wireless technology and an increasing miniaturisation of RF
devices and microelectromechanical systems (MEMS) (Hafez et al., 2005). WSN is a
collection of battery-powered and tiny electronic devices known as sensor nodes that are
being used to capture sensory data from its surrounding environment. In addition, these
sensor nodes are responsible for reporting the sensory readings to a centralised node,
known as the base station. That possesses several orders of magnitude more processing
capability than the other sensor nodes (Akyildiz et al., 2002). WSN has been used in a wide
range of applications including event detection, environmental monitoring, smart home
applications, and inventory management.
2.1 WSN Architecture
Every wireless sensor node is equipped with its own onboard processing, limited wireless
communication, sensing module, as well as lightweight storage facilities. Each sensor node
is built up from a number of electronic components including sensor, microcontroller unit
(MCU) for signal controlling and processing, RF transceiver for signal transmissions (Rx and
Tx), antenna, and power supply unit. Fig. 1 shows this generic wireless sensor node
architecture. Currently, there is a number of commercially available wireless sensor nodes of
different types for applications. These include Berkeley Mica Mote ()
and UCLA iBadge (Park et al., 2002). The specifications of the Berkeley Mica Mote sensor
node that is used in many surveillance networks (Lewis, 2004, Levis and Culler, 2002) are
also listed in Table 1.
Fig. 1. Common components within a wireless sensor node
CPU: 8-bit 4 MHz
Memory : 128KB Flash and 4KB RAM
Communication : 916 MHz 40 Kbps Radio
Power : 2 AA Batteries
Table 1. Berkeley Mica Mote sensor node specifications
On a macro level, WSN is made up of of wireless sensor nodes that are linked together
through a common entity known as the base station (also commonly known as sink). Due to
limited power and processing capabilities, communications between sensor nodes and base
station usually involve a series of data aggregation techniques to reduce the volume of
traffic enroute to the base station. Data aggregation is a process which allows vast amounts
of data to be communicated in an efficient manner through the use of data centric routing
protocols and effective middleware. Protocols such as SPIN, LEACH, PEGASIS and SMECN
are some of the known data aggregation solutions for WSNs. Fig. 2 shows a common
infrastructure for WSN network.
Fig. 2. Common infrastructure for WSN network
2.2 Advances in WSN technology
The advancement of WSN technology has also created a new network architecture known as
wireless heterogeneous sensor network (WHSN) (Shih et al., 2006). WHSN is a new form of
WSN network in which each sensor node may have a number of different sensors. An
Lightweight Event Detection Scheme using Distributed
Hierarchical Graph Neuron in Wireless Sensor Networks 187
scheme is comprised of a distributed associative memory algorithm known as Distributed
Hierarchical Graph Neuron (DHGN) (Khan and Muhamad Amin, 2007). It has the potential
to recognise and classify multi-dimensional sensory input for identifying natural or man-
made phenomena through clustered and hierarchical graph-based representation of input
patterns for use within fully decentralized networks. In addition, DHGN divide and
distribute recognition tasks throughout the network in a fine-grained manner for minimise
the energy use. Thus, such scheme is highly-suited for resource-constrained networks such
as WSN. In addition, DHGN is capable of integrating vast networks of sensors into
intelligent macroscopes to observing our surroundings. These will bring unprecedented
capabilities within the reach that transform the way we deal with phenomena occurring
over large distances and inaccessible regions.
The outline for this chapter is as follows. Section 2 provides an overview of WSN technology
and its current research trends. Section 3 explains the current event detection schemes
within WSN and some significant issues related to it. Details of our proposed DHGN
distributed pattern recognition scheme will be further described in section 4. Section 5
reports on our case study on forest fire detection using DHGN-WSN scheme. Section 6
entails further discussion on our proposed scheme and future direction of this research.
Finally, section 7 concludes the chapter.
2. WSN Overview
The advancement of Wireless Sensor Network (WSN) technology has been driven by a
massive development of wireless technology and an increasing miniaturisation of RF
devices and microelectromechanical systems (MEMS) (Hafez et al., 2005). WSN is a
collection of battery-powered and tiny electronic devices known as sensor nodes that are
being used to capture sensory data from its surrounding environment. In addition, these
sensor nodes are responsible for reporting the sensory readings to a centralised node,
known as the base station. That possesses several orders of magnitude more processing
capability than the other sensor nodes (Akyildiz et al., 2002). WSN has been used in a wide
range of applications including event detection, environmental monitoring, smart home
applications, and inventory management.
2.1 WSN Architecture
Every wireless sensor node is equipped with its own onboard processing, limited wireless
communication, sensing module, as well as lightweight storage facilities. Each sensor node
is built up from a number of electronic components including sensor, microcontroller unit
(MCU) for signal controlling and processing, RF transceiver for signal transmissions (Rx and
Tx), antenna, and power supply unit. Fig. 1 shows this generic wireless sensor node
architecture. Currently, there is a number of commercially available wireless sensor nodes of
different types for applications. These include Berkeley Mica Mote ()
and UCLA iBadge (Park et al., 2002). The specifications of the Berkeley Mica Mote sensor
node that is used in many surveillance networks (Lewis, 2004, Levis and Culler, 2002) are
also listed in Table 1.
Fig. 1. Common components within a wireless sensor node
CPU: 8-bit 4 MHz
Memory : 128KB Flash and 4KB RAM
Communication : 916 MHz 40 Kbps Radio
Power : 2 AA Batteries
Table 1. Berkeley Mica Mote sensor node specifications
On a macro level, WSN is made up of of wireless sensor nodes that are linked together
through a common entity known as the base station (also commonly known as sink). Due to
limited power and processing capabilities, communications between sensor nodes and base
station usually involve a series of data aggregation techniques to reduce the volume of
traffic enroute to the base station. Data aggregation is a process which allows vast amounts
of data to be communicated in an efficient manner through the use of data centric routing
protocols and effective middleware. Protocols such as SPIN, LEACH, PEGASIS and SMECN
are some of the known data aggregation solutions for WSNs. Fig. 2 shows a common
infrastructure for WSN network.
Fig. 2. Common infrastructure for WSN network
2.2 Advances in WSN technology
The advancement of WSN technology has also created a new network architecture known as
wireless heterogeneous sensor network (WHSN) (Shih et al., 2006). WHSN is a new form of
WSN network in which each sensor node may have a number of different sensors. An
Wireless Sensor Networks 188
example for this kind of sensor node is the Crossbow’s Mica2 mote
() which commonly equipped with various sensors able to capture
sensory readings such as temperature, humidity and light exposure. With WHSN, the
capability of the sensor network to provide various range of sensor readings are extended.
Consequently, this makes the network capable of detecting any occurrences of significant
event by observing multiple parameters in comparison to a single parameter observation.
Another form of WSN network has recently being introduced, known as the mobile WSN
(Benyuan et al., 2005, Wang et al., 2008). Mobile WSN derives its name from the presence of
mobile sink or sensor nodes. It provides greater deployment flexibility in comparison to the
static WSN architecture. Mobile WSNs have also been found to demonstrate enhanced
performance over static WSNs (Munir et al., 2007).
2.3 WSN Deployment Issues
Issues with WSN deployment across wide area of applications encircled towards its
resource-constrained characteristics, which include limited communication bandwidth,
power, processing capability and memory capacity (Culler et al., 2004). In addition, any
algorithm that entails computations, communications, or storage resources within a sensor
node would lead to quick exhaustion of the limited battery power available per node. The
limited energy and computational resources of sensors imply that the data processing and
transmission must be kept to a minimum level in order to conserve energy.
In solving these issues, systems designers must be able to produce a well-managed design
for WSN deployment in which it will provide long-term reliability to the network. An
effective design should include some important principles such as data-centric mechanism,
localised algorithms, and lightweight middleware. In this chapter, we propose a new design
for WSN deployment for event detection which incorporates these principles for highly-
reliable sensor networks.
3. WSN Event Detection
One of the primary purposes of the existence of WSN is to provide capabilities for
monitoring, detecting, and reporting various significant occurrences of events in the sensory
domain. An event can be defined as a behavioural change over time on a certain dynamic
phenomenon (Guralnik and Srivastava, 1999). An example of event is the change in rainfall
amount, ranging from light to heavy to extreme. The behavioural change mentioned here
could be either a change involving single environmental parameter value or changes
involving composite parameters. In explaining this, (Li et al., 2004) proposed an event
hierarchy terminology that differentiates between atomic events and compound events.
Atomic event can be determined based on an observation of a sensor, while compound
event cannot be determined from a single observation. Rather, compound event is a
collection of observations on different types of sensors. For instance, forest fire is a
compound event in which observations could be made on four different parameters
including temperature, relative humidity, wind speed, and rainfall.
In relation to event detection using WSN, the direction of research in this area is more
towards developing energy-efficient, scalable, and reliable scheme to be used within this
resource-constrained network.
Research in the area of event detection using WSN could commonly be classified into two
groups: performance-specific research and application-specific research. The performance-
specific research concerns with the efficiency of the event detection scheme. The main
research goal is to develop an event detection scheme with minimum energy consumption
and extended lifetime of the WSN network. Alternatively, application-specific research
focuses on the development of event detection mechanism that provides accurate and
reliable detection for predefined applications such as intrusion detection or phenomenon
detection. The common goal of this research area is to obtain efficient mechanism for event
detection that deploys specific data processing algorithm that is able to provide accurate and
reliable detection using WSN network. This section will further describe the two common
research areas of event detection.
3.1 Performance-specific Event Detection Schemes
Most of the recent works on performance-specific event detection schemes are focusing on
efficient localisation method and routing mechanism that could be deployed within a WSN
network. Localisation and routing are the two important factors in determining the
optimum coverage and performance of WSN network. Furthermore, these works have also
considered multiple event detection scenarios.
A collaborative event detection and tracking in wireless heterogeneous sensor networks
(WHSN) has been proposed by (Shih et al., 2008). In their work, emphasis has been put into
tracking procedure and localisation of sensors’ attribute region for event detection. Event
detection scheme known as CollECT (Collaborative Event Detection and Tracking) has been
introduced. A collaboration of different types of sensor nodes is used for event detection
and tracking. The three main procedures involved are vicinity triangulation, event
determination, and border sensor node selection. The scheme allows event detection and
tracking to be conducted simultaneously. However, the scheme requires significant
distinction of sensor nodes and their attributes according to its sensing capability.
Furthermore, it also requires extensive collaboration of sensor nodes to derive towards
maximum accuracy in the event detection within WHSN.
(Banerjee et al., 2008) introduces multiple-event detection scheme with fault tolerant within
WSN. They propose the use of polynomial-based scheme that addresses the problems of
Event Region Detection (PERD). There are two important components involved, which are
the event recognition and event report with boundary detection. For event recognition,
(Banerjee et al., 2008) adopts min-max classification scheme which classifies event according
to the sensor reading values. These values would then be transformed into polynomial
coefficients and passed through a data aggregation scheme. The proposed event detection
scheme has enabled a 33% savings in the communication overhead experienced by the
network.
Another important contribution in this event detection with performance-specific research is
on the works conducted by (Ai et al., 2009) in Authentic Delay Bounded Event Detection
System (ADBEDS) for WHSN. ADBEDS implements iterative event detection scheme using
event detection tree. This system does simultaneous event detection and packet routing.
ADBEDS support singular and composite event monitoring. Important aspects within
ADBEDS implementation include energy efficiency and authenticity within WSN
deployment for event detection. ADBEDS implements user-specified bounded delay for
Lightweight Event Detection Scheme using Distributed
Hierarchical Graph Neuron in Wireless Sensor Networks 189
example for this kind of sensor node is the Crossbow’s Mica2 mote
() which commonly equipped with various sensors able to capture
sensory readings such as temperature, humidity and light exposure. With WHSN, the
capability of the sensor network to provide various range of sensor readings are extended.
Consequently, this makes the network capable of detecting any occurrences of significant
event by observing multiple parameters in comparison to a single parameter observation.
Another form of WSN network has recently being introduced, known as the mobile WSN
(Benyuan et al., 2005, Wang et al., 2008). Mobile WSN derives its name from the presence of
mobile sink or sensor nodes. It provides greater deployment flexibility in comparison to the
static WSN architecture. Mobile WSNs have also been found to demonstrate enhanced
performance over static WSNs (Munir et al., 2007).
2.3 WSN Deployment Issues
Issues with WSN deployment across wide area of applications encircled towards its
resource-constrained characteristics, which include limited communication bandwidth,
power, processing capability and memory capacity (Culler et al., 2004). In addition, any
algorithm that entails computations, communications, or storage resources within a sensor
node would lead to quick exhaustion of the limited battery power available per node. The
limited energy and computational resources of sensors imply that the data processing and
transmission must be kept to a minimum level in order to conserve energy.
In solving these issues, systems designers must be able to produce a well-managed design
for WSN deployment in which it will provide long-term reliability to the network. An
effective design should include some important principles such as data-centric mechanism,
localised algorithms, and lightweight middleware. In this chapter, we propose a new design
for WSN deployment for event detection which incorporates these principles for highly-
reliable sensor networks.
3. WSN Event Detection
One of the primary purposes of the existence of WSN is to provide capabilities for
monitoring, detecting, and reporting various significant occurrences of events in the sensory
domain. An event can be defined as a behavioural change over time on a certain dynamic
phenomenon (Guralnik and Srivastava, 1999). An example of event is the change in rainfall
amount, ranging from light to heavy to extreme. The behavioural change mentioned here
could be either a change involving single environmental parameter value or changes
involving composite parameters. In explaining this, (Li et al., 2004) proposed an event
hierarchy terminology that differentiates between atomic events and compound events.
Atomic event can be determined based on an observation of a sensor, while compound
event cannot be determined from a single observation. Rather, compound event is a
collection of observations on different types of sensors. For instance, forest fire is a
compound event in which observations could be made on four different parameters
including temperature, relative humidity, wind speed, and rainfall.
In relation to event detection using WSN, the direction of research in this area is more
towards developing energy-efficient, scalable, and reliable scheme to be used within this
resource-constrained network.
Research in the area of event detection using WSN could commonly be classified into two
groups: performance-specific research and application-specific research. The performance-
specific research concerns with the efficiency of the event detection scheme. The main
research goal is to develop an event detection scheme with minimum energy consumption
and extended lifetime of the WSN network. Alternatively, application-specific research
focuses on the development of event detection mechanism that provides accurate and
reliable detection for predefined applications such as intrusion detection or phenomenon
detection. The common goal of this research area is to obtain efficient mechanism for event
detection that deploys specific data processing algorithm that is able to provide accurate and
reliable detection using WSN network. This section will further describe the two common
research areas of event detection.
3.1 Performance-specific Event Detection Schemes
Most of the recent works on performance-specific event detection schemes are focusing on
efficient localisation method and routing mechanism that could be deployed within a WSN
network. Localisation and routing are the two important factors in determining the
optimum coverage and performance of WSN network. Furthermore, these works have also
considered multiple event detection scenarios.
A collaborative event detection and tracking in wireless heterogeneous sensor networks
(WHSN) has been proposed by (Shih et al., 2008). In their work, emphasis has been put into
tracking procedure and localisation of sensors’ attribute region for event detection. Event
detection scheme known as CollECT (Collaborative Event Detection and Tracking) has been
introduced. A collaboration of different types of sensor nodes is used for event detection
and tracking. The three main procedures involved are vicinity triangulation, event
determination, and border sensor node selection. The scheme allows event detection and
tracking to be conducted simultaneously. However, the scheme requires significant
distinction of sensor nodes and their attributes according to its sensing capability.
Furthermore, it also requires extensive collaboration of sensor nodes to derive towards
maximum accuracy in the event detection within WHSN.
(Banerjee et al., 2008) introduces multiple-event detection scheme with fault tolerant within
WSN. They propose the use of polynomial-based scheme that addresses the problems of
Event Region Detection (PERD). There are two important components involved, which are
the event recognition and event report with boundary detection. For event recognition,
(Banerjee et al., 2008) adopts min-max classification scheme which classifies event according
to the sensor reading values. These values would then be transformed into polynomial
coefficients and passed through a data aggregation scheme. The proposed event detection
scheme has enabled a 33% savings in the communication overhead experienced by the
network.
Another important contribution in this event detection with performance-specific research is
on the works conducted by (Ai et al., 2009) in Authentic Delay Bounded Event Detection
System (ADBEDS) for WHSN. ADBEDS implements iterative event detection scheme using
event detection tree. This system does simultaneous event detection and packet routing.
ADBEDS support singular and composite event monitoring. Important aspects within
ADBEDS implementation include energy efficiency and authenticity within WSN
deployment for event detection. ADBEDS implements user-specified bounded delay for
Wireless Sensor Networks 190
event detection. Energy efficiency is achieved through sleep-awake alternation between
sensor nodes.
3.2 Application-specific Event Detection Schemes
Application-specific schemes for event detection refer to the area of research involving
development of application middleware for WSN. This middleware provides enhanced
capability and accuracy for event detection using sensor networks. Several machine learning
algorithms have been applied including Fuzzy-ART neural network, multi-layer
perceptrons (MLPs), and Self-Organising Maps (SOMs).
The use of Adaptive Resonance Theory (ART) neural network for event tracking was
introduced by (Kulakov and Davcev, 2005b). Further classification scheme for event
detection within WSN has also been introduced in (Kulakov and Davcev, 2005a). In these
works, the use of artificial neural networks (ANNs) in the form of ART network has been
used as pattern classifier for event detection and classification. The scheme offers reduction
in communication overhead with only cluster labels being sent to the sink, instead of the
overall sensory data. However, the implementation of ART neural network incurs excessive
iterative cycle to achieve optimum cluster matches.
The works by (Kulakov and Davcev, 2005b) on ART neural network for event tracking has
also been further researched by (Li and Parker, 2008) in their works on intruder detection
using a WSN with fuzzy-ART neural networks.
Self-organisation for event detection has also been a major focus in application specific
research within WSN networks. (Elaine et al., 2003) propose a concept of distributed event
classification through the use of Kohonen self-organising map (SOM) approach (Kohonen,
2001). The occurrence of events, which are signified by changes in sensor parameter values,
could be mapped into clusters representation. The proposed scheme however, imposes
significant iterative learning procedure and the classification process is carried out on each
input unit, rather than collective input units.
3.3 Summary
Existing event detection schemes within wireless sensor network commonly involve
centralised processing at the sink or base station. Efforts to minimise the tendency for this
centralised or singular processing have been shown by the works of both performance and
application-specific research works. However, a complete decentralisation processing for
event detection has yet to be achieved. There are several factors related to this issue. These
include complex learning algorithms for event detection and tightly-coupled schemes being
deployed for event detection.
We can see by the works of (Kulakov and Davcev, 2005b) and (Elaine et al., 2003) that
extensive learning procedures are required in order to derive clusters of events.
Consequently, the inputs from the sensors would need to be processed separately and thus
incur additional communication overhead for inter-nodes communication. In addition, the
proposed schemes do not take into account the variable data processing latency for each
sensor node, that is some nodes may require longer processing time than the others.
The works conducted by (Shih et al., 2008) and (Banerjee et al., 2008) offer significant
contribution in the efficiency of communication schemes for event detection using WSN.
However, the tendency for centralised processing is somewhat undeniable. Furthermore,
approaches for distinguishing different roles of specific nodes within WSN are still within a
scope of further discussion, due to the nature of WSN network which consists of uniformly-
equivalent resource-constrained sensor nodes.
In this chapter, we propose a holistic solution for event detection using WSN. It incorporates
a distributed pattern recognition scheme within WSN network and provides on-site and
localised computation. We implement a single-cycle learning distributed pattern recognition
algorithm known as Distributed Hierarchical Graph Neuron (DHGN) (Khan and Muhamad
Amin, 2007). Within this scheme, a dimensionality reduction approach has been employed
for minimising the need for complex computation, as well as the incurrence of
communication overhead within the network. Our proposed scheme is also capable of
providing scalable detection in which we are able to cater for the outgrowth of event classes.
Furthermore, integration with computational grid for complex event analysis is viable
through this scheme is. Finally, our proposed lightweight event detection scheme also
equipped with a detailed workflow of the event detection process. The following sections
will provide further descriptions of our proposed solution.
4. Distributed Hierarchical Graph Neuron (DHGN)
DHGN is a novel distributed associative memory (AM) algorithm for pattern recognition.
The main idea behind this algorithm is that common pattern recognition approaches for
various kinds of patterns would be able to be conducted within a body of a network. DHGN
shifts the recognition algorithm paradigm from employing CPU-centric processing towards
network-centric processing approach. It also adopts single-cycle learning with in-network
processing capability for fast and accurate recognition scheme.
The basic foundation of DHGN algorithm is based upon the functionalities and capabilities
of two other associative memory algorithms known as Graph Neuron (GN) (Khan, 2002)
and Hierarchical Graph Neuron (HGN) (Nasution and Khan, 2008). It eliminates the
crosstalk issue in GN implementation, as well as reduces the complexity of HGN algorithm
by reducing the number of processors required for its execution. DHGN is also a lightweight
pattern recogniser that supports adaptive granularity of the computational network,
ranging from fine-grained networks such as WSN to coarse-grained networks including
computational grid.
DHGN network consists of a collection of DHGN processing clusters (PCs) that are
interconnected through an important processing entity known as Collective Recognition
Unit (CRU), which is responsible for collection of recognition results from each DHGN PC.
Fig. 3 shows the basic architecture for DHGN network.
Lightweight Event Detection Scheme using Distributed
Hierarchical Graph Neuron in Wireless Sensor Networks 191
event detection. Energy efficiency is achieved through sleep-awake alternation between
sensor nodes.
3.2 Application-specific Event Detection Schemes
Application-specific schemes for event detection refer to the area of research involving
development of application middleware for WSN. This middleware provides enhanced
capability and accuracy for event detection using sensor networks. Several machine learning
algorithms have been applied including Fuzzy-ART neural network, multi-layer
perceptrons (MLPs), and Self-Organising Maps (SOMs).
The use of Adaptive Resonance Theory (ART) neural network for event tracking was
introduced by (Kulakov and Davcev, 2005b). Further classification scheme for event
detection within WSN has also been introduced in (Kulakov and Davcev, 2005a). In these
works, the use of artificial neural networks (ANNs) in the form of ART network has been
used as pattern classifier for event detection and classification. The scheme offers reduction
in communication overhead with only cluster labels being sent to the sink, instead of the
overall sensory data. However, the implementation of ART neural network incurs excessive
iterative cycle to achieve optimum cluster matches.
The works by (Kulakov and Davcev, 2005b) on ART neural network for event tracking has
also been further researched by (Li and Parker, 2008) in their works on intruder detection
using a WSN with fuzzy-ART neural networks.
Self-organisation for event detection has also been a major focus in application specific
research within WSN networks. (Elaine et al., 2003) propose a concept of distributed event
classification through the use of Kohonen self-organising map (SOM) approach (Kohonen,
2001). The occurrence of events, which are signified by changes in sensor parameter values,
could be mapped into clusters representation. The proposed scheme however, imposes
significant iterative learning procedure and the classification process is carried out on each
input unit, rather than collective input units.
3.3 Summary
Existing event detection schemes within wireless sensor network commonly involve
centralised processing at the sink or base station. Efforts to minimise the tendency for this
centralised or singular processing have been shown by the works of both performance and
application-specific research works. However, a complete decentralisation processing for
event detection has yet to be achieved. There are several factors related to this issue. These
include complex learning algorithms for event detection and tightly-coupled schemes being
deployed for event detection.
We can see by the works of (Kulakov and Davcev, 2005b) and (Elaine et al., 2003) that
extensive learning procedures are required in order to derive clusters of events.
Consequently, the inputs from the sensors would need to be processed separately and thus
incur additional communication overhead for inter-nodes communication. In addition, the
proposed schemes do not take into account the variable data processing latency for each
sensor node, that is some nodes may require longer processing time than the others.
The works conducted by (Shih et al., 2008) and (Banerjee et al., 2008) offer significant
contribution in the efficiency of communication schemes for event detection using WSN.
However, the tendency for centralised processing is somewhat undeniable. Furthermore,
approaches for distinguishing different roles of specific nodes within WSN are still within a
scope of further discussion, due to the nature of WSN network which consists of uniformly-
equivalent resource-constrained sensor nodes.
In this chapter, we propose a holistic solution for event detection using WSN. It incorporates
a distributed pattern recognition scheme within WSN network and provides on-site and
localised computation. We implement a single-cycle learning distributed pattern recognition
algorithm known as Distributed Hierarchical Graph Neuron (DHGN) (Khan and Muhamad
Amin, 2007). Within this scheme, a dimensionality reduction approach has been employed
for minimising the need for complex computation, as well as the incurrence of
communication overhead within the network. Our proposed scheme is also capable of
providing scalable detection in which we are able to cater for the outgrowth of event classes.
Furthermore, integration with computational grid for complex event analysis is viable
through this scheme is. Finally, our proposed lightweight event detection scheme also
equipped with a detailed workflow of the event detection process. The following sections
will provide further descriptions of our proposed solution.
4. Distributed Hierarchical Graph Neuron (DHGN)
DHGN is a novel distributed associative memory (AM) algorithm for pattern recognition.
The main idea behind this algorithm is that common pattern recognition approaches for
various kinds of patterns would be able to be conducted within a body of a network. DHGN
shifts the recognition algorithm paradigm from employing CPU-centric processing towards
network-centric processing approach. It also adopts single-cycle learning with in-network
processing capability for fast and accurate recognition scheme.
The basic foundation of DHGN algorithm is based upon the functionalities and capabilities
of two other associative memory algorithms known as Graph Neuron (GN) (Khan, 2002)
and Hierarchical Graph Neuron (HGN) (Nasution and Khan, 2008). It eliminates the
crosstalk issue in GN implementation, as well as reduces the complexity of HGN algorithm
by reducing the number of processors required for its execution. DHGN is also a lightweight
pattern recogniser that supports adaptive granularity of the computational network,
ranging from fine-grained networks such as WSN to coarse-grained networks including
computational grid.
DHGN network consists of a collection of DHGN processing clusters (PCs) that are
interconnected through an important processing entity known as Collective Recognition
Unit (CRU), which is responsible for collection of recognition results from each DHGN PC.
Fig. 3 shows the basic architecture for DHGN network.
Wireless Sensor Networks 192
Fig. 3. DHGN network architecture
DHGN processing cluster (PC) is a structural formation of recognition entities called
processing elements (PEs) as shown in Fig. 4. The formation is a pyramid-like composition
where the base of the structure represents the input patterns. Pattern representation within
DHGN network is in the form of [value, position] format. Fig. 5 shows how character pattern
“AABCABC” is represented in DHGN algorithm.
Fig. 4. DHGN processing cluster (PC) formation consists of a number of processing elements
(PEs)
Fig. 5. Pattern representation within DHGN algorithm. Each element within a pattern is
represented with [value, position] format,
Each row in this representation forms the pattern’s possible values v , while each column
represents the position of each value within the pattern,
p
. Therefore, the number of
columns within this formation is equivalent to the size of the pattern. In this manner, each
location-assigned PE will hold a single value. The formation of the input representation at
the base of DHGN processing cluster could be derived from the number of PEs,
PE
n
at the
base level of the PC, as shown in Equation (1):
PE
n pv
(1)
4.1 DHGN Recognition Process
Recognition process within DHGN involves a single-cycle learning of patterns on a
distributed processing manner. Unlike other pattern recognition algorithms such as
Hopfield Neural Network (HNN) (Hopfield and Tank, 1985) and Kohonen SOM (Kohonen,
2001), DHGN employs in-network processing feature within the recognition process. This
processing capability allows the recognition process to be performed by a collection of
lightweight processors (referred to PEs). PE is an abstract representation of processor that
could be in the form of a specific memory location or a single processing node.
At macro level, DHGN pattern recognition algorithm works by applying a divide-and-
distribute approach to the input patterns. It involves a process of dividing a pattern into a
number of subpatterns and the distribution of these subpatterns within the DHGN network
as shown in Fig. 6.
Fig. 6. Divide-and-distribute approach in DHGN distributed pattern recognition algorithm.
Character Pattern ‘A’ is decomposed into similar size subpatterns
In this work, we have made an assumption that a pattern
P
is a series of data in the form of
[value, position], as shown in Equation (2):
1 2
, , , ,
x
P v v v x
(2)