Wireless Sensor Networks Part 11 ppt
Bạn đang xem bản rút gọn của tài liệu. Xem và tải ngay bản đầy đủ của tài liệu tại đây (1.86 MB, 25 trang )
Mobile Wireless Sensor Networks: Architects for Pervasive Computing 243
location, i.e. to optimally place multiple sinks or relays in order to minimize the energy
consumption and maximize network lifetime.
It is well known that the traditional definition for a wireless sensor network is a
homogeneous network with flat architecture, where all nodes are with identical battery
capacity and hardware complexity, except the sink node as the gateway to communicate
with end users across Internet. However, such flat network architecture inevitably leads to
several challenges in terms of MAC/routing design, energy conservation and network
management. In fact, as a kind of heterogeneity, mobility can create network hierarchy, and
clustering is beneficial to improve network scalability and lifetime.
Table 1. Comparison of Leveraging Sink Mobility in Wireless Sensor Network
Intuitively, increasing the sink velocity v will improve the system efficiency, since in unit
time interval the mobile sink can meet more sensors and gather more information
throughout the sensor field. However, we should carefully choose this parameter as
explained below. On one hand, the higher the mobile sink velocity, the higher the
probability for static sensors is to meet mobile sinks. On the other hand, when mobile sinks
are moving too fast across the effective communication region of static sensors, there may
not be a sufficient long session interval for the sensor and sink to successfully exchange one
potentially long packet. In other words, with the increase of sink velocity, the “outage
probability” of packet transmission will rise. Therefore, finding a proper value for sink
velocity must be a tradeoff between minimizing the sensor-sink meeting latency and
minimizing the outage probability.
3.1. Sensor-sink Meeting Delay
Suppose the network consists of m mobile sinks and n static sensors in a disk of unit size.
Both sink and sensor nodes operate with transmission range of r. The mobility pattern of the
mobile sinks
miM
i
, 1
is according to “Random Direction Mobility Model”,
however, with a constant velocity v. The sink’s trajectory is a sequence of epochs and during
each epoch the moving speed v of
i
M is invariant and the moving direction of
i
M over the
disk is uniform and independent of its position. Denote
i
Q as the epoch duration of
i
M ,
which is measured as the time interval between
i
M ‘s starting and finishing points.
i
Q is
an exponentially distributed random variable, and the distributions of different
i
Q (i=1, ,
m) are independent and identically-distributed (i.i.d) random variables with common
average of
Q
. Consequently the epoch length of different
i
L ’s are also i.i.d random
variables, sharing the same average of
vQL .
Assume a stationary distribution of mobile sinks, in other words, the probabilities of
independent mobile sinks approaching a certain static sensor from different directions are
equal. Specifically, the meeting of one static sensor
j
N
(j=1, , n) and one mobile sink
i
M is defined as Mi covers Nj during an epoch. Since
i
M will cover an area of size
ki
rLr
,
2
2
during the k-th epoch, then the number of epochs
i
X needed till the first
sensor-sink meeting is geometrically distributed with average of (Theorem 3.1 of [30]), with
the cumulative density function (cdf) as
xx
k
x
k
i
ppxF
1
1
In the case of multiple mobile sinks, the sensor sink meeting delay should be calculated as
the delay when the first sensor-sink meeting occurs. Thus the number of epochs X needed
should be the minimum of all
i
X (i=1, , m), with the cdf as
xx
km
xx
pmpxFxF
i
1
111
Denote
X
as the average of
X
, the expected sensor sink meeting delay will be
v
L
XD
.
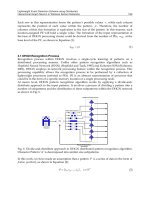
1
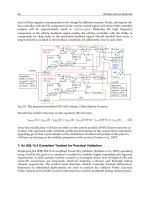
Fig. 11. Illustration of computing the distribution of sensor sink meeting delay.
Wireless Sensor Networks 244
This result gives us some hints on choosing the parameters to minimize the sensor-sink
meeting delay. If we increase the radio transmission range r, or increase the number of
mobile sinks m, or increase the sink velocity v, the sensor-sink meeting delay can get
reduced. However, the above analysis has implicitly neglected the time consumed by packet
transmission during each sensor-sink encounters. If the message length is not negligible, the
message has to be split into several segments and deliver to multiple sinks.
3.2. Large Message Delivery Delay
In case of packet segmentations, the split packets are assumed to be sent to different mobile
sinks and reassembled. Message delivery delay can be mainly attributed to the packet
transmission time, while the packet re-sequencing delay is out of the scope of our study.
Assume each sensor will alternate between two states, active and sleep, whose durations
will be exponential distributed with a mean of
1
. Thus the message arrival is a Poisson
process with arrival rate
. For constant message length of L, constant channel bandwidth
w, the number of time slots required to transmit a message is T=L/w. Then with a service
probability
2
rmp
, the service time of the message is a random variable with Pascal
distribution (Lemma 1 of [6]). That is, the probability that the message can be transmitted
within no more than x time slots, is
Tx
i
i
T
x
pp
T
iT
xF
0
1
1
1
Such a Pascal distribution with mean value of
2
mwr
L
p
T
. Under an average
Poisson arrival rate
and a Pascal service time with
L
mwr
T
p
2
, data
generation and transmission can be modeled as an M/G/1 queue. Then the average
message delivery delay can be expressed as follows:
12
1
222
2
D
where
. For simplicity, we neglect the impact of arrival rate and set
=1, thus
1
1
1
1
2
2
L
mwr
D
This result shows that, by decreasing message length L, or increasing transmission range r
and number of mobile sinks m, the message delivery delay can be reduced. We have
designed simulations to verify our analysis. One thousand five hundred sensor nodes have
been deployed in a 10,000x10,000-m region. The data generation of each sensor nodes
follows a Poisson process with an average arrival interval of 1s. By varying the ratio of sink
velocity against transmission radius, and by varying the number of mobile sinks, we can
evaluate the performance of average message delivery delay and energy consumption, as
illustrated in Figure. 12 and Figure. 13.
Fig. 12. Average message delivery delay under different scenarios by varying the number
and velocity of mobile sinks.
As can be found in Figure. 12, it coincides with our expectation that the more mobile sinks
deployed the less delay for message delivery between sensors and sinks. Besides, the
simulation results are identical with our analysis on choosing the proper speed for mobile
sinks. When the sink mobility is low, the sensors have to wait for a long time before
encountering the sink and delivering the message. When the sink moves too fast, however,
although the sensors meet the sink more frequently, they have to have the long messages
sent successfully in several successive transmissions. In fact, there exists an optimal velocity
under which the message delivery delay will be minimized. Average energy consumption is
illustrated in Figure. 13. By different cluster size, we mean the maximal hop count between
the sensor and mobile sink. It is worthy noting that when the cluster size is small (1 or 2), the
average energy consumption will almost remain constant irrespective of the number of
mobile sinks.
In other words, more deployed mobile sinks will not lead to further reduced energy
consumption. However, when messages can be delivered to a mobile sink multiple hops
away then the number of mobile sinks will have influence on the energy consumption: the
more mobile sinks, the less energy will be consumed. In fact, the energy consumption in
mWSN is more balanced compared with static WSN, which means the remaining energy of
each sensor node is almost equal. It is easily understood that more balanced energy
consumption will lead to more robust network connectivity and longer network lifetime.
Mobile Wireless Sensor Networks: Architects for Pervasive Computing 245
This result gives us some hints on choosing the parameters to minimize the sensor-sink
meeting delay. If we increase the radio transmission range r, or increase the number of
mobile sinks m, or increase the sink velocity v, the sensor-sink meeting delay can get
reduced. However, the above analysis has implicitly neglected the time consumed by packet
transmission during each sensor-sink encounters. If the message length is not negligible, the
message has to be split into several segments and deliver to multiple sinks.
3.2. Large Message Delivery Delay
In case of packet segmentations, the split packets are assumed to be sent to different mobile
sinks and reassembled. Message delivery delay can be mainly attributed to the packet
transmission time, while the packet re-sequencing delay is out of the scope of our study.
Assume each sensor will alternate between two states, active and sleep, whose durations
will be exponential distributed with a mean of
1
. Thus the message arrival is a Poisson
process with arrival rate
. For constant message length of L, constant channel bandwidth
w, the number of time slots required to transmit a message is T=L/w. Then with a service
probability
2
rmp
, the service time of the message is a random variable with Pascal
distribution (Lemma 1 of [6]). That is, the probability that the message can be transmitted
within no more than x time slots, is
Tx
i
i
T
x
pp
T
iT
xF
0
1
1
1
Such a Pascal distribution with mean value of
2
mwr
L
p
T
. Under an average
Poisson arrival rate
and a Pascal service time with
L
mwr
T
p
2
, data
generation and transmission can be modeled as an M/G/1 queue. Then the average
message delivery delay can be expressed as follows:
12
1
222
2
D
where
. For simplicity, we neglect the impact of arrival rate and set
=1, thus
1
1
1
1
2
2
L
mwr
D
This result shows that, by decreasing message length L, or increasing transmission range r
and number of mobile sinks m, the message delivery delay can be reduced. We have
designed simulations to verify our analysis. One thousand five hundred sensor nodes have
been deployed in a 10,000x10,000-m region. The data generation of each sensor nodes
follows a Poisson process with an average arrival interval of 1s. By varying the ratio of sink
velocity against transmission radius, and by varying the number of mobile sinks, we can
evaluate the performance of average message delivery delay and energy consumption, as
illustrated in Figure. 12 and Figure. 13.
Fig. 12. Average message delivery delay under different scenarios by varying the number
and velocity of mobile sinks.
As can be found in Figure. 12, it coincides with our expectation that the more mobile sinks
deployed the less delay for message delivery between sensors and sinks. Besides, the
simulation results are identical with our analysis on choosing the proper speed for mobile
sinks. When the sink mobility is low, the sensors have to wait for a long time before
encountering the sink and delivering the message. When the sink moves too fast, however,
although the sensors meet the sink more frequently, they have to have the long messages
sent successfully in several successive transmissions. In fact, there exists an optimal velocity
under which the message delivery delay will be minimized. Average energy consumption is
illustrated in Figure. 13. By different cluster size, we mean the maximal hop count between
the sensor and mobile sink. It is worthy noting that when the cluster size is small (1 or 2), the
average energy consumption will almost remain constant irrespective of the number of
mobile sinks.
In other words, more deployed mobile sinks will not lead to further reduced energy
consumption. However, when messages can be delivered to a mobile sink multiple hops
away then the number of mobile sinks will have influence on the energy consumption: the
more mobile sinks, the less energy will be consumed. In fact, the energy consumption in
mWSN is more balanced compared with static WSN, which means the remaining energy of
each sensor node is almost equal. It is easily understood that more balanced energy
consumption will lead to more robust network connectivity and longer network lifetime.
Wireless Sensor Networks 246
Fig. 13. Average message delivery delay under different scenarios by varying the cluster size
and member of mobile sinks.
3.3. Outage Probability
In the above subsection, we have calculated the service time distribution for one sensor node
(with multiple mobile sinks). However, while moving along predefined trajectory one
mobile sink may potentially communicate with several sensor nodes simultaneously. In
order for a successful packet delivery, we are interested in finding the relationship between
such parameters as packet length L (number of time slot required is T=l/w), transmission
range r, sink velocity v, and outage probability
outage
p . Here we only qualitatively describe
the relationship between
outage
p and r, v, T. To guarantee the packet transmission
completed in duration T, we first defined a zero-outage zone, as illustrated by the shaded
region H in Figure 14. Nodes lying in H will be guaranteed with zero outage probability,
because the link between sensor & sink remains stable for duration of T with probability 1.
Intuitively, if H is viewed as a queuing system, then the larger the area of H, the higher the
service rate, thus the lower the average outage probability. The border arc of H is the
intersected area of two circles with radius r, and the width of H is determined by (2r-vT).
Therefore, the goal of enlarging the area of H can be achieved via increasing r, or decreasing
v or T. With constant packet length (i.e. constant T), we can choose to increase r or to
decrease v. However, increased r will require for larger transmission power, therefore, it is
more energy efficient by decreasing sink velocity v. Some preliminary simulation results can
verify the expectations on the parameter tuning methods. With 3,000 sensor nodes and one
mobile sink in a 10,000x10,000-m region, when the sink velocity is 15 m/s and transmission
range is 80 m, the outage percentage statistics have been shown in Figure. 15. One can find
that, as analyzed above, the larger the transmission range r is, or the shorter the packet
length T, is, the lower the outage percentage will be.
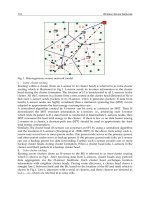
Fig. 14. Illustration for computing the relationship between zero-outage probability and r
It has been shown by Biao et. al. in [29] that with high probability, the average duration d
until which a mobile sink first enters the field of sensor node S is given by,
mcrv
m
d
1log4
where, the constant
1
cc is a scaling factor defined in [33,34], r is the communication
radius of the sensor node, v is the velocity of the mobile sink, m is the number of mobile
sinks present in the network Likewise, to calculate the impact of velocity of mobile sink on
message delay an equation is
Fig. 15. Outage probability vs. r and T
Mobile Wireless Sensor Networks: Architects for Pervasive Computing 247
Fig. 13. Average message delivery delay under different scenarios by varying the cluster size
and member of mobile sinks.
3.3. Outage Probability
In the above subsection, we have calculated the service time distribution for one sensor node
(with multiple mobile sinks). However, while moving along predefined trajectory one
mobile sink may potentially communicate with several sensor nodes simultaneously. In
order for a successful packet delivery, we are interested in finding the relationship between
such parameters as packet length L (number of time slot required is T=l/w), transmission
range r, sink velocity v, and outage probability
outage
p . Here we only qualitatively describe
the relationship between
outage
p and r, v, T. To guarantee the packet transmission
completed in duration T, we first defined a zero-outage zone, as illustrated by the shaded
region H in Figure 14. Nodes lying in H will be guaranteed with zero outage probability,
because the link between sensor & sink remains stable for duration of T with probability 1.
Intuitively, if H is viewed as a queuing system, then the larger the area of H, the higher the
service rate, thus the lower the average outage probability. The border arc of H is the
intersected area of two circles with radius r, and the width of H is determined by (2r-vT).
Therefore, the goal of enlarging the area of H can be achieved via increasing r, or decreasing
v or T. With constant packet length (i.e. constant T), we can choose to increase r or to
decrease v. However, increased r will require for larger transmission power, therefore, it is
more energy efficient by decreasing sink velocity v. Some preliminary simulation results can
verify the expectations on the parameter tuning methods. With 3,000 sensor nodes and one
mobile sink in a 10,000x10,000-m region, when the sink velocity is 15 m/s and transmission
range is 80 m, the outage percentage statistics have been shown in Figure. 15. One can find
that, as analyzed above, the larger the transmission range r is, or the shorter the packet
length T, is, the lower the outage percentage will be.
Fig. 14. Illustration for computing the relationship between zero-outage probability and r
It has been shown by Biao et. al. in [29] that with high probability, the average duration d
until which a mobile sink first enters the field of sensor node S is given by,
mcrv
m
d
1log4
where, the constant
1cc is a scaling factor defined in [33,34], r is the communication
radius of the sensor node, v is the velocity of the mobile sink, m is the number of mobile
sinks present in the network Likewise, to calculate the impact of velocity of mobile sink on
message delay an equation is
Fig. 15. Outage probability vs. r and T
Wireless Sensor Networks 248
derived as a Pascal distribution with Poisson arrival rate
, and a Pascal service time
s
p
, where s is the number of time slots required to transmit a message of length L
within a channel bandwidth of w. Another term p, is the service probability of a sensor node
within the coverage of at least one mobile sink, and is given by,
m
mcrv
p
log4
we define the ratio of the packet arrival rate to the service time as
, and similarly
replace the value of pascal service time to study the impact of sink mobility on delay; the
equation is given by,
Lv
pwr
The average message delivery delay can then be expressed as,
12
1
222
D
Fig. 16. Data success rates in loose-connectivity network
For simplicity, we neglect the impact of arrival rate and set
1
, thus
1
1
D
The above equation therefore implies that on one hand, large v can improve the service
probability p, on the other hand it increases the required times of mobiles sinks reaching it
in order to finish a message transmission. Both sides of the impacts should be considered
when choosing the appropriate velocity value of mobile sinks. The impact of mobility of the
sink on the performance metrics of network connectivity is further highlighted in Figure 16.
A comparison of data success rates between fixed sinks and mobile sinks in spare network is
also presented herewith. In this case, the data success rate produced by mobile sinks is
much better than that by fixed sinks. One of the advantages of mobile sinks is that they can
move to such sensor nodes that are disconnected from others.
4. Future Application Scenarios
The possible application scenarios for traditional wireless sensor networks, which are
envisaged at the moment, include environmental monitoring, military surveillance digitally
equipped homes, health monitoring, manufacturing monitoring, conference, vehicle
tracking and detection (telematics) and monitoring inventory control. Since, mobile wireless
sensor networks are a relatively new concept; its specific, unique application areas are yet to
be clearly defined. Most of its application scenarios are the same as that of traditional
wireless sensor networks, with the only difference of mobility of mobile sink, preferably in
the form of mobile phones. We, however, envisage a space where sensors will be placed
everywhere around us, a concept of ubiquitous network, where different promising
technologies will work together to help realize the dream of late Marc Weiser. We propose
that with these sensors placed everywhere, a single individual mobile phone can enter into a
“session” with the “current sensor network” in which he or she is present. A mobile phone
will have the necessary interfaces available to allow it to communicate with the
heterogeneous world. In most of the cases, this mobile phone will “enter” into the network
as one of the mobile sinks. This way, a mobile phone can enter into the session anywhere at
any time; at airport, railway station, commercial buildings, library, parks, buses, home etc.
We will now discuss some of the possible application scenarios in ubiquitous computing age
as a motivation for future work. This follows that we need to develop smart sensors and
mobile phones to be able to take part in these applications. Mobile phones will be expected
to have multiple radios to support multiple, heterogeneous technologies existing today. We
believe that mobile WSN will be able to address multitude of applications, once the “world”
gets smart.
Smart Transport System: One way in which mobile wireless sensor networks can help is
through implementing an intelligent traffic system. With the sensors placed frequently
around the city, these sensors can monitor and analyze the current traffic system at these
areas at a given time. This information is delivered back to a central gateway or sink, having
a link to different mobile phone operators, which in turn can provide this “traffic help”
service to its customers, on demand.
Security: Similarly, with these sensors placed everywhere in and around the city, these very
sensors can be used to implement security system in daily life. On an individual basis, a
mobile phone of a person can enter into a “session” with the already present sensors in the
Mobile Wireless Sensor Networks: Architects for Pervasive Computing 249
derived as a Pascal distribution with Poisson arrival rate
, and a Pascal service time
s
p
, where s is the number of time slots required to transmit a message of length L
within a channel bandwidth of w. Another term p, is the service probability of a sensor node
within the coverage of at least one mobile sink, and is given by,
m
mcrv
p
log4
we define the ratio of the packet arrival rate to the service time as
, and similarly
replace the value of pascal service time to study the impact of sink mobility on delay; the
equation is given by,
Lv
pwr
The average message delivery delay can then be expressed as,
12
1
222
D
Fig. 16. Data success rates in loose-connectivity network
For simplicity, we neglect the impact of arrival rate and set
1
, thus
1
1
D
The above equation therefore implies that on one hand, large v can improve the service
probability p, on the other hand it increases the required times of mobiles sinks reaching it
in order to finish a message transmission. Both sides of the impacts should be considered
when choosing the appropriate velocity value of mobile sinks. The impact of mobility of the
sink on the performance metrics of network connectivity is further highlighted in Figure 16.
A comparison of data success rates between fixed sinks and mobile sinks in spare network is
also presented herewith. In this case, the data success rate produced by mobile sinks is
much better than that by fixed sinks. One of the advantages of mobile sinks is that they can
move to such sensor nodes that are disconnected from others.
4. Future Application Scenarios
The possible application scenarios for traditional wireless sensor networks, which are
envisaged at the moment, include environmental monitoring, military surveillance digitally
equipped homes, health monitoring, manufacturing monitoring, conference, vehicle
tracking and detection (telematics) and monitoring inventory control. Since, mobile wireless
sensor networks are a relatively new concept; its specific, unique application areas are yet to
be clearly defined. Most of its application scenarios are the same as that of traditional
wireless sensor networks, with the only difference of mobility of mobile sink, preferably in
the form of mobile phones. We, however, envisage a space where sensors will be placed
everywhere around us, a concept of ubiquitous network, where different promising
technologies will work together to help realize the dream of late Marc Weiser. We propose
that with these sensors placed everywhere, a single individual mobile phone can enter into a
“session” with the “current sensor network” in which he or she is present. A mobile phone
will have the necessary interfaces available to allow it to communicate with the
heterogeneous world. In most of the cases, this mobile phone will “enter” into the network
as one of the mobile sinks. This way, a mobile phone can enter into the session anywhere at
any time; at airport, railway station, commercial buildings, library, parks, buses, home etc.
We will now discuss some of the possible application scenarios in ubiquitous computing age
as a motivation for future work. This follows that we need to develop smart sensors and
mobile phones to be able to take part in these applications. Mobile phones will be expected
to have multiple radios to support multiple, heterogeneous technologies existing today. We
believe that mobile WSN will be able to address multitude of applications, once the “world”
gets smart.
Smart Transport System: One way in which mobile wireless sensor networks can help is
through implementing an intelligent traffic system. With the sensors placed frequently
around the city, these sensors can monitor and analyze the current traffic system at these
areas at a given time. This information is delivered back to a central gateway or sink, having
a link to different mobile phone operators, which in turn can provide this “traffic help”
service to its customers, on demand.
Security: Similarly, with these sensors placed everywhere in and around the city, these very
sensors can be used to implement security system in daily life. On an individual basis, a
mobile phone of a person can enter into a “session” with the already present sensors in the
Wireless Sensor Networks 250
area. In this way, it can keep a track of his belongings, car and even kids. Mobile enabled
wireless sensor networks can help to monitor the environment, both external and internal.
For internal environment monitoring, buildings can be made “smart building” to constantly
monitor and analyze the environmental situation.
Social Interaction: One other possible scenario in ubiquitous computing is that of social
interaction. There is a rapid increase in number of mobile subscribers in the world. We
believe that with the possible integration of RFID tags and WSN, mobile phones can act as
sinks to have a “social interaction” among peers who share the common interest. People can
place their digital tags at their places of choice, or among their friends. Similarly, this
combination of RFID tags and WSN can help mobile phones users in using their mobile
phones as “single” tool to carry out all their tasks, be it shopping, billing, information
gathering, guidance, social interaction, etc. By entering into a “session” with existing sensors
or WSN in a particular area, the mobile phone user can get the necessary information on his
mobile phone, like the location of his friends/relatives, the time table/schedule of the events
taking place, environmental conditions etc. With the help of little initial information about
the user, it is also possible to enter into any area, shop around, buy digital tickets and simply
walk off, all with electronic billing. The same idea can be implemented in the form of e-
voting in elections ranging from company elections to elections on much larger scale.
“Context Aware” computation will be a significant key player in helping mobile WSN in
social areas. Coupled with the superior image recognition techniques built in, people can
interact with each other and with the environment. This single advancement in technology
can have an enormous application potential, more than what we can imagine at the
moment.
Health: One area which is already showing such signs of applications of ubiquitous
computing is health monitoring. Emerging developments in this area are providing the
means for people to increase their level of care and independence with specific applications
in heart monitoring and retirement care. In recent years, one area of increasing interest is the
adaptation of “micro grid” technology to operate in and around the human body, connected
via a wireless body area network (WBAN). There are many potential applications that will
be based on WBAN technology, including medical sensing and control, wearable
computing, location awareness and identification. However, we consider only a WBAN
formed from implanted medical sensors. Such devices are being and will be used to monitor
and control medical conditions such as coronary care, diabetes, optical aids, bladder control,
muscle stimulants etc. The advantages of networking medical sensors will be to spread the
memory load, processing load, and improving the access to data. One of the crucial areas in
implanting sensors is the battery lifetime. Batteries cannot be replaced or recharged without
employing a serious medical procedure so it is expected that battery powered medical
devices placed inside the body should last for ten to fifteen years. Networking places an
extra demand on the transceiver and processing operations of the sensor resulting in
increased power consumption. A network placed under a hard energy constraint must
therefore ensure that all sensors are powered down or in sleep mode when not in active use,
yet still provide communications without significant latency when required.
Miscellaneous Scenarios: We focus to concentrate on creating a smart world where a single
user mobile phone can perform a multitude of applications. We envisage a scenario, where
wireless sensor networks will be placed every where around the “smart” city and a person’s
mobile phone can just enter and leave the network as humans. Suppose a person goes into
the shopping mall. With the already installed sensors and RFID tags installed over there, his
mobile phone can interact with the environment. A user looks for his product of choice and
is concerned about the price; he can just inquire through his mobile phone the price of the
same item in other stores, at internet or even from the manufacturer. This will be made
possible by having subscribed service from other retailers, distributors, internet sites or
manufacturers. With the enormous growth of RFID, it is very much expected that every
single item will have its own unique RFID tag, and with the help of grid computing and
advanced database systems, it is not unreasonable to think of a data repository of this
magnitude. For the huge number of sensor data collection, XML, which is good for firewalls
and human readable, will help make sense of complex, huge senor data. We believe that
sensor networks will populate the world as the present Internet does. For example, think of
buildings covered with small, near invisible networked computers, which continually
monitor the temperature of the building and modify it in relation to the amount of people in
the building, thus saving energy. Or sensors buried in the ground, monitoring areas prone
to earthquakes and landslides and providing vital feedback, which could prevent human
loss and mass destruction.
5. Related Technologies for Ubiquitous Computing
In this section, we will highlight some of the existing enabling technologies which are
believed to function along with WSN for the ubiquitous computing paradigm. Some of the
exciting combinations are Mobile IPv6, RFID, P2P and grid technology. P2P and Grid
technology are already believed to play a significant part in realizing the ubiquitous
network dream. Grid and P2P systems share a number of common characteristics and it is
now considered that they are both converging towards creating overlay infrastructures that
support sharing resources among virtual communities that will also reduce the maintenance
cost. We believe that the grid technology will be especially helpful in handling and
managing the huge amount of sensor data that these future ubiquitous heterogeneous
sensor networks will produce. However, a lot of issues remain to be solved to truly integrate
these technologies, the biggest of which is mobility. On the other hand, a number of network
owners will be ready to share information gathered by their networks (for example traffic
status at their current location) for mutual benefit of all involved parties or will deploy
networks with the sole intention of providing services to interested users and charging for
them. In such environment where sensor networks come and go in an ad-hoc manner,
deployed by numerous unrelated service operators, it will be impossible to establish a long
lasting subscriber operator relationship between sensor networks and their users. Users will
not know about the existence of sensor networks in a certain area in advance nor will know
what type of services discovered networks provide. Instead, depending on their current
requirements and needs, users will have to use ad hoc mechanisms to search for required
services and available networks. Obviously, as variety of sensors and network types is
enormous, both service discovery and communication protocols have to be very flexible and
capable of supporting different types and formats of sensor data and services. A description
of different related enabling technologies is now presented.
Mobile IPv6: There exist some characteristics of IPV6 which are attractive to WSN in its
possible integration. We believe that the advantages that we will accrue from IPv6 are
enormous and include some of the followings:
Mobile Wireless Sensor Networks: Architects for Pervasive Computing 251
area. In this way, it can keep a track of his belongings, car and even kids. Mobile enabled
wireless sensor networks can help to monitor the environment, both external and internal.
For internal environment monitoring, buildings can be made “smart building” to constantly
monitor and analyze the environmental situation.
Social Interaction: One other possible scenario in ubiquitous computing is that of social
interaction. There is a rapid increase in number of mobile subscribers in the world. We
believe that with the possible integration of RFID tags and WSN, mobile phones can act as
sinks to have a “social interaction” among peers who share the common interest. People can
place their digital tags at their places of choice, or among their friends. Similarly, this
combination of RFID tags and WSN can help mobile phones users in using their mobile
phones as “single” tool to carry out all their tasks, be it shopping, billing, information
gathering, guidance, social interaction, etc. By entering into a “session” with existing sensors
or WSN in a particular area, the mobile phone user can get the necessary information on his
mobile phone, like the location of his friends/relatives, the time table/schedule of the events
taking place, environmental conditions etc. With the help of little initial information about
the user, it is also possible to enter into any area, shop around, buy digital tickets and simply
walk off, all with electronic billing. The same idea can be implemented in the form of e-
voting in elections ranging from company elections to elections on much larger scale.
“Context Aware” computation will be a significant key player in helping mobile WSN in
social areas. Coupled with the superior image recognition techniques built in, people can
interact with each other and with the environment. This single advancement in technology
can have an enormous application potential, more than what we can imagine at the
moment.
Health: One area which is already showing such signs of applications of ubiquitous
computing is health monitoring. Emerging developments in this area are providing the
means for people to increase their level of care and independence with specific applications
in heart monitoring and retirement care. In recent years, one area of increasing interest is the
adaptation of “micro grid” technology to operate in and around the human body, connected
via a wireless body area network (WBAN). There are many potential applications that will
be based on WBAN technology, including medical sensing and control, wearable
computing, location awareness and identification. However, we consider only a WBAN
formed from implanted medical sensors. Such devices are being and will be used to monitor
and control medical conditions such as coronary care, diabetes, optical aids, bladder control,
muscle stimulants etc. The advantages of networking medical sensors will be to spread the
memory load, processing load, and improving the access to data. One of the crucial areas in
implanting sensors is the battery lifetime. Batteries cannot be replaced or recharged without
employing a serious medical procedure so it is expected that battery powered medical
devices placed inside the body should last for ten to fifteen years. Networking places an
extra demand on the transceiver and processing operations of the sensor resulting in
increased power consumption. A network placed under a hard energy constraint must
therefore ensure that all sensors are powered down or in sleep mode when not in active use,
yet still provide communications without significant latency when required.
Miscellaneous Scenarios: We focus to concentrate on creating a smart world where a single
user mobile phone can perform a multitude of applications. We envisage a scenario, where
wireless sensor networks will be placed every where around the “smart” city and a person’s
mobile phone can just enter and leave the network as humans. Suppose a person goes into
the shopping mall. With the already installed sensors and RFID tags installed over there, his
mobile phone can interact with the environment. A user looks for his product of choice and
is concerned about the price; he can just inquire through his mobile phone the price of the
same item in other stores, at internet or even from the manufacturer. This will be made
possible by having subscribed service from other retailers, distributors, internet sites or
manufacturers. With the enormous growth of RFID, it is very much expected that every
single item will have its own unique RFID tag, and with the help of grid computing and
advanced database systems, it is not unreasonable to think of a data repository of this
magnitude. For the huge number of sensor data collection, XML, which is good for firewalls
and human readable, will help make sense of complex, huge senor data. We believe that
sensor networks will populate the world as the present Internet does. For example, think of
buildings covered with small, near invisible networked computers, which continually
monitor the temperature of the building and modify it in relation to the amount of people in
the building, thus saving energy. Or sensors buried in the ground, monitoring areas prone
to earthquakes and landslides and providing vital feedback, which could prevent human
loss and mass destruction.
5. Related Technologies for Ubiquitous Computing
In this section, we will highlight some of the existing enabling technologies which are
believed to function along with WSN for the ubiquitous computing paradigm. Some of the
exciting combinations are Mobile IPv6, RFID, P2P and grid technology. P2P and Grid
technology are already believed to play a significant part in realizing the ubiquitous
network dream. Grid and P2P systems share a number of common characteristics and it is
now considered that they are both converging towards creating overlay infrastructures that
support sharing resources among virtual communities that will also reduce the maintenance
cost. We believe that the grid technology will be especially helpful in handling and
managing the huge amount of sensor data that these future ubiquitous heterogeneous
sensor networks will produce. However, a lot of issues remain to be solved to truly integrate
these technologies, the biggest of which is mobility. On the other hand, a number of network
owners will be ready to share information gathered by their networks (for example traffic
status at their current location) for mutual benefit of all involved parties or will deploy
networks with the sole intention of providing services to interested users and charging for
them. In such environment where sensor networks come and go in an ad-hoc manner,
deployed by numerous unrelated service operators, it will be impossible to establish a long
lasting subscriber operator relationship between sensor networks and their users. Users will
not know about the existence of sensor networks in a certain area in advance nor will know
what type of services discovered networks provide. Instead, depending on their current
requirements and needs, users will have to use ad hoc mechanisms to search for required
services and available networks. Obviously, as variety of sensors and network types is
enormous, both service discovery and communication protocols have to be very flexible and
capable of supporting different types and formats of sensor data and services. A description
of different related enabling technologies is now presented.
Mobile IPv6: There exist some characteristics of IPV6 which are attractive to WSN in its
possible integration. We believe that the advantages that we will accrue from IPv6 are
enormous and include some of the followings:
Wireless Sensor Networks 252
Enlarge address space: This means IP can increasingly mount up without considering short of
addressing resource. With the possible integration of different technologies, Mobile IPv6
will help solve the addressing problem.
Identification and security: This improvement makes IPV6 more fit to those commercial
applications that need sensitive information and resources.
Access Control: We can make identification and add some access control according to
different username. IPV6 also proposes force management about consistency that can
prevent the data from modifying during the transmission and resist the rebroadcast
aggression. IPV6 also protect the aggression by other services like encryption, ideograph etc.
Auto-configuration: IPV6 supports plug and play network connection. Although we have
seen the common issues about IPV6 and WSN, there still exist some questions to be solved.
Embedded applications are not considered in IPV6 initially, so if we want to realize IPV6 in
WSN we must do effort to the size of the protocol stack. We do not need to realize high layer
stack in each wireless sensor node from the aspect of OSI. Power consumption is another
issue. But if we want to apply IPV6 in WSN, we must reduce its power consumption. This
can be realized through using duty-cycle model.
RFID Technology: RFID tag is the key device for the actualization of "context awareness",
which is essence of ubiquitous computing and can recognize "data carriers" by electronic
wave without physical contact. Auto-ID lab’s EPC (Electronic Product Code) numbering
code is based on 96-bit system, which is believed to be large enough to put electronic tag for
every grain of rice on this planet earth. Contact-less chips in RFID do not have batteries;
they operate using the energy they receive from signals sent by a reader. In context of
integration of RFID technology into wireless sensor networks, probably, the most prominent
integration application will be in the field of retail business. RFID, already, has been making
a major breakthrough in the retail business, with giants like Wal-Mart beginning to embrace
it. Although, RFID can be incorporated on its own in different application areas, it has some
disadvantages, which are the main reasons for research community to pursue research in
integration of RFID with WSN. Some of the disadvantages which make room for integration
of RFID with WSN are
Inability of RFID to successfully track the target object (customer) within a specified
working space (department floor, exhibition etc.).
Deployment of RFID systems on already existed working spaces. For example, if we
have to deploy RFID on a department floor, it will be prohibitivel y expensive to do so.
In this regard one scheme is to implement the combined RFID and WSN technologies in
enhancing the customer relationship management for a retail business. Mobile RFID has
already started getting attention with Nokia incorporating it into its mobile phone, thus
creating the first GSM phone with RFID capabilities. The kit uses the 13.56MHz radio
frequency range at the very short range of typically 2-3cm using the ISO-14443A standard,
and has 2 Xpresson RFID reader shells, 20 RFID tags, and the software for the phone (Nokia
5140) tag reading. The kit is best suited for applications with 1-20 users.
GRID Technology: Grid Computing delivers on the potential in the growth and abundance
of network connected systems and bandwidth: computation, collaboration and
communication over the advanced web. At the heart of Grid Computing is a computing
infrastructure that provides dependable, consistent, pervasive and inexpensive access to
computational capabilities. The main driving force behind grid computing is the desire to
take advantage of idle resources in a network and use these in intensive computations. With
a grid, networked resources desktops, servers, storage, databases, even scientific
instruments – can be combined to deploy massive computing power wherever and
whenever it is needed most. We believe that with the huge amount of sensor data that
future heterogeneous wireless sensor networks will produce, grid technology can be
efficiently used to manage and store this magnitude of data. Technicalities at software and
hardware level remain to be solved. Grid computing, at the moment, is not thought to be
directly integrated into the WSN, but works as a third party in touch with the network base
station or gateway. Playing a direct role can be wireless grid; technology to support less data
intensive applications. Wireless grid technology has already got boost by some good
progress in availability of compatible hardware. Wi-Fi technology and WLAN are supposed
to play a key role in making wireless grid a reality. The wireless grid architecture represents
a combination of high-performance WLAN switches with structured WLAN distribution
systems and is believed to be a key development for the industry. One of the possible
architecture is to employ densely deployed Wi-Fi radios with powerful centralized control
to deliver predictable wired-LAN-like performance with the flexibility of WLANs. As the
current wireless grid, with the help of WLAN standards already can support high data rate
of 54 Mbps, it is therefore well set to integrate into the future densely deployed wireless
sensor networks.
Mobile P2P: Mobile P2P can be simply defined as transferring data from one mobile phone
to another. Some of the limitations that become challenges for mobile P2P to be
implemented are low efficiency (in terms of CPU and Memory), low power, low bandwidth
and billing issues. This concept basically presents the peer-to-peer networking concept that
is widely in use today in fixed communication networks, but mapped to mobile
environment. Each sensor network presents a peer node capable of working and providing
information independently of other peers, but also of communicating with other nodes and
sharing available information with them. Collaboration of completely uncoordinated and
nomadic networks on execution of a common task in a mobile environment is obviously not
easy to implement. Different types of information and services, various data formats and
application requirements, connectivity of and ability to discover sensor networks connected
to different mobile networks are some of the most interesting issues. An idea can be to
expose the WSN to a P2P network and enable the UPnP (Universal Plug n Play) Gateway to
discover remote sensor nodes through the P2P substrate and to instantiate UPnP proxies for
them to ensure client connectivity.
6. Conclusion
Mobile enabled Wireless Sensor Network (mWSN) has been proposed to realize large-scale
information gathering via wireless networking and mobile sinks. Through theoretical
analysis it is established that by learning the mobility pattern of mobile sinks,
char
d based
multi hop clustering scheme can forward the packets to the estimated sink positions in a
timely and most energy-efficient way. Besides, the less strict the packet deadline is, the more
energy saving is achieved. In addition, the mobility’s influence on the performance of
single-hop clustering has been investigated. It is found that sink mobility can reduce the
energy consumption level, and further lengthen the network lifetime. However, its side
effects are the increased message delivery delay and outage probability. The same problems
Mobile Wireless Sensor Networks: Architects for Pervasive Computing 253
Enlarge address space: This means IP can increasingly mount up without considering short of
addressing resource. With the possible integration of different technologies, Mobile IPv6
will help solve the addressing problem.
Identification and security: This improvement makes IPV6 more fit to those commercial
applications that need sensitive information and resources.
Access Control: We can make identification and add some access control according to
different username. IPV6 also proposes force management about consistency that can
prevent the data from modifying during the transmission and resist the rebroadcast
aggression. IPV6 also protect the aggression by other services like encryption, ideograph etc.
Auto-configuration: IPV6 supports plug and play network connection. Although we have
seen the common issues about IPV6 and WSN, there still exist some questions to be solved.
Embedded applications are not considered in IPV6 initially, so if we want to realize IPV6 in
WSN we must do effort to the size of the protocol stack. We do not need to realize high layer
stack in each wireless sensor node from the aspect of OSI. Power consumption is another
issue. But if we want to apply IPV6 in WSN, we must reduce its power consumption. This
can be realized through using duty-cycle model.
RFID Technology: RFID tag is the key device for the actualization of "context awareness",
which is essence of ubiquitous computing and can recognize "data carriers" by electronic
wave without physical contact. Auto-ID lab’s EPC (Electronic Product Code) numbering
code is based on 96-bit system, which is believed to be large enough to put electronic tag for
every grain of rice on this planet earth. Contact-less chips in RFID do not have batteries;
they operate using the energy they receive from signals sent by a reader. In context of
integration of RFID technology into wireless sensor networks, probably, the most prominent
integration application will be in the field of retail business. RFID, already, has been making
a major breakthrough in the retail business, with giants like Wal-Mart beginning to embrace
it. Although, RFID can be incorporated on its own in different application areas, it has some
disadvantages, which are the main reasons for research community to pursue research in
integration of RFID with WSN. Some of the disadvantages which make room for integration
of RFID with WSN are
Inability of RFID to successfully track the target object (customer) within a specified
working space (department floor, exhibition etc.).
Deployment of RFID systems on already existed working spaces. For example, if we
have to deploy RFID on a department floor, it will be prohibitivel y expensive to do so.
In this regard one scheme is to implement the combined RFID and WSN technologies in
enhancing the customer relationship management for a retail business. Mobile RFID has
already started getting attention with Nokia incorporating it into its mobile phone, thus
creating the first GSM phone with RFID capabilities. The kit uses the 13.56MHz radio
frequency range at the very short range of typically 2-3cm using the ISO-14443A standard,
and has 2 Xpresson RFID reader shells, 20 RFID tags, and the software for the phone (Nokia
5140) tag reading. The kit is best suited for applications with 1-20 users.
GRID Technology: Grid Computing delivers on the potential in the growth and abundance
of network connected systems and bandwidth: computation, collaboration and
communication over the advanced web. At the heart of Grid Computing is a computing
infrastructure that provides dependable, consistent, pervasive and inexpensive access to
computational capabilities. The main driving force behind grid computing is the desire to
take advantage of idle resources in a network and use these in intensive computations. With
a grid, networked resources desktops, servers, storage, databases, even scientific
instruments – can be combined to deploy massive computing power wherever and
whenever it is needed most. We believe that with the huge amount of sensor data that
future heterogeneous wireless sensor networks will produce, grid technology can be
efficiently used to manage and store this magnitude of data. Technicalities at software and
hardware level remain to be solved. Grid computing, at the moment, is not thought to be
directly integrated into the WSN, but works as a third party in touch with the network base
station or gateway. Playing a direct role can be wireless grid; technology to support less data
intensive applications. Wireless grid technology has already got boost by some good
progress in availability of compatible hardware. Wi-Fi technology and WLAN are supposed
to play a key role in making wireless grid a reality. The wireless grid architecture represents
a combination of high-performance WLAN switches with structured WLAN distribution
systems and is believed to be a key development for the industry. One of the possible
architecture is to employ densely deployed Wi-Fi radios with powerful centralized control
to deliver predictable wired-LAN-like performance with the flexibility of WLANs. As the
current wireless grid, with the help of WLAN standards already can support high data rate
of 54 Mbps, it is therefore well set to integrate into the future densely deployed wireless
sensor networks.
Mobile P2P: Mobile P2P can be simply defined as transferring data from one mobile phone
to another. Some of the limitations that become challenges for mobile P2P to be
implemented are low efficiency (in terms of CPU and Memory), low power, low bandwidth
and billing issues. This concept basically presents the peer-to-peer networking concept that
is widely in use today in fixed communication networks, but mapped to mobile
environment. Each sensor network presents a peer node capable of working and providing
information independently of other peers, but also of communicating with other nodes and
sharing available information with them. Collaboration of completely uncoordinated and
nomadic networks on execution of a common task in a mobile environment is obviously not
easy to implement. Different types of information and services, various data formats and
application requirements, connectivity of and ability to discover sensor networks connected
to different mobile networks are some of the most interesting issues. An idea can be to
expose the WSN to a P2P network and enable the UPnP (Universal Plug n Play) Gateway to
discover remote sensor nodes through the P2P substrate and to instantiate UPnP proxies for
them to ensure client connectivity.
6. Conclusion
Mobile enabled Wireless Sensor Network (mWSN) has been proposed to realize large-scale
information gathering via wireless networking and mobile sinks. Through theoretical
analysis it is established that by learning the mobility pattern of mobile sinks,
char
d based
multi hop clustering scheme can forward the packets to the estimated sink positions in a
timely and most energy-efficient way. Besides, the less strict the packet deadline is, the more
energy saving is achieved. In addition, the mobility’s influence on the performance of
single-hop clustering has been investigated. It is found that sink mobility can reduce the
energy consumption level, and further lengthen the network lifetime. However, its side
effects are the increased message delivery delay and outage probability. The same problems
Wireless Sensor Networks 254
will remain by tuning the sink density or coverage (i.e. sink amount and transmission
range), so the conclusion is that sink mobility and sink density are permutable, since sink
mobility increase its spatial redundancy similar with deploying multiple sinks.
In this chapter, we have further presented multi-tier architecture for the mobile wireless
sensor network as a key element of future ubiquitous computing paradigm. The multi-tier
architecture has been discussed in previous research for traditional wireless sensor network;
however we consider the multi-tier architecture in mobile WSN, with a special emphasis on
integration into a pervasive network. The detailed architectural implementation is presented
in this chapter, followed by an analysis of the impact of mobility on performance related
issues in WSN. The hierarchical multi tiered architecture is believed to perform efficiently
and is also scalable to large network size. We have further discussed some of the future
application scenarios for this ubiquitous computing age along with a description of some of
the related existing technologies which play a significant role in the proposed architecture.
7. References
[1] I. F. Akyildiz, Weilian Su, Yogesh Sankarasubramaniam, and Erdal Cayirci, “A Survey
on Sensor Networks”, IEEE Communications Magazine, 2002 (August).
[2] F. Ye, H. Luo, J. Cheng, and S.L.L. Zhang, “A Two Tier Data Dissemination Model for
Large scale Wireless Sensor Networks” Proc. of MOBICOM_02, Atlanta, Georgia,
USA, 2002, pp.148–159 (September 23–26).
[3] R.C. Shah et al., “Data MULEs: Modeling a Three-tier Architecture for Sparse Sensor
Networks” Proc. of IEEE SPNA workshop, 2003, pp. 30–41 (May 11).
[4] S. Jain et al., “Exploiting Mobility for Energy Efficient Data Collection in Wireless Sensor
Networks” Mobile Networks and Applications, vol. 11, no. 3, 2006, pp. 327– 339
(June).
[5] L. Tong, Q. Zhao, and S. Adireddy, “Sensor networks with mobile agents” Proc. of IEEE
MILCOM 2003, Boston, MA, USA, 2003, pp.688–693 (October 13–16).
[6] Y. Wang and H. Wu, “DFT-MSN: The Delay Fault Tolerant Mobile Sensor Network for
Pervasive Information Gathering” Proc. of IEEE INFOCOM_06, Barcelona, Spain,
2006 (April 23–29).
[7] B. Hull et al., “CarTel: A Distributed Mobile Sensor Computing System” Proc. of ACM
SenSys_06 (October 31–November 3).
[8] W. Zhao, et al., “A Message Ferrying Approach for Data Delivery in Sparse Mobile Ad
Hoc Networks” Proc. of MobiHoc 2004, Roppongi, Japan, 2004, pp. 187–198 (May
24–26).
[9] W. Zhao et al., “Controlling the Mobility of Multiple Data Transport Ferries in a Delay-
Tolerant Network” Proc. Of INFOCOM 2005, Miami, Florida, USA, 2005, pp.
1407–1418 (March 13–17).
[10] M.M.B. Tariq, et al., “Message Ferry Route Design for Sparse Ad hoc Networks with
Mobile Nodes” Proc. of MobiHoc 2006, Florence, Italy, 2006, pp. 37–48 (May 22–
25).
[11] A.A. Somasundara, A. Ramamoorthy, and M. B. Srivastava, “Mobile Element
Scheduling for Efficient Data Collection in Wireless Sensor Networks with
Dynamic Deadlines” Proc. Of IEEE int_l Real-Time Sys. Symp., Lisbon, Portugal,
2004, pp. 296–305 (December 5–8).
[12] E. Ekici et al., “Mobility-Based Communication in Wireless Sensor Networks” IEEE
Communications Magazine, vol. 44, no. 7, 2006, pp. 56–62 (July).
[13] A. Kansal et al., “Intelligent Fluid Infrastructure for Embedded Networks,^ Proc. of
MobiSys 2004” Boston, Massachusetts, USA, 2004 pp. 111–124 (June 6–9).
[14] D. Jea et al., “Multiple Controlled Mobile Elements (DataMules) for Data Collection in
Sensor Networks” Proc. of DCOSS 2005, Marina del Rey, CA, USA, 2005 (June
30–July 1).
[15] A. Somasundara et al., “Controllably Mobile Infrastructure for Low Energy Embedded
Networks” IEEE Transactions on Mobile Computing, vol. 5, no. 8, 2006, pp. 958–
973 (August).
[16] A. Chakrabarti et al., “Using Predictable Observer Mobility for Power Efficient Design
of Sensor Networks” Proc. Of IPSN 2003, Palo Alto, California, USA, 2003 (April
22–23).
[17] H.S. Kim et al., “Minimum-Energy Asynchronous Dissemination to Mobile Sinks in
Wireless Sensor Networks” Proc. Of SenSys 2003, Los Angeles, California, USA,
2003, pp. 193–204 (November 5–7).
[18] K. Akkaya and M. Younis, “Energy-aware Routing to a Mobile Gateway in Wireless
Sensor Networks” Proc. of Globecom 2004, Dallas, Texas, USA, 2004, pp.16–21
(November 29– December 3).
[19] P. Baruah & R. Urgaonkar, “Learning-Enforced Time Domain Routing to Mobile Sinks
in Wireless Sensor Fields” Proc. of LCN 2004, Tampa, Florida, 2004 (November
16–18).
[20] J. Luo and J P. Hubaux, “Joint Mobility and Routing for Lifetime Elongation in Wireless
Sensor Networks” Proc. Of INFOCOM 2005, Miami, USA, 2005, pp. 1735–1746
(March 13–17).
[21] J. Luo et al., “MobiRoute: Routing towards a Mobile Sink for Improving Lifetime in
Sensor Networks” Proc. of DCOSS 2006, San Francisco, CA, USA, 2006 (June 18–
20).
[22] S.R.Grandham et al., “Energy Efficient Schemes for Wireless Sensor Networks with
Multiple Mobile Base Stations” Proc. of IEEE Globecom 2003, San Francisco, CA,
USA, 2003, pp. 377–381 (December 1–5).
[23] Z.M. Wang et al., “Exploiting Sink Mobility for Maximizing Sensor Networks Lifetime”
Proc. of HICSS 2005, Hawaii, 2005 (January 3–6).
[24] W.Wang et al., “UsingMobile Relays to Prolong the Lifetime of Wireless Sensor
Networks” Proc. of MobiCom 2005, Cologne, Germany, 2005, pp. 270–283
(August 28 – September 2).
[25] Y.T. Hou et al., “Prolonging Sensor Network Lifetime with Energy Provisioning and
Relay Node Placement” Proc. Of SECON 2005, Santa Clara, California, USA, 2005
(September 26–29).
[26] S. Eidenbenz et al., “Maneuverable Relays to Improve Energy Efficiency in Sensor
Networks” Proc. of PerCom 2005 Workshops, Hawaii, 2005, pp. 411–417, (March
8–12).
[27] Z. Vincze et al., “Adaptive Sink Mobility in Event-driven Multihop Wireless Sensor
Networks” Proc. of InterSense 2006, Nice, France, 2006 (May 30–31).
Mobile Wireless Sensor Networks: Architects for Pervasive Computing 255
will remain by tuning the sink density or coverage (i.e. sink amount and transmission
range), so the conclusion is that sink mobility and sink density are permutable, since sink
mobility increase its spatial redundancy similar with deploying multiple sinks.
In this chapter, we have further presented multi-tier architecture for the mobile wireless
sensor network as a key element of future ubiquitous computing paradigm. The multi-tier
architecture has been discussed in previous research for traditional wireless sensor network;
however we consider the multi-tier architecture in mobile WSN, with a special emphasis on
integration into a pervasive network. The detailed architectural implementation is presented
in this chapter, followed by an analysis of the impact of mobility on performance related
issues in WSN. The hierarchical multi tiered architecture is believed to perform efficiently
and is also scalable to large network size. We have further discussed some of the future
application scenarios for this ubiquitous computing age along with a description of some of
the related existing technologies which play a significant role in the proposed architecture.
7. References
[1] I. F. Akyildiz, Weilian Su, Yogesh Sankarasubramaniam, and Erdal Cayirci, “A Survey
on Sensor Networks”, IEEE Communications Magazine, 2002 (August).
[2] F. Ye, H. Luo, J. Cheng, and S.L.L. Zhang, “A Two Tier Data Dissemination Model for
Large scale Wireless Sensor Networks” Proc. of MOBICOM_02, Atlanta, Georgia,
USA, 2002, pp.148–159 (September 23–26).
[3] R.C. Shah et al., “Data MULEs: Modeling a Three-tier Architecture for Sparse Sensor
Networks” Proc. of IEEE SPNA workshop, 2003, pp. 30–41 (May 11).
[4] S. Jain et al., “Exploiting Mobility for Energy Efficient Data Collection in Wireless Sensor
Networks” Mobile Networks and Applications, vol. 11, no. 3, 2006, pp. 327– 339
(June).
[5] L. Tong, Q. Zhao, and S. Adireddy, “Sensor networks with mobile agents” Proc. of IEEE
MILCOM 2003, Boston, MA, USA, 2003, pp.688–693 (October 13–16).
[6] Y. Wang and H. Wu, “DFT-MSN: The Delay Fault Tolerant Mobile Sensor Network for
Pervasive Information Gathering” Proc. of IEEE INFOCOM_06, Barcelona, Spain,
2006 (April 23–29).
[7] B. Hull et al., “CarTel: A Distributed Mobile Sensor Computing System” Proc. of ACM
SenSys_06 (October 31–November 3).
[8] W. Zhao, et al., “A Message Ferrying Approach for Data Delivery in Sparse Mobile Ad
Hoc Networks” Proc. of MobiHoc 2004, Roppongi, Japan, 2004, pp. 187–198 (May
24–26).
[9] W. Zhao et al., “Controlling the Mobility of Multiple Data Transport Ferries in a Delay-
Tolerant Network” Proc. Of INFOCOM 2005, Miami, Florida, USA, 2005, pp.
1407–1418 (March 13–17).
[10] M.M.B. Tariq, et al., “Message Ferry Route Design for Sparse Ad hoc Networks with
Mobile Nodes” Proc. of MobiHoc 2006, Florence, Italy, 2006, pp. 37–48 (May 22–
25).
[11] A.A. Somasundara, A. Ramamoorthy, and M. B. Srivastava, “Mobile Element
Scheduling for Efficient Data Collection in Wireless Sensor Networks with
Dynamic Deadlines” Proc. Of IEEE int_l Real-Time Sys. Symp., Lisbon, Portugal,
2004, pp. 296–305 (December 5–8).
[12] E. Ekici et al., “Mobility-Based Communication in Wireless Sensor Networks” IEEE
Communications Magazine, vol. 44, no. 7, 2006, pp. 56–62 (July).
[13] A. Kansal et al., “Intelligent Fluid Infrastructure for Embedded Networks,^ Proc. of
MobiSys 2004” Boston, Massachusetts, USA, 2004 pp. 111–124 (June 6–9).
[14] D. Jea et al., “Multiple Controlled Mobile Elements (DataMules) for Data Collection in
Sensor Networks” Proc. of DCOSS 2005, Marina del Rey, CA, USA, 2005 (June
30–July 1).
[15] A. Somasundara et al., “Controllably Mobile Infrastructure for Low Energy Embedded
Networks” IEEE Transactions on Mobile Computing, vol. 5, no. 8, 2006, pp. 958–
973 (August).
[16] A. Chakrabarti et al., “Using Predictable Observer Mobility for Power Efficient Design
of Sensor Networks” Proc. Of IPSN 2003, Palo Alto, California, USA, 2003 (April
22–23).
[17] H.S. Kim et al., “Minimum-Energy Asynchronous Dissemination to Mobile Sinks in
Wireless Sensor Networks” Proc. Of SenSys 2003, Los Angeles, California, USA,
2003, pp. 193–204 (November 5–7).
[18] K. Akkaya and M. Younis, “Energy-aware Routing to a Mobile Gateway in Wireless
Sensor Networks” Proc. of Globecom 2004, Dallas, Texas, USA, 2004, pp.16–21
(November 29– December 3).
[19] P. Baruah & R. Urgaonkar, “Learning-Enforced Time Domain Routing to Mobile Sinks
in Wireless Sensor Fields” Proc. of LCN 2004, Tampa, Florida, 2004 (November
16–18).
[20] J. Luo and J P. Hubaux, “Joint Mobility and Routing for Lifetime Elongation in Wireless
Sensor Networks” Proc. Of INFOCOM 2005, Miami, USA, 2005, pp. 1735–1746
(March 13–17).
[21] J. Luo et al., “MobiRoute: Routing towards a Mobile Sink for Improving Lifetime in
Sensor Networks” Proc. of DCOSS 2006, San Francisco, CA, USA, 2006 (June 18–
20).
[22] S.R.Grandham et al., “Energy Efficient Schemes for Wireless Sensor Networks with
Multiple Mobile Base Stations” Proc. of IEEE Globecom 2003, San Francisco, CA,
USA, 2003, pp. 377–381 (December 1–5).
[23] Z.M. Wang et al., “Exploiting Sink Mobility for Maximizing Sensor Networks Lifetime”
Proc. of HICSS 2005, Hawaii, 2005 (January 3–6).
[24] W.Wang et al., “UsingMobile Relays to Prolong the Lifetime of Wireless Sensor
Networks” Proc. of MobiCom 2005, Cologne, Germany, 2005, pp. 270–283
(August 28 – September 2).
[25] Y.T. Hou et al., “Prolonging Sensor Network Lifetime with Energy Provisioning and
Relay Node Placement” Proc. Of SECON 2005, Santa Clara, California, USA, 2005
(September 26–29).
[26] S. Eidenbenz et al., “Maneuverable Relays to Improve Energy Efficiency in Sensor
Networks” Proc. of PerCom 2005 Workshops, Hawaii, 2005, pp. 411–417, (March
8–12).
[27] Z. Vincze et al., “Adaptive Sink Mobility in Event-driven Multihop Wireless Sensor
Networks” Proc. of InterSense 2006, Nice, France, 2006 (May 30–31).
Wireless Sensor Networks 256
[28] L. Sun, Y. Bi, and J. Ma, “A Moving Strategy for Mobile Sinks in Wireless Sensor
Networks” Proc. of IEEE SECON_06 (poster), Reston, VA, USA, 2006 (September
25–28).
[29] B. Ren, J.Ma, and C. Chen, “The Hybrid Mobile Wireless Sensor Networks for Data
Gathering” Proc. of International Wireless Communications and Mobile
Computing Conference (IWCMC_06), Vancouver, Canada, 2006 pp. 1085–1090
(July 3–6).
[30] Liu, B., Brass, P., Dousse, O., Nain, P., Towsley, D. “Mobility Improve Coverage of
Sensor Networks,” Proceedings of ACM MobiHoc 2005
[31] Mark Weiser, "The Computer for the Twenty-First Century," Scientific American,
September 1991
[32] Canfeng Chen, Jian Ma, “MEMOSEN: Multi-radio enabled Mobile Wireless Sensor
Network” In Proc. of AINA 2006
[33] Y. Wang and H. Wu, “DFT-MSN: The Delay Fault Tolerant Mobile Sensor Network for
Pervasive Information Gathering”, In Proc. Of IEEE InfoCOM’06, Barcelona, Spain,
April 23-29, 2006
[34] N. Bansal and Z. Liu, “Capacity, delay, and mobility in wireless ad hoc networks”, In
Proc. of IEEE InfoCOM, Vol. 3, 2003
Enabling Compression in Tiny Wireless Sensor Nodes 257
Enabling Compression in Tiny Wireless Sensor Nodes
Francesco Marcelloni and Massimo Vecchio
X
Enabling Compression in Tiny
Wireless Sensor Nodes
Francesco Marcelloni
1
and Massimo Vecchio
2
1
Dipartimento di Ingegneria dell’Informazione, University of Pisa, Via Diotisalvi 2, 56122
Pisa, Italy, e-mail:
2
INRIA Saclay, Ile de France sud, France, e-mail:
1. Introduction
A Wireless Sensor Network (WSN) is a network composed of sensor nodes communicating
among themselves and deployed in large scale (from tens to thousands) for applications
such as environmental, habitat and structural monitoring, disaster management, equipment
diagnostic, alarm detection, and target classification. In WSNs, typically, sensor nodes are
randomly distributed over the area under observation with very high density. Each node is
a small device able to collect information from the surrounding environment through one or
more sensors, to elaborate this information locally and to communicate it to a data collection
centre called sink or base station. WSNs are currently an active research area mainly due to
the potential of their applications. However, the deployment of a large scale WSN still
requires solutions to a number of technical challenges that stem primarily from the features
of the sensor nodes such as limited computational power, reduced communication
bandwidth and small storage capacity. Further, since sensor nodes are typically powered by
batteries with a limited capacity, energy is a primary constraint in the design and
deployment of WSNs.
Datasheets of commercial sensor nodes show that data communication is very expensive in
terms of energy consumption, whereas data processing consumes significantly less: the
energy cost of receiving or transmitting a single bit of information is approximately the
same as that required by the processing unit for executing a thousand operations. On the
other hand, the energy consumption of the sensing unit depends on the specific sensor type.
In several cases, however, it is negligible with respect to the energy consumed by the
communication unit and sometimes also by the processing unit. Thus, to extend the lifetime
of a WSN, most of the energy conservation schemes proposed in the literature aim to
minimize the energy consumption of the communication unit (Croce et al., 2008). To achieve
this objective, two main approaches have been followed: power saving through duty cycling
and in-network processing. Duty cycling schemes define coordinated sleep/wakeup
schedules among nodes in the network. A detailed description of these techniques applied
to WSNs can be found in (Anastasi et al., 2009). On the other hand, in-network processing
consists in reducing the amount of information to be transmitted by means of aggregation
(Boulis et al., 2003) (Croce et al., 2008) (Di Bacco et al., 2004) (Fan et al., 2007)
12
Wireless Sensor Networks 258
(Intanagonwiwat et al., 2003) (Lindsey et al., 2002) (Madden et al., 2002) and/or
compression techniques. In this chapter, we do not consider aggregation: the interested
reader can refer to (Fasolo et al., 2007) for a brief discussion and classification of aggregation
approaches.
Data compression algorithms fall into two broad classes: lossless and lossy algorithms.
Lossless algorithms guarantee the integrity of data during the compression/decompression
process. On the contrary, lossy algorithms generate a loss of information, but generally
ensure a higher compression ratio.
Due to the limited resources available in sensor nodes, to apply data compression in WSNs
requires specifically designed algorithms. Two approaches have been followed:
1. to distribute the computational cost on the overall network (Chen et al., 2004)
(Ciancio & Ortega, 2005) (Ciancio et al., 2006) (Deligiannakis et al., 2004) (Ganesan
et al., 2003) (Gastpar et al., 2006) (Girod et al., 2005) (Guestrin et al., 2004) (Lin et al.,
2006) (Pradhan et al., 2002) (Rebollo-Monedero, 2007) (Tang & Raghavendra, 2004),
(Wagner et al., 2007) (Zixiang et al., 2004);
2. to exploit the statistical features of the data under monitoring so as to adapt some
existing algorithms to the constraints imposed by the limited resources available on
the sensor nodes (Ganesan et al., 2003) (Lynch et al., 2004) (Sadler & Martonosi,
2006).
The first approach is natural in cooperative and dense WSNs, where data measured by
neighbouring nodes are correlated both in space and in time. Thus, we can apply distributed
transforms or estimate distributed models which allow decorrelating the data measured by
sensors, and, therefore, representing these data by using fewer bits. Obviously, the models
are generally only approximations of the data. Thus, distributed compression algorithms are
intrinsically lossy.
To the best of our knowledge, only a few papers have discussed the second approach.
Examples of compression techniques applied to the single node adapt some existing
dictionary-based compression algorithms to the constraints imposed by the limited
resources available on the sensor nodes. For instance, in (Sadler & Martonosi, 2006) and
(LZO, 2008), the authors have introduced two lossless compression algorithms, namely S-
LZW and miniLZO, which are purposely adapted versions of LZW (Welch, 1984) and LZ77
(Ziv & Lempel, 1977), respectively. Since S-LZW outperforms miniLZO, as shown in (Sadler
& Martonosi, 2006), we will consider only S-LZW as comparison in this chapter. The
Lightweight Temporal Compression (LTC) algorithm proposed in (Schoellhammer et al.,
2004) is an efficient and simple lossy compression technique for the context of habitat
monitoring. LTC introduces a small amount of error into each reading bounded by a control
knob: the larger the bound on this error, the greater the saving by compression.
The choice of the algorithm type (lossless or lossy) depends on the specific application
domain. Typically, applications, which are not particularly critical, tolerate the use of
sensors that, though very cheap, collect data affected by a non-negligible noise. In this
context, lossy compression algorithms can provide a double advantage: to reduce noise and
to compress data (Ganesan et al., 2003). On the other hand, the criticality of some application
domains demands sensors with high accuracy and cannot tolerate that measures, are
corrupted by the compression process. In Body Area Networks, for instance, sensor nodes
permanently monitor and log vital signs: each small variation of these signs have to be
captured because it might provide crucial information to make a diagnosis. Thus, we believe
that both lossless and lossy compression algorithms suitable to WSNs have to be deeply
investigated. Since sensor nodes are typically equipped with a few kilobytes of memory and
a 4-8MHz microprocessor, embedding classical data compression schemes in these tiny
nodes is practically infeasible
(Barr & Asanović, 2006) (Kimura & Latifi, 2005).
To overcome these problems, in a previous paper (Marcelloni & Vecchio, 2009), we have
proposed a Lossless Entropy Compression algorithm (LEC), which exploits the natural
correlation that exists in data typically collected by WSNs and the principles of entropy
compression. We have shown how its low complexity and the small amount of memory
required for its execution make the algorithm particularly suited to be used on available
commercial sensor nodes. Other important features of LEC are i) its ability to compute a
compressed version of each value on the fly and ii) to exploit a very short fixed dictionary,
whose size depends on the precision of the analog-to-digital converter (ADC).
The LEC algorithm follows a scheme similar to the one used in the baseline JPEG algorithm
for compressing the so-called DC coefficients of a digital image: the basic idea is to divide
the alphabet of values into groups whose sizes increase exponentially and consequently to
implement the codewords as a hybrid of entropy and binary codes (Pennebaker & Mitchell,
1992). In particular, the entropy code (a variable-length code) specifies the group, while the
binary code (a fixed-length code) represents the index within the group. In (Marcelloni &
Vecchio, 2009), we have adopted the Huffman table proposed in JPEG to entropy encoding
the groups.
In this chapter, first we briefly introduce the LEC algorithm and, by using two real datasets,
we discuss how the LEC algorithm outperforms S-LZW and three well-known compression
algorithms, namely gzip, bzip2 and rar. We used these three algorithms as benchmarks, but
actually these algorithms are not embeddable in tiny sensor nodes. Second, we analyze how
the correlation between consecutive samples affects the performance of LEC by
downsampling the datasets with different downsampling factors and by evaluating how
much the compression ratio decreases. Third, we investigate the use of semi-adaptive and
adaptive Huffman coding to increase the performance in the case of reduced correlation
between consecutive samples. Fourth, we discuss how LEC can be transformed into a lossy
compression algorithm and show how the lossy version considerably outperforms the
lossless version in terms of compression ratios without introducing a significant error.
Finally, we compare the lossy version of LEC with LTC.
The Chapter is organized as
follows. Section 2 introduces the LEC algorithm. In Section 3,
we assess the performance of LEC in terms of compression ratios and complexity. Section 4
introduces the lossy version of LEC and shows some preliminary experimental results.
Finally, Section 5 gives some conclusions.
2. The LEC Algorithm
Figure 1 shows the block scheme of the LEC algorithm. In the sensing unit of a sensor node,
each measure m
i
acquired by a sensor is converted by an ADC to a binary representation r
i
on R bits, where R is the resolution of the ADC, that is, the number (2
R
) of discrete values
the ADC can produce over the range of analog values.
For each new acquisition m
i
, LEC computes the difference d
i
= r
i
- r
i-1
, which is input to an
entropy encoder (in order to compute d
0
we assume that r
-1
is equal to the central value
among the 2
R
possible discrete values). The entropy encoder performs compression
Enabling Compression in Tiny Wireless Sensor Nodes 259
(Intanagonwiwat et al., 2003) (Lindsey et al., 2002) (Madden et al., 2002) and/or
compression techniques. In this chapter, we do not consider aggregation: the interested
reader can refer to (Fasolo et al., 2007) for a brief discussion and classification of aggregation
approaches.
Data compression algorithms fall into two broad classes: lossless and lossy algorithms.
Lossless algorithms guarantee the integrity of data during the compression/decompression
process. On the contrary, lossy algorithms generate a loss of information, but generally
ensure a higher compression ratio.
Due to the limited resources available in sensor nodes, to apply data compression in WSNs
requires specifically designed algorithms. Two approaches have been followed:
1. to distribute the computational cost on the overall network (Chen et al., 2004)
(Ciancio & Ortega, 2005) (Ciancio et al., 2006) (Deligiannakis et al., 2004) (Ganesan
et al., 2003) (Gastpar et al., 2006) (Girod et al., 2005) (Guestrin et al., 2004) (Lin et al.,
2006) (Pradhan et al., 2002) (Rebollo-Monedero, 2007) (Tang & Raghavendra, 2004),
(Wagner et al., 2007) (Zixiang et al., 2004);
2. to exploit the statistical features of the data under monitoring so as to adapt some
existing algorithms to the constraints imposed by the limited resources available on
the sensor nodes (Ganesan et al., 2003) (Lynch et al., 2004) (Sadler & Martonosi,
2006).
The first approach is natural in cooperative and dense WSNs, where data measured by
neighbouring nodes are correlated both in space and in time. Thus, we can apply distributed
transforms or estimate distributed models which allow decorrelating the data measured by
sensors, and, therefore, representing these data by using fewer bits. Obviously, the models
are generally only approximations of the data. Thus, distributed compression algorithms are
intrinsically lossy.
To the best of our knowledge, only a few papers have discussed the second approach.
Examples of compression techniques applied to the single node adapt some existing
dictionary-based compression algorithms to the constraints imposed by the limited
resources available on the sensor nodes. For instance, in (Sadler & Martonosi, 2006) and
(LZO, 2008), the authors have introduced two lossless compression algorithms, namely S-
LZW and miniLZO, which are purposely adapted versions of LZW (Welch, 1984) and LZ77
(Ziv & Lempel, 1977), respectively. Since S-LZW outperforms miniLZO, as shown in (Sadler
& Martonosi, 2006), we will consider only S-LZW as comparison in this chapter. The
Lightweight Temporal Compression (LTC) algorithm proposed in (Schoellhammer et al.,
2004) is an efficient and simple lossy compression technique for the context of habitat
monitoring. LTC introduces a small amount of error into each reading bounded by a control
knob: the larger the bound on this error, the greater the saving by compression.
The choice of the algorithm type (lossless or lossy) depends on the specific application
domain. Typically, applications, which are not particularly critical, tolerate the use of
sensors that, though very cheap, collect data affected by a non-negligible noise. In this
context, lossy compression algorithms can provide a double advantage: to reduce noise and
to compress data (Ganesan et al., 2003). On the other hand, the criticality of some application
domains demands sensors with high accuracy and cannot tolerate that measures, are
corrupted by the compression process. In Body Area Networks, for instance, sensor nodes
permanently monitor and log vital signs: each small variation of these signs have to be
captured because it might provide crucial information to make a diagnosis. Thus, we believe
that both lossless and lossy compression algorithms suitable to WSNs have to be deeply
investigated. Since sensor nodes are typically equipped with a few kilobytes of memory and
a 4-8MHz microprocessor, embedding classical data compression schemes in these tiny
nodes is practically infeasible
(Barr & Asanović, 2006) (Kimura & Latifi, 2005).
To overcome these problems, in a previous paper (Marcelloni & Vecchio, 2009), we have
proposed a Lossless Entropy Compression algorithm (LEC), which exploits the natural
correlation that exists in data typically collected by WSNs and the principles of entropy
compression. We have shown how its low complexity and the small amount of memory
required for its execution make the algorithm particularly suited to be used on available
commercial sensor nodes. Other important features of LEC are i) its ability to compute a
compressed version of each value on the fly and ii) to exploit a very short fixed dictionary,
whose size depends on the precision of the analog-to-digital converter (ADC).
The LEC algorithm follows a scheme similar to the one used in the baseline JPEG algorithm
for compressing the so-called DC coefficients of a digital image: the basic idea is to divide
the alphabet of values into groups whose sizes increase exponentially and consequently to
implement the codewords as a hybrid of entropy and binary codes (Pennebaker & Mitchell,
1992). In particular, the entropy code (a variable-length code) specifies the group, while the
binary code (a fixed-length code) represents the index within the group. In (Marcelloni &
Vecchio, 2009), we have adopted the Huffman table proposed in JPEG to entropy encoding
the groups.
In this chapter, first we briefly introduce the LEC algorithm and, by using two real datasets,
we discuss how the LEC algorithm outperforms S-LZW and three well-known compression
algorithms, namely gzip, bzip2 and rar. We used these three algorithms as benchmarks, but
actually these algorithms are not embeddable in tiny sensor nodes. Second, we analyze how
the correlation between consecutive samples affects the performance of LEC by
downsampling the datasets with different downsampling factors and by evaluating how
much the compression ratio decreases. Third, we investigate the use of semi-adaptive and
adaptive Huffman coding to increase the performance in the case of reduced correlation
between consecutive samples. Fourth, we discuss how LEC can be transformed into a lossy
compression algorithm and show how the lossy version considerably outperforms the
lossless version in terms of compression ratios without introducing a significant error.
Finally, we compare the lossy version of LEC with LTC.
The Chapter is organized as
follows. Section 2 introduces the LEC algorithm. In Section 3,
we assess the performance of LEC in terms of compression ratios and complexity. Section 4
introduces the lossy version of LEC and shows some preliminary experimental results.
Finally, Section 5 gives some conclusions.
2. The LEC Algorithm
Figure 1 shows the block scheme of the LEC algorithm. In the sensing unit of a sensor node,
each measure m
i
acquired by a sensor is converted by an ADC to a binary representation r
i
on R bits, where R is the resolution of the ADC, that is, the number (2
R
) of discrete values
the ADC can produce over the range of analog values.
For each new acquisition m
i
, LEC computes the difference d
i
= r
i
- r
i-1
, which is input to an
entropy encoder (in order to compute d
0
we assume that r
-1
is equal to the central value
among the 2
R
possible discrete values). The entropy encoder performs compression
Wireless Sensor Networks 260
losslessly by encoding differences d
i
more compactly based on their statistical
characteristics. LEC exploits a modified version of the Exponential-Golomb code (Exp-
Golomb) of order 0 (Teuhola, 1978), which is a type of universal code. The basic idea is to
divide the alphabet of numbers into groups whose sizes increase exponentially. Like in
Golomb coding (Golomb, 1966) and Elias coding (Elias, 1975), a codeword is a hybrid of
unary and binary codes: in particular, the unary code (a variable-length code) specifies the
group, while the binary code (a fixed-length code) represents the index within the group.
Indeed, each nonzero d
i
value is represented as a bit sequence bs
i
composed of two parts
s
i
|a
i
, where s
i
codifies the number n
i
of bits needed to represent d
i
(that is, the group to
which d
i
belongs) and a
i
is the representation of d
i
(that is, the index position in the group).
When d
i
is equal to 0, the corresponding group has size equal to 1 and therefore there is no
need to codify the index position in the group: it follows that a
i
is not represented.
COMPRESSOR
DELAY
ENCODER
r
i
d
i
r
i-1
-
+
bs
i
UNCOMPRESSOR
DECODER
bs
i
DELAY
+
+
i
d
i-1
r
i
r
Fig. 1. Block diagram of the encoding/decoding schemes.
For any nonzero d
i
, n
i
is trivially computed as
2
log
i
d
: at most n
i
is equal to R. Thus, in
order to encode n
i
a prefix-free table of R + 1 entries has to be specified. This table depends
on the distribution of the differences d
i
: more frequent differences have to be associated with
shorter codes. From the observation that, in typical data collected by WSNs, the most
frequent differences are those close to 0, in (Marcelloni & Vecchio, 2009) we adopted Table 1,
where the first 11 lines coincide with the table used in the baseline JPEG algorithm for
compressing the DC coefficients (Pennebaker & Mitchell, 1992). On the other hand, these
coefficients have statistical characteristics similar to the measures acquired by the sensing
unit. Of course, whether the resolution of the ADC is larger than 14 bits, the table has to be
appropriately extended.
In order to manage negative d
i
, LEC maps the input differences onto nonnegative indexes,
using the following bijection:
,
0
0
2 1 ,
i
i
i
n
i
i
d
d
index
d
d
(1)
Finally, s
i
is equal to the value at entry n
i
in the prefix-free table and a
i
is the binary
representation of index over n
i
bits. Since d
i
is typically represented in two’s complement
notation, when
0
i
d
, a
i
is equal to the n
i
low-order bits of d
i
– 1.
The procedure used to generate a
i
guarantees that all possible values have different codes.
Using Table 1, we have, for instance, that d
i
= 0, d
i
= +1, d
i
= -1, d
i
= +255 and d
i
= -255 are
encoded as 00, 010|1, 010|0, 111110|11111111 and 111110|00000000, respectively. Once bs
i
is generated, it is appended to the bitstream which forms the compressed version of the
sequence of measures m
i
.
In the uncompressor, the bit sequence bs
i
is analyzed by the decoder block which outputs
difference d
i
. Difference d
i
is added to r
i-1
to produce r
i
.
n
i
s
i
d
i
0 00 0
1 010 -1,+1
2 011 -3,-2,+2,+3
3 100 -7,…,-4,+4,…,+7
4 101 -15,…,-8,+8,…,+15
5 110 -31,…,-16,+16,…,+31
6 1110 -63,…,-32,+32,…,+63
7 11110 -127,…,-64,+64,…,+127
8 111110 -255,…,-128,+128,…,+255
9 1111110 -511,…-256,+256,…,+511
10 11111110 -1023,…,-512,+512, …,+1023
11 111111110 -2047, …,-1024,+1024, …,+2047
12 1111111110 -4095, …,-2048,+2048, …,+4095
13 11111111110 -8191, …,-4096,+4096, …,+8191
14 111111111110 -16383, …,-8192,+8192, …,+16383
Table 1. The default dictionary table.
3. Performance Assessment Results
In our experiments, we have used the temperature and relative humidity measurements
collected from a randomly extracted node (NODE ID= 84) of the WSN SensorScope LUCE
deployment (SensorScope, 2009), within the time interval from 23/11/2006 to 17/12/2006.
The resulting temperature and relative humidity datasets are composed by 64913 samples
and we will refer to them as LU_ID84_T and LU_ID84_H, respectively. The WSN adopted in
the deployment employs a TinyNode node type (TinyNode, 2009), which uses a TI MSP430
microcontroller, a Xemics XE1205 radio and a Sensirion SHT75 sensor module (Sensirion,
2009).
This module is a single chip which includes a capacitive polymer sensing element for
relative humidity and a bandgap temperature sensor. Both the sensors are seamlessly
coupled to a 14-bit ADC and a serial interface circuit on the same chip. The Sensirion SHT75
can sense air temperature in the
CC 60,20
range and relative humidity in the
%100%,0 range. The outputs raw_t and raw_h of the ADC for temperature and relative
humidity are represented with resolutions of 14 and 12 bits, respectively. The outputs raw_t
Enabling Compression in Tiny Wireless Sensor Nodes 261
losslessly by encoding differences d
i
more compactly based on their statistical
characteristics. LEC exploits a modified version of the Exponential-Golomb code (Exp-
Golomb) of order 0 (Teuhola, 1978), which is a type of universal code. The basic idea is to
divide the alphabet of numbers into groups whose sizes increase exponentially. Like in
Golomb coding (Golomb, 1966) and Elias coding (Elias, 1975), a codeword is a hybrid of
unary and binary codes: in particular, the unary code (a variable-length code) specifies the
group, while the binary code (a fixed-length code) represents the index within the group.
Indeed, each nonzero d
i
value is represented as a bit sequence bs
i
composed of two parts
s
i
|a
i
, where s
i
codifies the number n
i
of bits needed to represent d
i
(that is, the group to
which d
i
belongs) and a
i
is the representation of d
i
(that is, the index position in the group).
When d
i
is equal to 0, the corresponding group has size equal to 1 and therefore there is no
need to codify the index position in the group: it follows that a
i
is not represented.
COMPRESSO
R
DELAY
ENCODER
r
i
d
i
r
i-1
-
+
bs
i
UNCOMPRESSOR
DECODER
bs
i
DELAY
+
+
i
d
i-1
r
i
r
Fig. 1. Block diagram of the encoding/decoding schemes.
For any nonzero d
i
, n
i
is trivially computed as
2
log
i
d
: at most n
i
is equal to R. Thus, in
order to encode n
i
a prefix-free table of R + 1 entries has to be specified. This table depends
on the distribution of the differences d
i
: more frequent differences have to be associated with
shorter codes. From the observation that, in typical data collected by WSNs, the most
frequent differences are those close to 0, in (Marcelloni & Vecchio, 2009) we adopted Table 1,
where the first 11 lines coincide with the table used in the baseline JPEG algorithm for
compressing the DC coefficients (Pennebaker & Mitchell, 1992). On the other hand, these
coefficients have statistical characteristics similar to the measures acquired by the sensing
unit. Of course, whether the resolution of the ADC is larger than 14 bits, the table has to be
appropriately extended.
In order to manage negative d
i
, LEC maps the input differences onto nonnegative indexes,
using the following bijection:
,
0
0
2 1 ,
i
i
i
n
i
i
d
d
index
d
d
(1)
Finally, s
i
is equal to the value at entry n
i
in the prefix-free table and a
i
is the binary
representation of index over n
i
bits. Since d
i
is typically represented in two’s complement
notation, when
0
i
d
, a
i
is equal to the n
i
low-order bits of d
i
– 1.
The procedure used to generate a
i
guarantees that all possible values have different codes.
Using Table 1, we have, for instance, that d
i
= 0, d
i
= +1, d
i
= -1, d
i
= +255 and d
i
= -255 are
encoded as 00, 010|1, 010|0, 111110|11111111 and 111110|00000000, respectively. Once bs
i
is generated, it is appended to the bitstream which forms the compressed version of the
sequence of measures m
i
.
In the uncompressor, the bit sequence bs
i
is analyzed by the decoder block which outputs
difference d
i
. Difference d
i
is added to r
i-1
to produce r
i
.
n
i
s
i
d
i
0 00 0
1 010 -1,+1
2 011 -3,-2,+2,+3
3 100 -7,…,-4,+4,…,+7
4 101 -15,…,-8,+8,…,+15
5 110 -31,…,-16,+16,…,+31
6 1110 -63,…,-32,+32,…,+63
7 11110 -127,…,-64,+64,…,+127
8 111110 -255,…,-128,+128,…,+255
9 1111110 -511,…-256,+256,…,+511
10 11111110 -1023,…,-512,+512, …,+1023
11 111111110 -2047, …,-1024,+1024, …,+2047
12 1111111110 -4095, …,-2048,+2048, …,+4095
13 11111111110 -8191, …,-4096,+4096, …,+8191
14 111111111110 -16383, …,-8192,+8192, …,+16383
Table 1. The default dictionary table.
3. Performance Assessment Results
In our experiments, we have used the temperature and relative humidity measurements
collected from a randomly extracted node (NODE ID= 84) of the WSN SensorScope LUCE
deployment (SensorScope, 2009), within the time interval from 23/11/2006 to 17/12/2006.
The resulting temperature and relative humidity datasets are composed by 64913 samples
and we will refer to them as LU_ID84_T and LU_ID84_H, respectively. The WSN adopted in
the deployment employs a TinyNode node type (TinyNode, 2009), which uses a TI MSP430
microcontroller, a Xemics XE1205 radio and a Sensirion SHT75 sensor module (Sensirion,
2009).
This module is a single chip which includes a capacitive polymer sensing element for
relative humidity and a bandgap temperature sensor. Both the sensors are seamlessly
coupled to a 14-bit ADC and a serial interface circuit on the same chip. The Sensirion SHT75
can sense air temperature in the
CC 60,20
range and relative humidity in the
%100%,0 range. The outputs raw_t and raw_h of the ADC for temperature and relative
humidity are represented with resolutions of 14 and 12 bits, respectively. The outputs raw_t
Wireless Sensor Networks 262
and raw_h are converted into measures t and h expressed, respectively, in Celsius degrees
(°C) and percentage (%) as described in (Sensirion, 2009). The datasets corresponding to the
deployments store measures t and h. On the other hand, the LEC algorithm works on raw_t
and raw_h. Thus, before applying the algorithm, we extracted raw_t and raw_h from t and h,
respectively, by using the inverted versions of the conversion functions in (Sensirion, 2009).
Table 2 shows some statistical characteristics of the two datasets. In particular, we have
computed the mean
s
and the standard deviation
s
of the samples, the mean
d
and the
standard deviation
d
of the differences between consecutive samples, the information
entropy
N
i
ii
xpxpH
1
2
)(log)(
of the original signal, where N is the number of possible
values x
i
(the output of the ADC) and )(
i
xp is the probability mass function of x
i
, and the
information entropy
2
1
( ) log ( )
N
d i i
i
H p d p d
of the differentiated signal.
Dataset Samples
s
s
d
d
H H
d
LU_ID84_T 64913 7.21±3.16 -2.87·10
-5
±0.05 10.07 4.05
LU_ID84_H
64913 87.04±8.04 1.12·10
-4
±0.55 10.08 5.85
Table 2. Statistical characteristics of the datasets.
In the following, we first show the compression ratios achieved by LEC and compare them
with the ones achieved by S-LZW and three well-known compression algorithms. We also
discuss the complexity of LEC and S-LZW. Then, we investigate the dependence of the
compression performance of LEC on the correlation between consecutive samples of the
signal to be compressed and show how semi-adaptive and adaptive Huffman coding can
help LEC to increase the compression ratios. Finally, we introduce a problem that affects
LEC and in general all the differential compression algorithms and discuss how this
problem can be solved without considerably penalizing
the compression ratios achieved by
LEC.
3.1 Compression ratios and complexity
The performance of a compression algorithm is usually computed by using the compression
ratio (CR) defined as:
_
100 (1 )
_
comp size
CR
orig size
(2)
where comp_size and orig_size are, respectively, the sizes in bits of the compressed and the
uncompressed bitstreams. Considering that uncompressed samples are normally byte-
aligned, both temperature and relative humidity samples are represented by 16-bit unsigned
integers. Thus, from Table 2, it is easy to compute orig_size for the given datasets.
Moreover, assuming that all samples have to be transmitted to the sink by using the lowest
number of messages so as to have power saving (Mainwaring et al., 2002) and supposing
that each packet can contain at most 29 bytes of payload (Croce et al., 2008), we can define
the packet compression ratio as:
_
100 (1 )
_
comp pkt
PCR
orig pkt
(3)
where comp _ pkt and orig_pkt represent the number of packets necessary to deliver the
compressed and the uncompressed bitstreams, respectively.
Table 3 shows the results obtained by LEC in terms of CR and PCR on the two datasets. As
expected, the LEC algorithm achieves higher compression ratios on the temperature dataset
which is characterized by
a lower entropy
d
H and, in general, a low variability between
consecutive samples (that is, low values of the mean and standard deviation of the
differences between consecutive samples).
Dataset
orig_size
comp_size CR(%) orig_pkt
comp_pkt PCR(%)
LEC
LU_ID84_T 1038608 303194 70.81 4477 1307 70.81
LU_ID84_H
1038608 396442 61.83 4477 1709 61.83
Table 3. Compression ratios obtained by LEC on the two datasets.
To assess the goodness of the results shown in Table 3, we have also applied the S-LZW
algorithm and three well-known compression methods to the same datasets. S-LZW is a
lossless compression algorithm purposely developed to be embedded in sensor nodes. S-
LZW splits the uncompressed input bitstream into fixed size blocks and then compresses
separately each block. During the block compression, for each new string, that is, a string
which is not already in the dictionary, a new entry is added to the dictionary. For each new
block, the dictionary used in the compression is re-initialized by
using the 256 codes which
represent the standard character set. Due to the poor storage resources of sensor nodes, the
size of the dictionary has to be limited. Thus, since each new string in the input bitstream
produces a new entry in the dictionary, the dictionary might become full. If this occurs, an
appropriate strategy has to be adopted. For instance, the dictionary can be frozen and used
as-is to compress the remainder of the data in the block (in the worst case, by using the code
of each character), or it can be reset and started from scratch. To take advantage of the
repetitive behaviour of sensor data, a mini-cache is added to S-LZW: the mini-cache is a
hash-indexed dictionary of size N, where N is a power of 2, that stores recently used and
created dictionary entries. Further, the repetitive behaviour can be used to pre-process the
raw data so as to build appropriately structured datasets, which can perform better with the
compression algorithm.
In (Sadler & Martonosi, 2006), the authors show that the use of structured datasets and the
introduction of the mini-cache increase the compression ratios without introducing
appreciable computational overhead. It follows that S-LZW has to balance four major inter-
related parameters: the size (BLOCK_SIZE) of the data block, the maximum number
(MAX_DICT_ENTRIES) of dictionary entries, the strategy (DICTIONARY_STRATEGY) to
follow when the dictionary is full and the number (MINI-CACHE_ENTRIES) of mini-cache
Enabling Compression in Tiny Wireless Sensor Nodes 263
and raw_h are converted into measures t and h expressed, respectively, in Celsius degrees
(°C) and percentage (%) as described in (Sensirion, 2009). The datasets corresponding to the
deployments store measures t and h. On the other hand, the LEC algorithm works on raw_t
and raw_h. Thus, before applying the algorithm, we extracted raw_t and raw_h from t and h,
respectively, by using the inverted versions of the conversion functions in (Sensirion, 2009).
Table 2 shows some statistical characteristics of the two datasets. In particular, we have
computed the mean
s
and the standard deviation
s
of the samples, the mean
d
and the
standard deviation
d
of the differences between consecutive samples, the information
entropy
N
i
ii
xpxpH
1
2
)(log)(
of the original signal, where N is the number of possible
values x
i
(the output of the ADC) and )(
i
xp is the probability mass function of x
i
, and the
information entropy
2
1
( ) log ( )
N
d i i
i
H p d p d
of the differentiated signal.
Dataset Samples
s
s
d
d
H H
d
LU_ID84_T 64913 7.21±3.16 -2.87·10
-5
±0.05 10.07 4.05
LU_ID84_H
64913 87.04±8.04 1.12·10
-4
±0.55 10.08 5.85
Table 2. Statistical characteristics of the datasets.
In the following, we first show the compression ratios achieved by LEC and compare them
with the ones achieved by S-LZW and three well-known compression algorithms. We also
discuss the complexity of LEC and S-LZW. Then, we investigate the dependence of the
compression performance of LEC on the correlation between consecutive samples of the
signal to be compressed and show how semi-adaptive and adaptive Huffman coding can
help LEC to increase the compression ratios. Finally, we introduce a problem that affects
LEC and in general all the differential compression algorithms and discuss how this
problem can be solved without considerably penalizing
the compression ratios achieved by
LEC.
3.1 Compression ratios and complexity
The performance of a compression algorithm is usually computed by using the compression
ratio (CR) defined as:
_
100 (1 )
_
comp size
CR
orig size
(2)
where comp_size and orig_size are, respectively, the sizes in bits of the compressed and the
uncompressed bitstreams. Considering that uncompressed samples are normally byte-
aligned, both temperature and relative humidity samples are represented by 16-bit unsigned
integers. Thus, from Table 2, it is easy to compute orig_size for the given datasets.
Moreover, assuming that all samples have to be transmitted to the sink by using the lowest
number of messages so as to have power saving (Mainwaring et al., 2002) and supposing
that each packet can contain at most 29 bytes of payload (Croce et al., 2008), we can define
the packet compression ratio as:
_
100 (1 )
_
comp pkt
PCR
orig pkt
(3)
where comp _ pkt and orig_pkt represent the number of packets necessary to deliver the
compressed and the uncompressed bitstreams, respectively.
Table 3 shows the results obtained by LEC in terms of CR and PCR on the two datasets. As
expected, the LEC algorithm achieves higher compression ratios on the temperature dataset
which is characterized by
a lower entropy
d
H and, in general, a low variability between
consecutive samples (that is, low values of the mean and standard deviation of the
differences between consecutive samples).
Dataset
orig_size
comp_size CR(%) orig_pkt
comp_pkt PCR(%)
LEC
LU_ID84_T 1038608 303194 70.81 4477 1307 70.81
LU_ID84_H
1038608 396442 61.83 4477 1709 61.83
Table 3. Compression ratios obtained by LEC on the two datasets.
To assess the goodness of the results shown in Table 3, we have also applied the S-LZW
algorithm and three well-known compression methods to the same datasets. S-LZW is a
lossless compression algorithm purposely developed to be embedded in sensor nodes. S-
LZW splits the uncompressed input bitstream into fixed size blocks and then compresses
separately each block. During the block compression, for each new string, that is, a string
which is not already in the dictionary, a new entry is added to the dictionary. For each new
block, the dictionary used in the compression is re-initialized by
using the 256 codes which
represent the standard character set. Due to the poor storage resources of sensor nodes, the
size of the dictionary has to be limited. Thus, since each new string in the input bitstream
produces a new entry in the dictionary, the dictionary might become full. If this occurs, an
appropriate strategy has to be adopted. For instance, the dictionary can be frozen and used
as-is to compress the remainder of the data in the block (in the worst case, by using the code
of each character), or it can be reset and started from scratch. To take advantage of the
repetitive behaviour of sensor data, a mini-cache is added to S-LZW: the mini-cache is a
hash-indexed dictionary of size N, where N is a power of 2, that stores recently used and
created dictionary entries. Further, the repetitive behaviour can be used to pre-process the
raw data so as to build appropriately structured datasets, which can perform better with the
compression algorithm.
In (Sadler & Martonosi, 2006), the authors show that the use of structured datasets and the
introduction of the mini-cache increase the compression ratios without introducing
appreciable computational overhead. It follows that S-LZW has to balance four major inter-
related parameters: the size (BLOCK_SIZE) of the data block, the maximum number
(MAX_DICT_ENTRIES) of dictionary entries, the strategy (DICTIONARY_STRATEGY) to
follow when the dictionary is full and the number (MINI-CACHE_ENTRIES) of mini-cache
Wireless Sensor Networks 264
entries. With the aim of putting S-LZW in its best situation, we adopted the values
suggested in (Sadler & Martonosi, 2006): a block size of 528 bytes, a dictionary of 512 entries
that is maintained once full and a mini-cache of 32 entries.
As regards the well-known compression methods, we have considered gzip, bzip2 and rar.
These methods have a parameter which allows setting the compression level. This
parameter is between 1 and 9 (default 6) for gzip and bzip2, and between 1 and 5 (default 3)
for rar. We fixed this paramater to the maximum possible compression (9 for gzip and bzip2
and 5 for rar).
Table 4 shows the results obtained by the four algorithms. We can observe that LEC
outperforms the other algorithms. In the table, we have not shown
the PCRs for gzip, bzip2
e rar. Indeed, these algorithms have been used only as benchmarks to validate the
compression ratios obtained by applying LEC. Actually, as already observed in (Ganesan et
al., 2003) (Kimura & Latifi, 2005) (Sadler & Martonosi, 2006), these algorithms cannot be
executed in a sensor node, due to memory requirements and computational power needed
for their execution. Indeed, the executable codes are too large to be embedded in tiny sensor
nodes. Further, the compression ratios are obtained after collecting all the samples and
therefore all the samples have to be stored in memory. This implies that large datasets
cannot be managed. In addition, the compression cannot be performed on the fly. Finally,
during their execution, these algorithms require a large memory to manage some step of the
execution.
Dataset Algorithm
CR(%) PCR(%)
LU_ID84_T
S-LZW 48.99 48.98
gzip 48.87 -
bzip2 69.24 -
rar 69.16 -
LU_ID84_H
S-LZW 31.24 31.22
gzip 37.86 -
bzip2 57.82 -
rar 59.03 -
Table 4. Compression ratios obtained by S-LZW, gzip, bzip2 e rar algorithms on the two
datasets.
As regards complexity of LEC and S-LZW, we have performed a comparative analysis on
the number of instructions required by both the algorithms to compress data. To this aim,
we have adopted the Sim-It Arm simulator (Sim-It, 2009), since there already exists a free
available version of S-LZW implemented for this simulator by the same authors of this
compression algorithm. Sim-It Arm is an instruction-set simulator that runs both system-
level and user-level ARM programs. Since S-LZW compresses each dataset block by block,
we executed the two algorithms on Sim-It Arm simulator to compress the first block of each
dataset. A block consists of 528 bytes (corresponding to 264 samples of 16 bits). Table 5
shows the number of instructions required for compressing one block, the number of saved
bits and the number of instructions per saved bit for the temperature and relative humidity
datasets, respectively.
We note that, though the LEC algorithm achieves a higher compression ratio than S-LZW, it
requires a lower number of instructions. In particular, we observe that, the LEC algorithm
executes, for instance, 15.33 instructions for each saved bit against 29.93 executed by S-LZW
for compressing the first block of the temperature dataset.
LEC S-LZW
Temperature
Relative
Humidity
Temperature
Relative
Humidity
number of
instructions
44784 62817 63207 63207
number of saved
bits
2922 2086 2112 96
number of
instructions per
saved bit
15.33 30.11 29.93 658.41
Table 5. Complexity of LEC and S-LZW.
3.2 Compression ratio versus correlation between consecutive samples
In the previous section we have adopted the default Huffman table for compressing the two
datasets so as to show the effectiveness of the LEC algorithm when dealing with high
correlated datasets. In this section, we analyze the behaviour of LEC when the correlation
between consecutive samples decreases. To this aim, we performed the following
experiment: we simulated different lengths of the sampling interval by downsampling the
sequence of data. Since in the original datasets, samples
are obtained by measuring
temperature and relative humidity at intervals of 30 seconds along 25 days, we considered
downsampling factors of 2, 4, 8, 16, 60 and 120, which correspond, respectively, to consider
time intervals of 1, 2, 4, 8, 30 and 60 minutes. We expect that, like for all compression
algorithms based on differential coding, the sampling rate affects the achievable
compression ratio: when the sampling interval is long, the correlation between consecutive
samples typically decreases, thus reducing the performance of the LEC algorithm. The
significance of this reduction depends on the variability of the signal.
Figure 2 shows the results obtained by compressing the downsampled temperature and
relative humidity datasets. We can observe that the compression ratios decrease with the
increase of the downsampling factors. For instance, for the temperature, we pass from a
compression ratio of 70.81% with the original data (downsampling factor equal to 0) to a
compression ratio of 41.38% with a downsampling factor equal to 120. As expected, the
decrease of the compression ratios is therefore quite relevant. On the other hand, the
Huffman table shown in Table 1 has been proposed for data with high correlation, where
high probabilities are associated with differences between consecutive samples very close to
0. Actually, these differences are characterized by a high occurrence frequency. By
downsampling the original signal with factors from 16 to 120, this assumption is not true
Enabling Compression in Tiny Wireless Sensor Nodes 265
entries. With the aim of putting S-LZW in its best situation, we adopted the values
suggested in (Sadler & Martonosi, 2006): a block size of 528 bytes, a dictionary of 512 entries
that is maintained once full and a mini-cache of 32 entries.
As regards the well-known compression methods, we have considered gzip, bzip2 and rar.
These methods have a parameter which allows setting the compression level. This
parameter is between 1 and 9 (default 6) for gzip and bzip2, and between 1 and 5 (default 3)
for rar. We fixed this paramater to the maximum possible compression (9 for gzip and bzip2
and 5 for rar).
Table 4 shows the results obtained by the four algorithms. We can observe that LEC
outperforms the other algorithms. In the table, we have not shown
the PCRs for gzip, bzip2
e rar. Indeed, these algorithms have been used only as benchmarks to validate the
compression ratios obtained by applying LEC. Actually, as already observed in (Ganesan et
al., 2003) (Kimura & Latifi, 2005) (Sadler & Martonosi, 2006), these algorithms cannot be
executed in a sensor node, due to memory requirements and computational power needed
for their execution. Indeed, the executable codes are too large to be embedded in tiny sensor
nodes. Further, the compression ratios are obtained after collecting all the samples and
therefore all the samples have to be stored in memory. This implies that large datasets
cannot be managed. In addition, the compression cannot be performed on the fly. Finally,
during their execution, these algorithms require a large memory to manage some step of the
execution.
Dataset Algorithm
CR(%) PCR(%)
LU_ID84_T
S-LZW 48.99 48.98
gzip 48.87 -
bzip2 69.24 -
rar 69.16 -
LU_ID84_H
S-LZW 31.24 31.22
gzip 37.86 -
bzip2 57.82 -
rar 59.03 -
Table 4. Compression ratios obtained by S-LZW, gzip, bzip2 e rar algorithms on the two
datasets.
As regards complexity of LEC and S-LZW, we have performed a comparative analysis on
the number of instructions required by both the algorithms to compress data. To this aim,
we have adopted the Sim-It Arm simulator (Sim-It, 2009), since there already exists a free
available version of S-LZW implemented for this simulator by the same authors of this
compression algorithm. Sim-It Arm is an instruction-set simulator that runs both system-
level and user-level ARM programs. Since S-LZW compresses each dataset block by block,
we executed the two algorithms on Sim-It Arm simulator to compress the first block of each
dataset. A block consists of 528 bytes (corresponding to 264 samples of 16 bits). Table 5
shows the number of instructions required for compressing one block, the number of saved
bits and the number of instructions per saved bit for the temperature and relative humidity
datasets, respectively.
We note that, though the LEC algorithm achieves a higher compression ratio than S-LZW, it
requires a lower number of instructions. In particular, we observe that, the LEC algorithm
executes, for instance, 15.33 instructions for each saved bit against 29.93 executed by S-LZW
for compressing the first block of the temperature dataset.
LEC S-LZW
Temperature
Relative
Humidity
Temperature
Relative
Humidity
number of
instructions
44784 62817 63207 63207
number of saved
bits
2922 2086 2112 96
number of
instructions per
saved bit
15.33 30.11 29.93 658.41
Table 5. Complexity of LEC and S-LZW.
3.2 Compression ratio versus correlation between consecutive samples
In the previous section we have adopted the default Huffman table for compressing the two
datasets so as to show the effectiveness of the LEC algorithm when dealing with high
correlated datasets. In this section, we analyze the behaviour of LEC when the correlation
between consecutive samples decreases. To this aim, we performed the following
experiment: we simulated different lengths of the sampling interval by downsampling the
sequence of data. Since in the original datasets, samples
are obtained by measuring
temperature and relative humidity at intervals of 30 seconds along 25 days, we considered
downsampling factors of 2, 4, 8, 16, 60 and 120, which correspond, respectively, to consider
time intervals of 1, 2, 4, 8, 30 and 60 minutes. We expect that, like for all compression
algorithms based on differential coding, the sampling rate affects the achievable
compression ratio: when the sampling interval is long, the correlation between consecutive
samples typically decreases, thus reducing the performance of the LEC algorithm. The
significance of this reduction depends on the variability of the signal.
Figure 2 shows the results obtained by compressing the downsampled temperature and
relative humidity datasets. We can observe that the compression ratios decrease with the
increase of the downsampling factors. For instance, for the temperature, we pass from a
compression ratio of 70.81% with the original data (downsampling factor equal to 0) to a
compression ratio of 41.38% with a downsampling factor equal to 120. As expected, the
decrease of the compression ratios is therefore quite relevant. On the other hand, the
Huffman table shown in Table 1 has been proposed for data with high correlation, where
high probabilities are associated with differences between consecutive samples very close to
0. Actually, these differences are characterized by a high occurrence frequency. By
downsampling the original signal with factors from 16 to 120, this assumption is not true
Wireless Sensor Networks 266
anymore. To be fair in the experiment, we should compute again the occurrence frequencies
of the differences between consecutive samples (this approach is known in the literature as
semi-adaptive Huffman coding (Salomon, 2007)) and modify appropriately the Huffman
table used in the compression.
Fig. 2. Compression ratios obtained by using the default Huffman table on the temperature
and humidity datasets sampled with different downsampling factors.
Figure 3 shows the results obtained by semi-adaptive Huffman coding. We can observe that
the compression ratios still decrease with respect to increasing downsampling factors (on
the other hand, the correlation between consecutive samples is lower), but now this decrease
is less significant. To take on-line these variations of difference distributions into account, in
the literature adaptive Huffman coding has been proposed. The method was originally
developed by Faller (Faller, 1973) and Gallager (Gallager, 1978) with substantial
improvements by Knuth (Knuth, 1985).
Figure 4 shows the results obtained by using the adaptive Huffman coding in LEC.
Obviously, the use of the adaptive coding increases the compression ratios with respect to
the use of a fixed table, but does not allow outperforming the use of the semi-adaptive
Huffman coding. On the other hand, unlike fixed table and adaptive Huffman coding, semi-
adaptive Huffman coding exploits the knowledge of all data. Obviously, this knowledge
cannot be assumed in real applications. Thus, the compression ratios obtained by using the
semi-adaptive Huffman coding can be considered as an upper limit. However, we observe
that the compression ratios achieved with the adaptive Huffman coding are very close to the
ones obtained with the semi-adaptive Huffman coding. On the other hand, we have to
consider that the use of the adaptive Huffman coding increases the complexity of LEC.
Further, since the adaptive coding/decoding scheme is symmetric, a possible loss of one
70,81
68,01
64,98
61,48
57,58
48,61
41,38
61,83
58,66
55,44
51,87
47,74
39,17
33,86
0
10
20
30
40
50
60
70
80
0 2 4 8 16 60 120
CR (%)
downsampling factors
The Effects of Downsampling (Default Table)
Temperature
packet makes the decompression process completely unreliable. Thus, in real applications of
WSNs the use of a fixed table is certainly desirable and practically mandatory.
Fig. 3. Compression ratios obtained by using the semi-adaptive Huffman coding on the
temperature and humidity datasets sampled with different downsampling factors.
Fig. 4. Compression ratios obtained by using the adaptive Huffman coding on the
temperature and humidity datasets sampled with different downsampling factors.
73,54
70,31
67,11
63,57
59,85
53,06
48,83
62,51
59,96
57,55
54,98
52,16
46,56
43,73
0
10
20
30
40
50
60
70
80
0 2 4 8 16 60 120
CR (%)
downsampling factors
The Effects of Downsampling (Semi-Adaptive)
Temperature
73,50
70,28
67,05
63,46
59,69
52,59
47,82
62,46
59,88
57,45
54,89
51,93
45,91
42,63
0
10
20
30
40
50
60
70
80
0 2 4 8 16 60 1 20
CR (%)
downsampling factors
The Effects of Downsampling (Adaptive)
Temperature
Enabling Compression in Tiny Wireless Sensor Nodes 267
anymore. To be fair in the experiment, we should compute again the occurrence frequencies
of the differences between consecutive samples (this approach is known in the literature as
semi-adaptive Huffman coding (Salomon, 2007)) and modify appropriately the Huffman
table used in the compression.
Fig. 2. Compression ratios obtained by using the default Huffman table on the temperature
and humidity datasets sampled with different downsampling factors.
Figure 3 shows the results obtained by semi-adaptive Huffman coding. We can observe that
the compression ratios still decrease with respect to increasing downsampling factors (on
the other hand, the correlation between consecutive samples is lower), but now this decrease
is less significant. To take on-line these variations of difference distributions into account, in
the literature adaptive Huffman coding has been proposed. The method was originally
developed by Faller (Faller, 1973) and Gallager (Gallager, 1978) with substantial
improvements by Knuth (Knuth, 1985).
Figure 4 shows the results obtained by using the adaptive Huffman coding in LEC.
Obviously, the use of the adaptive coding increases the compression ratios with respect to
the use of a fixed table, but does not allow outperforming the use of the semi-adaptive
Huffman coding. On the other hand, unlike fixed table and adaptive Huffman coding, semi-
adaptive Huffman coding exploits the knowledge of all data. Obviously, this knowledge
cannot be assumed in real applications. Thus, the compression ratios obtained by using the
semi-adaptive Huffman coding can be considered as an upper limit. However, we observe
that the compression ratios achieved with the adaptive Huffman coding are very close to the
ones obtained with the semi-adaptive Huffman coding. On the other hand, we have to
consider that the use of the adaptive Huffman coding increases the complexity of LEC.
Further, since the adaptive coding/decoding scheme is symmetric, a possible loss of one
70,81
68,01
64,98
61,48
57,58
48,61
41,38
61,83
58,66
55,44
51,87
47,74
39,17
33,86
0
10
20
30
40
50
60
70
80
0 2 4 8 16 60 120
CR (%)
downsampling factors
The Effects of Downsampling (Default Table)
Temperature
packet makes the decompression process completely unreliable. Thus, in real applications of
WSNs the use of a fixed table is certainly desirable and practically mandatory.
Fig. 3. Compression ratios obtained by using the semi-adaptive Huffman coding on the
temperature and humidity datasets sampled with different downsampling factors.
Fig. 4. Compression ratios obtained by using the adaptive Huffman coding on the
temperature and humidity datasets sampled with different downsampling factors.
73,54
70,31
67,11
63,57
59,85
53,06
48,83
62,51
59,96
57,55
54,98
52,16
46,56
43,73
0
10
20
30
40
50
60
70
80
0 2 4 8 16 60 120
CR (%)
downsampling factors
The Effects of Downsampling (Semi-Adaptive)
Temperature
73,50
70,28
67,05
63,46
59,69
52,59
47,82
62,46
59,88
57,45
54,89
51,93
45,91
42,63
0
10
20
30
40
50
60
70
80
0 2 4 8 16 60 120
CR (%)
downsampling factors
The Effects of Downsampling (Adaptive)
Temperature