Wireless Sensor Networks Part 12 pot
Bạn đang xem bản rút gọn của tài liệu. Xem và tải ngay bản đầy đủ của tài liệu tại đây (2.39 MB, 25 trang )
Wireless Sensor Networks 268
The fixed Huffman table used in the original version of LEC can guarantee satisfactory
performance when the correlation between consecutive samples is high. However, when the
correlation is not high, we can find a fixed Huffman table suitable for the specific
application. Indeed, we would like to remark that, in real habitat monitoring applications,
the sampling rate is a parameter of the application domain: once fixed, rarely it is modified.
Since the trend of the environmental signals is generally known, this allows us to make quite
reliable assumptions on the distributions of the differences, thus permitting us to generate
fixed Huffman tables which guarantee high compression ratios. We could also consider to
adopt a two-phase approach. In the first phase, we collect an appropriate number of samples
so as to perform an analysis of occurrence frequency of the differences. Then, in the second
phase, we use the fixed Huffman table generated by the analysis performed in the first
phase to compress the data on the fly.
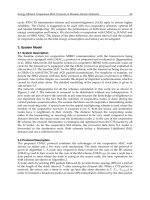
To highlight that the lack of sample correlation does not affect only LEC, but in general all
the compression algorithms, we have also applied S-LZW to the temperature and humidity
datasets sampled with downsampling factors of 2, 4, 8, 16, 60 and 120. Figure 5 compares the
compression ratios obtained by S-LZW with the ones achieved by the LEC algorithm
executed by using the default table. As expected, we can observe that also the performance
of S-LZW are considerably affected by downsampling.
Fig. 5. Comparison between S-LZW and LEC executed with default table on the temperature
and humidity datasets sampled with different downsampling factors.
4.3 The problem of the first sample
LEC, as all the differential compression algorithms, suffers from the following problem. In
order to reconstruct the original samples, the decoder must know the value of the first
0
10
20
30
40
50
60
70
80
0 2 4 8 16 60 120
CR (%)
downsampling factors
The Effects of Downsampling (Comparison)
Temperature (LEC
Default)
sample: if the first sample has been lost or corrupted, all the other samples are not correctly
decoded. In our case, the compressed bitstream is sent by wireless
communication to the
collector, which takes the decompression process in charge. Since the transmission can be
non-reliable, the first packet could be lost and thus also the first value, making correct
reconstruction of samples impossible.
To make communication reliable, a
number of solutions have been proposed. In general,
these solutions involve protocols based on acknowledgements which act at Transport layer.
Obviously, these protocols require a higher number of message exchanges between nodes
and this increases the power consumption. A review of these algorithms is out of the scope
of this chapter. Anyway, a solution to this problem can be also provided at the application
layer without modifying the protocols of the underlying layers: when we insert the first
sample into the payload of a new packet, we do not insert the difference between the current
and the previous sample, but rather the difference between the current sample and a
reference value known to the decoder (for instance, the central value of the ADC). Thus, the
decoding of each packet is independent of the reception of the previous packets. Table 6
compares the PCRs obtained by using this expedient (this PCR will be denoted as PCR*)
with those shown in Table 3: we can note that the decrease of PCR is not high. Further, the
PCR*s are still higher than those achieved by S-LZW. Thus, we can conclude that the LEC
scheme can be made more robust without significantly affecting its performance.
Dataset
PCR(%)
PCR*(%)
LU_ID84_T 70.81 68.19
LU_ID84_H 61.83 58.21
Table 6. PCRs obtained without (PCR) and by (PCR*s) transmitting the first value in each
packet.
5. From Lossless to Lossy
In some WSN applications, like environmental monitoring, the accurateness of the measures
is less important than the sensor cheapness. Thus, often commercial wireless nodes are
equipped with sensors which, though cheap, collect measures affected by considerable
noise. In this context, the use of lossless compression algorithms can be penalising. Indeed,
noise increases the entropy of the signal and therefore hinders the lossless compression
algorithm to achieve considerable compression ratios. The ideal solution would be to adopt
on the sensor node, a lossy
compression algorithm in which the loss of information would
be just the noise. Thus, we could achieve high compression ratios without losing relevant
information. To this aim, we exploit the observation that data typically collected by WSNs
are strongly correlated. Thus, differences between consecutive samples should be regular
and generally very small. If this does not occur, it is likely that samples are affected by noise.
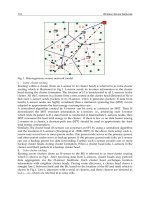
To de-noise and simultaneously compress the samples, we introduce a lossy version of LEC.
In this version, the difference d
i
= r
i
- r
i-1
is not directly encoded, but is first quantized and
then encoded following the Differential Pulse Code Modulation (DPCM) scheme often used
for digital audio signal compression. The schemes of the lossy versions of the compressor
and uncompressor are shown in Fig. 6.
Enabling Compression in Tiny Wireless Sensor Nodes 269
The fixed Huffman table used in the original version of LEC can guarantee satisfactory
performance when the correlation between consecutive samples is high. However, when the
correlation is not high, we can find a fixed Huffman table suitable for the specific
application. Indeed, we would like to remark that, in real habitat monitoring applications,
the sampling rate is a parameter of the application domain: once fixed, rarely it is modified.
Since the trend of the environmental signals is generally known, this allows us to make quite
reliable assumptions on the distributions of the differences, thus permitting us to generate
fixed Huffman tables which guarantee high compression ratios. We could also consider to
adopt a two-phase approach. In the first phase, we collect an appropriate number of samples
so as to perform an analysis of occurrence frequency of the differences. Then, in the second
phase, we use the fixed Huffman table generated by the analysis performed in the first
phase to compress the data on the fly.
To highlight that the lack of sample correlation does not affect only LEC, but in general all
the compression algorithms, we have also applied S-LZW to the temperature and humidity
datasets sampled with downsampling factors of 2, 4, 8, 16, 60 and 120. Figure 5 compares the
compression ratios obtained by S-LZW with the ones achieved by the LEC algorithm
executed by using the default table. As expected, we can observe that also the performance
of S-LZW are considerably affected by downsampling.
Fig. 5. Comparison between S-LZW and LEC executed with default table on the temperature
and humidity datasets sampled with different downsampling factors.
4.3 The problem of the first sample
LEC, as all the differential compression algorithms, suffers from the following problem. In
order to reconstruct the original samples, the decoder must know the value of the first
0
10
20
30
40
50
60
70
80
0 2 4 8 16 60 120
CR (%)
downsampling factors
The Effects of Downsampling (Comparison)
Temperature (LEC
Default)
sample: if the first sample has been lost or corrupted, all the other samples are not correctly
decoded. In our case, the compressed bitstream is sent by wireless
communication to the
collector, which takes the decompression process in charge. Since the transmission can be
non-reliable, the first packet could be lost and thus also the first value, making correct
reconstruction of samples impossible.
To make communication reliable, a
number of solutions have been proposed. In general,
these solutions involve protocols based on acknowledgements which act at Transport layer.
Obviously, these protocols require a higher number of message exchanges between nodes
and this increases the power consumption. A review of these algorithms is out of the scope
of this chapter. Anyway, a solution to this problem can be also provided at the application
layer without modifying the protocols of the underlying layers: when we insert the first
sample into the payload of a new packet, we do not insert the difference between the current
and the previous sample, but rather the difference between the current sample and a
reference value known to the decoder (for instance, the central value of the ADC). Thus, the
decoding of each packet is independent of the reception of the previous packets. Table 6
compares the PCRs obtained by using this expedient (this PCR will be denoted as PCR*)
with those shown in Table 3: we can note that the decrease of PCR is not high. Further, the
PCR*s are still higher than those achieved by S-LZW. Thus, we can conclude that the LEC
scheme can be made more robust without significantly affecting its performance.
Dataset
PCR(%)
PCR*(%)
LU_ID84_T 70.81 68.19
LU_ID84_H 61.83 58.21
Table 6. PCRs obtained without (PCR) and by (PCR*s) transmitting the first value in each
packet.
5. From Lossless to Lossy
In some WSN applications, like environmental monitoring, the accurateness of the measures
is less important than the sensor cheapness. Thus, often commercial wireless nodes are
equipped with sensors which, though cheap, collect measures affected by considerable
noise. In this context, the use of lossless compression algorithms can be penalising. Indeed,
noise increases the entropy of the signal and therefore hinders the lossless compression
algorithm to achieve considerable compression ratios. The ideal solution would be to adopt
on the sensor node, a lossy
compression algorithm in which the loss of information would
be just the noise. Thus, we could achieve high compression ratios without losing relevant
information. To this aim, we exploit the observation that data typically collected by WSNs
are strongly correlated. Thus, differences between consecutive samples should be regular
and generally very small. If this does not occur, it is likely that samples are affected by noise.
To de-noise and simultaneously compress the samples, we introduce a lossy version of LEC.
In this version, the difference d
i
= r
i
- r
i-1
is not directly encoded, but is first quantized and
then encoded following the Differential Pulse Code Modulation (DPCM) scheme often used
for digital audio signal compression. The schemes of the lossy versions of the compressor
and uncompressor are shown in Fig. 6.
Wireless Sensor Networks 270
COMPRESSOR
DELAY
ENCODER
r
i
i
d
bs
i
DELAY
+
+
QUANTIZER
+
-
ˆ
i
I(d )
+
+
1
ˆ
i
r
ˆ
i
r
UNCOMPRESSOR
DECODER
bs
i
DEQUANTIZER
ˆ
i
I(d )
ˆ
i
d
1
ˆ
i
r
ˆ
i
r
ˆ
i
d
Fig. 6. Block diagram of the encoding/decoding schemes.
Actually to avoid the well-known problem of the accumulation of the error (Salomon, 2007),
we quantize the difference between sample r
i
and the most recent reconstructed value
1
ˆ
i
r
.
The problem originates from the following consideration: the compressor can compute the
exact differences d
i
from the original data samples r
i
and r
i-1
, while the uncompressor can
work only with quantized differences
ˆ
i
d
. The uncompressor uses
ˆ
i
d
to generate the
reconstructed samples
ˆ
i
r (
1
ˆ
ˆ ˆ
i i i
r r d
) rather than the original samples r
i
. The generic nth
reconstructed sample
ˆ
n
r at the uncompressor will contain the sum of the quantization errors
accumulated during the reconstruction of the previous n-1 samples plus the quantization
error of the current sample:
1
ˆ
n
n n i
i
r r q
(3)
where q
i
is the quantization error.
To overcome this problem, the compressor is modified so as to compute the generic
difference
1
ˆ
i i i
d r r
, that is, to calculate difference
i
d by subtracting the most recent
reconstructed value
1
ˆ
i
r
(which both the compressor and the uncompressor have) from the
current original sample r
i
. Thus, the uncompressor first decodifies r
0
. Then, when it receives
the first quantized difference
1
ˆ
d
, it computes
1 0 1 0 1 1 1 1
ˆ
ˆ
r r d r d q r q
. When it
receives the second quantized difference
2
ˆ
d
, it computes
2 1 2 1 2 2 1 2 1 2 2 2
ˆ
ˆ ˆ ˆ ˆ ˆ
r r d r d q r r r q r q
. The decoded value
2
ˆ
r
contains just the single
quantization error
2
q , and in general, the decoded value
ˆ
i
r contains just the quantization
error
i
q .
Difference
i
d is input to the block QUANTIZER that outputs the quantization level
ˆ
i
d
assigned to
i
d
and the index
ˆ
i
I d of
ˆ
i
d
. The index
ˆ
i
I d is input to the ENCODER block,
which generates the codeword
i
bs using the same bijection defined in (1) for mapping
integer inputs to natural values, and the same combination of unary and binary codes
described in Section 2. The ENCODER block, therefore, encodes the quantization index
corresponding to the quantized difference rather than the difference as in LEC. Again, the
dictionary table used to produce the codes should be generated based on the occurrence
frequency of the quantization indexes. In these preliminary experiments, we have decided
to adopt the same dictionary used in Table 1, where in place of
i
d , the reader should read
ˆ
i
d
. Since the number of quantization levels
ˆ
i
d
is lower than the number of possible
i
d
, the
table might have a lower number of entries.
In the uncompressor, the codeword
i
bs is analyzed by the DECODER block which outputs
the index
ˆ
i
I d , exploiting the same dictionary table. This index is elaborated by the block
DEQUANTIZER to produce
ˆ
i
d
which is added to
1
ˆ
i
r
to output
ˆ
i
r .
Currently, we are simply adopting a uniform quantization. In this case, the unique
parameter to be fixed is the difference D between two consecutive levels. This parameter is
very important because it affects the value of the quantization error and indirectly the
compression ratio. To show the performance of the lossy version of LEC, we set D to six
different values: 10%, 20%, 30%, 40%, 50% and 60% of the Manufactured Error (ME) of the
sensor used to collect data. In the case of the sensors (Sensirion SHT75) used in our
experiments, ME = ± 0.3
o
C and ME = ± 1.8% for temperature and relative humidity,
respectively (Sensirion, 2009). Table 7 shows the compression ratios and the root mean
squared errors (RMSEs) obtained on the temperature and relative humidity datasets.
RMSE is computed as:
2
1
1
ˆ
N
i i
i
RMSE r r
N
(5)
where
i
r is the original sample,
ˆ
i
r is the reconstructed sample and N is the number of
samples of the signal. We observe that, as expected, the compression ratios are higher than
the ones obtained by the original version of LEC. On the other hand, the lossy version
introduces an error on the reconstructed signal. Anyway, this error is lower than ME, which
represents a sort of uncertainty of the measure.
To assess the results shown in Table 7, we have applied LTC to the same datasets. LTC is an
efficient and simple lossy compression technique for the context of habitat monitoring. LTC
generates a set of line segments which form a piecewise continuous function. This function
approximates the original dataset in such a way that no original sample is farther than a
fixed error e from the closest line segment. Thus, before executing the LTC algorithm, we
have to set error e. To perform a fair comparison with the lossy version of LEC, we have set e
to the 10%, 20% and 30% of the ME of the sensor. This allows obtaining RMSEs comparable
with the ones obtained by the lossy version of LEC when D is equal to the 20%, 40% and
60% of the ME. Table 8 shows the compression ratios and the RMSEs obtained on the
Enabling Compression in Tiny Wireless Sensor Nodes 271
COMPRESSO
R
DELAY
ENCODER
r
i
i
d
bs
i
DELAY
+
+
QUANTIZER
+
-
ˆ
i
I(d )
+
+
1
ˆ
i
r
ˆ
i
r
UNCOMPRESSO
R
DECODER
bs
i
DEQUANTIZER
ˆ
i
I(d )
ˆ
i
d
1
ˆ
i
r
ˆ
i
r
ˆ
i
d
Fig. 6. Block diagram of the encoding/decoding schemes.
Actually to avoid the well-known problem of the accumulation of the error (Salomon, 2007),
we quantize the difference between sample r
i
and the most recent reconstructed value
1
ˆ
i
r
.
The problem originates from the following consideration: the compressor can compute the
exact differences d
i
from the original data samples r
i
and r
i-1
, while the uncompressor can
work only with quantized differences
ˆ
i
d
. The uncompressor uses
ˆ
i
d
to generate the
reconstructed samples
ˆ
i
r (
1
ˆ
ˆ ˆ
i i i
r r d
) rather than the original samples r
i
. The generic nth
reconstructed sample
ˆ
n
r at the uncompressor will contain the sum of the quantization errors
accumulated during the reconstruction of the previous n-1 samples plus the quantization
error of the current sample:
1
ˆ
n
n n i
i
r r q
(3)
where q
i
is the quantization error.
To overcome this problem, the compressor is modified so as to compute the generic
difference
1
ˆ
i i i
d r r
, that is, to calculate difference
i
d by subtracting the most recent
reconstructed value
1
ˆ
i
r
(which both the compressor and the uncompressor have) from the
current original sample r
i
. Thus, the uncompressor first decodifies r
0
. Then, when it receives
the first quantized difference
1
ˆ
d
, it computes
1 0 1 0 1 1 1 1
ˆ
ˆ
r r d r d q r q
. When it
receives the second quantized difference
2
ˆ
d
, it computes
2 1 2 1 2 2 1 2 1 2 2 2
ˆ
ˆ ˆ ˆ ˆ ˆ
r r d r d q r r r q r q
. The decoded value
2
ˆ
r
contains just the single
quantization error
2
q , and in general, the decoded value
ˆ
i
r contains just the quantization
error
i
q .
Difference
i
d is input to the block QUANTIZER that outputs the quantization level
ˆ
i
d
assigned to
i
d
and the index
ˆ
i
I d of
ˆ
i
d
. The index
ˆ
i
I d is input to the ENCODER block,
which generates the codeword
i
bs using the same bijection defined in (1) for mapping
integer inputs to natural values, and the same combination of unary and binary codes
described in Section 2. The ENCODER block, therefore, encodes the quantization index
corresponding to the quantized difference rather than the difference as in LEC. Again, the
dictionary table used to produce the codes should be generated based on the occurrence
frequency of the quantization indexes. In these preliminary experiments, we have decided
to adopt the same dictionary used in Table 1, where in place of
i
d , the reader should read
ˆ
i
d
. Since the number of quantization levels
ˆ
i
d
is lower than the number of possible
i
d
, the
table might have a lower number of entries.
In the uncompressor, the codeword
i
bs is analyzed by the DECODER block which outputs
the index
ˆ
i
I d , exploiting the same dictionary table. This index is elaborated by the block
DEQUANTIZER to produce
ˆ
i
d
which is added to
1
ˆ
i
r
to output
ˆ
i
r .
Currently, we are simply adopting a uniform quantization. In this case, the unique
parameter to be fixed is the difference D between two consecutive levels. This parameter is
very important because it affects the value of the quantization error and indirectly the
compression ratio. To show the performance of the lossy version of LEC, we set D to six
different values: 10%, 20%, 30%, 40%, 50% and 60% of the Manufactured Error (ME) of the
sensor used to collect data. In the case of the sensors (Sensirion SHT75) used in our
experiments, ME = ± 0.3
o
C and ME = ± 1.8% for temperature and relative humidity,
respectively (Sensirion, 2009). Table 7 shows the compression ratios and the root mean
squared errors (RMSEs) obtained on the temperature and relative humidity datasets.
RMSE is computed as:
2
1
1
ˆ
N
i i
i
RMSE r r
N
(5)
where
i
r is the original sample,
ˆ
i
r is the reconstructed sample and N is the number of
samples of the signal. We observe that, as expected, the compression ratios are higher than
the ones obtained by the original version of LEC. On the other hand, the lossy version
introduces an error on the reconstructed signal. Anyway, this error is lower than ME, which
represents a sort of uncertainty of the measure.
To assess the results shown in Table 7, we have applied LTC to the same datasets. LTC is an
efficient and simple lossy compression technique for the context of habitat monitoring. LTC
generates a set of line segments which form a piecewise continuous function. This function
approximates the original dataset in such a way that no original sample is farther than a
fixed error e from the closest line segment. Thus, before executing the LTC algorithm, we
have to set error e. To perform a fair comparison with the lossy version of LEC, we have set e
to the 10%, 20% and 30% of the ME of the sensor. This allows obtaining RMSEs comparable
with the ones obtained by the lossy version of LEC when D is equal to the 20%, 40% and
60% of the ME. Table 8 shows the compression ratios and the RMSEs obtained on the
Wireless Sensor Networks 272
temperature and relative humidity datasets. We can observe that the lossy version of LEC
outperforms LTC in terms of CR for comparable RMSEs, thus proving the good
characteristics of the proposed lossy compression algorithm.
Dataset Algorithm
CR(%) RMSE
0.1·ME 78.18 0.0082
0.2·ME 81.26 0.0171
LU_ID84_T
0.3·ME 83.45 0.0256
0.4·ME 83.46 0.0353
0.5·ME 84.94 0.0428
0.6·ME 86.14 0.0517
0.1·ME 74.65 0.0450
0.2·ME 78.83 0.0872
LU_ID84_H
0.3·ME 80.89 0.1296
0.4·ME 82.13 0.1721
0.5·ME 82.97 0.2166
0.6·ME 83.61 0.2598
Table 7. Compression ratios obtained by the lossy version of LEC on the two datasets.
Dataset Algorithm
CR(%) RMSE
LU_ID84_T
0.1·ME
55.00 0.0190
0.2·ME
77.53 0.0348
0.3·ME
86.12 0.0502
LU_ID84_H
0.1·ME
26.49 0.0824
0.2·ME
55.97 0.1681
0.3·ME
70.99 0.2496
Table 8. Compression ratios obtained by the LTC algorithm on the two datasets.
6. Conclusions
In this chapter, we have discussed how enabling compression helps in wireless sensor
nodes. First, we have briefly introduced LEC, a lossless compression algorithm we proposed
in a previous paper. LEC divides the alphabet of differences between consecutive samples
into groups whose sizes increase exponentially. Each codeword is a hybrid of unary and
binary codes: in particular, the unary code (a variable-length code) specifies the group,
while the binary code (a fixed-length code) represents the index within the group. In the
original version, we used the Huffman table proposed in JPEG for coding the groups. Here,
we have investigated semi-adaptive and adaptive Huffman coding and carried out a
comparison in terms of compression ratios with the LEC algorithm with fixed Huffman
table. We have shown that semi-adaptive and adaptive Huffman coding can increase the
compression ratios when the correlation between consecutive samples decreases. We have
compared all the approaches with S-LZW, a compression algorithm specifically proposed
for sensor nodes, and with three classical compression algorithms, namely gzip, bzip2 and
rar, though these algorithms are not embeddable in tiny sensor nodes. We have shown that
the different versions of LEC can achieve considerable compression ratios in all the datasets
considered in the experiments. Finally, we have discussed how LEC can be transformed into
a lossy compression algorithm and have shown that this lossy version outperforms LTC, a
lossy compression algorithm specifically designed for being embedded in tiny sensor nodes.
7. Acknowledgements
This work was supported by the Italian Ministry of University and Research (MIUR) under
the PRIN project #2005090483_005 “Wireless sensor networks for monitoring natural
phenomena” and the FIRB project “Adaptive Infrastructure for Decentralized Organization
(ArtDecO)”.
8. References
Anastasi, G., Conti, M., Di Francesco, M. & Passarella, A. (2009) Energy conservation in
wireless sensor networks: A survey. Ad Hoc Networks, Vol. 7, 537-568.
Barr, K. C. and Asanović, K. (2006) Energy-aware lossless data compression. ACM Trans.
Comput. Syst., Vol. 24, 250-291.
Boulis, A., Ganeriwal, S. & Srivastava, M.B. (2003) Aggregation in sensor networks: an
energy– trade-off. Ad Hoc Networks, Vol. 1, 317–331.
Chen, H., Li, J. & Mohapatra, P. (2004) RACE: time series compression with rate adaptivity
and error bound for sensor networks. Proceedings of the First IEEE International
Conference on Mobile Ad-hoc and Sensor Systems, pp. 124-133, Fort Lauderdale,
FL, USA, 24-27 October,. IEEE, Piscataway, NJ, USA.
Ciancio, A. & Ortega, A. (2005) A distributed wavelet compression algorithm for wireless
multihop sensor networks using lifting. Proceedings of IEEE International
Conference on Acoustics, Speech, and Signal Processing, pp. 825-828, Philadelphia,
PA, USA, 18-23 March,. IEEE, Piscataway, NJ, USA.
Ciancio, A., Pattem, S., Ortega, A. & Krishnamachari, B. (2006) Energy-efficient data
representation and routing for wireless sensor networks based on a distributed
Enabling Compression in Tiny Wireless Sensor Nodes 273
temperature and relative humidity datasets. We can observe that the lossy version of LEC
outperforms LTC in terms of CR for comparable RMSEs, thus proving the good
characteristics of the proposed lossy compression algorithm.
Dataset Algorithm
CR(%) RMSE
0.1·ME 78.18 0.0082
0.2·ME 81.26 0.0171
LU_ID84_T
0.3·ME 83.45 0.0256
0.4·ME 83.46 0.0353
0.5·ME 84.94 0.0428
0.6·ME 86.14 0.0517
0.1·ME 74.65 0.0450
0.2·ME 78.83 0.0872
LU_ID84_H
0.3·ME 80.89 0.1296
0.4·ME 82.13 0.1721
0.5·ME 82.97 0.2166
0.6·ME 83.61 0.2598
Table 7. Compression ratios obtained by the lossy version of LEC on the two datasets.
Dataset Algorithm
CR(%) RMSE
LU_ID84_T
0.1·ME
55.00 0.0190
0.2·ME
77.53 0.0348
0.3·ME
86.12 0.0502
LU_ID84_H
0.1·ME
26.49 0.0824
0.2·ME
55.97 0.1681
0.3·ME
70.99 0.2496
Table 8. Compression ratios obtained by the LTC algorithm on the two datasets.
6. Conclusions
In this chapter, we have discussed how enabling compression helps in wireless sensor
nodes. First, we have briefly introduced LEC, a lossless compression algorithm we proposed
in a previous paper. LEC divides the alphabet of differences between consecutive samples
into groups whose sizes increase exponentially. Each codeword is a hybrid of unary and
binary codes: in particular, the unary code (a variable-length code) specifies the group,
while the binary code (a fixed-length code) represents the index within the group. In the
original version, we used the Huffman table proposed in JPEG for coding the groups. Here,
we have investigated semi-adaptive and adaptive Huffman coding and carried out a
comparison in terms of compression ratios with the LEC algorithm with fixed Huffman
table. We have shown that semi-adaptive and adaptive Huffman coding can increase the
compression ratios when the correlation between consecutive samples decreases. We have
compared all the approaches with S-LZW, a compression algorithm specifically proposed
for sensor nodes, and with three classical compression algorithms, namely gzip, bzip2 and
rar, though these algorithms are not embeddable in tiny sensor nodes. We have shown that
the different versions of LEC can achieve considerable compression ratios in all the datasets
considered in the experiments. Finally, we have discussed how LEC can be transformed into
a lossy compression algorithm and have shown that this lossy version outperforms LTC, a
lossy compression algorithm specifically designed for being embedded in tiny sensor nodes.
7. Acknowledgements
This work was supported by the Italian Ministry of University and Research (MIUR) under
the PRIN project #2005090483_005 “Wireless sensor networks for monitoring natural
phenomena” and the FIRB project “Adaptive Infrastructure for Decentralized Organization
(ArtDecO)”.
8. References
Anastasi, G., Conti, M., Di Francesco, M. & Passarella, A. (2009) Energy conservation in
wireless sensor networks: A survey. Ad Hoc Networks, Vol. 7, 537-568.
Barr, K. C. and Asanović, K. (2006) Energy-aware lossless data compression. ACM Trans.
Comput. Syst., Vol. 24, 250-291.
Boulis, A., Ganeriwal, S. & Srivastava, M.B. (2003) Aggregation in sensor networks: an
energy– trade-off. Ad Hoc Networks, Vol. 1, 317–331.
Chen, H., Li, J. & Mohapatra, P. (2004) RACE: time series compression with rate adaptivity
and error bound for sensor networks. Proceedings of the First IEEE International
Conference on Mobile Ad-hoc and Sensor Systems, pp. 124-133, Fort Lauderdale,
FL, USA, 24-27 October,. IEEE, Piscataway, NJ, USA.
Ciancio, A. & Ortega, A. (2005) A distributed wavelet compression algorithm for wireless
multihop sensor networks using lifting. Proceedings of IEEE International
Conference on Acoustics, Speech, and Signal Processing, pp. 825-828, Philadelphia,
PA, USA, 18-23 March,. IEEE, Piscataway, NJ, USA.
Ciancio, A., Pattem, S., Ortega, A. & Krishnamachari, B. (2006) Energy-efficient data
representation and routing for wireless sensor networks based on a distributed
Wireless Sensor Networks 274
wavelet compression algorithm. Proceedings of the Fifth international Conference
on Information Processing in Sensor Networks, pp. 309-316, Nashville, TN, USA,
19-21 April, ACM, New York, NY, USA.
Croce, S., Marcelloni, F. & Vecchio, M. (2008) Reducing power consumption in wireless
sensor networks using a novel approach to data aggregation. The Computer Journal,
Vol. 51, No. 2, 227–239.
Deligiannakis, A., Kotidis, Y. & Roussopoulos, N. (2004) Compressing historical information
in sensor networks. Proceedings of the 2004 ACM SIGMOD International
Conference on Management of Data, pp. 527-538, Paris, France, 13-18 June, ACM,
New York, NY, USA.
Di Bacco, G., Melodia, T. & Cuomo, F. (2004) A MAC protocol for delay-bounded
applications in wireless sensor networks. Proceedings of the Third Annual
Mediterranean Ad Hoc Networking Workshop, pp. 208-220, Bodrum, Turkey, 27-30
June, available on-line:
Elias, P. (1975) Universal codeword sets and representations of the integers. IEEE Transaction
on Information Theory, Vol. 21, No. 2, 194–203.
Faller, N. (1973) An adaptive system for data compression. Proceedings of the 7th Asilomar
Conference on Circuits, Systems, and Computers, pp. 593–597, Pacific Grove, CA,
USA, November, IEEE Press, Piscataway, NJ, USA.
Fan, K-W, Liu, S. & Sinha, P. (2007) Structure-free data aggregation in sensor networks. IEEE
Transactions on Mobile Computing, Vol. 6, 929-942.
Fasolo, E., Rossi, M., Widmer, J. & Zorzi, M. (2007) In-network aggregation techniques for
wireless sensor networks: a survey. Wireless Communications, Vol. 14, 70-87.
Gallager, R. G. (1978) Variations on a theme by Huffman. IEEE Transactions on Information
Theory, Vol. 24, No. 6, 668-674.
Ganesan, D., Estrin, D. & Heidemann, J. (2003) DIMENSIONS: why do we need a new data
handling architecture for sensor networks?, SIGCOMM Comput. Commun. Rev., Vol.
33, 143-148.
Gastpar, M., Dragotti, P. L. & Vetterli, M. (2006) The distributed Karhunen-Loève transform.
IEEE Transactions on Information Theory, Vol. 52, No. 12, 5177-5196.
Girod, B., Aaron, A., Rane, S. & Rebollo-Monedero, D. (2005) Distributed video coding.
Proceedings of the IEEE, Special Issue Advances Video Coding, Delivery, Vol. 93, No.
1, 71–83.
Golomb, S. W. (1966) Run-length encodings. IEEE Transactions on Information Theory, Vol. 12,
No. 3, 399-401.
Guestrin, C., Bodi, P., Thibau, R., Paski, M. & Madden, S. (2004) Distributed regression: an
efficient framework for modelling sensor
network data. Proceedings of the Third
International Symposium on Information Processing in Sensor Networks, pp.1-10,
Berkeley, CA, USA, 26-27 April, ACM, New York, NY, USA.
Intanagonwiwat, C., Govindan, R., Estrin, D., Heidemann, J. & Silva, F. (2003) Directed
diffusion for wireless sensor networking. IEEE/ACM Trans. Netw., Vol. 11, 2-16.
Kimura, N. & Latifi, S. (2005) A survey on data compression in wireless sensor networks.
Proceedings of the International Conference on Information Technology: Coding
and Computing, pp. 8-13, Las Vegas, NV, USA, 4-6 April, IEEE Computer Society,
Washington, DC, USA.
Knuth, D. E. (1985) Dynamic Huffman Coding. Journal of Algorithms, Vol. 6, 163-180.
Lin, S., Kalogeraki, V., Gunopulos, D. & Lonardi, S. (2006) Online information compression
in sensor networks. Proceedings of the IEEE International Conference on
Communications, pp. 3371-3376, Istanbul, Turkey, 11-15 June, IEEE Press,
Piscataway, NJ, USA.
Lindsey, S., Raghavendra, C. & Sivalingam, K. M. (2002) Data gathering algorithms in
sensor networks using energy metrics. IEEE Trans. Parallel Distrib. Syst., Vol. 13,
924-935.
Lynch, J. P., Wang, Y., Sundararajan, A., Law, K. H. & Kiremidjian, A. S. (2004) Wireless
sensing for structural health monitoring of civil structures. Proceedings of the
International Workshop on Integrated Life-Cycle Management of Infrastructures,
Hong Kong, 9-11 December.
LZO (2008)
Madden, S., Franklin, M. J., Hellerstein, J. M. & Hong, W. (2002) TAG: a Tiny AGgregation
service for ad-hoc sensor networks. SIGOPS Oper. Syst. Rev., Vol. 36, 131-146.
Mainwaring, A., Culler, D., Polastre, J., Szewczyk, R. & Anderson, J. (2002) Wireless sensor
networks for habitat monitoring. Proceedings of the First ACM international
Workshop on Wireless Sensor Networks and Applications, pp. 88-97, Atlanta, GA,
USA, 28 September, ACM, New York, NY, USA.
Marcelloni, F. & Vecchio, M. (2009) An efficient lossless compression algorithm for tiny
nodes of monitoring wireless sensor networks, The Computer Journal, Section B:
Networks and Computer Systems, Advance Access, doi:10.1093/comjnl/bxp035.
Pennebaker, W. B. & Mitchell, J. L. (1992) JPEG still image data compression standard. Kluwer
Academic Publishers, Norwell, MA, USA.
Pradhan, S. Kusuma, J. & Ramchandran, K. (2002) Distributed compression in a dense
microsensor network, IEEE Signal Processing Mag., Vol. 19, 51–60.
Rebollo-Monedero, D. (2007) Quantization and transforms for distributed source coding.
PhD thesis The Department of Electrical Engineering and the Committee on
Graduate Studies of Stanford University.
Sadler, C. M. & Martonosi, M. (2006) Data compression algorithms for energy-constrained
devices in delay tolerant networks. Proceedings of the 4th ACM International
Conference on Embedded networked sensor systems, pp. 265-278, Boulder,
Colorado, USA, October 31 - November 3, ACM, New York, NY, USA.
Salomon, D. (2007) Data Compression: The Complete Reference, Springer Verlag, London, UK.
Schoellhammer, T., Osterweil, E., Greenstein, B., Wimbrow, M. & Estrin, D. (2004)
Lightweight temporal compression of microclimate datasets. Proceedings of the
29th Annual IEEE International Conference on Local Computer Networks, pp. 516-
524, Tampa, FL, USA, 16-18 November, IEEE Computer Society, Washington, DC,
USA.
Sensirion (2009) Sensirion homepage, www.sensirion.com
SensorScope (2009), SensorScope deployments homepage
Sim-It (2009) Sim-It Simulator homepage,
Tang, C. & Raghavendra, C. S. (2004) Compression techniques for wireless sensor networks.
In: Wireless Sensor Networks, Raghavendra, C. S., Sivalingam, K. M. and Znati, T.
(Ed.), Kluwer Academic Publishers, Norwell, MA, USA.
Enabling Compression in Tiny Wireless Sensor Nodes 275
wavelet compression algorithm. Proceedings of the Fifth international Conference
on Information Processing in Sensor Networks, pp. 309-316, Nashville, TN, USA,
19-21 April, ACM, New York, NY, USA.
Croce, S., Marcelloni, F. & Vecchio, M. (2008) Reducing power consumption in wireless
sensor networks using a novel approach to data aggregation. The Computer Journal,
Vol. 51, No. 2, 227–239.
Deligiannakis, A., Kotidis, Y. & Roussopoulos, N. (2004) Compressing historical information
in sensor networks. Proceedings of the 2004 ACM SIGMOD International
Conference on Management of Data, pp. 527-538, Paris, France, 13-18 June, ACM,
New York, NY, USA.
Di Bacco, G., Melodia, T. & Cuomo, F. (2004) A MAC protocol for delay-bounded
applications in wireless sensor networks. Proceedings of the Third Annual
Mediterranean Ad Hoc Networking Workshop, pp. 208-220, Bodrum, Turkey, 27-30
June, available on-line:
Elias, P. (1975) Universal codeword sets and representations of the integers. IEEE Transaction
on Information Theory, Vol. 21, No. 2, 194–203.
Faller, N. (1973) An adaptive system for data compression. Proceedings of the 7th Asilomar
Conference on Circuits, Systems, and Computers, pp. 593–597, Pacific Grove, CA,
USA, November, IEEE Press, Piscataway, NJ, USA.
Fan, K-W, Liu, S. & Sinha, P. (2007) Structure-free data aggregation in sensor networks. IEEE
Transactions on Mobile Computing, Vol. 6, 929-942.
Fasolo, E., Rossi, M., Widmer, J. & Zorzi, M. (2007) In-network aggregation techniques for
wireless sensor networks: a survey. Wireless Communications, Vol. 14, 70-87.
Gallager, R. G. (1978) Variations on a theme by Huffman. IEEE Transactions on Information
Theory, Vol. 24, No. 6, 668-674.
Ganesan, D., Estrin, D. & Heidemann, J. (2003) DIMENSIONS: why do we need a new data
handling architecture for sensor networks?, SIGCOMM Comput. Commun. Rev., Vol.
33, 143-148.
Gastpar, M., Dragotti, P. L. & Vetterli, M. (2006) The distributed Karhunen-Loève transform.
IEEE Transactions on Information Theory, Vol. 52, No. 12, 5177-5196.
Girod, B., Aaron, A., Rane, S. & Rebollo-Monedero, D. (2005) Distributed video coding.
Proceedings of the IEEE, Special Issue Advances Video Coding, Delivery, Vol. 93, No.
1, 71–83.
Golomb, S. W. (1966) Run-length encodings. IEEE Transactions on Information Theory, Vol. 12,
No. 3, 399-401.
Guestrin, C., Bodi, P., Thibau, R., Paski, M. & Madden, S. (2004) Distributed regression: an
efficient framework for modelling sensor
network data. Proceedings of the Third
International Symposium on Information Processing in Sensor Networks, pp.1-10,
Berkeley, CA, USA, 26-27 April, ACM, New York, NY, USA.
Intanagonwiwat, C., Govindan, R., Estrin, D., Heidemann, J. & Silva, F. (2003) Directed
diffusion for wireless sensor networking. IEEE/ACM Trans. Netw., Vol. 11, 2-16.
Kimura, N. & Latifi, S. (2005) A survey on data compression in wireless sensor networks.
Proceedings of the International Conference on Information Technology: Coding
and Computing, pp. 8-13, Las Vegas, NV, USA, 4-6 April, IEEE Computer Society,
Washington, DC, USA.
Knuth, D. E. (1985) Dynamic Huffman Coding. Journal of Algorithms, Vol. 6, 163-180.
Lin, S., Kalogeraki, V., Gunopulos, D. & Lonardi, S. (2006) Online information compression
in sensor networks. Proceedings of the IEEE International Conference on
Communications, pp. 3371-3376, Istanbul, Turkey, 11-15 June, IEEE Press,
Piscataway, NJ, USA.
Lindsey, S., Raghavendra, C. & Sivalingam, K. M. (2002) Data gathering algorithms in
sensor networks using energy metrics. IEEE Trans. Parallel Distrib. Syst., Vol. 13,
924-935.
Lynch, J. P., Wang, Y., Sundararajan, A., Law, K. H. & Kiremidjian, A. S. (2004) Wireless
sensing for structural health monitoring of civil structures. Proceedings of the
International Workshop on Integrated Life-Cycle Management of Infrastructures,
Hong Kong, 9-11 December.
LZO (2008)
Madden, S., Franklin, M. J., Hellerstein, J. M. & Hong, W. (2002) TAG: a Tiny AGgregation
service for ad-hoc sensor networks. SIGOPS Oper. Syst. Rev., Vol. 36, 131-146.
Mainwaring, A., Culler, D., Polastre, J., Szewczyk, R. & Anderson, J. (2002) Wireless sensor
networks for habitat monitoring. Proceedings of the First ACM international
Workshop on Wireless Sensor Networks and Applications, pp. 88-97, Atlanta, GA,
USA, 28 September, ACM, New York, NY, USA.
Marcelloni, F. & Vecchio, M. (2009) An efficient lossless compression algorithm for tiny
nodes of monitoring wireless sensor networks, The Computer Journal, Section B:
Networks and Computer Systems, Advance Access, doi:10.1093/comjnl/bxp035.
Pennebaker, W. B. & Mitchell, J. L. (1992) JPEG still image data compression standard. Kluwer
Academic Publishers, Norwell, MA, USA.
Pradhan, S. Kusuma, J. & Ramchandran, K. (2002) Distributed compression in a dense
microsensor network, IEEE Signal Processing Mag., Vol. 19, 51–60.
Rebollo-Monedero, D. (2007) Quantization and transforms for distributed source coding.
PhD thesis The Department of Electrical Engineering and the Committee on
Graduate Studies of Stanford University.
Sadler, C. M. & Martonosi, M. (2006) Data compression algorithms for energy-constrained
devices in delay tolerant networks. Proceedings of the 4th ACM International
Conference on Embedded networked sensor systems, pp. 265-278, Boulder,
Colorado, USA, October 31 - November 3, ACM, New York, NY, USA.
Salomon, D. (2007) Data Compression: The Complete Reference, Springer Verlag, London, UK.
Schoellhammer, T., Osterweil, E., Greenstein, B., Wimbrow, M. & Estrin, D. (2004)
Lightweight temporal compression of microclimate datasets. Proceedings of the
29th Annual IEEE International Conference on Local Computer Networks, pp. 516-
524, Tampa, FL, USA, 16-18 November, IEEE Computer Society, Washington, DC,
USA.
Sensirion (2009) Sensirion homepage, www.sensirion.com
SensorScope (2009), SensorScope deployments homepage
Sim-It (2009) Sim-It Simulator homepage,
Tang, C. & Raghavendra, C. S. (2004) Compression techniques for wireless sensor networks.
In: Wireless Sensor Networks, Raghavendra, C. S., Sivalingam, K. M. and Znati, T.
(Ed.), Kluwer Academic Publishers, Norwell, MA, USA.
Wireless Sensor Networks 276
Teuhola, J. (1978) A Compression Method for Clustered Bit-Vectors. Information Processing
Letters, Vol. 7, 308-311.
TinyNode (2009) TinyNode homepage,
Wagner, R. S., Baraniuk, R. G., Du, S., Johnson, D. B. & Cohen, A. (2006) An architecture for
distributed wavelet analysis and processing in sensor networks. Proceedings of the
Fifth International Conference on Information Processing in Sensor Networks, pp.
243-250, Nashville, TN, USA, 19-21 April, ACM, New York, NY, USA.
Welch, T.A. (1984) A technique for high-performance data compression, Computer, Vol. 17,
8-19.
Ziv, J. & Lempel, A. (1977) A universal algorithm for sequential data compression, IEEE
Transactions on Information Theory, Vol. 23, 337-343.
Zixiang, X., Liveris, A.D. & Cheng, S. (2004) Distributed source coding for sensor networks.
IEEE Signal Processing Magazine, Vol. 21, No. 5, 80-94.
Implementation of Accelerometer Sensor Module and Fall
Detection Monitoring System based on Wireless Sensor Network 277
Implementation of Accelerometer Sensor Module and Fall Detection
Monitoring System based on Wireless Sensor Network
Youngbum Lee and Myoungho Lee
x
Implementation of Accelerometer Sensor
Module and Fall Detection Monitoring System
based on Wireless Sensor Network
Youngbum Lee and Myoungho Lee
Yonsei University, Department of Electrical and Electronic Engineering
Republic of Korea
1. Introduction
ADL means ‘Activity of Daily Living’ and literally the activity from everyday living. In the
early days, the activity measurement system using accelerometer measures in one direction
at one part. This method has an advantage that easy and quantitative measurement is
possible using one sensor. But that is so simple method that precise activity assessment for
various posture classifications in daily living is impossible [2]. For the study about the
correlation between the human’s movement and energy consumption, the method that
measures 3 direction activity data using 3-axis accelerometer sensor is used. This method is
better than using many sensors, but the classification for various human’s movement is still
impossible [5]. In this study, using accelerometer sensor module, we develop the algorithm
that classify the wearer’s posture and activity. And we implement the monitoring system
based on wireless sensor network. For the performance assessment of developed
accelerometer module, algorithm and monitoring system, the experiment for 30 subjects is
executed.
This research implements wireless accelerometer sensor module and algorithm to determine
wearer's posture, activity and fall. Wireless accelerometer sensor module uses ADXL202, 2-
axis accelerometer sensor (Analog Device). And using wireless RF module, this module
measures accelerometer signal and shows the signal at ‘Acceloger’ viewer program in PC.
ADL algorithm determines posture, activity and fall that activity is determined by AC
component of accelerometer signal and posture is determined by DC component of
accelerometer signal. Those activity and posture include standing, sitting, lying, walking,
running, etc. By the experiment for 30 subjects, the performance of implemented algorithm
was assessed, and detection rate for postures, motions and subjects was calculated. Lastly,
using wireless sensor network in experimental space, subject's postures, motions and fall
monitoring system was implemented. By the simulation experiment for 30 subjects, 4 kinds
of activity, 3 times, fall detection rate was calculated. In conclusion, this system can be
application to patients and elders for activity monitoring and fall detection and also sports
athletes’ exercise measurement and pattern analysis. And it can be expected to common
person's exercise training and just plaything for entertainment.
13
Wireless Sensor Networks 278
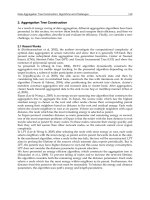
2. Wireless Accelerometer Sensor Module Design and Implementation
In this part, we describe the design and implementation of wireless accelerometer sensor
module. The system consists of wireless accelerometer sensor module and base station
module. In case of wireless accelerometer sensor module, that consists of accelerometer
sensor part, MCU (Micro Controller Unit) part and RF part. In case of base station module,
that consists of wireless receiver part and USB interface part. Lastly, we describe the
monitoring software in PC.
Fig. 1. Block diagram of wireless accelerometer sensor module
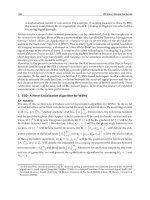
2.1 Accelerometer sensor part
We use ADXL 202 (Analog Device, USA), 2-axis accelerometer sensor that measures +/-2g
acceleration and the output is PWM type digital signal. The module receive this signal by
interrupt and using timer, the pulse width is calculated and sent to receiver by wireless. The
receiver sends this data to USB driver and the ‘Acceloger’ viewer program collects this data
and show the graph in display.
Fig. 2. The size comparison of wireless accelerometer sensor module
2.2 MCU module
We use ATmega8 (ATMEL, USA), and SPI port is used for firmware writing and SD card
interface. Using embedded ADC, MCU read the output of accelerometer sensor. MCU give
the serial clock at wireless module and read the packet data from wireless module. ATmega
series have advantage to develop firmware more easily using efficient GCC and Tool-chain.
2.3 RF wireless module
2.4 GHz wireless radio chip has advantage of its chip size and transmission speed. So, it is
good for embedded application, but its directivity is high, so if there are some obstacles, the
communication doesn’t work well. This problem can be solved using wireless sensor
network. We use wireless radio chip nRF2401 (nVLSI, Norway). This chip is connected to
MCU by 8 pin connector. This chip has double independent transceiver, but we use only one
transceiver. Transceiver uses 76 channels from 2.4-2.5GHz frequency band. We set up that
the channel can be used by any users. The communication protocol in link layer use Shock
Burst embedded in nRF2401 chip. In this mode, 32 byte data can be transmitted with 256
Kbps or 1 Mbps speed. One wireless data packet is 256 bit (32 byte) that consists of 40 bit
receiver address, 40 bit sender address, 20 byte data and 2 byte CRC field. Transceiver treats
transmission to receiver and CRC check task. Antenna is located in PCB board as pattern
type.
2.4 Wireless receiver
Wireless receiver is small dongle type device connected to USB port in PC to deliver the
acceleration signal to PC. Wireless receiver has also ATmega microcontroller and nRF2401
radio chip. ATmega microcontroller uses firmware to implement USB packet processor for
USB Slave. We develop this using AVR-GCC in window’s virtual Linux environment
(CygWin). And this has wireless chip control function such as wireless packet validation,
wireless packet rearrangement and wireless packet error correction. In case of USB Slave, we
implement firmware for relatively simple low speed (1.1Mbps) control transfer. This process
is described below.
- When inserted at USB port that is worked as low speed USB mode delivers various
descriptors to host and finish the setup process.
- In host’s control packet’s user function definition, lamp blinking, RF packet read and RF
packet write function’s service routine is embedded and these 3 routines can be executed
using control packet’s function number.
2.5 Acceleration signal viewer program
Figure 3 shows the signal when we take the wireless acceleration module in hand and shake.
Upper graph is X axis information, lower graph is Y axis information. When the ‘Cont’
checkbox is pushed, the program received the data continuously. ‘LedOn’ and ‘LedOff’
buttons show the receiver’s status and used when the receiver’s LED is blinking. ‘Open’
button is used when connecting to device driver. ‘GetIO’, ‘GetRF’ and ‘RXMODE’ buttons
are for wireless communication debugging and change the mode of wirless receiver’s IO
register dump, wireless packet data dump and receiver’s wireless transceiver to receiving
mode forcibly. Data transmission speed is controlled by changing the firmware.
Implementation of Accelerometer Sensor Module and Fall
Detection Monitoring System based on Wireless Sensor Network 279
2. Wireless Accelerometer Sensor Module Design and Implementation
In this part, we describe the design and implementation of wireless accelerometer sensor
module. The system consists of wireless accelerometer sensor module and base station
module. In case of wireless accelerometer sensor module, that consists of accelerometer
sensor part, MCU (Micro Controller Unit) part and RF part. In case of base station module,
that consists of wireless receiver part and USB interface part. Lastly, we describe the
monitoring software in PC.
Fig. 1. Block diagram of wireless accelerometer sensor module
2.1 Accelerometer sensor part
We use ADXL 202 (Analog Device, USA), 2-axis accelerometer sensor that measures +/-2g
acceleration and the output is PWM type digital signal. The module receive this signal by
interrupt and using timer, the pulse width is calculated and sent to receiver by wireless. The
receiver sends this data to USB driver and the ‘Acceloger’ viewer program collects this data
and show the graph in display.
Fig. 2. The size comparison of wireless accelerometer sensor module
2.2 MCU module
We use ATmega8 (ATMEL, USA), and SPI port is used for firmware writing and SD card
interface. Using embedded ADC, MCU read the output of accelerometer sensor. MCU give
the serial clock at wireless module and read the packet data from wireless module. ATmega
series have advantage to develop firmware more easily using efficient GCC and Tool-chain.
2.3 RF wireless module
2.4 GHz wireless radio chip has advantage of its chip size and transmission speed. So, it is
good for embedded application, but its directivity is high, so if there are some obstacles, the
communication doesn’t work well. This problem can be solved using wireless sensor
network. We use wireless radio chip nRF2401 (nVLSI, Norway). This chip is connected to
MCU by 8 pin connector. This chip has double independent transceiver, but we use only one
transceiver. Transceiver uses 76 channels from 2.4-2.5GHz frequency band. We set up that
the channel can be used by any users. The communication protocol in link layer use Shock
Burst embedded in nRF2401 chip. In this mode, 32 byte data can be transmitted with 256
Kbps or 1 Mbps speed. One wireless data packet is 256 bit (32 byte) that consists of 40 bit
receiver address, 40 bit sender address, 20 byte data and 2 byte CRC field. Transceiver treats
transmission to receiver and CRC check task. Antenna is located in PCB board as pattern
type.
2.4 Wireless receiver
Wireless receiver is small dongle type device connected to USB port in PC to deliver the
acceleration signal to PC. Wireless receiver has also ATmega microcontroller and nRF2401
radio chip. ATmega microcontroller uses firmware to implement USB packet processor for
USB Slave. We develop this using AVR-GCC in window’s virtual Linux environment
(CygWin). And this has wireless chip control function such as wireless packet validation,
wireless packet rearrangement and wireless packet error correction. In case of USB Slave, we
implement firmware for relatively simple low speed (1.1Mbps) control transfer. This process
is described below.
- When inserted at USB port that is worked as low speed USB mode delivers various
descriptors to host and finish the setup process.
- In host’s control packet’s user function definition, lamp blinking, RF packet read and RF
packet write function’s service routine is embedded and these 3 routines can be executed
using control packet’s function number.
2.5 Acceleration signal viewer program
Figure 3 shows the signal when we take the wireless acceleration module in hand and shake.
Upper graph is X axis information, lower graph is Y axis information. When the ‘Cont’
checkbox is pushed, the program received the data continuously. ‘LedOn’ and ‘LedOff’
buttons show the receiver’s status and used when the receiver’s LED is blinking. ‘Open’
button is used when connecting to device driver. ‘GetIO’, ‘GetRF’ and ‘RXMODE’ buttons
are for wireless communication debugging and change the mode of wirless receiver’s IO
register dump, wireless packet data dump and receiver’s wireless transceiver to receiving
mode forcibly. Data transmission speed is controlled by changing the firmware.
Wireless Sensor Networks 280
Fig. 3. ‘Acceloger’ viewer program
3. Implementation of Fall detection monitoring system based on Wireless
Sensor Network
Wireless sensor network is currently almost standardized by ‘Zigbee’, but when there are
specific purpose and limited space, it is better to have optimized wireless communication
stack in wireless sensor network. In this case, there are max 8 relay-nodes in one base-
station. And each relay-node can have max 32 mobile-nodes or fixed-nodes in topology.
Every relay-node, fixed-node and mobile-node can be freely configured as master or slave.
Fixed-node and mobile-node are not in specific relay-node but connected to voluntary one
or many relay-nodes.
Fig. 4. Developed wireless sensor network RF module
3.1 Wireless sensor network design
First, relay-node has a function to repeat retransmitting the received wireless packet
infinitely. But when retransmitting, relay-node turn on ID bit in packet’s specific item and
increase relay-node’s counter number by 1. This function definition is the minimum
condition for ad-hoc network and self organizing network. Fixed-node makes and transmits
the wireless packet by constant time interval or specific event. The packet from fixed-node
has logical serial number, relay-node’s ID item, relay-node’s counter number and sensor
value. Mobile-node has mobility and other character is same as fixed-node. Wireless
acceleration sensor can be modeled as mobile-node because that is taken by mobile object.
The relay-node’s situation is very non-deterministic that is typical feature of wireless sensor
network. Relay-node is installed in fixed location and each relay-node’s location must be
considered carefully. Relay-node is basically located within other relay node’s visibility
range because 2.4 GHz radio wave has strong directivity. By relay-node’s antenna
sensitivity and transmission power, the distance between relay-node can be different but
typically, when 0 dBm (1mW), 10m is the basis. This system uses 1 dBm output. The
topology can be serial, star shape, circle or informal, but each relay-node must link to at least
one relay-node or base-station.
Fig. 5. Simple wireless sensor network without repeater
Implementation of Accelerometer Sensor Module and Fall
Detection Monitoring System based on Wireless Sensor Network 281
Fig. 3. ‘Acceloger’ viewer program
3. Implementation of Fall detection monitoring system based on Wireless
Sensor Network
Wireless sensor network is currently almost standardized by ‘Zigbee’, but when there are
specific purpose and limited space, it is better to have optimized wireless communication
stack in wireless sensor network. In this case, there are max 8 relay-nodes in one base-
station. And each relay-node can have max 32 mobile-nodes or fixed-nodes in topology.
Every relay-node, fixed-node and mobile-node can be freely configured as master or slave.
Fixed-node and mobile-node are not in specific relay-node but connected to voluntary one
or many relay-nodes.
Fig. 4. Developed wireless sensor network RF module
3.1 Wireless sensor network design
First, relay-node has a function to repeat retransmitting the received wireless packet
infinitely. But when retransmitting, relay-node turn on ID bit in packet’s specific item and
increase relay-node’s counter number by 1. This function definition is the minimum
condition for ad-hoc network and self organizing network. Fixed-node makes and transmits
the wireless packet by constant time interval or specific event. The packet from fixed-node
has logical serial number, relay-node’s ID item, relay-node’s counter number and sensor
value. Mobile-node has mobility and other character is same as fixed-node. Wireless
acceleration sensor can be modeled as mobile-node because that is taken by mobile object.
The relay-node’s situation is very non-deterministic that is typical feature of wireless sensor
network. Relay-node is installed in fixed location and each relay-node’s location must be
considered carefully. Relay-node is basically located within other relay node’s visibility
range because 2.4 GHz radio wave has strong directivity. By relay-node’s antenna
sensitivity and transmission power, the distance between relay-node can be different but
typically, when 0 dBm (1mW), 10m is the basis. This system uses 1 dBm output. The
topology can be serial, star shape, circle or informal, but each relay-node must link to at least
one relay-node or base-station.
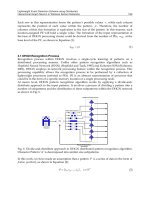
Fig. 5. Simple wireless sensor network without repeater
Wireless Sensor Networks 282
Fig. 6. The example of wireless sensor network construction using repeater
In above figure, the signal from wireless acceleration sensor module can go directly to base-
station or go through relay-node. Relay-node inserts the information in wireless packet.
Using this method, we install the relay-node in each room and make wireless sensor
network. When the RF wave has a problem to go directly to base-station, it goes through
relay-node. In this point, wireless sensor network algorithm must solve the complex
problem that is infinitely repeatable stray packet detection between relay-node, unnecessary
retransmission between relay-node, optimal shortest path finding problem between base-
station and specific relay-node in very complex topology. To solve these 3 problems, the
system typically becomes very complex. In this system, the design purpose is minimum
power consumption, minimum hardware implementation, and optimized algorithm for
small sensor network in limited space. So, we don’t consider optimal path finding problem
and redundant retransmission problem but detect and remove the critical stray packet for
network management. Relay-node changes the counter value and prevents the transmitted
packet from receiving. In this case, this algorithm doesn’t relay any more that stop infinite
repetitions.
3.2 Monitoring system development
Figure 7 shows implemented monitoring program based on wireless sensor network. The
program reads the plain figure of rooms and we can configure the location of relay-node
using mouse pointer. (point A, B, C, D in figure) each wireless station is appeared around
relay-node by number character.
Fig. 7. Implemented monitoring system based on wireless sensor network
4. Experiment and Discussion
The implemented monitoring system based on wireless sensor network is installed in
experimental space and as the result of the experiment; we obtain the posture, activity and
fall detection rate for subjects. Specially, we assume this system can be application for
patient’s and elderly fall detection in sanatorium and hospital, and execute the simulation.
In this experiment, we classify the fall into forward fall, backward fall, side fall and just
sitting and standing. And the detected fall is marked as ‘Success’ and the undetected fall is
‘Fail’. In case of just sitting and standing, when the fall is not detected, that means ‘Success’.
For 30 subjects, we repeat the above 4 kinds of activity by 3 times in experimental space. For
all 360 fall simulation tries, the 337 falls are detected and 23 falls are not detected. The fall
detection rate is 93.2%.
Gender,
Number
Item Avg±SD Min Max
Male, 20
Age 26.4±3.67 20 32
Height 175.8±4.20 168 185
Weight 70.3±6.64 58.1 85
Implementation of Accelerometer Sensor Module and Fall
Detection Monitoring System based on Wireless Sensor Network 283
Fig. 6. The example of wireless sensor network construction using repeater
In above figure, the signal from wireless acceleration sensor module can go directly to base-
station or go through relay-node. Relay-node inserts the information in wireless packet.
Using this method, we install the relay-node in each room and make wireless sensor
network. When the RF wave has a problem to go directly to base-station, it goes through
relay-node. In this point, wireless sensor network algorithm must solve the complex
problem that is infinitely repeatable stray packet detection between relay-node, unnecessary
retransmission between relay-node, optimal shortest path finding problem between base-
station and specific relay-node in very complex topology. To solve these 3 problems, the
system typically becomes very complex. In this system, the design purpose is minimum
power consumption, minimum hardware implementation, and optimized algorithm for
small sensor network in limited space. So, we don’t consider optimal path finding problem
and redundant retransmission problem but detect and remove the critical stray packet for
network management. Relay-node changes the counter value and prevents the transmitted
packet from receiving. In this case, this algorithm doesn’t relay any more that stop infinite
repetitions.
3.2 Monitoring system development
Figure 7 shows implemented monitoring program based on wireless sensor network. The
program reads the plain figure of rooms and we can configure the location of relay-node
using mouse pointer. (point A, B, C, D in figure) each wireless station is appeared around
relay-node by number character.
Fig. 7. Implemented monitoring system based on wireless sensor network
4. Experiment and Discussion
The implemented monitoring system based on wireless sensor network is installed in
experimental space and as the result of the experiment; we obtain the posture, activity and
fall detection rate for subjects. Specially, we assume this system can be application for
patient’s and elderly fall detection in sanatorium and hospital, and execute the simulation.
In this experiment, we classify the fall into forward fall, backward fall, side fall and just
sitting and standing. And the detected fall is marked as ‘Success’ and the undetected fall is
‘Fail’. In case of just sitting and standing, when the fall is not detected, that means ‘Success’.
For 30 subjects, we repeat the above 4 kinds of activity by 3 times in experimental space. For
all 360 fall simulation tries, the 337 falls are detected and 23 falls are not detected. The fall
detection rate is 93.2%.
Gender,
Number
Item Avg±SD Min Max
Male, 20
Age 26.4±3.67 20 32
Height 175.8±4.20 168 185
Weight 70.3±6.64 58.1 85
Wireless Sensor Networks 284
Female,
10
Age 28±3.26 21 31
Height 161.1±5.30 152 171
Weight 55.6±6.72 46.2 67.4
Total 30 Age 26.9±3.61 20 32
Height 170.9±8.31 152 185
Weight 65.4±9.62 46.2 85
Table 1. General data of 30 subjects
Tries Fall Detection
Forward Backward Side Sit and Stand
S F S F S F S F
1 28 2 27 3 29 1 30 0
2 28 2 28 2 27 3 29 1
3 27 3 27 3 28 2 29 1
Total 83 7 82 8 84 6 88 2
Success : 337 Fail : 23
Table 2. Fall detection rate using wireless sensor network monitoring system
5. Conclusion
In this study, using acceleration sensor, we implement wireless acceleration sensor module
and algorithm to detect wearer’s posture, activity and fall. To assess the performance of
algorithm, in specific space, we develop wearer’s posture, activity and fall detection
monitoring system, and for 30 subjects, the fall simulation experiment is executed for 4
kinds of activity, 3 times and calculate fall detection rate. The result is 337 times detection
success and 23 times fail among 360 tries. So, fall detection rate is 93.2%. The developed
system can be used for patient or the senior people’s activity monitoring and fall detection,
also, sports athlete’s activity measurement and pattern analysis, normal people’s exercise
learning and just plaything.
6. References
Henry J. Montoye, Han C. G. Kemper, Wim H. M. Saris, Richard A. Washburn, "Measuring
physical activity and energy expenditure", Human Kinetics, pp.72-96, 1996.
Kim L. Coleman, Douglas G. Smith, David A. Boone, Aaron W. Joseph, Michael A. del
Aguila, "Step activity monitor: long-term, continuous recording of ambulatory
function", Journal of Rehabilitation Research and Development, Vol.36, NO.1, 1999.
F. Foerster, M. Smeja, J. Fahrenberg, "Detection of posture and motion by accelerometry: a
validation study in ambulatory monitoring", Computers in Human Behavior,
Vol.15, pp.571-583, 1999.
H. G. van Steenis, J. H. M. Tulen, "The effects of physical activities on cardivascular
variability in ambulatory situations", Proceedings-19th International Conference-
IEEE/EMBS, pp.105-108, 1997.
Carlijn V.C. Bouten, Karel T. M. Koekkoek, Maarten Verduin, Rens Kodde, Jan D. Janssen,
"A triaxial accelerometer and portable data processing unit for the assessment of
daily physical activity", IEEE Transactions on Biomedical Engineering, Vol.44,
pp.136-147, 1997.
K. Aminian, Ph. Robert, E. E. Buchser, B. Rutschmann, D. Hayoz, M. Depairon, "Physical
activity monitoring based on accelerometry: validation and comparison with video
observation", Medical & Biological Engineering & Computing, Vol.37, pp.304-308,
1999.
B. Najafi, K. Aminian, F. Loew, Y. Blanc, "An ambulatory system for physical activity
monitoring in elderly", IEEE-EMBS Special Topic Conference on Microtechnologies
in Medicine & Biology, pp.562-566, 2000.
S. H. Lee, H. D. Park, H. R. Yoon, K. J. Lee, "Design of a Portable Activity Monitoring
System", The Korean Institute of Electrical Engineer, Vol.51, pp.32-38, 2002
Bijan Najafi, "Ambulatory System for Human Motion Analysis Using a Kinematic Sensor:
Monitoring of Daily Physical Activity in the Elderly", IEEE Trans. on biomedical
Engineering, Vol. 50, No.6, June 2003
G.Williams, "A Smart Fall & Activity Monitor for Telecare Application", Proceeding of the
20th Annual International Conference of the IEEE Engineering n Medicine and
Biology Society, 1998
J.Y.Hwang, "Development of Novel Algorithm and Real-time Monitoring Ambulatory
System Using Bluetooth Module for Fall Detection in the Elderly", Proceedings of
the 26th Annual International Conference of the IEEE EMBS San Francisco, CA,
USA, September 1-5, 2004
Implementation of Accelerometer Sensor Module and Fall
Detection Monitoring System based on Wireless Sensor Network 285
Female,
10
Age 28±3.26 21 31
Height 161.1±5.30 152 171
Weight 55.6±6.72 46.2 67.4
Total 30 Age 26.9±3.61 20 32
Height 170.9±8.31 152 185
Weight 65.4±9.62 46.2 85
Table 1. General data of 30 subjects
Tries Fall Detection
Forward Backward Side Sit and Stand
S F S F S F S F
1 28 2 27 3 29 1 30 0
2 28 2 28 2 27 3 29 1
3 27 3 27 3 28 2 29 1
Total 83 7 82 8 84 6 88 2
Success : 337 Fail : 23
Table 2. Fall detection rate using wireless sensor network monitoring system
5. Conclusion
In this study, using acceleration sensor, we implement wireless acceleration sensor module
and algorithm to detect wearer’s posture, activity and fall. To assess the performance of
algorithm, in specific space, we develop wearer’s posture, activity and fall detection
monitoring system, and for 30 subjects, the fall simulation experiment is executed for 4
kinds of activity, 3 times and calculate fall detection rate. The result is 337 times detection
success and 23 times fail among 360 tries. So, fall detection rate is 93.2%. The developed
system can be used for patient or the senior people’s activity monitoring and fall detection,
also, sports athlete’s activity measurement and pattern analysis, normal people’s exercise
learning and just plaything.
6. References
Henry J. Montoye, Han C. G. Kemper, Wim H. M. Saris, Richard A. Washburn, "Measuring
physical activity and energy expenditure", Human Kinetics, pp.72-96, 1996.
Kim L. Coleman, Douglas G. Smith, David A. Boone, Aaron W. Joseph, Michael A. del
Aguila, "Step activity monitor: long-term, continuous recording of ambulatory
function", Journal of Rehabilitation Research and Development, Vol.36, NO.1, 1999.
F. Foerster, M. Smeja, J. Fahrenberg, "Detection of posture and motion by accelerometry: a
validation study in ambulatory monitoring", Computers in Human Behavior,
Vol.15, pp.571-583, 1999.
H. G. van Steenis, J. H. M. Tulen, "The effects of physical activities on cardivascular
variability in ambulatory situations", Proceedings-19th International Conference-
IEEE/EMBS, pp.105-108, 1997.
Carlijn V.C. Bouten, Karel T. M. Koekkoek, Maarten Verduin, Rens Kodde, Jan D. Janssen,
"A triaxial accelerometer and portable data processing unit for the assessment of
daily physical activity", IEEE Transactions on Biomedical Engineering, Vol.44,
pp.136-147, 1997.
K. Aminian, Ph. Robert, E. E. Buchser, B. Rutschmann, D. Hayoz, M. Depairon, "Physical
activity monitoring based on accelerometry: validation and comparison with video
observation", Medical & Biological Engineering & Computing, Vol.37, pp.304-308,
1999.
B. Najafi, K. Aminian, F. Loew, Y. Blanc, "An ambulatory system for physical activity
monitoring in elderly", IEEE-EMBS Special Topic Conference on Microtechnologies
in Medicine & Biology, pp.562-566, 2000.
S. H. Lee, H. D. Park, H. R. Yoon, K. J. Lee, "Design of a Portable Activity Monitoring
System", The Korean Institute of Electrical Engineer, Vol.51, pp.32-38, 2002
Bijan Najafi, "Ambulatory System for Human Motion Analysis Using a Kinematic Sensor:
Monitoring of Daily Physical Activity in the Elderly", IEEE Trans. on biomedical
Engineering, Vol. 50, No.6, June 2003
G.Williams, "A Smart Fall & Activity Monitor for Telecare Application", Proceeding of the
20th Annual International Conference of the IEEE Engineering n Medicine and
Biology Society, 1998
J.Y.Hwang, "Development of Novel Algorithm and Real-time Monitoring Ambulatory
System Using Bluetooth Module for Fall Detection in the Elderly", Proceedings of
the 26th Annual International Conference of the IEEE EMBS San Francisco, CA,
USA, September 1-5, 2004
Realizing a CMOS RF Transceiver for Wireless Sensor Networks 287
Realizing a CMOS RF Transceiver for Wireless Sensor Networks
Hae-Moon Seo
X
Realizing a CMOS RF Transceiver
for Wireless Sensor Networks
Hae-Moon Seo
1, 2
1
Korea Electronics Technology Institute (KETI),
2
Kyungpook National University (KNU)
South Korea
1. Introduction
The choice of the CMOS radio frequency (RF) transceiver architecture affects the design of
the whole system and is thus a fundamental one. In order to make a good choice, several
factors have to be considered, the most important ones being: performance, power
consumption, die size, cost, integration level, and time-to-market. The
minimum required
performance is dictated by the IEEE802.15.4 standard approval. The relative weight of all
other factors is determined by the wireless sensor network application at hand. As the RF
transceiver developed here targets very small devices such as information-gathering nodes
for sensor network applications, a small size and low power consumption are key
requirements. In particular, as power consumption sets dimensions and type of the battery,
it also has a major impact on size, weight, and cost of the system.
In this chapter, we explore the implementation and testing of a fully CMOS integrated RF
transceiver for wireless sensor networks in sub-GHz ISM-band applications. A
comprehensive description of the radio system architecture, RF transceiver circuits, and
measurement results is described in this sub-chapter. At the end of this chapter, a fully
CMOS RF transceiver chip is presented to give an impression of the possible die size and
floor plan for a highly integrated transceiver chip.
1.1 Introduction of Wireless Sensor Networks
Recently, the desire for wireless connectivity has led an exponential growth in wireless
communication. In particular, wireless sensor networks are potential wireless network
applications for the following future ubiquitous computing system. Ubiquitous sensor
networks are an emerging research area with potential applications in environmental
monitoring, surveillance, military, health, and security (Y. K. Park et al. 2005), . The power
dissipation of wireless sensor networks does require low power consumption for several
years’ operation. There has been a great deal of interest in realizing low power, low cost,
compact RF transceiver IC for wireless sensor networks. Several technological trends that
are driving the technical evolution of wireless technology include the process scaling of
CMOS transistors and higher bandwidth available at ISM bands. Almost all of the license
free bands propose both linear and nonlinear modulation standards for wireless
applications, and thus requiring different design optimizations in the RF transceiver. Along
14
Wireless Sensor Networks 288
with these issues, there exists the challenge to develop fully integrated wireless solutions in
silicon-based substrates (S. Sarkar et al., 2003).
2. The Radio System Architecture for Wireless Sensor Networks
Conventional transceiver architectures as shown in Fig.1 include heterodyne, zero-IF
(intermediate-frequency), and low-IF conversion structure (P. S. Choi et al. (2003), C.
Cojocaru et al. (2003), M. Valla et al. (2005), Ilku-Nam et al. (2003)), each having their own
advantages and disadvantages. However, it becomes further challenging to meet all the
specifications of many applications while keeping more competitiveness than the others.
The super-heterodyne architecture is without any doubt the most often used transceiver
topology and it has been in use for a long time already and its way of operating is very well
known. It is the most widely used architecture, mainly because of its high performance.
However, it usually requires image-reject and external channel selection filters and is
therefore not well suited for fully integrated systems. Also, it has difficulties in the multi-
band/mode transceiver and has problems of high power consumption, high cost.
The low-IF and zero-IF architectures can achieve much better performance at low-power
consumption and are well suited for high integration.
The concept of the low-IF (P. S. Choi et al. (2003), C. Cojocaru et al. (2003)) starts from the
survey that all information necessary to separate the mirror frequency from the wanted
frequency is available in the two low frequencies after quadrature conversion. This scheme
can avoid the DC offset problem and eliminate IF SAW and image RF filters. However, it
suffers from impairments such as I/Q mismatching, even-order nonlinearity, and local
oscillator (LO) pulling/leakage. Some calibration techniques for stringent image rejection
may be used at the expense of additional complexity and power consumption.
Finally, zero-IF (M. Valla et al. (2005), Ilku-Nam et al. (2003)) architecture performs a direct
down-conversion of the wanted frequency to the baseband. The consequence is that the
mirror signal is equal to the wanted frequency. This does however not mean that there
would not be a mirror signal problem in the zero-IF receiver. But, this architecture remains
the most suitable solution for high integration, low power consumption, and low cost.
Moreover, it has advantage in elimination of image rejection requirements. However, it may
suffer from impairments of DC offset, flicker noise, and complication of LO frequency-
planning to evade LO pulling/leakage.
The communication nodes for ubiquitous networks are required to be integrated in one die
for low power consumption and low cost wireless sensor network applications. The overall
wireless personal area networks (WPAN) system architecture is shown in Fig.2. It consists of
the RF transceiver and a companion digital baseband (BB) processor, which implements
both physical (PHY) and medium access control (MAC) layers of the IEEE 802.15.14
standard (IEEE Computer Society (2003)). Fig.2 shows the architecture of a radio chip, which
consists of a receiver, a transmitter and a frequency synthesizer with on-chip voltage-
controlled oscillator (VCO). Note that RF transceiver chip includes a 6-bit digital-to-analog
converter (DAC) and 4-bit I/Q analog-to-digital converters (ADCs). The receiver adopts
zero-IF architecture to have low power consumption, low cost and small size (M. Valla et al.
(2005), Ilku- Nam et al. (2003), Kwang-Jin Koh et al. (2004), M. Zargari et al. (2004), S. F. R.
Chang et al. (2005), W. Hioe et al. (2004)). The RF front-end circuits of receiver are shown in
Fig.3. The sub-GHz RF signal is first amplified by a low noise amplifier (LNA)
(a) Super-heterodyne architectre
(b) Zero-IF architectre
(a) Low-IF architectre
Fig. 1. Transceiver architectures
Realizing a CMOS RF Transceiver for Wireless Sensor Networks 289
with these issues, there exists the challenge to develop fully integrated wireless solutions in
silicon-based substrates (S. Sarkar et al., 2003).
2. The Radio System Architecture for Wireless Sensor Networks
Conventional transceiver architectures as shown in Fig.1 include heterodyne, zero-IF
(intermediate-frequency), and low-IF conversion structure (P. S. Choi et al. (2003), C.
Cojocaru et al. (2003), M. Valla et al. (2005), Ilku-Nam et al. (2003)), each having their own
advantages and disadvantages. However, it becomes further challenging to meet all the
specifications of many applications while keeping more competitiveness than the others.
The super-heterodyne architecture is without any doubt the most often used transceiver
topology and it has been in use for a long time already and its way of operating is very well
known. It is the most widely used architecture, mainly because of its high performance.
However, it usually requires image-reject and external channel selection filters and is
therefore not well suited for fully integrated systems. Also, it has difficulties in the multi-
band/mode transceiver and has problems of high power consumption, high cost.
The low-IF and zero-IF architectures can achieve much better performance at low-power
consumption and are well suited for high integration.
The concept of the low-IF (P. S. Choi et al. (2003), C. Cojocaru et al. (2003)) starts from the
survey that all information necessary to separate the mirror frequency from the wanted
frequency is available in the two low frequencies after quadrature conversion. This scheme
can avoid the DC offset problem and eliminate IF SAW and image RF filters. However, it
suffers from impairments such as I/Q mismatching, even-order nonlinearity, and local
oscillator (LO) pulling/leakage. Some calibration techniques for stringent image rejection
may be used at the expense of additional complexity and power consumption.
Finally, zero-IF (M. Valla et al. (2005), Ilku-Nam et al. (2003)) architecture performs a direct
down-conversion of the wanted frequency to the baseband. The consequence is that the
mirror signal is equal to the wanted frequency. This does however not mean that there
would not be a mirror signal problem in the zero-IF receiver. But, this architecture remains
the most suitable solution for high integration, low power consumption, and low cost.
Moreover, it has advantage in elimination of image rejection requirements. However, it may
suffer from impairments of DC offset, flicker noise, and complication of LO frequency-
planning to evade LO pulling/leakage.
The communication nodes for ubiquitous networks are required to be integrated in one die
for low power consumption and low cost wireless sensor network applications. The overall
wireless personal area networks (WPAN) system architecture is shown in Fig.2. It consists of
the RF transceiver and a companion digital baseband (BB) processor, which implements
both physical (PHY) and medium access control (MAC) layers of the IEEE 802.15.14
standard (IEEE Computer Society (2003)). Fig.2 shows the architecture of a radio chip, which
consists of a receiver, a transmitter and a frequency synthesizer with on-chip voltage-
controlled oscillator (VCO). Note that RF transceiver chip includes a 6-bit digital-to-analog
converter (DAC) and 4-bit I/Q analog-to-digital converters (ADCs). The receiver adopts
zero-IF architecture to have low power consumption, low cost and small size (M. Valla et al.
(2005), Ilku- Nam et al. (2003), Kwang-Jin Koh et al. (2004), M. Zargari et al. (2004), S. F. R.
Chang et al. (2005), W. Hioe et al. (2004)). The RF front-end circuits of receiver are shown in
Fig.3. The sub-GHz RF signal is first amplified by a low noise amplifier (LNA)
(a) Super-heterodyne architectre
(b) Zero-IF architectre
(a) Low-IF architectre
Fig. 1. Transceiver architectures
Wireless Sensor Networks 290
Fig. 2. Overall system architecture supporting wireless sensor networks in sub-GHz ISM-
band: RF transceiver & Baseband Processor
and then down-converted to zero-IF I/Q signals by two identical mixers driven by
quadrature LO signals from a frequency synthesizer. At the analog baseband stage, using a
third-order RC filter and programmable gain amplifier simultaneously performs channel
selection filtering, signal amplification, and dc-offset cancellation. In addition, I/Q 4-bit dual
flash-ADCs are connected to interface of MODEM block. The transmitter adopts a zero-IF
modulation with up-conversion mixer using a current mixing scheme. Baseband BPSK
signals generated by digital modulator in MODEM block are followed by a 6-bit DAC. A
mixer does directly up-convert the baseband signals directly 900-MHz, which is combined
by RC low-pass filter. Since BPSK modulation is a constant envelop modulation, a nonlinear
power amplifier with high efficiency can be used for high power emission. For generating
900-MHz LO signals with 2-MHz channel spacing, an integer-N frequency synthesizer
derived from a 30-MHz crystal oscillator with 30-ppm accuracy is implemented. A 1.8GHz
LO signals are generated by a VCO with a small area and high Q (quality factor) on-chip
inductor. A divide-by-two circuit then produces the 900-MHz LO I/Q signals for frequency
mixing of TX and RX mode. The frequency synthesizer is implemented in fully differential
type, for immunity to common mode noise.
In consideration of RF transceiver IC implementation for WSN applications, the low power
consumption is a key issue. To achieve this, adequate trade-offs are required for system
power consumption, chip area, gain, noise figure, and linearity. Since the radio will operate
with a very low-duty cycle for WSN applications, the sleep mode current and battery
leakage current can be reduced with the optimization of current sources. Also, the use of
Power
AMP
Ant.
LNA
I-DownMix
Q-DownMix
4bit
ADC
RSSI
T/R
SW
BPF
Frequency
Synthsizer
Dividers
Baseband/
MAC
(Modem,
Processor)
6bit
DAC
RF Modulated
Signal
LPF / PGA
I/Q offset rej.
DC- Correct
& LPF
RF Transceiver
Xtal
RXIdata[0:3]
RXQdata[0:3]
TXdata[0:5]
VCO
[1.8GHz]
Serial
interface
control
SPI
Logic
small devices with a small active area, regardless of system IC performance degradation,
can be applied for the reduction of sleep mode current. The power dissipation in driving
pad and trace parasitic capacitances for off-chip inductors is removed with an on-
Fig. 3. RF front-end circuits of receiver: low-noise amplifier & I/Q down-conversion mixer
chip inductor. Since the transmit power is very low (max. -3 dBm) as compared with other
standards, the transmit RF front-end can be implemented with low power consumption
using a simpler current mixing scheme and resistive load.
3. RF Transceiver Circuit Implementation
RF transceiver chip is designed using 0.18-µm mixed-signal CMOS process including six
metal layers with 2-µm thick top metal. This process provides high gain and good quality
factor Q (8) for on-chip inductor, resulting in low power consumption in RF and analog
circuits.
3.1 Receiver
The RF front-end (RFE) of a realized WPAN receiver chain consists of low-noise amplifier
(LNA), quardrature down-conversion mixer. The fully balanced sub-GHz LNA shown in
Fig. 2 uses current-reuse
complementary technique (pMOS and nMOS) without inductor
requiring large area. Input matching is realized by external passive LC components. The
LNA features 2.6 dB noise
figure (NF) and a third-order input intercept point (IIP
3
) of 5.2
dBm at maximum gain. The differential outputs of LNA are down-converted directly into a
common analog baseband path by a Gilbert-cell-based quadrature frequency demodulator.
The selection of the vertical bipolar transistors in the switching quadrant decrease the gain
of mixer, however, the average integrated noise floor in the direct-conversion receiver
improves due to the reduced 1/f noise (Ilku-Nam et al. (2003)). The large voltage headroom
achieved by Gilbert multiplier type with source grounded topology helps maximize the
contribution of linearity in the overall IIP
3
. The estimated IIP
3
is 6 dBm.
V
IN
VDD
VSS
Vbias1
Vbias2
RF
IP
RF
IN
V
IP
LO0
LO90
V
IP
LO180
LO0
LO0
V
dd
R
L
R
L
V
ss
V
ON
V
OP
V
B
V
IN
I-path Mixer
Realizing a CMOS RF Transceiver for Wireless Sensor Networks 291
Fig. 2. Overall system architecture supporting wireless sensor networks in sub-GHz ISM-
band: RF transceiver & Baseband Processor
and then down-converted to zero-IF I/Q signals by two identical mixers driven by
quadrature LO signals from a frequency synthesizer. At the analog baseband stage, using a
third-order RC filter and programmable gain amplifier simultaneously performs channel
selection filtering, signal amplification, and dc-offset cancellation. In addition, I/Q 4-bit dual
flash-ADCs are connected to interface of MODEM block. The transmitter adopts a zero-IF
modulation with up-conversion mixer using a current mixing scheme. Baseband BPSK
signals generated by digital modulator in MODEM block are followed by a 6-bit DAC. A
mixer does directly up-convert the baseband signals directly 900-MHz, which is combined
by RC low-pass filter. Since BPSK modulation is a constant envelop modulation, a nonlinear
power amplifier with high efficiency can be used for high power emission. For generating
900-MHz LO signals with 2-MHz channel spacing, an integer-N frequency synthesizer
derived from a 30-MHz crystal oscillator with 30-ppm accuracy is implemented. A 1.8GHz
LO signals are generated by a VCO with a small area and high Q (quality factor) on-chip
inductor. A divide-by-two circuit then produces the 900-MHz LO I/Q signals for frequency
mixing of TX and RX mode. The frequency synthesizer is implemented in fully differential
type, for immunity to common mode noise.
In consideration of RF transceiver IC implementation for WSN applications, the low power
consumption is a key issue. To achieve this, adequate trade-offs are required for system
power consumption, chip area, gain, noise figure, and linearity. Since the radio will operate
with a very low-duty cycle for WSN applications, the sleep mode current and battery
leakage current can be reduced with the optimization of current sources. Also, the use of
Power
AMP
Ant.
LNA
I-DownMix
Q-DownMix
4bit
ADC
RSSI
T/R
SW
BPF
Frequency
Synthsizer
Dividers
Baseband/
MAC
(Modem,
Processor)
6bit
DAC
RF Modulated
Signal
LPF / PGA
I/Q offset rej.
DC- Correct
& LPF
RF Transceiver
Xtal
RXIdata[0:3]
RXQdata[0:3]
TXdata[0:5]
VCO
[1.8GHz]
Serial
interface
control
SPI
Logic
small devices with a small active area, regardless of system IC performance degradation,
can be applied for the reduction of sleep mode current. The power dissipation in driving
pad and trace parasitic capacitances for off-chip inductors is removed with an on-
Fig. 3. RF front-end circuits of receiver: low-noise amplifier & I/Q down-conversion mixer
chip inductor. Since the transmit power is very low (max. -3 dBm) as compared with other
standards, the transmit RF front-end can be implemented with low power consumption
using a simpler current mixing scheme and resistive load.
3. RF Transceiver Circuit Implementation
RF transceiver chip is designed using 0.18-µm mixed-signal CMOS process including six
metal layers with 2-µm thick top metal. This process provides high gain and good quality
factor Q (8) for on-chip inductor, resulting in low power consumption in RF and analog
circuits.
3.1 Receiver
The RF front-end (RFE) of a realized WPAN receiver chain consists of low-noise amplifier
(LNA), quardrature down-conversion mixer. The fully balanced sub-GHz LNA shown in
Fig. 2 uses current-reuse
complementary technique (pMOS and nMOS) without inductor
requiring large area. Input matching is realized by external passive LC components. The
LNA features 2.6 dB noise
figure (NF) and a third-order input intercept point (IIP
3
) of 5.2
dBm at maximum gain. The differential outputs of LNA are down-converted directly into a
common analog baseband path by a Gilbert-cell-based quadrature frequency demodulator.
The selection of the vertical bipolar transistors in the switching quadrant decrease the gain
of mixer, however, the average integrated noise floor in the direct-conversion receiver
improves due to the reduced 1/f noise (Ilku-Nam et al. (2003)). The large voltage headroom
achieved by Gilbert multiplier type with source grounded topology helps maximize the
contribution of linearity in the overall IIP
3
. The estimated IIP
3
is 6 dBm.
V
IN
VDD
VSS
Vbias1
Vbias2
RF
IP
RF
IN
V
IP
LO0
LO90
V
IP
LO180
LO0
LO0
V
dd
R
L
R
L
V
ss
V
ON
V
OP
V
B
V
IN
I-path Mixer
Wireless Sensor Networks 292
The analog front-end (AFE) of a realized WPAN receiver consists of continuous-time low
pass filters, highly linear programmable gain amplifier (PGA), filter tuning circuit, and DC
Gm Gm
Gm Gm
V
IP
V
con
V
IN
Vdd
Vss
V
OP
V
ON
Gm-cell
Fig. 4. Analog baseband circuits of receiver I: the channel selection filter with third-order
Butterworth LPF using proposed transconductance cells (Gm-cell)
offset cancellation block. The third order Butterworth filter was implemented cascading a
biquad cell and a single pole cell, and the programmable gain cell was stationed at the
middle to improve the cascaded dynamic range. The AFE design is concentrated on
optimizing the dynamic range and keeping the required die area small and low power
consumption. The baseband noise is dominated by the thermal noise of the PMOS current
sources at the quadrature mixer outputs. The flicker noise is not a significant problem at
baseband since all transistors are designed with a long channel length for better matching.
Moreover, the output of the DAC is DC blocked using a baseband modem control signal to
minimize the effect of the internal DC offsets from limiting the dynamic range of the
receiver.
The channel filter allows a signal of the desired band to pass and attenuates the adjacent
channel and the alternate channel. The filter requirement in this chapter, is
as follows. Since
it is a direct-conversion receiver (DCR) structure, 1/f noise should be reduced and the DC
offset should be small. In addition, in order to alleviate the SFDR requirements of the PGA
and the ADC, most of the interference is filtered in the first part (J. Silava-Martinez et al.
(1992), Y. Palaskas e al. (2004)). Figure 4 shows the designed third order Butterworth LPF.
Using the single pole of the passive RC at the output stage of the mixer reduces the
interference that can affect the dynamic range at the baseband input stage, and using the
overshoot of biquad compensates the in-band loss. Figure 4 shows the proposed Gm-cell
with degeneration resistor. Two Gm-cells are used as one to reduce the area that LPF
occupies. The lumped resistor and the size of MOS should be properly adjusted to improve
the linearity of the Gm-cell.
The signal level of the RF input requires a minimum dynamic range of 78 dB, namely from –
98 dBm to -20 dBm. The automatc gain-control (AGC) control signal receives the digital
control signal from the baseband modem to control the gain of the receiver. The PGA of this
receiver utilizes the three gain stages to control the gain of 0 ~ 65 dB with a 1-dB step. The
resistor switching method was utilized in order not to lose the linearity of PGA. I/Q 4bit
Fig. 5. Analog baseband circuits of receiver II: (a) The tuning circuit for channel selection
filter, (b) The circuit of a fusing cell for filter-tuning, (c) DAC schematic for DC offset
adjustment
dual flash-ADCs are designed for interface of baseband modem block. The simulated
maximum DC current consumption of an overall receiver path is 6 mA.
Figure 5 shows the automatic-tuning circuit, which is based on indirect tuning method.
Since the characteristics of the Gm-C filter are determined by the transconductance value,
the gm has to be controlled to keep a fixed pole frequency. The gm value should not be
changed even by process variations or outer environment changes. As shown in Fig. 5(a), it
is important to keep a gm value and a ratio of gm output current to gm input voltage equal.
And the required current for sinking or sourcing is designed to minimize changes of gm by
reducing current change due to the temperature variation from bias block. The current I1 in
Fig. 5(a) offsets the MOS of the bias part as well as the temperature variation of resistance so
as to minimize the changes of voltage Vab due to the temperature and to evenly maintain
the input voltage of the gm-cell. The converging time of tuning circuit is designed to less
than 100 msec. If the cut-off frequency differs from the designed value, as
a parameter set up
the first time it distorts the value of gm by the process variations, gm should be adjusted by
changing current I2 by fusing. Fusing is controlled by serial port
4
Fusing
Point
Zenb
dinb
PoR
do
I
M1
a
Vcm
R
R
I1
I1
Gm
C
CI2
I2
Vref1
Vref2
Up/
Dn
Cnt
Comparator
a
b
(a) (b)
d7
d0b
d1b
d2b
d3b
d4b
d5b
d6b
d0b
d7
d1b
d2b
d3b
d4b
d5b
d6b
d7b
d7b
Vcm
R
R
Iref
Vinp
Vinn
M1
M2 M3
M4 M5
P1 P2 P3
P4 P5
(c)