Self Organizing Maps Applications and Novel Algorithm Design Part 3 potx
Bạn đang xem bản rút gọn của tài liệu. Xem và tải ngay bản đầy đủ của tài liệu tại đây (866.3 KB, 40 trang )
4
Modelling with Self-Organising Maps and Data
Envelopment Analysis: A Case Study in
Educational Evaluation
Lidia Angulo Meza, Luiz Biondi Neto, Luana Carneiro Brandão, Fernando
do Valle Silva Andrade, João Carlos Correia Baptista Soares de Mello
and Pedro Henrique Gouvêa Coelho
Universidade Federal Fluminense and Universidade do Estado do Rio de Janeiro
Brazil
1. Introduction
In this chapter we deal with a problem of educational evaluation. We deal with an
organization for distance education in the State of Rio de Janeiro, Brazil. This organization is
the centre for distance undergraduate education in the Rio de Janeiro State (CEDERJ for the
name in Portuguese). Although CEDERJ provides a wide set of undergraduate courses we
focus ourselves on the Mathematics undergraduate course. The choice of this course is due
to the fact that it exists since the very beginning of the CEDERJ.
We do not intend to evaluate distance undergraduate education itself. That is, we will not
compare results from distance undergraduate education with results from in situ
undergraduate education. Instead, we will compare distance education with itself, thus
meaning we will evaluate some thirteen centres of distance education, all of them belonging
to the CEDERJ. We want to determine the best managerial practices and the most favourable
regions to inaugurate new CEDERJ centres.
The comparison hereabove mentioned takes into account how many students finish the
course in each centre, how many students have began the course and the proxy for the
resources employed in each centre. In the present chapter, we only consider graduates as
outputs because graduating students is the main target of CEDERJ, while producing
researches have low priority.
In order to perform this evaluation, we will use a non parametric technique known as Data
Envelopment Analysis – DEA. Initially developed by Charnes et al (1978), this technique
deals with productive units, called Decision Making Units (DMUs). The DMUs use the same
inputs to produce the same outputs and the DMUs set must be homogenous, i.e. they must
work in similar environmental conditions. It is important to notice that these DMUs are not
necessarily units involved in a productive or manufacture process, but they can be entity
using resources (inputs) to generate some kind of products (outputs).
In our case, the homogenous conditions are not verified since CEDERJ centres are located in
different regions of the Rio de Janeiro State with different socio economical conditions that
cannot be considered in the evaluation. So, in order to perform a DEA evaluation, we need
Self Organizing Maps - Applications and Novel Algorithm Design
72
to separate the centres in homogenous clusters according to their environmental conditions.
To do that, we use the Kohonen self-organizing maps to cluster the centres. This is done
taking into account some environmental variables.
After the clustering of the centres, we perform a DEA evaluation inside each cluster and
overall DEA evaluation using an handicap index to compare the heterogeneous DMUs. We
also identify the efficient centre and the benchmarks for the inefficient ones.
As mentioned above, this chapter deals with Data Envelopment Analysis and Kohonen Self
Organizing Maps. The self-organising maps are a special case of neural networks. There are
already some papers dealing with the use of Neural Networks and Data Envelopment
Analysis altogether. For instance, Samoilenko and Osei-Bryson (2010) use Neural Networks
and DEA to determine if the differences among efficiency scores are due to environmental
variables or the management process. The use of Neural Network for clustering and
benchmarking container terminals was done by Sharma and Yu (2009). Also Churilov and
Flitman (2006) used Kohonen self-organizing maps to cluster countries participating of the
Olympics and then using DEA for producing a new ranking of participating teams.
Emrouznejad and Shale (2009) and Biondi Neto et al. (2004) used the back propagation
neural network algorithm to accelerate computations in DEA. Çelebi and Bayraktar (2008)
used Neural Networks to estimate missing information for suppliers evaluation using DEA.
This chapter is organized as follows; in the next two sections we briefly present the
fundamentals of Data Envelopment Analysis (DEA) and Kohonen Neural Networks. In each
of these sections we also present a brief bibliographical review of each one in the area of
interest in this chapter, educational evaluation. In section 4, we present our case study, the
CEDERJ distance undergraduate centres. Kohonen maps are used to cluster and DEA to
evaluate the CEDERJ centres. Finally we present some conclusions, our acknowledgments
and the references.
2. The fundamentals of data envelopment analysis
Data Envelopment Analysis – DEA was initially developed by Charnes et al. (1978) for
school evaluation. This is a linear programming method to compute Decision Making Units
– DMUs comparative efficiencies whenever financial matters are neither the only ones to
take into consideration nor even the dominant ones. A DMU relative efficiency is defined as
the ratio of the weighted sum of its outputs to the weighted sum of its inputs.
Contrary to traditional multi-criteria decision aid models there is no arbitrary decision-
maker that chooses the weights to be assigned to each weighing coefficient. These obtain
instead from the very mathematical model. To do so, a fractional programming problem is
solved to assign to each DMU the weights that maximize its efficiency. The weights are thus
different for each unit and they are the most advantageous for the unit. So the DEA
approach avoids the criticism from unit managers whose evaluation was not good that the
weights were biased.
DEA models can take into account different scales of operation. When that happens the
model is called BCC (Banker et al., 1984). When efficiency is measured taking no account of
scale effects, the model is called CCR (Charnes et al., 1978). The formulation for the
previously linearized fractional programming problem is shown in (1) for the DEA CCR
(Cooper et al., 2000, Seiford, 1996).
For model (1) with n DMUs, m inputs and s outputs, let h
o
be the efficiency of DMU o being
studied; let x
ik
be i input of DMU k, let y
jk
be j output of DMU k; let v
i
be the weight assigned
Modelling with Self-Organising Maps and Data Envelopment Analysis:
A Case Study in Educational Evaluation
73
to i input; let u
j
be the weight assigned to j output. This model must be solved for each
DMU.
m
iio
i1
s
jjo
j1
sm
jjk iik
j1 i1
ji
min v x
st
uy 1
u
y
v x 0 , k 1, ,n
u,v 0 x,y
=
=
==
=
−≤=
≥∀
∑
∑
∑∑
(1)
Evaluating governmental institutions, such as CEDERJ and other educational institutions, is
difficult mainly because of the price regulation and subventions, what generally leads to
distortion (Abbott & Doucouliagos, 2003). However, DEA does not require pricing, and this
is why it is broadly used for this type of evaluations.
DEA has been widely used in educational evaluation. For instance, Abbott & Doucouliagos
(2003) measured technical efficiency in the Australian university system. They considered as
outputs many variables referring to research and teaching. Abramo et al (2008) evaluated
Italian universities, concerning basically scientific production.
The first authors went through analysis using various combinations of inputs and outputs,
because the choice of the variables can greatly influence how DMUs are ranked, which is
similar to what is done the process of variable selection in the present paper. The seconds
also verify the importance of choosing the right variables, by comparing the final results
with analysis of sensitivity, and observing how different they are.
Abbott & Doucouliagos (2003) introduce the concept of benchmarking as one of DEA
strengths, though neither of the articles actually calculates it. Finding benchmarks and anti-
benchmarks is important for the study’s applicability, since it is the first step to improving
the inefficient DMUs. These authors also propose clustering the universities, according to
the aspects of tradition and location (urban or not), which in their work, does not
significantly affect results.
A more comprehensive review of DEA in education can be found in Soares de Mello et al
(2006).
3. Fundamentals of Kohonen maps
The human brain organizes information in a logic way. The cortex has billions of neurons
with billions of synaptic connections among them involving nearly all brain. The brain is
orderly divided in subsections including: motor cortex, somatosensory cortex, visual cortex,
auditory cortex. The sensory inputs are orderly mapped to those cortex areas (Kohonen,
2001, Haykin, 1999, Bishop, 1995).
It seems that some of these cells are trained in a supervised way and others in a supervised
and self-organized way.
A paramount aspect of the self-organized networks is motivated by the organization of the
human brain in regions in such a way that the sensory inputs are represented by
Self Organizing Maps - Applications and Novel Algorithm Design
74
topologically organized maps. The Kohonen self-organizing map emulates that
unsupervised learning in a simple and elegant way and also taking into account the neuron
neighbourhood (Mitra et al., 2002).
The topographic map development principle according to Kohonen (2001) is as follows:
“The space location of an output neuron in a topographic map corresponds to a particular domain or
feature of data drawn from the input space”
From that principle came up two feature mapping models: the Willshaw (1969) and
Willshaw and Von der Malsburg (1976) model, having strong neurobiological motivations,
and the Kohonen (2001) model, not as close to neurobiology as the previous one but
enabling a simple computing treatment stressing the essential characteristics of the brain
maps. Moreover, the Kohonen model depicted in Figure 1 yields a low input dimension.
x
1
x
2
x
3
. . .
Wei
g
ht
In
p
uts X
Output two-dimensional
grid
x
m
Fig. 1. Kohonen Self-Organizing Map
Another way to characterize a SOM (self-organizing maps) is shown in Figure 2. In that
case, it is easily seen that each neuron receives identical input set information.
x
1
x
2
x
m
Fig. 2. Another way to represent Kohonen maps
Modelling with Self-Organising Maps and Data Envelopment Analysis:
A Case Study in Educational Evaluation
75
The SOMs are Artificial Neural Networks (ANN) special structures in a grid form that work
in a similar way of the human brain as far as the information organization is concerned, and
are based on competitive learning. The most used SOM is the topologically interconnected
two-dimensional, where the neurons are represented by rectangular, hexagonal and random
grid knots of neighbour neurons. Higher dimensional maps can also be modelled. In Fig ure
3 one can see the neuron position in a (8X8) hexagonal representation.
0 1 2 3 4 5 6 7
0
1
2
3
4
5
6
Fig. 3. Hexagonal neuron positions
In order to analyze the competitive process, let us suppose that the input space is m-
dimensional and that X represent a random input pattern (Haykin, 1999) such that one can
write
t
123 m
[x x x x ]=X (2)
Assuming the weight vector W of each neuron has the same dimension as that of the input
space, for a given neuron j of a total of l neurons, the weight vector can be written as
t
jj1j2j3jm
[w w w w ] ,
j
1 2 3 , l==W (3)
For each input vector, the scalar product is evaluated in order to find the X vector which is
closest to the weight vector W. By comparison, the maximum scalar product as defined in
(4) is chosen, representing the location in which the topological neighbourhood of excited
neurons should be centred,
t
j
max ( . ),
j
1 2 3 ,l=WX
(4)
Maximizing the scalar product in (4) is equivalent to minimize the Euclidian distance
between X and W. Figure 4 shows that the less the Euclidian distance the more
approximation between X and W.
Other metrics such as Minkowski, Manhatten, Hamming, Hausdorf, Tanimoto coefficients
and angle between vectors could also be used (Kohonen, 2001, Haykin, 1999, Michie et al.,
1994).
Self Organizing Maps - Applications and Novel Algorithm Design
76
X
W
X
-
Fig. 4. Minimization of Euclidian Distance
The closest neuron to the input vector X, given by (5), is called the winner neuron whose
index is V(X), where
j
V(X) min X W ,
j
1 2 3 ,l=− = (5)
By means of a competitive process, a continuous input space pattern can be mapped into a
discrete output space of neurons.
In the cooperative process, the winner neuron locates the centre of a topological
neighbourhood of cooperating neurons, which is biologically defined by the existence of
interactive lateral connections in a cluster of biological neural cells. So the active winner, the
winner one, tends to strongly stimulate its closest neighbour neurons and weakly the
farthest ones. It is apparent that the topological neighbourhood concerned to the winner
neuron decreases with increasing lateral distance.
It is essential to find a topological neighbourhood function sN
j,V(X)
, that be independent from
the winner neuron location written in (5). That neighbourhood function should represent
the topological neighbourhood centred in the winner neuron, indexed by V, having as
closest lateral neighbours, a group of excited neurons and cooperative ones from which a
representative can be chosen which is denominated j neuron. The lateral distance, D
j,V
,
between the winner neuron indexed, by V, and the excited neuron, indexed by j can be
written as in (6) (Haykin, 1999).
2
j,V
j,V(X)
2
D
Nexp
2σ
⎛⎞
=−
⎜⎟
⎜⎟
⎝⎠
(6)
where
σ is the neighbourhood width.
The topological neighbourhood function A N
j,V(X)
shown in Fig. 5 should have the following
properties (Mitra et al., 2002, Haykin, 1999):
• Be symmetric relative to the point of maximum, characterized by the winner neuron,
indexed by V(
X), for which D
j,V
= 0.
• When D
j,V
goes to ± ∞, the magnitude of the topological neighbourhood function
monotonically decreases, tending towards zero.
The more dependent the lateral distance D
j,V
be, the greater will be the cooperation among
the neighbourhood neurons. So, for a two-dimensional output grid, the lateral distance can
be defined as in (7), for which the discrete vector
℘
j
represents the position of the excited
neuron, and
℘
V
the position of the neuron that won the competition.
Modelling with Self-Organising Maps and Data Envelopment Analysis:
A Case Study in Educational Evaluation
77
=℘−℘
2
j,V j V
D (7)
Another point to be considered is that the topological neighbourhood should decrease with
discrete time n. In order to accomplish that, the width
σ, of the topological neighbourhood
N
j,V(X)
should decrease in time. That could be achieved if the width of the topological
neighbourhood decreases in time. The width could be written as in (8) where
σ
0
represents
the initial value of the neighbourhood width and
τ
1
a time constant. Usually σ
0
is adjusted to
have the same value as the grid ratio, i.e.
τ
1
=1000/log σ
0
.
-10 -5 0 5 10
0
0.1
0.2
0.3
0.4
0.5
0.6
0.7
0.8
0.9
1
GAUSSIAN NEIGHBORHOOD FUNCTION
Lateral Distance
Ampli tude
2 sigma2 sigma2 sigma2 sigma
0,61
Fig. 5. Gaussian neighbourhood function
0
1
n
σ(n) σ exp , n 0, 1, 2, 3,
τ
⎛⎞
=−=
⎜⎟
⎝⎠
(8)
The expression of the topological neighbourhood in time can be written as
2
j,V
j,V(X)
2
D
N (n) exp , n 0, 1, 2, 3,
2σ (n)
⎛⎞
=− =
⎜⎟
⎜⎟
⎝⎠
(9)
The adaptive process is the last phase of the self- organizing map procedure and during this
phase the adjustment of the connection weights of the neurons are carried out. In order the
network succeed in the self-organization task, it is necessary the weights
W
j
of the excited j
neuron be updated relatively to the input vector
X.
Due to the connection changes that happen in one direction, the Hebb rule can not be used
in the same way as in the supervised learning that would lead the weights to saturation. For
Self Organizing Maps - Applications and Novel Algorithm Design
78
that, a slight change is done in the Hebb rule, including a new term g(y
j
) W
j
called forgetting
term, in which
W
j
is the vector weight of the excited j neuron and g(y
j
) is a positive scalar
function of the output y
j
of neuron j. The only requirement imposed on the function g(y
j
) is
that the constant term in the Taylor series expansion of g(y
j
) be zero, so that g(y
j
) = 0 for y
j
=
0. Given such a function, the change to the weight vector of the excited neuron
j in the grid
can be written as in (9) where
η is the learning rate parameter.
The first term in equation (10) is the Hebbian term and the second the forgetting (Kohonen,
2001, Haykin, 1999, Bishop, 1995).
jj jj
ΔW η
y
X
g
(
y
)W
=
− (10)
In order to satisfy the requirement, a linear function for g(y
j
) is chosen as
jj
g(y ) η
y
=
(11)
Using y
j
= N
j,V(X)
, equation (10) can be written as (12) as
jj
,V(X)
j
ΔW ηN(XW)
=
− (12)
Using discrete-time notation a weight updating equation can be written which applies to all
neurons that are within the topographic neighbourhood equation of the winner neuron
(Kohonen, 2001, Haykin, 1999),
jj j,V(X)j
W(n 1) W(n) η(n)N (n)(X W (n))
+
=+ − (13)
In (13) the learning rate parameter changes each iteration, with an initial value around 0.1
and decreasing with increasing discrete-time n up to values above 0.01 (Mitra et al., 2002).
To that end, equation (14) is written in which
η decays exponentially and τ
2
is another time-
constant of the SOM algorithm. For the fulfilment of the requirements one could choose for
instance,
η
0
= 0.1 and τ
2
= 1000.
0
2
n
(n) exp , n 0, 1, 2, 3,
τ
⎛⎞
η=η − =
⎜⎟
⎝⎠
(14)
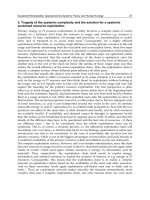
Self-organizing maps have been widely used in many fields. For instance, regarding the
subject of the present chapter, Kohonen networks have been used in education for peer
identification process in business schools (re)accreditation process (Kiang et al., 2009) and to
determine students' specific preferences for school websites (Cooper & Burns, 2007).
In the Brazilian Rio de Janeiro state self-organized maps were used to cluster cities
according to characteristics of electrical consumption (Biondi Neto et al., 2007).
Then the self-organizing maps will be used to cluster CEDERJ distance education centres, in
order to perform a DEA evaluation.
4. Distance learning in Rio de Janeiro: The CEDERJ
One of CEDERJ’s main target is to contribute with the geographic expansion of
undergraduate public education. This is also one of the targets of public universities in
general. A second main target is to grant access to undergraduate education for those who
Modelling with Self-Organising Maps and Data Envelopment Analysis:
A Case Study in Educational Evaluation
79
are not able to study in regular hours, usually because of work. Finally, developing the
state’s high school teachers and offering vacancies in graduate courses are also targets to be
achieved. We can notice that many of these are similar to UAB’s aims, which is a
consequence of the fact that CEDERJ is part of the UAB system.
In CEDERJ, students have direct contact with tutors, who are of great importance (Soares de
Mello, 2003) for they are responsible for helping students with their subjects as well as their
motivation. Its pedagogical program is based on advances in the area of information and
communication technologies, but also offers practical classes in laboratories. Students
receive printed and digital material, which includes videos, animations, interactivity with
tutors, teachers, other students and guests. This whole environment helps creating
knowledge.
Its expansion in terms of number of local centres and types of courses brings up the need to
evaluate CEDERJ globally, since the system consumes public resources, and also locally, in
order to reduce eventual differences.
Gomes Junior
et al (2008) evaluated CEDERJ courses using the so called elementary multi-
criteria evaluation, Condorcet, Copeland and Borda (Roy & Bouyssou, 1993). The authors
point out that there is an apparent relation between regions wealth and its position in the
final ranking; and a reverse relation between the number of regular universities and the
local centre’s position. In the present study, these variables should be considered when
clustering the local centres.
Menezes (2007) made a scientific investigation on distance education, focusing on CEDERJ,
analysing how new information and communication technologies impact on time and space
organization.
There are many other studies on CEDERJ, yet they are mostly qualitative. Qualitative
literature allows different interpretations, and it might become clearer with measurable
facts. Our goal is with this quantitative approach to complement the existent qualitative
literature, with no intention to replace it.
5. Evaluation of CEDERJ with DEA and Kohonen maps
The DMUs being evaluated in the present research are the local centres that offer
Mathematics undergraduate course, therefore each of the following variables are related to
the Math course in each local centre.
AI – Number of students enrolled in the course in a certain semester (
input)
NT – Number of tutors in the first semester of 2009 (
input) proxy for the resources used in
the centre.
AF – Number of students that graduated in the first semester of 2009 (
output)
There are other professionals, besides tutors, involved in the CEDERJ system, such as those
responsible for preparing the material. However, the Math material is the same in every
local centre, so these professionals should be attributed to each course, not to each local
centre.
Seeking the semester that should be used for the first input, a process of variable selection is
carried out because, according to Thanassoulis (1996), the group of variables used in the
analysis can have great impact on its result. Therefore, in this evaluation process, variables
are selected in a way that inputs better explain outputs and that less DMUs have maximum
efficiency.
Self Organizing Maps - Applications and Novel Algorithm Design
80
This process has been performed on the work of Andrade et al (2009) and it aimed to obtain
a set of values for the AI variable, considering 1
st
and 2
nd
semesters of 2005 (1/2005 and
2/2005, respectively) and 1
st
semester of 2006 (1/2006). Since the graduation semester is the
1
st
one of 2009 (1/2009) and that the Math course has eight semesters of duration, it would
be normal to use the number of enrolled students in 2/2005. Nevertheless, students may
anticipate or postpone their graduation and therefore another semester might be chosen as
the one that better explains the outputs. If 1/2005 is chosen, for example, it means that the
majority of students postpone their graduation.
Although 24 local centres offer the Math course, only 13 have had graduates in 1/2009.
Therefore only these 13 centres can be considered in the model, otherwise, results might be
distorted because of the zero output. Besides the 24 centres, other four centres offer math
tutorials – not the whole course, only tutorials. These, however, are not considered in this
work.
According to the process of variable selection demonstrated in Andrade
et al (2009), the
semester chosen for the number of students enrolled in the course in a certain semester (AI)
is 2/2005.
Another point to be considered is that local centres are subjected to different social,
environmental and structural realities (Gomes Junior et al., 2008). This is important because
in order to use DEA and compare DMUs, we should guarantee that they are homogeneous.
The CEDERJ centres are located in regions with socio-economic characteristics very different
among them. So, the DMUs are clearly non homogenous. If we try to use DEA with the
complete set of centres we will have a DEA model with non homogenous DMU. This is a
well-know pitfall in DEA (Dyson et al., 2001). So, we must be divided into clusters with
homogeneous characteristics before using DEA. Afterwards, a homogenisation process will
be carried out to perform an overall evaluation.
5.1 Clustering the DMUs
For the clustering of the CEDERJ centres we used the Kohonen self-organizing maps. The
variables used were:
-
The number of vacancies as a proxy to the size of the centre.
-
The ratio of the candidates per vacancies for the Maths undergraduate course as a
proxy to the cognitive level of the students enrolled in the course.
-
The city’s Human Development Index (HDI) as a proxy for the socio economical
characteristics of the city.
The number of semesters since the opening of the centre as a proxy to the maturity of the
centre.
Different configurations for the Kohonen Maps were tested. We used grids with the (6x6),
(4x4), (3x4), (3x3), (3x2) representations. Of all the clusters obtained we selected the one that
did not let a centre isolated, which allows a better condition to perform an efficiency
analysis using Data Envelopment Analysis. This was achieved using a grid with the (3x3)
and the (3x2) representations, with the same clustering. The final clustering is shown in
Table 1.
We obtained four clusters, with the mentioned representation, that contain centres with
similar characteristics regarding size, students level, centre’s maturity and socio-economical
characteristics as explain previously.
Modelling with Self-Organising Maps and Data Envelopment Analysis:
A Case Study in Educational Evaluation
81
Cluster Centre
Volta Redonda
Paracambi
1st Cluster
Petrópolis
Angra dos Reis
São Pedro da Aldeia
Saquarema
Três Rios
2nd Cluster
Campo Grande
Macaé
Piraí
3rd Cluster
São Fidelis
Cantagalo
4th Cluster
Itaperuna
Table 1. Centres Clustering
5.2 Evaluation in each cluster
Once the clustering process is finished we performed the evaluation inside each cluster. We
use the CCR output oriented model shown in section 2. The data, for the three variables
considered, and the results for each one of the four clusters can be found in Tables 2, 3, 4
and 5.
Inputs Output
Centre
AI NT AF
Efficiency
Index (%)
Volta Redonda 99 10 10 80.80
Paracambi 72 7 9 100.00
Petrópolis 79 8 1 10.00
Table 2. Efficiency Index for the Centres in cluster 1
Self Organizing Maps - Applications and Novel Algorithm Design
82
Inputs Output
Centre
AI NT AF
Efficiency
Index (%)
Angra dos Reis 60 6 8 100.00
São Pedro da Aldeia 20 5 1 37.50
Saquarema 62 6 4 50.00
Três Rios 60 8 3 37.50
Campo Grande 62 6 1 12.50
Table 3. Efficiency Index for the Centres in cluster 2
Inputs Output
Centre
AI NT AF
Efficiency
Index (%)
Macaé 29 6 3 50.00
Piraí 23 6 6 100.00
São Fidelis 61 6 2 33.33
Table 4. Efficiency Index for the Centres in cluster 3
Inputs Output
Center
AI NT AF
Efficiency
Index (%)
Cantagalo 40 7 2 50.00
Itaperuna 36 7 4 100.00
Table 5. Efficiency Index for the Centers in cluster 4
In these tables we can see that we obtained exactly one efficient centre in each cluster. This
shows that despite having few DMUs in each cluster, DEA had success in obtaining a
ranking in each cluster.
We can also observe that there are notorious differences among the efficiency indexes in the
same cluster. A large proportion of centres are less than 50% efficient. This is not usual in
DEA.
Modelling with Self-Organising Maps and Data Envelopment Analysis:
A Case Study in Educational Evaluation
83
5.3 Clusters evaluation
In performing the clustering and DEA evaluation in each cluster we take into account the
differences in the environmental conditions of the centres. Now we are going to perform a
DEA evaluation with the efficient centres of each cluster. Such centres are representative of
the best managerial practices for each environmental condition. As was done previously, we
used the CCR output oriented DEA model. The results of the evaluation of the four centres
can be found in Table 6.
As observed in this Table, two centres were efficient, Angra dos Reis and Piraí. The least
efficient of the four was Itaperuna.
Centre
Efficiency
index (%)
Paracambi 96.43
Angra dos Reis 100.00
Piraí 100.00
Itaperuna 53.37
Table 6. Evaluation of the efficient centres
We can say that the efficient centres, thus, efficient clusters, are so because of them being
regions with accelerated development based of tourism, oil and industry in general. The
students in these clusters have no other options for undergraduate courses other than the
long distance centres of CEDERJ.
In the city of Itaperuna is from cluster 4, which contains an underdeveloped region of the
northwest Rio de Janeiro state. This region has an improving number of high schools but
still of poor quality.
The first cluster, represented by Paracambi, is composed by very developed cities. These
cities are close to
in situ centres of high quality undergraduate courses. This condition
nullifies the existence of potential good students, because the mostly preferred the
in situ
courses. This fact justifies its efficiency index in the group form by the efficient centres in
each cluster.
The efficient centres are located in developed regions with good students but not with
significant number of
in situ courses.
Therefore, we may suppose that the differences among those centres are due only to the
environmental aspects, as the centres have the best managerial practices in their clusters. So
it is possible to use the efficiency in Table 6 to evaluate the environmental conditions of the
cluster represented by each centre. The efficiencies will be used as a handicap factor for each
cluster.
5.4 Overall evaluation
Taking into account the differences between clusters, we perform an homogenisation of the
centres, to be able to compare all of them in one single cluster. This is done by multiplying
the inputs (number of students enrolled in the course in the 2
nd
semester of 2005 and
number of tutors) of each centre times the efficiency obtained by their representative in
Self Organizing Maps - Applications and Novel Algorithm Design
84
Table 6. We consider that the efficiency index obtained by each representative centre in
Table 6 acts has a handicap factor. This methodology is inspired by the sports handicapping
system for competitions with disabled athletes (Percy & Scarf, 2008, Percy & Warner, 2009).
The data used and the efficiency obtained using the CCR output oriented DEA model are
shown in Table 7.
In this Table we can observed that, as expected, the efficiency centres in the original clusters
are still efficient. We may now compare centres of different clusters. One of the lowest
overall efficient is the centre of Campo Grande. This centre is located in a poor region of a
reach city, Rio de Janeiro. This may indicate a problem in clustering this centre.
Furthermore, there are a lot of
in situ undergraduate courses surrounding Campo Grande.
As explained before those factors are not favourable to a centre. The Petrópolis centre, with
the lowest efficiency, is in a rich city and very close, less than one hour driving, of the major
campus of the main Brazilian university. Due to the fact that distance education is not yet
well know and the nearness of a prestigious university, many students prefer to travel to the
in situ courses. The city of São Pedro da Aldeia is in a summer vacations region, many
people living in Rio de Janeiro have a summer house in this city. Often, it occurs that some
students obtain a vacancy in the centre of São Pedro da Aldeia, profiting from the fact of of
having a house in the city and later they enrol in a
in situ course in Rio de Janeiro,
abandoning the long distance course in Sao Pedro de Aldeia. This explains the lower
efficiency.
Input Output
Centre
AI NT AF
Efficiency
Index (%)
Volta Redonda 95,4643 9,64286 10 78.09
Paracambi 69,4286 6,75 9 100.00
Petrópolis 76,1786 7,71429 1 9.77
Angra dos Reis 60 6 8 100.00
São Pedro da Aldeia 20 5 1 9.82
Saquarema 62 6 4 50.00
Três Rios 60 8 3 31.30
Campo Grande 62 6 1 12.50
Macaé 29 6 3 47.44
Piraí 23 6 6 100.00
São Fidelis 61 6 2 25.00
Cantagalo 21,36 3,738 2 48.60
Itaperuna 19,224 3,738 4 100.00
Table 7. Homogenized data and overall efficiency index
Modelling with Self-Organising Maps and Data Envelopment Analysis:
A Case Study in Educational Evaluation
85
We also perform an analysis of benchmarks for the inefficient centres. The benchmarks of an
inefficient centre give the managerial guidelines to achieve the efficient levels in inputs or
outputs. These are depicted in Table 8.
In this Table we may observed that the three cities originally in cluster 1, Volta Redonda,
Paracambi and Petropolis, have benchmarks outside their own cluster. In the original cluster
3, Sao Fidelis is the only centre that has not at least one benchmark inside its own cluster. All
the efficient centres except Paracambi, are their own benchmarks. This fact vindicates that
Paracambi is a weakly efficient centre. This means that in an overall evaluation that the
number of students that graduated in the first semester of 2009 can be improved in
comparison to other efficient centres.
DMU Benchmarks
Volta Redonda Angra dos Reis; Piraí
Paracambi Angra dos Reis
Petrópolis Angra dos Reis; Piraí
Angra dos Reis Angra dos Reis
São Pedro da Aldeia Angra dos Reis; Piraí
Saquarema Angra dos Reis
Três Rios Angra dos Reis; Piraí
Campo Grande Angra dos Reis
Macaé Angra dos Reis; Piraí
Piraí Piraí
São Fidelis Angra dos Reis
Cantagalo Angra dos Reis; Piraí
Itaperuna Itaperuna
Table 8. Benchmarks in the overall efficiency evaluation
6. Final comments
The main objective of this chapter was to perform the evaluation of the centres of distance
undergraduate Math courses of the CEDERJ. This evaluation was carried out using Data
Envelopment Analysis. A total of thirteen centres were evaluated, these having
environmental differences among them. They were divided in four cluster using Kohonen
self-organized maps according to the size of the centres, level of the centres, socio
economical characteristics and maturity of the centres proxies. In each cluster, we performed
a DEA analysis obtaining exactly one efficient centre for each cluster. Comparing the
clusters we conclude that centres in very poor or very rich regions will probably have low
efficiency.
Self Organizing Maps - Applications and Novel Algorithm Design
86
We also performed an homogenisation of the centres in order to obtain and overall
evaluation and a benchmark analysis. We observed that the majority of the centres have
benchmarks outside their own cluster. The fact that a large number of centres have very
little efficiency may indicate that we must refine the clustering process. A variable that
seems to be important and may be used in future works is the distance of the centre to major
campi of in situ courses universities. The distance between two distance centres may also be
considered for the clustering process in future works.
It may also be useful to perform a time window analysis of the centres.
It worth noting that São Fidelis and Campo Grande are each one in a single cluster for
almost all the Kohonen maps configurations. It only in the configuration used they are
clustered with other centres. This may indicated that São Fidelis and Campo Grande have
been under evaluated in this study. In the future we may study a new process to perform a
fair evaluation to those two centres.
7. Acknowledgments
We would like to thanks FAPERj and CNPq for their financial support.
8. References
Abbott, M. & Doucouliagos, C. (2003). The efficiency of Australian universities: A data
envelopment analysis.
Economics of Education Review, Vol. 22, No. 1, pp. 89-97, 0272-
7757.
Abramo, G.; D'Angelo, C. A. & Pugini, F. (2008). The measurement of italian universities'
research productivity by a non parametric-bibliometric methodology.
Scientometrics, Vol. 76, No. 2, pp. 225-244, 0138-9130.
Andrade, F. V. S.; Brandão, L. C. & Soares de Mello, J. C. C. B. (2009). Avaliação de um curso
de matemática à distância com modelos DEA e seleção de variáveis.
Relatórios de
Pesquisa em Engenharia de Produção da UFF, Vol. 9, pp. 10, 1678-2399.
Banker, R. D.; Charnes, A. & Cooper, W. W. (1984). Some models for estimating technical
scale inefficiencies in data envelopment analysis.
Management Science, Vol. 30, No.
9
, pp. 1078-1092, 0025-1909
Biondi Neto, L.; Coelho, P. H. G.; Soares De Mello, J. C. C. B. & Angulo Meza, L. (2007). Self-
organizing maps for classification of the rio de janeiro state cities based on electrical
energy consumption.
ICEIS 2007 - 9th International Conference on Enterprise
Information Systems, Proceedings,
pp. 447-450, june, 2007, Funchal.
Biondi Neto, L.; Lins, M. P. E.; Gomes, E. G.; Soares de Mello, J. C. C. B. & Oliveira, F. S.
(2004). Neural data envelopment analysis: a simulation.
International Journal of
Industrial Engineering, Vol. 11, pp. 14-24, 1072-4761.
Bishop, C. M. (1995).
Neural networks for pattern recognition, Oxford University Press, 0-19-
853864-2, New York.
Çelebi, D. & Bayraktar, D. (2008). An integrated neural network and data envelopment
analysis for supplier evaluation under incomplete information.
Expert Systems with
Applications, Vol. 35, No. 4, pp. 1698-1710, 0957-4174.
Charnes, A.; Cooper, W. W. & Rhodes, E. (1978). Measuring the efficiency of decision-
making units.
European Journal of Operational Research, Vol. 2, pp. 429-444, 0377-2217.
Modelling with Self-Organising Maps and Data Envelopment Analysis:
A Case Study in Educational Evaluation
87
Churilov, L. & Flitman, A. (2006). Towards fair ranking of olympics achievements: The case
of Sydney 2000.
Computers and Operations Research, Vol. 33, No. 7, pp. 2057-2082,
0305-0548.
Cooper, C. & Burns, A. (2007). Kohonen self-organizing feature maps as a means to
benchmark college and university websites.
Journal of Science Education and
Technology,
Vol. 16, No. 3, pp. 203-211, 1059-0145 (print version), 1573-1839
(electronic version).
Cooper, W. W.; Seiford, L. & Tone, K. (2000). Data envelopment analysis: A comprehensive
text with models, applications, references and DEA-solver software, Kluwer,
0387452818, Boston.
Dyson, R. G.; Allen, R.; Camanho, A. S.; Podinovski, V. V.; Sarrico, C. S. & Shale, E. A.
(2001). Pitfalls and protocols in DEA.
European Journal of Operational Research, Vol.
132
, No. 2, pp. 245-259, 0377-2217.
Emrouznejad, A. & Shale, E. (2009). A combined neural network and DEA for measuring
efficiency of large scale datasets.
Computers and Industrial Engineering, Vol. 56, No. 1,
pp. 249-254, 0360-8352.
Gomes Junior, S. F.; Soares de Mello, J. C. C. B. & Soares de Mello, M. H. C. (2008).
Utilização do método de Copeland para avaliação dos pólos regionais do CEDERJ.
Rio's international journal on sciences of industrial and systems engineering and
management,
Vol. 2, No. 4, pp. 87-98, 1982-6443.
Haykin, S. (1999).
Neural networks: a comprehensive foundation, Prentice Hall, 0132733501, New
Jersey.
Kiang, M. Y.; Fisher, D. M.; Chen, J. C. V.; Fisher, S. A. & Chi, R. T. (2009). The application of
SOM as a decision support tool to identify AACSB peer schools.
Decision Support
Systems,
Vol. 47, No. 1, pp. 51-59, 0167-9236.
Kohonen, T. (2001).
Self-organizing maps, Springer-Verlag, 3540679219, Berlin.
Menezes, E. P. (2007). A espacialidade e a temporalidade da educação a distância: O caso do
CEDERJ/CECIERJ.
13º Congresso Internacional de Educação a Distância, september,
2007, Curitiba.
Michie, D.; Spiegelhalter, D. J. & Taylor, C. C. (1994).
Machine learning, neural and statistical
classification, Ellis Horwood, 013106360X, Chichester.
Mitra, P.; Murthy, C. A. & Pal, S. K. (2002). Unsupervised feature selection using feature
similarity.
IEEE Transactions on Pattern Analysis and Machine Intelligence, Vol. 24, No.
3
, pp. 301-312
Percy, D. F. & Scarf, P. A. (2008). On the development of decision rules for bar quiz
handicapping.
Journal of the Operational Research Society, Vol. 59, No. 10, pp. 1406-
1414, 0160-5682.
Percy, D. F. & Warner, D. B. (2009). Evaluating relative performances in disabled sports
competitions.
IMA Journal Management Mathematics, Vol. 20, No. 2, pp. 185-199,
1471-6798 (on line), 1471-678X (print).
Roy, B. & Bouyssou, D. (1993).
Aide multicritèrie à la décision: méthods et cas, Economica, Paris.
Samoilenko, S. & Osei-Bryson, K. M. (2010). Determining sources of relative inefficiency in
heterogeneous samples: Methodology using Cluster Analysis, DEA and Neural
Networks.
European Journal of Operational Research, Vol. 206, No. 2, pp. 479-487,
0377-2217.
Self Organizing Maps - Applications and Novel Algorithm Design
88
Seiford, L. M. (1996). Data envelopment analysis: The evolution of the state of the art (1978-
1995).
Journal of Productivity Analysis, Vol. 7, No. 2-3, pp. 99-137
Sharma, M. J. & Yu, S. J. (2009). Performance based stratification and clustering for
benchmarking of container terminals.
Expert Systems with Applications, Vol. 36, No.
3 PART 1
, pp. 5016-5022, 0957-4174.
Soares de Mello, J. C. C. B.; Gomes, E. G.; Angulo-Meza, L.; Soares de Mello, M. H. C. &
Soares de Mello, A. J. R. (2006). Engineering Post-Graduate Programmes: A Quality
and Productivity Analysis.
Studies in Educational Evaluation, Vol. 32, pp. 136-152,
0191-491X.
Soares de Mello, M. H. C. (2003). Uma experiência presencial em EAD: o caso CEDERJ. .
XXVI CNMAC, september, 2003, São José do Rio Preto.
Thanassoulis, E. (1996). Assessing the efficiency of schools with pupils of different ability
using Data Envelopment Analysis.
Journal of the Operational Research Society, Vol. 47,
No. 1
, pp. 84-97, 0160-5682.
Willshaw, D. J.; Buneman, O. P. & Longuet-Higgins, H. C. (1969). Non-holographic
associative memory.
Nature, Vol. 222, pp. 960-962, 0028-0836.
Willshaw, D. J. & Von der Malsburg, C. (1976). How patterned neural connections can be set
up by self-organization.
Proceedings of the Royal Society of London Series B, Vol. 194,
pp. 431-445, 1471-2954.
0
Self-Organizing Maps Infusion with Data
Envelopment Analysis
Mithun J. Sharma
1
and Yu Song Jin
2
1
Dibrugarh University
2
Korea Maritime University
1
India
2
Republic of Korea
1. Introduction
This chapter presents work on the use of an artificial intelligence technique to cluster
stratified samples of container terminals derived from Data Envelopment Analysis (DEA).
This technique is Kohonen’s self-organizing map (SOM; (Kohonen, 1995)). Data envelopment
analysis measures the relative efficiency of comparable entities called Decision Making Units
(DMUs) essentially performing the same task using similar multiple inputs to produce similar
multiple outputs ((Charnes et al., 1978)). The purpose of DEA is to empirically estimate
the so-called efficient frontier based on the set of available DMUs. DEA provides the user
with information about the efficient and inefficient units, as well as the efficiency scores and
reference sets for inefficient units. The results of the DEA analysis, especially the efficiency
scores, are used in practical applications as performance indicators.
There are many problems associated with applying the DEA in some applications. One
problem is that the improvement projection for inefficient units in DEA analysis is concrete
relative to its efficiency score. This means, in DEA, relative performance of any DMU can be
contrasted only to the efficient DMUs that register unit efficiency score. There is no influence
on the performance of efficient DMUs by presence or absence of inefficient DMUs. Therefore,
the classical DEA does not actually provide a direct means to rank DMUs based on their
relative degrees of efficiency or inefficiency ((Sharma & Yu, 2010)).
The second problem is that the DEA models assume that all DMUs are homogenous and
identical in their operations ((Seiford, 1994)). Since various applications have heterogeneous
DMUs and there is a high request to evaluate these applications under the DEA due to its
acceptance as a performance measurement in different kind of business, we have to modify
the DEA to work with these applications. If the heterogeneous DMUs are assessed by
DEA without any modifications, the DEA yields a biased performance scores and inaccurate
analyses. For example, the resources (land, equipment, and labor) of container terminals
varies across the world, which requires to be evaluated in term of its common input
characterstics. An essential requirement in analyzing these container terminals is to build
a fair referencing system for each container terminal to manage and provide a solid plan that
improves all inefficient terminals and supports all efficient terminals. This system can not
be assessed under the standard DEA due to the non-homogenous nature of these container
terminals in terms of their operations, different standards of equipments, infrastructure, and
variety in quay length and area size. These factors will yield unfair benchmarking evaluation
5
2 Self Organizing Maps, New Achievements
if we apply the standard DEA. In order to conform to the homogeneity assumption, we use
learning network clustering (SOM) procedure to minimize total dissimilarity. Nor is the
SOM approach the only neural network approach which could be used, however, we find
the Kohonen approach to be highly effective method.
2. Algorithm
The DEA tools which are necessary to appreciate the method are described in detail in
((Cooper et al., 2004);(Sharma & Yu, 2010)). There it is demonstrated how one can use
these tools to measure efficiency and stratify samples for relative attractiveness to identify
competitors with level wise target improvement. Here in this chapter, a new algorithm is
provided to perform the DEA computation in non-homogenous DMUs by introducing the
SOM-based DEA technique. In the proposed method, some of the non-homogenous DMUs
are classified into seperate groups for appropriate benchmarking. Clustering stratified DMUs
obtained from DEA using SOM is divided into two steps. The first step is to train the SOM
against the DMUs as a training data set. The second one is to map input DMUs to output
DMU clusters. The algorithm in the subsequent subsection achieves this objective.
2.1 SOM-based DEA
Assume there are n DMUs, each with m inputs and s outputs. We define the set of all DMUs
as J
1
, J
1
= DMU
j
, j = 1, , n and the set of efficient DMUs in J
1
as E
1
. Then the sequences of J
1
and E
1
are defined interactively as J
l+1
= J
l
− E
l
where E
l
= DMU
p
∈ J
l
|φ
l
p
= l, and φ
l
p
is the
optimal value to the following linear programming problem:
max
λ
i
,φ
φ
l
p
= φ (1)
s.t.
∑
i∈F(J
l
)
λ
i
x
ji
− x
jp
≤ 0∀j (2)
∑
i∈F(J
l
)
λ
i
y
ki
− φy
kp
≥ 0∀k (3)
λ
i
≥ 0,i ∈ F(J
l
) (4)
where k
= 1tos, j = 1tom, i = 1ton, y
ki
= amount of output k produced by DMU
i
∗
; x
jp
= input vector of DMU
p
, x
ji
= amount of input j utilized by DMU
i
; y
kp
= output vector of
DMU
p
. i ∈ F(J
l
) in other words DMU
i
∈ J
l
, i.e. F(.) represents the correspondence from a
DMU set to the corresponding subscript index set.
The following algorithm accomplishes subsequent stratum.
Step 1: Set l
= 1. Evaluate the entire set of DMUs, J
l
, to obtain the set, E
1
, of first-level frontier
DMUs (which is equivalent to classical CCR DEA model), i.e. when l
= 1, the procedure runs
a complete envelopment model on all n DMUs and E
1
consists of all of the DMUs on the
resulting overall best-practice efficient frontier.
Step 2: Exclude the frontier DMUs from future DEA runs and set J
l+1
= J
l
− E
l
Step 3: If J
l+1
= 3E
l+l
, then stop. Otherwise, evaluate the remaining subset of inefficient
DMUs, J
l+1
, to obtain the new best-practice frontier E
l+1
.
Stopping Rule: The algorithm stops when J
l+1
= 3E
l+l
.
The training data is a set of all DMUs, without output variables but includes the class each
DMU belongs to, J
=
{
DMU
1
, DUM
2
, , DMU
n
}
of already classified samples. Each sample
90
Self Organizing Maps - Applications and Novel Algorithm Design
Self-Organizing Maps Infusion with Data Envelopment Analysis 3
DMUj =
{
x
1
, x
2
, , x
m
}
is a vector where x
1
, x
2
, , x
m
represent input variables of the sample.
The training data is augmented with a vector C
=
{
E
1
, E
2
, , E
l+1
}
where E
1
, E
2
, , E
l+1
represent the class each sample belongs to. The SOM uses a set of neurons, often arranged
in a 2D rectangular or hexagonal grid, to form a discrete topological mapping of an input
space, X
∈
n
. At the start of the learning, all the weights
{
w
r1
,w
r2
, , w
rm
}
are initialised to
small random numbers. w
ri
is the weight vector associated to neuron i and is a vector of the
same dimension, n, of the input. m is the total number of neurons. ri is the location vector of
neuron i on the grid. Then the algorithm repeats the following steps.
– At each time t, present an input, x
(t), select the winner,
v
(t)=argmin
k∈Ω
X(t) − W
k
(t)
(5)
– Updating the weight of winners and its neighbours,
ΔW
k
(t)=α(tη(v, k,t))
[
X(t) − W
v
(t)
]
(6)
– Repeat until the map converges,
where η
(v, k,t) is the neighborhood function and Ω is the set of neuron indexes.
3. Application
The proposed SOM-based DEA algorithm was applied to container port industry. Data
was collected for 70 container terminals from relevant data sources like Containerization
International Year Book, The Drewry Annual Container Market Review and Forecast and specific
field studies of container port. The input and output data were selected from a comprehensive
set of literature review ((Hayuth & Roll, 1993);(Park & De, 1993); (Tongzon, 2001);(Barros &
Athanassiou, 2004)). The statistics related to the sample are shown in table 1.
Inputs and outputs used in DEA must be measurable, but they need not be measured in
the same units. The number of variables used in the DEA formula has direct effect on any
particular piece of data. (Szezepura et al., 1992) argue that the number of variables should be
limited to the maximum extent. In general, the number of test units should be considerably
greater than the total number of variables.
A number of container terminals constitute a container port. For one to one comparison (Song
& Cullinane, 2003) we have investigated container terminals selected from underdeveloped
to transition economies to developed economies that include large, medium and small
container terminals. The following features/measures are chosen as inputs: (1) quay length
(meters); (2) terminal area (sq. meters); (3) quay cranes (number); (4) transfer cranes
(number); (5) reach stackers (number) and (6) straddle carriers (number). On the other hand,
container throughput (TEU)
1
is the most appropriate and analytically tractable indicator of
the effectiveness of the production of a port. Almost all previous studies treat it as an output
variable, because it closely relates to the need for cargo-related facilities and services and is the
primary basis upon which container ports are compared, especially in assessing their relative
size, or activity levels. Therefore, throughput is chosen as an output variable.
1
TEU is the abbreviation for Twenty feet Equivalent Unit, referring to the most standard size for a
container of 20 ft in length.
91
Self-Organizing Maps Infusion with Data Envelopment Analysis
4 Self Organizing Maps, New Achievements
Throughput QC TC SC RSC QL TA
Mean 882143.414 9 14.185 12.985 80.51 1105.042 517876.1
Std. error 98748.9083 0.666 2.084 2.951 0.852 82.505 48321.5
Median 573,049 8 9 0 7 927.5 350,000
Mode N/A 6 0 0 2 600 300,000
Std. deviation 826192.642 5.579 17.442 24.692 7.172 690.286 404286.9
Sample variance 6.082*1011 31.130 304.24 609.72 51.441 476495.52 1.63*10
Kurtosis 4.269 1.304 5.114 2.222 2.426 4.064 0.931
Skewness 1.960 1.249 2.004 1.846 1.314 1.800 1.265
Range 3,901,632 24 90 94 36 3646 1,648,000
Minimum 98,368 2 0 0 0 300 20,000
Maximum 4,000,000 26 90 94 36 3946 1,668,000
Sum 61,750,039 630 993 909 596 77,353 36,251,334
Count 70 70 70 70 70 70 70
Confidence level
(95%)
196998.679 1.330 4.159 5.887 1.710 164.59 96398.82
QC:Quay Cranes;TC:Transfer Cranes; SC:Straddle Carrier;RSC:Reach Stacker;QL:Quay
Length;TA:Terminal Area
Table 1. Descriptive statistics of container terminal data
The input variable quay crane is a vital piece of equipment in the production process where it
transfers the cargo from a container shipping line across a quay to the shore. This production
process fundamentally decides the efficiency of a port, and is vital to its competitive position.
As a storage area, the container terminalarea acts as a buffer between sea and inland
transportation or transshipment. The size of a ship is very frequently thousands of times
the size of the land vehicles that carry the cargo to and from the port. As such, the use of such
storage space is normally inevitable. The main pieces of equipment used within a terminal
area are the transfer cranes, reach stackers and straddle carriers. (Dowd & Leschine, 1978)
argue that the production of a container terminal depends on the efficient use of labor, land
and equipment. The measurement of terminal production, therefore, is a means of quantifying
efficiency in the utilization of these three resources. Given the characteristics of container port
production, the total quay length and the terminal area are the most suitable proxies for the
land factor input and the number of quay cranes, the number of transfer cranes, the number
of reach stackers and the number of straddle carriers are the most suitable proxies for the
equipment factor input. Measures of these variables should be incorporated into the models
as input variables
Usually traditional DEA method if employed to obtain efficiency measure for 70 container
terminals, would give 18 efficient container terminals with unit score and 52 inefficient
terminals with scores
< 1. All these inefficient terminals are projected to the 18 efficient
terminals for reference irrespective of their differences in efficiency scores. For example,
a container terminal with a score of 0.07 is projected to the frontier. It is difficult for
this inefficient container terminal to improve its performance by benchmarking a container
terminal on the frontier due to huge performance gap along with the differences in their
input characteristics. Therefore, it is important to have attainable benchmark target for
improvement keeping in view the homogeneity assumption. The partitioning analysis is
useful to provide an appropriate benchmark target for poor performers. By using the
SOM-based DEA algorithm described in sub-section 3.1, we obtained five levels of efficient
frontiers and four clusters. The efficient frontiers are as follows:
E
1
=
DMU
j
|j = 19;20;29; 34;36; 39;41;42;45; 46;53;54;57; 59;60; 63;67;69
92
Self Organizing Maps - Applications and Novel Algorithm Design
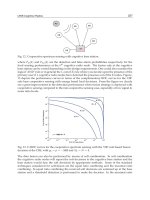
Self-Organizing Maps Infusion with Data Envelopment Analysis 5
(a) Two-dimensional Kohonen network
Cluster 1
30, 34, 50, 51,
52, 53,60, 63, 68
Cluster 4
9, 20, 41, 46, 48,
54, 55, 59, 61
Cluster 2
1, 2, 3, 4,
5, 6, 10, 12
15, 21, 31, 44, 64
Cluster 3
7, 8, 11, 13, 14, 16,
17, 18, 19, 22, 23, 24,
25, 26, 27, 28, 29, 32,
33,35, 36, 37, 38, 39,
40,42, 43, 45, 47, 49,
56,57, 58, 62, 65, 66,
67, 69, 70
(b) Final clustering of container terminal data
Fig. 1. (a) shows the flattening of a two-dimensional Kohonen network in a quadratic input
space. The four diagrams display the state of the network after 100, 1000, 5000, and 10000
iterations.(b) Four clusters of container terminal data at the final state of 1000 iterations.
E
2
=
DMU
j
|j = 4;5;8; 12;13; 15;16;18;26; 31;32;35;40; 44;47; 48;51;58;61; 65;66; 70
E
3
=
DMU
j
|j = 1;2;7; 10;11; 17;28;30;37; 38;52
E
4
=
DMU
j
|j = 3;9;23; 27;43; 50;55;62
E
5
=
DMU
j
|j = 6;14;21; 22;24; 25;33;49;56; 64;68
The proposed SOM-based DEA algorithm produced five stratum of DMUs based on their
efficiency level and four clusters as shown in figure 1(b) based on their input traits. Figure 1(a)
shows the flattening of a two-dimensional Kohonen network in a quadratic input space. The
four diagrams display the state of the network after 100, 1000, 5000, and 10000 iterations.After
organizing the DMUs based on our proposed procedure, the projection of inefficient terminals
were determined. The inefficient DMUs in the lowest stratum i.e. E
5
benchmarks their
immediate upper stratum with similar input features. Same is the case with the DMUs in
E
4
, E
3
, and E
2
belonging to separate clusters.
The application of the model reveals some interesting insight for improving poorly
performing terminals. For example, let us consider DMUs 6, 21, 14, and 22 of E
5
. DMUs 6
and 21 falls in cluster 2 whereas DMUs 14, and 22 are in cluster 3. Traditional DEA techinique
will refer these inefficient terminals to the efficient frontier of 1 irrespective of difference in
the efficiency scores. E.g., DMU 6 gets an efficiency score of 0.07 and for improvement, this
particular DMU is referred to DMU 9 with efficiency score 1. However, DMU 6 varies from
DMU 9 in various aspects of resource mix. Referring to DMU 9 for improvement is unrealistic
due to the presence of heterogeneity in their input traits. Using SOM-based DEA technique,
DMU 6 is referred to DMU 3 in efficient stratum E
4
with similar input mix (they belong to
cluster 2). In the same way DMU 21 in E
5
is also referred to DMU 3 in E
4
as it falls in cluster 2.
Whereas DMUs 14 and 22 of E
5
is referred to DMUs 23, 27, 43, and 62 of E
4
as they belong to
cluster 3. Thus SOM-based DEA algorithm significantly enhances the capability of traditional
DEA tool in prescribing realistic reference points for inefficient DMUs which otherwise is not
possible with traditional DEA alone.
93
Self-Organizing Maps Infusion with Data Envelopment Analysis