Smart Wireless Sensor Networks Part 7 pptx
Bạn đang xem bản rút gọn của tài liệu. Xem và tải ngay bản đầy đủ của tài liệu tại đây (1.48 MB, 30 trang )
Cooperative Clustering Algorithms for Wireless Sensor Networks 169
E
red_i
= E
residual_i
− E
residual_CCH
. Then a CCH broadcasts the set ID of cluster heads, and
other sensor nodes listen and wait for the reception of cluster head coalition message. If se-
lected as a cluster head, a sensor node would broadcast an advertisement message to inform
other nodes in the network of its decision. Otherwise, non-CHs wait for cluster head an-
nouncements and choose the optimum cluster. With that, each non cluster head node sends
the join message to the cluster head which is chosen through received signal strength. After
receiving all join messages in a cluster, a cluster head creates a time division multiple access
schedule according to number of sensor nodes in the current cluster. Finally, it transmits this
schedule to ensure that there are no collisions among data transmission and non cluster heads
could decrease energy consumption during idle time. After receiving time division multiple
access schedules, all sensor nodes get sensing data and transmit it to cluster heads during
their allocated time slots. For data collection, cluster heads aggregate individual data from
each non cluster head and send condensed summaries to the base station.
5. Simulation and Analysis
In this section, we describe the simulation environment and the analysis of results. Our sim-
ulation is based on ns2 and LEACH (Heinzelman, 2000; Heinzelman et al., 2002). The sim-
ulation scenarios consist of simplex energy distribution with different position distribution.
In the simplex scenarios, the position of each sensor node is random, lattice, semi-lattice and
normal distribution, respectively. In the semi-lattice distribution, half of sensor nodes are dis-
tributed with lattice method; the others are randomly distributed in the area. Moreover, Fig. 7
and 8 provide a detailed analysis of the simplex scenario with random distribution in the best
case. We also present a statistical analysis of other results with the 0.975 confidence in Fig. 9
and 10.
Table 1. Simulation parameter values
Parameter Value
N 100
M 100m
k 5
d
co
86.4m
ε
f s
3 ×10
−12
J/bit/m
2
ε
tr
4 ×10
−16
J/bit/m
4
R
b
1Mbps
E
elec
0.5nJ/bit
E
DA
0.1nJ/bit
5.1 Simulation set-up
In (Daly & Chandrakasan, 2007), a 1Mbps 916.5MHz on-off keying (OOK) transceiver for wire-
less sensor networks had been designed in a 0.18-µm CMOS process. The minimal receiver
power consumption is 0.5mW. Moreover, the noise figure of the Radio Frequency front-end in-
cluding the 3.5dB loss of the surface acoustic wave (SAW) filter is between 14dB and 15dB for
all gain settings, indicating that the tuned low noise amplifier (LNA) dominates the noise fig-
ure. Therefore, in our simulation, we set E
elec
is 0.5nJ/bit for a bit rate (R
b
) 1Mbps transceiver,
the thermal noise floor is 99dBm, the receiver noise figure is 14dB and a signal-to-noise ra-
tio(SNR) is at least 28dB to receive the signal with no errors. Thus, the minimum receive
power P
r−thresh
for successful reception is P
r−thresh
≤ −57dBm. With that, the cross-over
distance d
co
is 86.4m. And in (7), ε
f s
and ε
tr
are 3 ×10
−12
J/bit/m
2
and 4 × 10
−16
J/bit/m
4
,
respectively. Furthermore, the ARM (Advanced RISC Machine) architecture is widely used in
embedded designs. For power saving features, ARM CPUs are dominant in wireless sensor
networks, where low power consumption is a critical design goal. In recent years, the new
version of ARM has been successfully used for many years in a wide range of wireless de-
vice application. Building on the Cortex foundation, the processor achieves performance of
2.0DMIPS/MHz, low power of 0.5mW/MHz and speed up to 1GHz. Thus, we assume that
the energy consumption of per bit data aggregation (E
DA
) is 0.1nJ/bit. For our simulation, we
assume that 100 sensor nodes are dispersed into the 100m
×100m area with 5 clusters and the
simulation is finished when the rate of sensor nodes alive is less than 0.1.
x 10
5
x 10
3
Fig. 7. Lifetime and data capacity
x 10
5
Fig. 8. Energy efficiency
Smart Wireless Sensor Networks170
5.2 Analysis of simulation results
In this section, we introduce the results of simplex scenario while the initial energy of a sensor
node is 1J and the position of base station is
(50, 175). In our simulation, we use the number
of sensor nodes transmission times defined as the sum of transmission times for each sensor
node to represent the data transmission capacity. The effect of capacity of data transmission on
the time is shown in Fig. 7. As illustrated in this figure, both in CGC and EEDBC, the network
lifetimes are greatly prolonged more than that of LEACH about 25%. Typically, however,
the final number of sensor nodes transmission times is increasing up to 24.5% and 21.6%
compared with LEACH and EEDBC, respectively. Accordingly, at the same time, our scheme
provides more amount of transmission data to base station. In other words, CGC also reduces
the data transmission latency. Fig. 8 compares the three algorithms in terms of ˛A@energy
efficiency defined as the number of sensor nodes transmission times per unit energy. The
result shows that CGC is the most efficient scheme and the transmission data per unit energy
is delivered up to approximate 22% in the end.
x 10
3
Fig. 9. Statistical analysis of lifetime
x 10
5
Fig. 10. Statistical analysis of data capacity
From the statistical analysis of network lifetime in Fig. 9 and data transmission capacity in Fig.
10, comparing with other approaches, our scheme can guarantee to prolong network lifetime
and improve data transmission capacity up to 5.8% and 35.9%, respectively.
The results of simulation show that CGC outperforms other algorithms on network life-
time, data transmission capacity and energy efficiency with concern of position distributions.
Therefore, our scheme can surely guarantee to prolong network lifetime, reduce data trans-
mission latency and improve the utilization of energy.
6. Conclusion
In this chapter, we presented a cooperative game theoretic model for clustering algorithms
in wireless sensor networks, which is provided for balancing energy consumption of sensor
nodes and increasing network lifetime and stability. Moreover, from feasible allocations of
energy cost as the results of this model, we proposed and analyzed the cooperative clustering
algorithm to obtain system-wide optimization from conditions of cooperation, considering
the redundant energy, communication costs and number of sensor nodes in a cluster adapt-
ing to various wireless sensor networks. The basic idea is that each sensor node should trade
off individual cost with network-wide cost. Consequently, each capable sensor node should
cooperate with others in cluster formation for collective decision-making. Furthermore, we
presented performance evaluation and comparison of the existing clustering algorithms with
our approach quantitatively with respect to network lifetime, data transmission capacity and
energy efficiency. We provided a detailed analysis of the simplex scenario with random posi-
tion distribution in the best case and a statistical analysis of the scenarios with different posi-
tion distributions including random, lattice, semi-lattice and normal distributions. Compar-
ing with other approaches through simulations, our protocol can surely guarantee to prolong
network lifetime and improve data transmission capacity up to 5.8% and 35.9%, respectively.
7. References
Abbasi, A. A. & Younis, M. (2007). A survey on clustering algorithms for wireless sensor
networks, Computer Communications Vol. 30(No. 14-15): 2826–2841.
Akyildiz, I., Su, W., Sankarasubramaniam, Y. & Cayirci, E. (2002). Wireless sensor networks:
a survey, Computer Networks: The International Journal of Computer and Telecommunica-
tions Networking Vol. 38(No. 4): 393–422.
Daly, D. & Chandrakasan, A. (2007). An energy-efficient ook transceiver for wireless sensor
networks, IEEE Journal Solid-State Circuits Vol. 42(No. 5): 1003–1011.
Felegyhazi, M., Hubaux, J P. & Buttyan, L. (2006). Nash equilibria of packet forwarding strate-
gies in wireless ad hoc networks, IEEE Transactions on Mobile Computing Vol. 5(No.
5): 463–476.
Hac, A. (2003). Wireless Sensor Network Designs, John Wiley and Sons.
Han, Y., Park, S., Eom, J. & Chung, T. (2007). Energy-efficient distance based clustering routing
scheme for wireless sensor networks, Lecture Notes in Computer Science, Computational
Science and Its Applications Vol. 4706/2007: 195–206.
Handy, M. J., Haase, M. & Timmermann, D. (2002). Low energy adaptive clustering hierarchy
with deterministic cluster-head selection, Proceedings of 4th IEEE Conference on mobile
and wireless communications network, pp. 368–372.
Heinzelman, W. (2000). Application-specific protocol architectures for wireless networks,
Ph.D. thesis, Massachusetts Institute of Technology .
Heinzelman, W., Chandrakasan, A. & Balakrishnan, H. (2002). An application-specific pro-
tocol architecture for wireless microsensor networks, IEEE Transactions on Wireless
Communications Vol. 1(No. 14): 660–670.
Cooperative Clustering Algorithms for Wireless Sensor Networks 171
5.2 Analysis of simulation results
In this section, we introduce the results of simplex scenario while the initial energy of a sensor
node is 1J and the position of base station is
(50, 175). In our simulation, we use the number
of sensor nodes transmission times defined as the sum of transmission times for each sensor
node to represent the data transmission capacity. The effect of capacity of data transmission on
the time is shown in Fig. 7. As illustrated in this figure, both in CGC and EEDBC, the network
lifetimes are greatly prolonged more than that of LEACH about 25%. Typically, however,
the final number of sensor nodes transmission times is increasing up to 24.5% and 21.6%
compared with LEACH and EEDBC, respectively. Accordingly, at the same time, our scheme
provides more amount of transmission data to base station. In other words, CGC also reduces
the data transmission latency. Fig. 8 compares the three algorithms in terms of ˛A@energy
efficiency defined as the number of sensor nodes transmission times per unit energy. The
result shows that CGC is the most efficient scheme and the transmission data per unit energy
is delivered up to approximate 22% in the end.
x 10
3
Fig. 9. Statistical analysis of lifetime
x 10
5
Fig. 10. Statistical analysis of data capacity
From the statistical analysis of network lifetime in Fig. 9 and data transmission capacity in Fig.
10, comparing with other approaches, our scheme can guarantee to prolong network lifetime
and improve data transmission capacity up to 5.8% and 35.9%, respectively.
The results of simulation show that CGC outperforms other algorithms on network life-
time, data transmission capacity and energy efficiency with concern of position distributions.
Therefore, our scheme can surely guarantee to prolong network lifetime, reduce data trans-
mission latency and improve the utilization of energy.
6. Conclusion
In this chapter, we presented a cooperative game theoretic model for clustering algorithms
in wireless sensor networks, which is provided for balancing energy consumption of sensor
nodes and increasing network lifetime and stability. Moreover, from feasible allocations of
energy cost as the results of this model, we proposed and analyzed the cooperative clustering
algorithm to obtain system-wide optimization from conditions of cooperation, considering
the redundant energy, communication costs and number of sensor nodes in a cluster adapt-
ing to various wireless sensor networks. The basic idea is that each sensor node should trade
off individual cost with network-wide cost. Consequently, each capable sensor node should
cooperate with others in cluster formation for collective decision-making. Furthermore, we
presented performance evaluation and comparison of the existing clustering algorithms with
our approach quantitatively with respect to network lifetime, data transmission capacity and
energy efficiency. We provided a detailed analysis of the simplex scenario with random posi-
tion distribution in the best case and a statistical analysis of the scenarios with different posi-
tion distributions including random, lattice, semi-lattice and normal distributions. Compar-
ing with other approaches through simulations, our protocol can surely guarantee to prolong
network lifetime and improve data transmission capacity up to 5.8% and 35.9%, respectively.
7. References
Abbasi, A. A. & Younis, M. (2007). A survey on clustering algorithms for wireless sensor
networks, Computer Communications Vol. 30(No. 14-15): 2826–2841.
Akyildiz, I., Su, W., Sankarasubramaniam, Y. & Cayirci, E. (2002). Wireless sensor networks:
a survey, Computer Networks: The International Journal of Computer and Telecommunica-
tions Networking Vol. 38(No. 4): 393–422.
Daly, D. & Chandrakasan, A. (2007). An energy-efficient ook transceiver for wireless sensor
networks, IEEE Journal Solid-State Circuits Vol. 42(No. 5): 1003–1011.
Felegyhazi, M., Hubaux, J P. & Buttyan, L. (2006). Nash equilibria of packet forwarding strate-
gies in wireless ad hoc networks, IEEE Transactions on Mobile Computing Vol. 5(No.
5): 463–476.
Hac, A. (2003). Wireless Sensor Network Designs, John Wiley and Sons.
Han, Y., Park, S., Eom, J. & Chung, T. (2007). Energy-efficient distance based clustering routing
scheme for wireless sensor networks, Lecture Notes in Computer Science, Computational
Science and Its Applications Vol. 4706/2007: 195–206.
Handy, M. J., Haase, M. & Timmermann, D. (2002). Low energy adaptive clustering hierarchy
with deterministic cluster-head selection, Proceedings of 4th IEEE Conference on mobile
and wireless communications network, pp. 368–372.
Heinzelman, W. (2000). Application-specific protocol architectures for wireless networks,
Ph.D. thesis, Massachusetts Institute of Technology .
Heinzelman, W., Chandrakasan, A. & Balakrishnan, H. (2002). An application-specific pro-
tocol architecture for wireless microsensor networks, IEEE Transactions on Wireless
Communications Vol. 1(No. 14): 660–670.
Smart Wireless Sensor Networks172
Machado, R. & Tekinaya, S. (2008). A survey of game-theoretic approaches in wireless sensor
networks, Computer Networks: The International Journal of Computer and Telecommuni-
cations Networking Vol. 52(No. 16): 3047–3061.
Nisan, N., Roughgarden, T., Tardos, E. & Vazirani, V. V. (2007). Algorithmic Game Theory,
Cambridge University Press.
Younis, M., Youssef, M. & Arisha, K. (2003). Energy-aware management for cluster-based
sensor networks, Computer Networks Vol. 43(No. 5): 649–668.
Younis, O. & Fahmy, S. (2004). Heed: A hybrid, energy-efficient, distributed clustering ap-
proach for ad hoc sensor networks, IEEE Transactions on Mobile Computing Vol. 2(No.
4): 366–379.
Zheng, Z., Wu, Z. & Lin, H. (2004). Clustering routing algorithm using game-theoretic tech-
niques for wsns, Proceedings of the 2004 international symposium on circuits and systems,
pp. IV–904–7.
A Cluster Head Election Method for Equal Cluster Size in Wireless Sensor Network 173
A Cluster Head Election Method for Equal Cluster Size in Wireless
Sensor Network
Choon-Sung Nam, Kyung-Soo Jang and Dong-Ryeol Shin
X
A Cluster Head Election Method for Equal
Cluster Size in Wireless Sensor Network
Choon-Sung Nam
1
, Kyung-Soo Jang
2
and Dong-Ryeol Shin
1
Sungkyunkwan University
1
and
Kyungin women’s college
2
1. Introduction
Wireless sensor networks (WSNs) are composed of many homogeneous or heterogeneous
sensor nodes with limited resources. A sensor node is comprised of three components: a
sensor, a processor and a wireless communication device. A sensor of nodes detect a change
in surroundings, a processor processes sensing data collected from neighbour nodes or own
environmental information, and a wireless communication device is capable to send and
receive sensing data.
Sensor networks consist of a great number of sensor nodes and one or several sink nodes.
The role of a sensor node is to detect and process own environmental information, to
convert it to sensing data, to send it to neighbour nodes or sink nodes, and to collect it from
neighbour nodes. On the other hands, the role of a sink node is to collect sensing data from
sensor nodes and to be gateway that interconnects different network and transmits data to
it.
Generally, sensor nodes of WSNs are randomly scattered on specific area for satisfying
user’s requirements (detecting, observing and monitoring environment) and have to self-
organized network. It is difficult to exchange and charge node battery as the area where
sensor nodes are located in is inaccessible location. So, it is important issue to design power-
efficient protocol method for low-power operation and prolonging the network lifetime
(Akyildiz et al, 2002).
A sensor node needs wireless ad-hoc network capability to collect sensing data of wireless
sensor network without a communication infrastructure. Sensor networks are, however, not
suitable for the existing ad-hoc routing method (Tubaishat & Madria, 2003) because of
sensor nodes with limited capability. Thus sensor networks require wireless ad-hoc routing
method considering self-organization, restrictive power, and data-based
communication(Sohrabi et al, 2000) and need multi-hop routing mechanism because of the
limited transmission radius of a sensor nodes.
WSNs should design for routing algorithm considering low-power operation because it has
limited features and is a traditional wireless networks completely different from ‘the
network(Al-Karaki & A.E. Kamal, 2004). In WSNs, routing methods can divide into two
routing mechanisms: ‘flat-routing’ and ‘hierarchical-routing’. The ‘flat-routing’ technique
regards the whole network as one region, enabling all nodes to participate in one region. On
10
Smart Wireless Sensor Networks174
the other hands, the ‘hierarchical-routing’ technique is to execute local cluster routing
scheme based on clustering.
The feature of sensing data is that adjacent sensor nodes have similar or same sensing
data(Ameer Ahmed Abbasi and Mohamed Younis, 2007). That is, the duplicate sensing data
exist in sensor networks. To prevent duplicate sensing data, the ‘hierarchical-routing’
technique uses the clustering scheme. The Cluster region is a local area assigned by user’s
requirement. It is composed of a cluster head node and member nodes. A cluster head is for
aggregating sensing data from member nodes. The number of sensing data in the
‘hierarchical-routing’ is lower as cluster head works. Thus, the ‘hierarchical-routing’ is more
energy-efficient routing technique than the ‘flat-routing’.
A process of clustering is as follows. First, a sink node elects cluster heads among all
scattered sensor nodes. Each cluster head makes a local cluster by using advertisement
message. Member nodes send sensing data to own cluster head. A cluster head collects
sensing data from member nodes for ‘data-aggregation’ that prevents duplicate data. When
a sink node requests user-demand, in response to user-demand, a cluster head prevents
unnecessary query flooding. To communicate with sensor nodes which are outside sensing
range, a sensor node is suitable for multi-hop networking(Toumpis & Goldsmith, 2003). It is
important to measure the number of cluster member nodes in local cluster based on multi-
hop clustering. If there are many member nodes in local cluster, the energy consumption in
a local cluster is increased. The energy drain of a cluster head is also increased. On the other
hand, if there are little member nodes in a local cluster, the energy consumption is low. The
energy drain of a cluster head is also low. Thus, it is important how many member nodes
are needed to set up a local cluster for energy-efficient sensor networks.
This chapter shows energy-efficient cluster formation method. To achieve this, a local cluster
should know the number of optimal member nodes and adjusts the position of a cluster
head considering the distance between cluster heads and member nodes. That is to build
balance among local clusters. Thus, this method can find low-power mechanism of sensor
networks for clustering.
The organization of this chapter is as followings: in section 2, we shows an overview of
previous clustering methods and describe problems of them. In section 3, we present the
cluster head election method for equal size. In section 4, we compare previous methods with
the proposed method, and analyze them. Finally, in section 5, we present conclusion and
future works.
2. Clustering mechanism for sensor networks
2.1 Cluster head selection with random costs
The typical clustering method is LEACH(Heinzelman et al, 2000). LEACH is a routing
method based on clustering for distribution energy consumption of wireless sensor
networks. The feature of LEACH is a clustering method to distribute energy consumption to
all sensor nodes in sensor networks. To achieve this, LEACH elects randomly a cluster head
which aggregates sensing data from member nodes in local cluster and processes them for
managing a local cluster workload. LEACH consists of two stages: ‘set-up’ stage and
‘steady-state’. The ‘set-up’ stage is to form a cluster and the ‘steady-state’ stage is to
comprise of several TDMA frames. In ‘set-up’ stage, all sensor nodes select a cluster head by
threshold T(n) in equation 1. Each node selects random number between 0(zero) and 1(one).
If the selected number is a smaller number than threshold T(n), the node that has a smaller
number is a cluster head in the current round.
otherwise
Gi
p
rp
p
i
T
,0
,
)
1
mod(*1
)(
(1)
In equation (1), p is the ration of a cluster head, r is the current round, and G is a set of
nodes that were not a cluster head in 1/p round. By equation (1), all nodes only become a
cluster head among 1/p round once. The more round is increased, the more probability
which a node becomes a cluster head is increased. After 1/p round, a node can become a
cluster head with same probability, again. The energy drain of cluster head is so bigger than
a member node because of aggregating, processing and sending sensing data from member
nodes. To prolong sensor network lifetime, a cluster head have to be circulated. Through
this mechanism, LEACH can circulate equally a cluster head. A fair distribution of cluster
head selection might make equal energy consumption of cluster heads and be probable for
fair energy consumption of all sensor nodes in sensor networks.
Fig. 1. Cluster formation in LEACH
When LEACH organizes a cluster, it can form equally a cluster (good-case-scenario) or not
(bad-case-scenario). In LEACH, as a local cluster is organized by the selected cluster head,
location of cluster heads affects the number of member nodes in a local cluster. If there are
many member nodes in local cluster, the energy spending of a cluster head is increased. On
the other hand, if there are little member nodes in local cluster, the energy consumption of a
A Cluster Head Election Method for Equal Cluster Size in Wireless Sensor Network 175
the other hands, the ‘hierarchical-routing’ technique is to execute local cluster routing
scheme based on clustering.
The feature of sensing data is that adjacent sensor nodes have similar or same sensing
data(Ameer Ahmed Abbasi and Mohamed Younis, 2007). That is, the duplicate sensing data
exist in sensor networks. To prevent duplicate sensing data, the ‘hierarchical-routing’
technique uses the clustering scheme. The Cluster region is a local area assigned by user’s
requirement. It is composed of a cluster head node and member nodes. A cluster head is for
aggregating sensing data from member nodes. The number of sensing data in the
‘hierarchical-routing’ is lower as cluster head works. Thus, the ‘hierarchical-routing’ is more
energy-efficient routing technique than the ‘flat-routing’.
A process of clustering is as follows. First, a sink node elects cluster heads among all
scattered sensor nodes. Each cluster head makes a local cluster by using advertisement
message. Member nodes send sensing data to own cluster head. A cluster head collects
sensing data from member nodes for ‘data-aggregation’ that prevents duplicate data. When
a sink node requests user-demand, in response to user-demand, a cluster head prevents
unnecessary query flooding. To communicate with sensor nodes which are outside sensing
range, a sensor node is suitable for multi-hop networking(Toumpis & Goldsmith, 2003). It is
important to measure the number of cluster member nodes in local cluster based on multi-
hop clustering. If there are many member nodes in local cluster, the energy consumption in
a local cluster is increased. The energy drain of a cluster head is also increased. On the other
hand, if there are little member nodes in a local cluster, the energy consumption is low. The
energy drain of a cluster head is also low. Thus, it is important how many member nodes
are needed to set up a local cluster for energy-efficient sensor networks.
This chapter shows energy-efficient cluster formation method. To achieve this, a local cluster
should know the number of optimal member nodes and adjusts the position of a cluster
head considering the distance between cluster heads and member nodes. That is to build
balance among local clusters. Thus, this method can find low-power mechanism of sensor
networks for clustering.
The organization of this chapter is as followings: in section 2, we shows an overview of
previous clustering methods and describe problems of them. In section 3, we present the
cluster head election method for equal size. In section 4, we compare previous methods with
the proposed method, and analyze them. Finally, in section 5, we present conclusion and
future works.
2. Clustering mechanism for sensor networks
2.1 Cluster head selection with random costs
The typical clustering method is LEACH(Heinzelman et al, 2000). LEACH is a routing
method based on clustering for distribution energy consumption of wireless sensor
networks. The feature of LEACH is a clustering method to distribute energy consumption to
all sensor nodes in sensor networks. To achieve this, LEACH elects randomly a cluster head
which aggregates sensing data from member nodes in local cluster and processes them for
managing a local cluster workload. LEACH consists of two stages: ‘set-up’ stage and
‘steady-state’. The ‘set-up’ stage is to form a cluster and the ‘steady-state’ stage is to
comprise of several TDMA frames. In ‘set-up’ stage, all sensor nodes select a cluster head by
threshold T(n) in equation 1. Each node selects random number between 0(zero) and 1(one).
If the selected number is a smaller number than threshold T(n), the node that has a smaller
number is a cluster head in the current round.
otherwise
Gi
p
rp
p
i
T
,0
,
)
1
mod(*1
)(
(1)
In equation (1), p is the ration of a cluster head, r is the current round, and G is a set of
nodes that were not a cluster head in 1/p round. By equation (1), all nodes only become a
cluster head among 1/p round once. The more round is increased, the more probability
which a node becomes a cluster head is increased. After 1/p round, a node can become a
cluster head with same probability, again. The energy drain of cluster head is so bigger than
a member node because of aggregating, processing and sending sensing data from member
nodes. To prolong sensor network lifetime, a cluster head have to be circulated. Through
this mechanism, LEACH can circulate equally a cluster head. A fair distribution of cluster
head selection might make equal energy consumption of cluster heads and be probable for
fair energy consumption of all sensor nodes in sensor networks.
Fig. 1. Cluster formation in LEACH
When LEACH organizes a cluster, it can form equally a cluster (good-case-scenario) or not
(bad-case-scenario). In LEACH, as a local cluster is organized by the selected cluster head,
location of cluster heads affects the number of member nodes in a local cluster. If there are
many member nodes in local cluster, the energy spending of a cluster head is increased. On
the other hand, if there are little member nodes in local cluster, the energy consumption of a
Smart Wireless Sensor Networks176
cluster head is decreased. That is, that the energy consumption of cluster head is affected by
the number of member nodes. As a result, in LEACH, it is difficult to keep up the balance of
node energy of whole sensor networks.
In LEACH, all member nodes delivery sensing data directly to a cluster head or the sink
node because LEACH assumes transmit power control. However, a sensor node is suitable
for communicating the node with outside sensing range based on multi-hop routing method
because of node’s communication limited(Gutierrez et al, 2001, Noseong Park et al, 2005).
That is, in case of outside the range of a cluster head or the sink node, sensor networks
should organize clustering using multi-hop routing mechanism.
LEACH-C(LEACH-Centralized)(Heinzelman et al, 2002) is similar to LEACH. That means
that two algorithms are same to data transmission processes between the BS and the sensor
nodes. On the other hand, the process of cluster head selection in LEACH-C is different with
LEACH. LEACH-C uses a central control algorithm to form the clusters that may produce
better clusters by dispersing the cluster head nodes throughout the network. During the set-
up phase of LEACH-C, each node sends information about its current location (possibly
determined using a GPS receiver) and energy level to a sink node. A sink computes the
average energy level of all nodes by received message, and then give the right which is not
possible for the cluster heads if the sensor node have lower energy than the average energy
level. Using the remaining nodes as possible cluster heads, the BS finds clusters using the
simulated annealing algorithm(Murata & Ishibuchi, 1994) to solve the NP-hard problem of
finding optimal clusters(Agarwal & Procopiuc, 1999). This algorithm attempts to minimize
the amount of energy for the non-cluster head nodes to transmit their data to the cluster
head, by minimizing the total sum of squared distance between all the non-cluster head
nodes and the closest cluster head. After the cluster heads are elected, member nodesf can
select the cluster head which they can communicate with minimum energy consumption. A
cluster is organized by the node transmitting the message as a determined cluster head node.
After clustering, The cluster heads perform TDMA scheduling, transmit the schedule to
member nodes in local clusters, and then start the data transmission time. The strong point
of LEACH-C is that it can equally distribute waste to energy between sensor nodes by
positioning cluster heads into the center of cluster. A sensor node, however, should be
loaded with GPS receiver set. And it has not still guaranteed balance of energy consumption
of whole sensor networks. This technique makes the price of sensor nodes increase high.
Because of a number of sensor nodes to be needed for the network ranges from hundreds to
hundred-thousands, this technique is not appropriate(Handy et al, 2005).
Above two methods increase the energy consumption because of additional overhead for
knowing the energy level. To achieve this problem, HEED(Younis & Fahm, 2004) proposes
the cluster head selection method using by distributed processing. HEED can select the
cluster heads only considering the parameters of nodes. In HEED, the cluster head election
should use only local data, have low amount of data for clustering and be completed in a
certain period of time. Thus the advantages of HEED are that algorithm time terminate in a
certain period of time regardless of cluster size and do not consider the location of nodes.
HEED do not also guarantee the equal distribution of the cluster heads in networks like
LEACH and LEACH-C.
2.2 Cluster head selection with equal member nodes
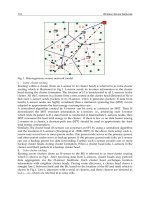
ACHS(Adaptive Cluster Head Selection)(Choon-Sung Nam, 2008) is the method to divide
unequal cluster size into equal cluster size for balance of energy consumption in a local
cluster. In case the number of member nodes per a local cluster is more or less than average
number of member nodes, this cluster could be an unequal cluster. To solve unfairness
among local clusters, ACHS re-selects cluster heads using by distance between cluster heads
and between member nodes and a cluster head. This method is as follows. First, the sink
node elects a cluster head randomly like LEACH equation (1). The selected cluster head
informs neighbor nodes for an advertisement message. In response to the message, each
member node registers with own cluster head. A cluster head sets up and stores the farthest
member node (FMN) with cache memory among member nodes. In the same way, it keeps
the shortest cluster head (SCH) with cache. If the difference of FMN and SCH is same, this
means that local clusters are divided into equal cluster size.
In Fig. 2-(a), if the gap of FMN is longer than SCH, in case of cluster head ‘A’, the cluster size
is bigger than neighboring cluster size as the cluster which has cluster head ‘A’ invades a
domain of neighboring cluster which has cluster head ‘B’. In other words, that cluster size is
bigger means that the number of member nodes is so more. Thus the cluster head ‘A’ should
be moved to FMN as difference between FMN and SCN, and is reselected a cluster head
among near nodes. If the gap of FMN is shorter than SCH, in case of cluster head ‘B’, the
neighboring cluster size is bigger than the cluster size of ‘B’ as the neighboring cluster ‘A’
invades own domain. Thus, the cluster head ‘B’ moves to SCH as difference between FMN
and SCH, and is reselected a cluster head among near nodes. After these processes, a local
cluster would be divided equally like Fig.2-(b).
Fig. 2. Cluster organization using by adaptive cluster head selection method (ACHS)
ACHS used direct data transmission method that computed the distance between cluster
heads and member nodes. ACHS has the same problem on communication range like
LEACH. In case of outside transmission range, it cannot communicate with outside nodes.
As a result, it is difficult to establish scalable network. Thus ACHS also need to multi-hop
routing method for clustering. Another problem has to be to reorganizes the equal cluster
unnecessarily for equal clusters although previous established local cluster is equal.
A Cluster Head Election Method for Equal Cluster Size in Wireless Sensor Network 177
cluster head is decreased. That is, that the energy consumption of cluster head is affected by
the number of member nodes. As a result, in LEACH, it is difficult to keep up the balance of
node energy of whole sensor networks.
In LEACH, all member nodes delivery sensing data directly to a cluster head or the sink
node because LEACH assumes transmit power control. However, a sensor node is suitable
for communicating the node with outside sensing range based on multi-hop routing method
because of node’s communication limited(Gutierrez et al, 2001, Noseong Park et al, 2005).
That is, in case of outside the range of a cluster head or the sink node, sensor networks
should organize clustering using multi-hop routing mechanism.
LEACH-C(LEACH-Centralized)(Heinzelman et al, 2002) is similar to LEACH. That means
that two algorithms are same to data transmission processes between the BS and the sensor
nodes. On the other hand, the process of cluster head selection in LEACH-C is different with
LEACH. LEACH-C uses a central control algorithm to form the clusters that may produce
better clusters by dispersing the cluster head nodes throughout the network. During the set-
up phase of LEACH-C, each node sends information about its current location (possibly
determined using a GPS receiver) and energy level to a sink node. A sink computes the
average energy level of all nodes by received message, and then give the right which is not
possible for the cluster heads if the sensor node have lower energy than the average energy
level. Using the remaining nodes as possible cluster heads, the BS finds clusters using the
simulated annealing algorithm(Murata & Ishibuchi, 1994) to solve the NP-hard problem of
finding optimal clusters(Agarwal & Procopiuc, 1999). This algorithm attempts to minimize
the amount of energy for the non-cluster head nodes to transmit their data to the cluster
head, by minimizing the total sum of squared distance between all the non-cluster head
nodes and the closest cluster head. After the cluster heads are elected, member nodesf can
select the cluster head which they can communicate with minimum energy consumption. A
cluster is organized by the node transmitting the message as a determined cluster head node.
After clustering, The cluster heads perform TDMA scheduling, transmit the schedule to
member nodes in local clusters, and then start the data transmission time. The strong point
of LEACH-C is that it can equally distribute waste to energy between sensor nodes by
positioning cluster heads into the center of cluster. A sensor node, however, should be
loaded with GPS receiver set. And it has not still guaranteed balance of energy consumption
of whole sensor networks. This technique makes the price of sensor nodes increase high.
Because of a number of sensor nodes to be needed for the network ranges from hundreds to
hundred-thousands, this technique is not appropriate(Handy et al, 2005).
Above two methods increase the energy consumption because of additional overhead for
knowing the energy level. To achieve this problem, HEED(Younis & Fahm, 2004) proposes
the cluster head selection method using by distributed processing. HEED can select the
cluster heads only considering the parameters of nodes. In HEED, the cluster head election
should use only local data, have low amount of data for clustering and be completed in a
certain period of time. Thus the advantages of HEED are that algorithm time terminate in a
certain period of time regardless of cluster size and do not consider the location of nodes.
HEED do not also guarantee the equal distribution of the cluster heads in networks like
LEACH and LEACH-C.
2.2 Cluster head selection with equal member nodes
ACHS(Adaptive Cluster Head Selection)(Choon-Sung Nam, 2008) is the method to divide
unequal cluster size into equal cluster size for balance of energy consumption in a local
cluster. In case the number of member nodes per a local cluster is more or less than average
number of member nodes, this cluster could be an unequal cluster. To solve unfairness
among local clusters, ACHS re-selects cluster heads using by distance between cluster heads
and between member nodes and a cluster head. This method is as follows. First, the sink
node elects a cluster head randomly like LEACH equation (1). The selected cluster head
informs neighbor nodes for an advertisement message. In response to the message, each
member node registers with own cluster head. A cluster head sets up and stores the farthest
member node (FMN) with cache memory among member nodes. In the same way, it keeps
the shortest cluster head (SCH) with cache. If the difference of FMN and SCH is same, this
means that local clusters are divided into equal cluster size.
In Fig. 2-(a), if the gap of FMN is longer than SCH, in case of cluster head ‘A’, the cluster size
is bigger than neighboring cluster size as the cluster which has cluster head ‘A’ invades a
domain of neighboring cluster which has cluster head ‘B’. In other words, that cluster size is
bigger means that the number of member nodes is so more. Thus the cluster head ‘A’ should
be moved to FMN as difference between FMN and SCN, and is reselected a cluster head
among near nodes. If the gap of FMN is shorter than SCH, in case of cluster head ‘B’, the
neighboring cluster size is bigger than the cluster size of ‘B’ as the neighboring cluster ‘A’
invades own domain. Thus, the cluster head ‘B’ moves to SCH as difference between FMN
and SCH, and is reselected a cluster head among near nodes. After these processes, a local
cluster would be divided equally like Fig.2-(b).
Fig. 2. Cluster organization using by adaptive cluster head selection method (ACHS)
ACHS used direct data transmission method that computed the distance between cluster
heads and member nodes. ACHS has the same problem on communication range like
LEACH. In case of outside transmission range, it cannot communicate with outside nodes.
As a result, it is difficult to establish scalable network. Thus ACHS also need to multi-hop
routing method for clustering. Another problem has to be to reorganizes the equal cluster
unnecessarily for equal clusters although previous established local cluster is equal.
Smart Wireless Sensor Networks178
3. Cluster Head Election Method for Equal Cluster Size
3.1 Cluster head capacity
This method is for energy distribution as all sensor nodes would be selected as a cluster
head after 1/p round. And it helps efficient-energy saving of nodes since the nodes which
has high remaining energy are elected as a cluster head. However, it does not consider
unequal energy consumption of nodes by unequal clusters. The elected cluster head is not
again selected as a cluster head during 1/p rounds although the node has the most energy
than others.
Above described, we knew that the energy gap between a cluster head and a member node
is big during managing clustering. This reason is as following: A member nodes just detects
own surrounding environment and transmit the sensing data to a cluster head. A mount of
aggregated data produced by a cluster head depends on the number of own member nodes.
Thus a cluster head should be selected by energy drain ratio as setting up threshold, T(i).
As shown equation (2), if r is 0, r=0, the probability of all sensor nodes, T(i)r=0, is ‘p’ because
all sensor nodes have not been selected as a cluster head.
Gip
p
rp
p
i
T
i
,
)
1
mod(*1
)(
0
(2)
If r >0, the threshold value of a node that is selected as a cluster head is reduced by amount
of energy consumption. The consumption energy ratio, E
ch
/E
initial
, added to the previous
threshold value is the next threshold value. E
ch
is amount of energy drain of a cluster head
and E
Initial
is initial energy of nodes. If a node is a member node, the consumption energy
ratio, E
mem
/E
inital
, subtracted from the previous threshold is the next threshold value. This is
as following:
otherwise
E
E
iT
Gi
E
E
iT
i
T
Initial
ch
r
r
Initial
mem
r
i
,)(
,)(
)(
1
11
0
(3)
Except for the case that E
ch
is same as E
mem
, all nodes are selected as a cluster head at least
once during 1/p rounds. In next rounds of cluster head selection, the nodes’ threshold value
that is used with cluster head selection is different as is a cluster head energy consumption
in own local cluster. This difference is from the fact that the number of member nodes in
local cluster varies from each other. If a cluster head has fewer member nodes than the
average number of member nodes, the threshold value is also lower. This means that the
cluster head is re-selected as a cluster head during 1/p rounds. This will result in energy
distribution of sensor networks and increasing network life time.
3.2 Equal cluster size
In direct communication, if sensor nodes are located out of transmission range, cluster heads
should be more selected for connecting nodes. To configure the scalable sensor networks,
the clustering method should use multi-hop communication. For cluster formation adapted
multi-hop routing, a local cluster should be organized by the selected cluster head. First, a
sink node selects a cluster head, 5% nodes among all nodes, like LEACH. The selected
cluster head sends the ADV message to neighbour nodes with 1(one) hop for collecting
member nodes. Nodes which received the message repeat this process until they meet the
nodes of another local cluster. The nodes which received the ADV message judge what kind
of a cluster head. The nodes set up a cluster head as the cluster head id (CHid) included the
ADV message, increase their hop-count by one and reply the REP message to own cluster
head. And then a cluster head registers own sensor id. Through this process, a cluster head
can know the number of own member nodes and hop counts between own and member
nodes(Choonsung Nam, 2008)
The pseudo code of clustering process based on multi-hop is as follows.
Procedure cluster formation
Input selected cluster head id
Output node Information belonging to cluster
If received ADV from cluster head Then
Begin
If (Node.My_CHid != null )
insert into Node_Info_values(CHid, Hopcnt++)
reply REP to sender
send ADV message to neighbor nodes
return true
Else
return false
End
ADV Advertisement message
REP Respond message
CHid Cluster head id
Hopcnt Hop count
Node_Info_value Node information value
Fig. 3. Pseudo code for clustering process based on multi-hop
To prevent unequal cluster formation, above method only proposed equal cluster formation
technique using difference between the FMN and the SCH. To balance the clusters, we add
above method to the method which is to balance the number of member nodes. For
example, in Figure 20, 200 sensor nodes are located in 10 x 10 grid structure. The cluster
head is gray circle A, B, C, D and E, 5% among 100 sensor nodes. By multi-hop clustering
method based on the CH, a cluster can be organized local cluster like a dotted line. The
alphabet ‘A’, ‘B’, ‘C’, ‘D’ and ‘E’ are the CHs. The number of member nodes each CH has is
that A is 21, B is 16, C is 14, D is 21, and E is 23. Above mentioned, a cluster head can know
the number of own member nodes and the adaptive number of member nodes. In this
example, the adaptive number of member nodes is 19, (all sensor nodes / cluster heads). So,
cluster head ‘A’ and ‘D’ is adaptive cluster distribution. The cluster head ‘B’, ‘C’ and ‘E’ is
not adaptive. To balance the clusters, the clsuter heads are replaced with the dark circle ‘A’,
‘D’, and ‘E’. Cluster head ‘B’ and ‘E’ is not replaced because the hop count of FMN and SCH
A Cluster Head Election Method for Equal Cluster Size in Wireless Sensor Network 179
3. Cluster Head Election Method for Equal Cluster Size
3.1 Cluster head capacity
This method is for energy distribution as all sensor nodes would be selected as a cluster
head after 1/p round. And it helps efficient-energy saving of nodes since the nodes which
has high remaining energy are elected as a cluster head. However, it does not consider
unequal energy consumption of nodes by unequal clusters. The elected cluster head is not
again selected as a cluster head during 1/p rounds although the node has the most energy
than others.
Above described, we knew that the energy gap between a cluster head and a member node
is big during managing clustering. This reason is as following: A member nodes just detects
own surrounding environment and transmit the sensing data to a cluster head. A mount of
aggregated data produced by a cluster head depends on the number of own member nodes.
Thus a cluster head should be selected by energy drain ratio as setting up threshold, T(i).
As shown equation (2), if r is 0, r=0, the probability of all sensor nodes, T(i)r=0, is ‘p’ because
all sensor nodes have not been selected as a cluster head.
Gip
p
rp
p
i
T
i
,
)
1
mod(*1
)(
0
(2)
If r >0, the threshold value of a node that is selected as a cluster head is reduced by amount
of energy consumption. The consumption energy ratio, E
ch
/E
initial
, added to the previous
threshold value is the next threshold value. E
ch
is amount of energy drain of a cluster head
and E
Initial
is initial energy of nodes. If a node is a member node, the consumption energy
ratio, E
mem
/E
inital
, subtracted from the previous threshold is the next threshold value. This is
as following:
otherwise
E
E
iT
Gi
E
E
iT
i
T
Initial
ch
r
r
Initial
mem
r
i
,)(
,)(
)(
1
11
0
(3)
Except for the case that E
ch
is same as E
mem
, all nodes are selected as a cluster head at least
once during 1/p rounds. In next rounds of cluster head selection, the nodes’ threshold value
that is used with cluster head selection is different as is a cluster head energy consumption
in own local cluster. This difference is from the fact that the number of member nodes in
local cluster varies from each other. If a cluster head has fewer member nodes than the
average number of member nodes, the threshold value is also lower. This means that the
cluster head is re-selected as a cluster head during 1/p rounds. This will result in energy
distribution of sensor networks and increasing network life time.
3.2 Equal cluster size
In direct communication, if sensor nodes are located out of transmission range, cluster heads
should be more selected for connecting nodes. To configure the scalable sensor networks,
the clustering method should use multi-hop communication. For cluster formation adapted
multi-hop routing, a local cluster should be organized by the selected cluster head. First, a
sink node selects a cluster head, 5% nodes among all nodes, like LEACH. The selected
cluster head sends the ADV message to neighbour nodes with 1(one) hop for collecting
member nodes. Nodes which received the message repeat this process until they meet the
nodes of another local cluster. The nodes which received the ADV message judge what kind
of a cluster head. The nodes set up a cluster head as the cluster head id (CHid) included the
ADV message, increase their hop-count by one and reply the REP message to own cluster
head. And then a cluster head registers own sensor id. Through this process, a cluster head
can know the number of own member nodes and hop counts between own and member
nodes(Choonsung Nam, 2008)
The pseudo code of clustering process based on multi-hop is as follows.
Procedure cluster formation
Input selected cluster head id
Output node Information belonging to cluster
If received ADV from cluster head Then
Begin
If (Node.My_CHid != null )
insert into Node_Info_values(CHid, Hopcnt++)
reply REP to sender
send ADV message to neighbor nodes
return true
Else
return false
End
ADV Advertisement message
REP Respond message
CHid Cluster head id
Hopcnt Hop count
Node_Info_value Node information value
Fig. 3. Pseudo code for clustering process based on multi-hop
To prevent unequal cluster formation, above method only proposed equal cluster formation
technique using difference between the FMN and the SCH. To balance the clusters, we add
above method to the method which is to balance the number of member nodes. For
example, in Figure 20, 200 sensor nodes are located in 10 x 10 grid structure. The cluster
head is gray circle A, B, C, D and E, 5% among 100 sensor nodes. By multi-hop clustering
method based on the CH, a cluster can be organized local cluster like a dotted line. The
alphabet ‘A’, ‘B’, ‘C’, ‘D’ and ‘E’ are the CHs. The number of member nodes each CH has is
that A is 21, B is 16, C is 14, D is 21, and E is 23. Above mentioned, a cluster head can know
the number of own member nodes and the adaptive number of member nodes. In this
example, the adaptive number of member nodes is 19, (all sensor nodes / cluster heads). So,
cluster head ‘A’ and ‘D’ is adaptive cluster distribution. The cluster head ‘B’, ‘C’ and ‘E’ is
not adaptive. To balance the clusters, the clsuter heads are replaced with the dark circle ‘A’,
‘D’, and ‘E’. Cluster head ‘B’ and ‘E’ is not replaced because the hop count of FMN and SCH
Smart Wireless Sensor Networks180
is same. The change of cluster area is black line. The number of cluster member nodes (black
line) is that A is 21, B is 18, C is 10, D is 22, and E is 24. That is unequal cluster division than
previous cluster formation. Cluster ‘E’ is changed more unequal cluster size. Specially,
cluster ‘C’ is more unequal cluster size than before. The cases of imbalance cluster are as
following:
Fig. 4. Imbalance of a local cluster by changing cluster heads
Fig. 5. Balance of a local cluster by keeping the adaptive clusters
Although a local cluster has adaptive number of member nodes(all nodes/th number of
cluster heads), the replacement of cluster head is elected to only balance the size of local
cluster. This method do not guarantee adaptive local cluster as the previous adaptive local
clusters are changed. If local clusters are imbalance, the replacement of cluster head should
be selected by the current cluster head for balancing clusters. The previous method does not
have the condition which node is better as a cluster head with same distance or hop counts.
To achieve this problem, we don’t change the adaptive cluster and change only unequal
cluster. We define the adaptive cluster that has the number of member nodes with plus or
minus 10% of the adaptive number of member nodes. That is from 17 to 21. In Fig.5, the
equal local cluster is ‘A’ and ‘D’. The unequal local cluster is ‘B’, ‘C’ and ‘E’. The proposed
method changes them. Cluster ‘B’ and ‘C’ have same distance between the FMN and the
SCH and they don’t re-select their cluster head. According this method, cluster ‘E’ is only
replaced. The SCH of cluster ‘E’ is the cluster ‘C’ and the hop count of it is 2. The FMN of
cluster ‘E’ is node ‘a’ or ‘b’, and hop count of it is 3. Cluster head ‘E’ should move to the
FMN (‘a’ or ‘b’) as 1 hop as the difference between the FMN (‘a’ or ‘b’) and the SCH (‘C’) is 1.
At this time, the cluster head ‘E’ should decide node ‘a’ or ‘b’ as the FMN. The ‘E’ selects
node ‘b’ as the FMN because node ‘b’ is farther than ‘a’ from the SCH ‘E’. The farther
difference between ‘C’ and ‘E’, the more member nodes ‘C’ gets. The number of cluster
member nodes by the proposed method is that A is 21, B is 18, C is 17, D is 21 and E is 18.
Therefore, all local clusters are more equal clustering than above methods.
This result is shown Table 5. The standard deviation of adaptive cluster member nodes
shows that the proposed method is the best.
Random cluster
selection
ACHS
The proposed
method
A 21* A 21* A 21*
B 16 B 18* B 18*
C 14 C 10 C 14
D 21* D 22* D 21*
E 23 E 24 E 23
stdev 3.4 stdev 4.9 stedv 3.1
Table 1. The number of member nodes in a local cluster
Procedure reselecting cluster head
Input selected cluster head id
Output reselected cluster head id
If selected cluster head id Then
Begin
If the optimal number of cluster heads
become EC
Else
check Diff=difference between SCH and FMN
If Diff=0
become EC
If Diff>0
select farther FMN from SCH
move to SCH as far as Diff-hop(s)
If Diff<0
select farther SCH from FMN
move to FMN as far as Diff-hop(s)
End
EC Equal cluster
FMN the farthest member node
SCH the shortest cluster head
Fig. 6. Pseudo code for improved clustering
A Cluster Head Election Method for Equal Cluster Size in Wireless Sensor Network 181
is same. The change of cluster area is black line. The number of cluster member nodes (black
line) is that A is 21, B is 18, C is 10, D is 22, and E is 24. That is unequal cluster division than
previous cluster formation. Cluster ‘E’ is changed more unequal cluster size. Specially,
cluster ‘C’ is more unequal cluster size than before. The cases of imbalance cluster are as
following:
Fig. 4. Imbalance of a local cluster by changing cluster heads
Fig. 5. Balance of a local cluster by keeping the adaptive clusters
Although a local cluster has adaptive number of member nodes(all nodes/th number of
cluster heads), the replacement of cluster head is elected to only balance the size of local
cluster. This method do not guarantee adaptive local cluster as the previous adaptive local
clusters are changed. If local clusters are imbalance, the replacement of cluster head should
be selected by the current cluster head for balancing clusters. The previous method does not
have the condition which node is better as a cluster head with same distance or hop counts.
To achieve this problem, we don’t change the adaptive cluster and change only unequal
cluster. We define the adaptive cluster that has the number of member nodes with plus or
minus 10% of the adaptive number of member nodes. That is from 17 to 21. In Fig.5, the
equal local cluster is ‘A’ and ‘D’. The unequal local cluster is ‘B’, ‘C’ and ‘E’. The proposed
method changes them. Cluster ‘B’ and ‘C’ have same distance between the FMN and the
SCH and they don’t re-select their cluster head. According this method, cluster ‘E’ is only
replaced. The SCH of cluster ‘E’ is the cluster ‘C’ and the hop count of it is 2. The FMN of
cluster ‘E’ is node ‘a’ or ‘b’, and hop count of it is 3. Cluster head ‘E’ should move to the
FMN (‘a’ or ‘b’) as 1 hop as the difference between the FMN (‘a’ or ‘b’) and the SCH (‘C’) is 1.
At this time, the cluster head ‘E’ should decide node ‘a’ or ‘b’ as the FMN. The ‘E’ selects
node ‘b’ as the FMN because node ‘b’ is farther than ‘a’ from the SCH ‘E’. The farther
difference between ‘C’ and ‘E’, the more member nodes ‘C’ gets. The number of cluster
member nodes by the proposed method is that A is 21, B is 18, C is 17, D is 21 and E is 18.
Therefore, all local clusters are more equal clustering than above methods.
This result is shown Table 5. The standard deviation of adaptive cluster member nodes
shows that the proposed method is the best.
Random cluster
selection
ACHS
The proposed
method
A 21* A 21* A 21*
B 16 B 18* B 18*
C 14 C 10 C 14
D 21* D 22* D 21*
E 23 E 24 E 23
stdev 3.4 stdev 4.9 stedv 3.1
Table 1. The number of member nodes in a local cluster
Procedure reselecting cluster head
Input selected cluster head id
Output reselected cluster head id
If selected cluster head id Then
Begin
If the optimal number of cluster heads
become EC
Else
check Diff=difference between SCH and FMN
If Diff=0
become EC
If Diff>0
select farther FMN from SCH
move to SCH as far as Diff-hop(s)
If Diff<0
select farther SCH from FMN
move to FMN as far as Diff-hop(s)
End
EC Equal cluster
FMN the farthest member node
SCH the shortest cluster head
Fig. 6. Pseudo code for improved clustering
Smart Wireless Sensor Networks182
In pseudo code of Fig. 6, if the node are elected as a cluster head, it determine to have the
adaptive member nodes. If it has the adaptive member nodes, the node, the current cluster
head, is not changed. If it not, it determine to change the replacement of cluster heads
considering three conditions. The three conditions are same to the direct communication
conditions. However, in case the replacement of cluster heads have same distance, the
proposed method always selects the node far from the current CH.
4. Performance evaluation and analysis
4.1 Energy model for sensor networks
We assumes the sensor energy model for radio hardware energy dissipation, like figure 10.
This model can divide the transmitter energy to run the radio electronics and the power
amplifier, and the receiver energy to run the radio electronics and have two channel model:
the free space (d
2
, distance, power loss) and the multipath fading(d
4
power loss) channel
models. This model depends on the distance between the transmitter and
receiver(Rappaport, 1996). Power control can be used to invert this loss by appropriately
setting the power amplifier. if the distance is less than a threshold d0, the free space (fs)
model is used; otherwise, the multipath(mp) model is used. Thus, to transmit an l-bit
message a distance d, the radio expends
Fig. 7. Radio energy dissipation model
0
4
0
2
,
,
),()(),(
dddllE
dddllE
dlElEdlE
fselec
fselec
ampTxelecTxTx
(4)
and to receive this message the radio expends:
elecelecRxRx
lElEElE
)()(
(5)
The electronics energy, E
elec
, depends on factors such as the digital coding, modulation,
filtering, and spreading of the signal, whereas the amplifier energy, e
fs
d
2
or e
mp
d
4
, depends
on the distance to the receiver and the acceptable bit-error rate. for the experiments
described in this paper, the communication energy parameters are set as E
elec
=50nJ/bit,
e
fs
=10pJ/bit/m
2
and e
mp
=0.0013pJ/bit/m
4
. Using previous experimental results(Wang et al,
1999), the energy for data aggregation is set as EDA=5nJ/bit/signal.
If the minimum distance of the multipath channel is same to the maximum distance of the
free channel, we can know the minimum distance of the multipath channel by the following
equation.
705.87
24
24
d
dldl
dllEdllE
fsmp
fselecmpelec
(6)
Above equation (6), the minimum channel of the multipath channel is about 87.7m.
However, as the transmission range of regular sensor nodes is shorter than it, the channel of
WSNs should be the free channel based on multi-hop routing
4.2 Network model for sensor networks
For network configuration, we assume the following network topology, as described in
Table 4. We set up the size of the networks to be 100 meter x 100 meter, with a possible
communication radius of a node, R, at 10 meters. To prevent an isolation node, the number
of network nodes is 300. The sensor node’s initial energy is 1 J (Joule) and the data packets
of a node are 525 bytes between a cluster-head and member node, and a sink and a cluster-
head. As described previously, a sink node is located outside of the sensor networks with
the distance between a sink and the networks defined as R. It is shown in table 2.
Network size 100 m
2
The nmber of sensor nodes, N 300
Radius of sensor 10m
Length of each packet 525bytes
E
elec
50nJ/bit
E
amp
10pJ/bit/m
2
EDA 5nJ/bit
Table 2. The number of member nodes in a local cluster
4.3 Analysis for cluster head capacity
When frist round, the proposed method is almost equal to a previous method. Thus we will
compare the average energy consumption of nodes when r>1. We assume that ‘1’ round
time is the time to select cluster head 20 times. In figure 12, gray dots show the nodes when
using the cluster head selection method of LEACH and black dots when proposed method.
When using proposed method, the average round of nodes is higher. That means that the
energy re-selected nodes are lower than other node’s energy and the energy distribution is
good by selecting the node with the lowest remaining energy.
A Cluster Head Election Method for Equal Cluster Size in Wireless Sensor Network 183
In pseudo code of Fig. 6, if the node are elected as a cluster head, it determine to have the
adaptive member nodes. If it has the adaptive member nodes, the node, the current cluster
head, is not changed. If it not, it determine to change the replacement of cluster heads
considering three conditions. The three conditions are same to the direct communication
conditions. However, in case the replacement of cluster heads have same distance, the
proposed method always selects the node far from the current CH.
4. Performance evaluation and analysis
4.1 Energy model for sensor networks
We assumes the sensor energy model for radio hardware energy dissipation, like figure 10.
This model can divide the transmitter energy to run the radio electronics and the power
amplifier, and the receiver energy to run the radio electronics and have two channel model:
the free space (d
2
, distance, power loss) and the multipath fading(d
4
power loss) channel
models. This model depends on the distance between the transmitter and
receiver(Rappaport, 1996). Power control can be used to invert this loss by appropriately
setting the power amplifier. if the distance is less than a threshold d0, the free space (fs)
model is used; otherwise, the multipath(mp) model is used. Thus, to transmit an l-bit
message a distance d, the radio expends
Fig. 7. Radio energy dissipation model
0
4
0
2
,
,
),()(),(
dddllE
dddllE
dlElEdlE
fselec
fselec
ampTxelecTxTx
(4)
and to receive this message the radio expends:
elecelecRxRx
lElEElE
)()(
(5)
The electronics energy, E
elec
, depends on factors such as the digital coding, modulation,
filtering, and spreading of the signal, whereas the amplifier energy, e
fs
d
2
or e
mp
d
4
, depends
on the distance to the receiver and the acceptable bit-error rate. for the experiments
described in this paper, the communication energy parameters are set as E
elec
=50nJ/bit,
e
fs
=10pJ/bit/m
2
and e
mp
=0.0013pJ/bit/m
4
. Using previous experimental results(Wang et al,
1999), the energy for data aggregation is set as EDA=5nJ/bit/signal.
If the minimum distance of the multipath channel is same to the maximum distance of the
free channel, we can know the minimum distance of the multipath channel by the following
equation.
705.87
24
24
d
dldl
dllEdllE
fsmp
fselecmpelec
(6)
Above equation (6), the minimum channel of the multipath channel is about 87.7m.
However, as the transmission range of regular sensor nodes is shorter than it, the channel of
WSNs should be the free channel based on multi-hop routing
4.2 Network model for sensor networks
For network configuration, we assume the following network topology, as described in
Table 4. We set up the size of the networks to be 100 meter x 100 meter, with a possible
communication radius of a node, R, at 10 meters. To prevent an isolation node, the number
of network nodes is 300. The sensor node’s initial energy is 1 J (Joule) and the data packets
of a node are 525 bytes between a cluster-head and member node, and a sink and a cluster-
head. As described previously, a sink node is located outside of the sensor networks with
the distance between a sink and the networks defined as R. It is shown in table 2.
Network size 100 m
2
The nmber of sensor nodes, N 300
Radius of sensor 10m
Length of each packet 525bytes
E
elec
50nJ/bit
E
amp
10pJ/bit/m
2
EDA 5nJ/bit
Table 2. The number of member nodes in a local cluster
4.3 Analysis for cluster head capacity
When frist round, the proposed method is almost equal to a previous method. Thus we will
compare the average energy consumption of nodes when r>1. We assume that ‘1’ round
time is the time to select cluster head 20 times. In figure 12, gray dots show the nodes when
using the cluster head selection method of LEACH and black dots when proposed method.
When using proposed method, the average round of nodes is higher. That means that the
energy re-selected nodes are lower than other node’s energy and the energy distribution is
good by selecting the node with the lowest remaining energy.
Smart Wireless Sensor Networks184
Fig. 8. Average round time of nodes
Fig. 9 shows survival rate of nodes. Node alive rounds of proposed method are longer than
the method like LEACH. That means that LEACH cannot control to distribute overload of a
cluster head. As the proposed method considered unequal clustering, overload of a cluster
head, the nodes that used this method live longer than LEACH. As the round progresses,
we can know survival rate of the proposed method is higher than LEACH. Since the
percentage of alive nodes are 90%(0.9), the nodes of LEACH dramatically died than the
proposed method. When the alive rate is 10%(0.1), they died slowly as the remaining nodes
have few member nodes. Since 90%, the nodes of the proposed method, on the other hand,
died slowly than LEACH as distributing energy consumption.
Fig. 9. Node alive round
4.4 Analysis of the number of cluster member nodes
We measured the number of member nodes and hop count in local cluster. Each node is
chosen for a cluster head with equal probability. After cluster head election about 20 times,
one round comes to an end. We repeated this process 10 times. We gained the result of
average value and obtained the standard deviation of standard variation and clustering. The
lower standard deviation, the more equal a cluster forms.
Fig. 10. The standard deviation of member nodes
Fig. 10 shows the standard deviation (STDEV) of member nodes in local cluster. Above
figure, LEACH is higher than other algorithm. On the other hand, Direct(direct
communication) and Multi-hop(multi-hop communication) are lower than LEACH. In case
of the standard deviation of LEACH, experiments number 2, 7 and 16, a cluster is bad-case-
scenario. In bad-case, Direct and Multi-hop can reduce STDEV of member nodes. In
experiments number 3, 9 and 12, Direct is higher than LEACH. This means that Direct can
form unequal clustering, compared with cluster formation. In case of the proposed method
Multi-hop, it has little lower value than LEACH and Direct. Also, as shown in Fig. 11, Multi-
hop has the lowest average standard deviation value of member nodes. So, Multi-hop can
organize more equal cluster size than LEACH and Direct.
Fig. 11. The average standard deviation of member nodes
Although a cluster is formed equally, if it is long distance between a cluster head and nodes,
communication cost between two nodes is increased. And we measured the average hop
count of local cluster. As a result figure 24, Multi-hop has lower hop count value than
LEACH and Direct. This means that Multi-hop reduces the distance between a cluster head
and member nodes and communication cost of sensor nodes and a cluster head in local
cluster. So, Multi-hop can form a cluster that has the adaptive member nodes and reduce
energy consumption of whole sensor networks.
A Cluster Head Election Method for Equal Cluster Size in Wireless Sensor Network 185
Fig. 8. Average round time of nodes
Fig. 9 shows survival rate of nodes. Node alive rounds of proposed method are longer than
the method like LEACH. That means that LEACH cannot control to distribute overload of a
cluster head. As the proposed method considered unequal clustering, overload of a cluster
head, the nodes that used this method live longer than LEACH. As the round progresses,
we can know survival rate of the proposed method is higher than LEACH. Since the
percentage of alive nodes are 90%(0.9), the nodes of LEACH dramatically died than the
proposed method. When the alive rate is 10%(0.1), they died slowly as the remaining nodes
have few member nodes. Since 90%, the nodes of the proposed method, on the other hand,
died slowly than LEACH as distributing energy consumption.
Fig. 9. Node alive round
4.4 Analysis of the number of cluster member nodes
We measured the number of member nodes and hop count in local cluster. Each node is
chosen for a cluster head with equal probability. After cluster head election about 20 times,
one round comes to an end. We repeated this process 10 times. We gained the result of
average value and obtained the standard deviation of standard variation and clustering. The
lower standard deviation, the more equal a cluster forms.
Fig. 10. The standard deviation of member nodes
Fig. 10 shows the standard deviation (STDEV) of member nodes in local cluster. Above
figure, LEACH is higher than other algorithm. On the other hand, Direct(direct
communication) and Multi-hop(multi-hop communication) are lower than LEACH. In case
of the standard deviation of LEACH, experiments number 2, 7 and 16, a cluster is bad-case-
scenario. In bad-case, Direct and Multi-hop can reduce STDEV of member nodes. In
experiments number 3, 9 and 12, Direct is higher than LEACH. This means that Direct can
form unequal clustering, compared with cluster formation. In case of the proposed method
Multi-hop, it has little lower value than LEACH and Direct. Also, as shown in Fig. 11, Multi-
hop has the lowest average standard deviation value of member nodes. So, Multi-hop can
organize more equal cluster size than LEACH and Direct.
Fig. 11. The average standard deviation of member nodes
Although a cluster is formed equally, if it is long distance between a cluster head and nodes,
communication cost between two nodes is increased. And we measured the average hop
count of local cluster. As a result figure 24, Multi-hop has lower hop count value than
LEACH and Direct. This means that Multi-hop reduces the distance between a cluster head
and member nodes and communication cost of sensor nodes and a cluster head in local
cluster. So, Multi-hop can form a cluster that has the adaptive member nodes and reduce
energy consumption of whole sensor networks.
Smart Wireless Sensor Networks186
4.5 Finding optimal number of member nodes
We assume the number of optimal member nodes is (N/CHnum-1). We make an
experiment on the standard deviation per a local cluster and the energy consumption of
member nodes. In experiment, we configure the optimal member nodes as 5%~100% among
member nodes and measure the energy efficiency of a local cluster.
Fig. 12. Comparing with standard deviation of member nodes
Fig. 12 shows the standard deviation per a local cluster as increased the optimal number of
member nodes. If the optimal number is 0%, like the direct communication method, the
standard deviation value is zero because the optimal number is same. In case of the number
of member nodes between 5 and 20 percent, we can show the standard deviation per a
cluster is decreased. The low standard deviation value means more equal clustering and the
higher value means low equal clustering. And the low value can decrease the amount of
data packet.
Fig. 13. Energy consumption for clustering
Fig. 13 shows comparing 0% and 10%. The 10% has lower energy consumption than 0%. The
reason is as following. First reason is more permissible range. Second reason is more equal
member nodes. Third reason is less data packet. Fourth reason is energy distribution.
5. Conclusion
This thesis proposed new optimized clustering algorithm through cluster head selection
focused on reducing energy consumption of local clusters and overall networks. It elected
the cluster head among nodes which are possible for the cluster head and proved the energy
efficiency by comparing previous methods. It is performed by the network scalability and
energy consumption. To achieve this, we obtained the energy consumption in Intra-cluster
and Inter-cluster, and then we could find the average energy of overall network. Finally, we
proposed the re-electing cluster heads method for balancing local clusters. This method uses
the information which the cluster heads have. This information is the number of member
nodes and distance between the member nodes and the cluster head. Thus the new cluster
heads can be elected by this information.
Further works will be intended to compare and analyze the above the methods, and find the
optimization clustering algorithm. To achieve this, we have to perform the experiments
which are load balancing between member nodes and local clusters, and fault-tolerance in
Intra-cluster and Inter-cluster. For load balancing, we would calculate the number of
packets from nodes and the packet success ration of sensing data. And for fault-tolerance we
would measure the data delay time of sensing data and prove the strong connectivity,
which is an means of supplementing route path when the node failure. Through these
experiments, we will find the optimization clustering algorithm in WSNs.
6. References
Akyildiz, I.F.; W. Su, Y. Sankarasubramaniam, & E. Cayirci. (2002)."A Survey on Sensor
Networks", IEEE Communication Magazine, August 2002, pp. 102-114.
Ameer Ahmed Abbasi; Mohamed Younis. (2007). "a survey on clustering algorithms for
wireless sensor networks," Elsevier Journal of Computer Communications, 30 : 2826-
2841, 2007.
A. Wang; W. Heizelman, A. Chandrakasan. (1999). "Energy-scalable protocols for battery-
operated microsensor networks," Proceeding 1999 IEEE Workshop Singnal Processing
Systems (SiPS '99), pp. 483-492, Oct. 1999.
Choon-Sung Nam; Hee-Jin Jeong , Yiseok Jeong, Dong-Ryeol Shin. (2008). “Routing
Technique Based on Clustering for Data Duplication Prevention in Wireless Sensor
Networks”, Proceedings of International Ubiquitous Workshop, Jan. 2008.
Choon-Sung Nam; Hee-Jin Jeong, Dong-Ryeol Shin. (2008). “The Adaptive Cluster Head
Selection in Wireless Sensor Networks”, Proceedings of IEEE International Workshiop
on Semantic Computing and Applications, pp. 147-149, 2008.
Fernandess; D. Malkhi. (2002). "K-clustering in wireless ad hoc networks," Proceedings of the
2nd ACM international Workshop on Principles of Mobile Computing (POMC’02),
Toulouse, France, October 2002.
J. A. Gutierrez; M. Naeve, E. Callaway, M. Bourgeois, V. Mitter and B. Heile. (2001) “IEEE
802.15.4: A Developing Standard for Low-Power Low-Cost Wireless Personal Area
Networks,” IEEE Network Magazine, volume 15, Issue 5, September/October 2001,
pp.12-19
M. J. Handy; M. Haase, D. Timmermann. (2002). “Low Energy Adaptive Clustering
Hierarchy with Deterministic Cluster-Head Selection", Proceedings of IEEE, 2002.
A Cluster Head Election Method for Equal Cluster Size in Wireless Sensor Network 187
4.5 Finding optimal number of member nodes
We assume the number of optimal member nodes is (N/CHnum-1). We make an
experiment on the standard deviation per a local cluster and the energy consumption of
member nodes. In experiment, we configure the optimal member nodes as 5%~100% among
member nodes and measure the energy efficiency of a local cluster.
Fig. 12. Comparing with standard deviation of member nodes
Fig. 12 shows the standard deviation per a local cluster as increased the optimal number of
member nodes. If the optimal number is 0%, like the direct communication method, the
standard deviation value is zero because the optimal number is same. In case of the number
of member nodes between 5 and 20 percent, we can show the standard deviation per a
cluster is decreased. The low standard deviation value means more equal clustering and the
higher value means low equal clustering. And the low value can decrease the amount of
data packet.
Fig. 13. Energy consumption for clustering
Fig. 13 shows comparing 0% and 10%. The 10% has lower energy consumption than 0%. The
reason is as following. First reason is more permissible range. Second reason is more equal
member nodes. Third reason is less data packet. Fourth reason is energy distribution.
5. Conclusion
This thesis proposed new optimized clustering algorithm through cluster head selection
focused on reducing energy consumption of local clusters and overall networks. It elected
the cluster head among nodes which are possible for the cluster head and proved the energy
efficiency by comparing previous methods. It is performed by the network scalability and
energy consumption. To achieve this, we obtained the energy consumption in Intra-cluster
and Inter-cluster, and then we could find the average energy of overall network. Finally, we
proposed the re-electing cluster heads method for balancing local clusters. This method uses
the information which the cluster heads have. This information is the number of member
nodes and distance between the member nodes and the cluster head. Thus the new cluster
heads can be elected by this information.
Further works will be intended to compare and analyze the above the methods, and find the
optimization clustering algorithm. To achieve this, we have to perform the experiments
which are load balancing between member nodes and local clusters, and fault-tolerance in
Intra-cluster and Inter-cluster. For load balancing, we would calculate the number of
packets from nodes and the packet success ration of sensing data. And for fault-tolerance we
would measure the data delay time of sensing data and prove the strong connectivity,
which is an means of supplementing route path when the node failure. Through these
experiments, we will find the optimization clustering algorithm in WSNs.
6. References
Akyildiz, I.F.; W. Su, Y. Sankarasubramaniam, & E. Cayirci. (2002)."A Survey on Sensor
Networks", IEEE Communication Magazine, August 2002, pp. 102-114.
Ameer Ahmed Abbasi; Mohamed Younis. (2007). "a survey on clustering algorithms for
wireless sensor networks," Elsevier Journal of Computer Communications, 30 : 2826-
2841, 2007.
A. Wang; W. Heizelman, A. Chandrakasan. (1999). "Energy-scalable protocols for battery-
operated microsensor networks," Proceeding 1999 IEEE Workshop Singnal Processing
Systems (SiPS '99), pp. 483-492, Oct. 1999.
Choon-Sung Nam; Hee-Jin Jeong , Yiseok Jeong, Dong-Ryeol Shin. (2008). “Routing
Technique Based on Clustering for Data Duplication Prevention in Wireless Sensor
Networks”, Proceedings of International Ubiquitous Workshop, Jan. 2008.
Choon-Sung Nam; Hee-Jin Jeong, Dong-Ryeol Shin. (2008). “The Adaptive Cluster Head
Selection in Wireless Sensor Networks”, Proceedings of IEEE International Workshiop
on Semantic Computing and Applications, pp. 147-149, 2008.
Fernandess; D. Malkhi. (2002). "K-clustering in wireless ad hoc networks," Proceedings of the
2nd ACM international Workshop on Principles of Mobile Computing (POMC’02),
Toulouse, France, October 2002.
J. A. Gutierrez; M. Naeve, E. Callaway, M. Bourgeois, V. Mitter and B. Heile. (2001) “IEEE
802.15.4: A Developing Standard for Low-Power Low-Cost Wireless Personal Area
Networks,” IEEE Network Magazine, volume 15, Issue 5, September/October 2001,
pp.12-19
M. J. Handy; M. Haase, D. Timmermann. (2002). “Low Energy Adaptive Clustering
Hierarchy with Deterministic Cluster-Head Selection", Proceedings of IEEE, 2002.
Smart Wireless Sensor Networks188
M. Tubaishat; S. Madria. (2003). "Sensor Networks: An Overview," Proceedings of IEE
Potentials, April/May 2003.
Noseong Park; Daeyoung Kim, Yoonmee Doh, Sangsoo Lee, Ji-tae Kim. (2005). “An Optimal
and Lightweight Routing for Minimum Energy Consumption in Wireless Sensor
Networks,” Proceedings of IEEE RTSCA 2005, August 2005.
O. Younis; S. Fahmy. (2004). "HEED: A Hybrid, Energy-Efficient, Distributed clustering
approach for Ad Hoc sensor networks," IEEE Transactios on Mobile Computing3(4),
pp 366–379, 2004.
P. Agarwal; C. Procopiuc. (1999). "Exact and approximation algorithms for clustering,"
Proceedings of 9th Annu, ACM-SIAM Symposium of Discrete Algorithms, pp. 658-
667, Jan. 1999.
S. Toumpis; A.J. Goldsmith. (2003). “Capacity regions for wireless ad hoc networks”,
Wireless Communications, IEEE Transactions, Volume 2, Issue 4, Jul 2003 Page(s):
736-748
Sohrabi K.; Gao J.m Ailawadhi V., Pottie G.J. (2000). "Protocols for self-organization of a
wirless sensor network," Personal Communications IEEE, Vol. 7 Issue 5, pp. 16-27,
October 2000.
T. Murata; H.Ishibuchi. (1994) "Performance evaluation of genetic algorithms for flowshop
scheduling problems", Proceedings of 1st IEEE conference Evolutionary Computation,
vol. 2, pp. 812-817, June. 1994.
T. Rappaport; (1996). "Wireless Communiations," Principles & Practice. Englewood Cliffs, NJ:
Prentice-Hall, 1996.
Wendi B. Heinzelman; Anantha P. Chandrakasan, Hari Balakrishnan. (2002). “An
Application-Specific Protocol Architecture for Wireless Microsensor Networks”,
IEEE Transactios On Wireless Communications, Vol. 1, No. 4, October 2002.
Wendy Rabiner Heinzelman; Anantha Chandrakasan, Hari Balakrishnan. (2000) "Energy-
Efficient Communication Protocol for Wireless Microsensor Networks", Proceedings
of the Hawaii International Conference on System Sciences, January 2000.
Optimizing Coverage in 3D Wireless Sensor Networks 189
Optimizing Coverage in 3D Wireless Sensor Networks
Nauman Aslam
X
Optimizing Coverage in 3D
Wireless Sensor Networks
Nauman Aslam
Department of Engineering Mathematics and Internetworking
Dalhousie University, Halifax, Nova Scotia
Canada, B3J-1Z1
1. Introduction
Recent advances in electronic miniaturization, software engineering and wireless
communication technologies have enabled the deployment of low-power sensor nodes that
are equipped with an embedded processing unit, memory, power-supply, on-board sensor,
radio communication facilities (I. F. Akyildiz, W. Su et al. 2002). An important characteristic
of sensor nodes is their ability to sense specific phenomena in a target field and send their
data to a central node, called the Base Station/sink, possibly through multihop wireless
communication links. Since most data gathering applications are concerned with collection
of physical data that is generated in the target area monitored by sensor nodes, therefore
coverage becomes a core meaure of performance. A fundamental issue in coverage is the
quality of monitoring provided by the network. This quality is usually measured by how
well deployed sensors cover a target area. In its simplest form, 1-coverage means that every
point inthe target area is monitored at least one sensor. In recent years, the problem of
providing sensor coverage has received extensive attention from the research community in
the context of 2D sensor networks (Xing, Wang et al. 2005; Zhang and Hou 2005; Bai, Kumar
et al. 2006). However, most of the real world sensor network deployments often a follow 3D
model. Examples of such deployments are environmental monitoring in forests
(Mainwaring, Culler et al. 2002; Szewczyk, Osterweil et al. 2004) where sensor nodes are
deployed on trees of different heights in a forest, structural health monitoring of multi-
storey buildings (Kim, Pakzad et al. 2006; Lynch and Loh 2006) and underwater
surveillance networks (Akyildiz, Pompili et al. 2005). In most cases such deployments follow
a model where sensor nodes are placed in large quantities over a target region. Excessive
deployment of sensor nodes is often desirable to protect the network from individual node
failures. However keeping in mind the energy and bandwidth constraints for most
applications, the coverage control problem translates to choosing a set of active nodes that
ensure that the target region is sufficiently monitored.
Considering the fact that sensors are deployed to interact with the physical phenomenon to
gather data, coverage becomes one of the fundamental measures to gauge the service
quality provided by the network to the application. Different applications may have
11
Smart Wireless Sensor Networks190
different requirements for coverage. Applications such as forest monitoring, or underwater
sensor networks may requires every point in the deployment region to be monitored. This
problem is referred to as the area coverage problem (Cardei and Wu 2006). Applications
such as intrusion detection may require only coverage of specific points (hot spots) in the
deployment region. Thus the solution to the coverage control problem is addressed in the
context of application requirements. Another crucial aspect of WSN applications is
connectivity that can be defined as the ability of sensor nodes to communicate directly or
indirectly with any other active node. Typical deployments of WSNs assume sensor nodes
communicate with their neighbors to forward the collected data to the sink. Without
connectivity, the sensor nodes cannot forward the collected data to the base station thus
hampering the quality of monitoring application.
Deployment and configuration of sensor networks to ensure the desired level of
connectivity and coverage is fundamentally more challenging in 3D as compared to 2D
(Poduri, Pattem et al. 2006). For the 3D case this chapter addresses the following problem:
“Given the nodes are randomly dispersed in a target region, how to find a set of nodes such that each
point in the deployment region is covered by at least one node and that the nodes are connected”.
This problem is different than finding a placement strategy in a region for full coverage,
which can be solved by (Iyengar, Kar et al. 2005). It has been shown that the problem of
finding a minimum set of sensors from an already deployed set is NP-hard (Yang, Dai et al.
2006). We propose an efficient algorithm that results in a connected topology in 3D while
maximizing the coverage. A key feature of the algorithm is that it can be implemented in a
distributed manner. Sensor nodes executing this algorithm exchange messages that are
based on local information. By using the information embedded in these messages, a set of
active nodes is selected such that the whole sensing region is covered. We show that the
number of nodes in the active set produced by the algorithm depends on the sensing range.
Considering the fact that the sensing range is an application dependent parameter, we
derive a mathematical relation that is used to calculate the sensing range for the given input
parameters (required coverage fraction, monitoring area and number of nodes). These
calculated values provide a baseline for selecting appropriate thresholds to be used in the
simulations. While the focus of this chapter remains on describing design, implementation
and performance results of the proposed algorithm, we also provide insight and critical
analysis of different factors effecting coverage in 3D Sensor networks. Further a detailed
literature review on the related research is also provided in this chapter.
The rest of the chapter is organized as follows. Section 2 presents related work in the areas
of 3D coverage schemes. Section 3 presents our system model, assumptions and
preliminaries. Section 4 presents the description of our proposed distributed 3D coverage
algorithm. Simulation results and analysis are presented in Section 5. Our main conclusions
and directions for future research are presented in Section 6.
2. Related Work
Recently, a few researchers have investigated coverage and connectivity in 3D sensor
networks. In (Poduri, Pattem et al. 2006) Poduri et al. highlight some of the challenges in
designing algorithms for 3D and discussedpossible extensions of existing 2D designs for the
deployment and configuration to 3D design. Research in (Alam and Haas 2006) provides a
solution for the coverage and connectivity problem in a 3D underwater sensor network. The
authors focused on coverage and connectivity issues of three-dimensional networks, where
all the node have the same sensing range and the same transmission range. In particular,
they addressed two questions. One, what is is the best way to place the nodes in three-
dimension such that the number of nodes required for surveillance of a 3D space is
minimized, while guaranteeing 100% coverage? Two, What should be the minimum ratio of
the transmission range and the sensing range of such a placement strategy? By Using
Kelvin’s conjecture, they showed that the truncated octahedral tessellation of 3D space is the
most plausible solution for this problem. A sphere based communication and sensing model
is used to solve the node placement problem by using a truncated octahedron-based
tessellation. In contrast, our work is focused on finding a solution for coverage and
connectivity for a random deployment in 3D.
Andersen et. Al (Andersen and Tirthapura 2009) presesnted a scheme to optimize sensor
deployemnt in presence of constraints such as senor locations and non-uniform sensing
regions for the 3D WSNs. The sensor deployemnt problem orginally modeled as continous
optimzation was sloved using the discrete optimization method to minimize the number of
sensor deployed in the target region. The proposed technique reduces the continous
optimization to a discrete optimization problem.
In another work (Cayirci, Tezcan et al. 2006) related to underwater sensor networks a
distributed 3D space coverage scheme is proposed. This scheme assumes that the sensor
nodes are deployed randomly and their x, and y coordinates remain fixed, however depth (z
coordinate) can be manipulated. The scheme finds an appropriate depth for each sensor
such that maximum coverage in 3D is maintained.
F. Chen et. al. (Chen, Jiang et al. 2008) proposed a probability based K-coverage approach
for 3D WSNs. The goal is to cover the entire deployment region using at least K sensors with
a certain probability 'T'. A grid distribution and a greedy heuristic are used to determine the
optimal placement.
Huang et. al. (Huang, Tseng et al. 2004) investigated the coverage problem as a decision
problem where the goal is to determine whether every point in the service area is covered
by at least k sensors, where k is a given parameter. They proposed a polynomial time
algorithm which can be executed in either a centralized or distributed manner. Each
participating sensor node collects how its neighboring sensors intersect with its spherical
sensing range and calculates the corresponding spherical caps which are used to determine
the level of circle’s coverage.
3. Network Model and Assumptions
In this section we provide description about the network model and assumptions used in
our distributed coverage algorithm.
Optimizing Coverage in 3D Wireless Sensor Networks 191
different requirements for coverage. Applications such as forest monitoring, or underwater
sensor networks may requires every point in the deployment region to be monitored. This
problem is referred to as the area coverage problem (Cardei and Wu 2006). Applications
such as intrusion detection may require only coverage of specific points (hot spots) in the
deployment region. Thus the solution to the coverage control problem is addressed in the
context of application requirements. Another crucial aspect of WSN applications is
connectivity that can be defined as the ability of sensor nodes to communicate directly or
indirectly with any other active node. Typical deployments of WSNs assume sensor nodes
communicate with their neighbors to forward the collected data to the sink. Without
connectivity, the sensor nodes cannot forward the collected data to the base station thus
hampering the quality of monitoring application.
Deployment and configuration of sensor networks to ensure the desired level of
connectivity and coverage is fundamentally more challenging in 3D as compared to 2D
(Poduri, Pattem et al. 2006). For the 3D case this chapter addresses the following problem:
“Given the nodes are randomly dispersed in a target region, how to find a set of nodes such that each
point in the deployment region is covered by at least one node and that the nodes are connected”.
This problem is different than finding a placement strategy in a region for full coverage,
which can be solved by (Iyengar, Kar et al. 2005). It has been shown that the problem of
finding a minimum set of sensors from an already deployed set is NP-hard (Yang, Dai et al.
2006). We propose an efficient algorithm that results in a connected topology in 3D while
maximizing the coverage. A key feature of the algorithm is that it can be implemented in a
distributed manner. Sensor nodes executing this algorithm exchange messages that are
based on local information. By using the information embedded in these messages, a set of
active nodes is selected such that the whole sensing region is covered. We show that the
number of nodes in the active set produced by the algorithm depends on the sensing range.
Considering the fact that the sensing range is an application dependent parameter, we
derive a mathematical relation that is used to calculate the sensing range for the given input
parameters (required coverage fraction, monitoring area and number of nodes). These
calculated values provide a baseline for selecting appropriate thresholds to be used in the
simulations. While the focus of this chapter remains on describing design, implementation
and performance results of the proposed algorithm, we also provide insight and critical
analysis of different factors effecting coverage in 3D Sensor networks. Further a detailed
literature review on the related research is also provided in this chapter.
The rest of the chapter is organized as follows. Section 2 presents related work in the areas
of 3D coverage schemes. Section 3 presents our system model, assumptions and
preliminaries. Section 4 presents the description of our proposed distributed 3D coverage
algorithm. Simulation results and analysis are presented in Section 5. Our main conclusions
and directions for future research are presented in Section 6.
2. Related Work
Recently, a few researchers have investigated coverage and connectivity in 3D sensor
networks. In (Poduri, Pattem et al. 2006) Poduri et al. highlight some of the challenges in
designing algorithms for 3D and discussedpossible extensions of existing 2D designs for the
deployment and configuration to 3D design. Research in (Alam and Haas 2006) provides a
solution for the coverage and connectivity problem in a 3D underwater sensor network. The
authors focused on coverage and connectivity issues of three-dimensional networks, where
all the node have the same sensing range and the same transmission range. In particular,
they addressed two questions. One, what is is the best way to place the nodes in three-
dimension such that the number of nodes required for surveillance of a 3D space is
minimized, while guaranteeing 100% coverage? Two, What should be the minimum ratio of
the transmission range and the sensing range of such a placement strategy? By Using
Kelvin’s conjecture, they showed that the truncated octahedral tessellation of 3D space is the
most plausible solution for this problem. A sphere based communication and sensing model
is used to solve the node placement problem by using a truncated octahedron-based
tessellation. In contrast, our work is focused on finding a solution for coverage and
connectivity for a random deployment in 3D.
Andersen et. Al (Andersen and Tirthapura 2009) presesnted a scheme to optimize sensor
deployemnt in presence of constraints such as senor locations and non-uniform sensing
regions for the 3D WSNs. The sensor deployemnt problem orginally modeled as continous
optimzation was sloved using the discrete optimization method to minimize the number of
sensor deployed in the target region. The proposed technique reduces the continous
optimization to a discrete optimization problem.
In another work (Cayirci, Tezcan et al. 2006) related to underwater sensor networks a
distributed 3D space coverage scheme is proposed. This scheme assumes that the sensor
nodes are deployed randomly and their x, and y coordinates remain fixed, however depth (z
coordinate) can be manipulated. The scheme finds an appropriate depth for each sensor
such that maximum coverage in 3D is maintained.
F. Chen et. al. (Chen, Jiang et al. 2008) proposed a probability based K-coverage approach
for 3D WSNs. The goal is to cover the entire deployment region using at least K sensors with
a certain probability 'T'. A grid distribution and a greedy heuristic are used to determine the
optimal placement.
Huang et. al. (Huang, Tseng et al. 2004) investigated the coverage problem as a decision
problem where the goal is to determine whether every point in the service area is covered
by at least k sensors, where k is a given parameter. They proposed a polynomial time
algorithm which can be executed in either a centralized or distributed manner. Each
participating sensor node collects how its neighboring sensors intersect with its spherical
sensing range and calculates the corresponding spherical caps which are used to determine
the level of circle’s coverage.
3. Network Model and Assumptions
In this section we provide description about the network model and assumptions used in
our distributed coverage algorithm.
Smart Wireless Sensor Networks192
1. Communication Range: A sphere based communication ranged is assumed where each
active sensor has a communication range of
. For reliable communication the distance
between two active sensor is required to be less than or equal to
.
2. Sensing Region: The sphere based sensing region
of a sensor
located at point
is the collection of all points where a target
is reliably
detected by sensor
.
3. Similar to (Liu and Towsley 2004), a Boolean sensing model is used. A sensor
is only
able to detect events of interest within its sensing region
. Given the sensing radius
from
, the output of the Boolean model can be described as;
(1)
Where
denotes the position of the sensor,
denotes the location of a target
and
specifies the Euclidean distance between the target and the sensor.
In line with the findings in (Zhang and Hou 2005), we assume that the communication
range
is
. We also assume that sensor nodes are capable of transmitting at
various power level.
4. Sensor nodes are randomly dispersed over a three dimensional geographical region
following a uniform distribution.
5. All sensor nodes are homogeneous in terms of energy, communication, and processing
capabilities.
6. We assume that the sensor nodes are capable of switching between sleep and active
modes. Most commercially available platform such as IRSI motes (MEMSIC 2011),
TelosB (MEMSIC 2011), TMote Sky support features such as auto suspend, wake, and
sleep mode that are used to minimize the sensor node's energy consumption.
7. All sensor nodes are location unaware i.e. they are not equipped with a GPS device.
8. The energy model presented in (Heinzelman, Chandrakasan et al. 2002) is adopted
here. The amount of energy consumed for transmission
is of an l-bit message over
a distance d is given by;
2
4
. . . for 0
. . . for
elect fs crossover
Tx
elect mp crossover
l E l d d d
E
l E l d d d
(2)
Where
elect
E is the amount of energy consumed in electronics,
f
s
is the energy consumed
in an amplifier when transmitting at a distance shorter than
crossover
d , and
mp
is the
amplifier energy consumed in an amplifier when transmitting at a distance greater than
crossover
d .
The energy expended in receiving an l-bit message is given by,
electRx
lEE
(3)
4. Distributed Coverage Algorithm
This Section provides details of our Distributed Coverage Algorithm. The main objective of
this algorithm is to select a set of sensor nodes such that each point of interest in the
monitoring region is covered by at least one sensor node. Figure 1 describe the flowchart for
DCA and its explanation is articulated in the following paragraph.
The algorithm consists of three main procedures. In the first procedure, when sensor nodes
boot (immediately after deployment in the monitoring region) the initial network discovery
process begins. The intial state of all sensor nodes in taken as ‘Plain Nodes’. At this point
sensor nodes broadcast a 'Hello' message using a tansmission radius equal to ݎ
. A timer
‘T1’is started locally inside each sensor node. The timer ‘T1’ ensures that sensor nodes have
enough time to complete the neighborhood discovery process by receiving 'Hello' messages
from other sensor nodes that are within their communication range. When timer ‘T1’
expires, each node compiles a list of its one-hop neighbors. Each node then calculates a
probability (referred to here as ‘Active Probability’) by simply generating a random value
between 0 and 1 to become an ‘Active Candidate’. In the next procedure, each node compares
its ‘Active Probability’ to a pre-defined value . If the computed value of ‘Active Probability’ is
less than , it changes its status to ‘Active Candidate’ and broadcasts an announcement
message to its neighbors within range ݎ
௦
. The announcement message contains the value of
its computed probability. Again the timer ‘T2’ is used here to ensure that an ‘Active
Candidate’ is able to successfully receive announcement messages from other active
candidates in its neighborhood. When the timer expires a list of active candidate messages
(ACM) is build using information such as node id and ‘Active Probability’. The ACM is sorted
with respect to ‘Active Probability’ in decreasing order. If the entry and the head of ACM has
a value lower than the node’s computed probability, the sensor node changes its status to
Ԣܨ݈݅݊ܽActive’ and broadcasts a notification message. Any ties are broken in favor of the
sensor node with higher node id. In the final procedure, all nodes check if they received
‘Final Active’ message. Any node that did not receive this message changes its status to
become ‘Final Active’ for the current round.
Optimizing Coverage in 3D Wireless Sensor Networks 193
1. Communication Range: A sphere based communication ranged is assumed where each
active sensor has a communication range of
. For reliable communication the distance
between two active sensor is required to be less than or equal to
.
2. Sensing Region: The sphere based sensing region
of a sensor
located at point
is the collection of all points where a target
is reliably
detected by sensor
.
3. Similar to (Liu and Towsley 2004), a Boolean sensing model is used. A sensor
is only
able to detect events of interest within its sensing region
. Given the sensing radius
from
, the output of the Boolean model can be described as;
(1)
Where
denotes the position of the sensor,
denotes the location of a target
and
specifies the Euclidean distance between the target and the sensor.
In line with the findings in (Zhang and Hou 2005), we assume that the communication
range
is
. We also assume that sensor nodes are capable of transmitting at
various power level.
4. Sensor nodes are randomly dispersed over a three dimensional geographical region
following a uniform distribution.
5. All sensor nodes are homogeneous in terms of energy, communication, and processing
capabilities.
6. We assume that the sensor nodes are capable of switching between sleep and active
modes. Most commercially available platform such as IRSI motes (MEMSIC 2011),
TelosB (MEMSIC 2011), TMote Sky support features such as auto suspend, wake, and
sleep mode that are used to minimize the sensor node's energy consumption.
7. All sensor nodes are location unaware i.e. they are not equipped with a GPS device.
8. The energy model presented in (Heinzelman, Chandrakasan et al. 2002) is adopted
here. The amount of energy consumed for transmission
is of an l-bit message over
a distance d is given by;
2
4
. . . for 0
. . . for
elect fs crossover
Tx
elect mp crossover
l E l d d d
E
l E l d d d
(2)
Where
elect
E is the amount of energy consumed in electronics,
f
s
is the energy consumed
in an amplifier when transmitting at a distance shorter than
crossover
d , and
mp
is the
amplifier energy consumed in an amplifier when transmitting at a distance greater than
crossover
d .
The energy expended in receiving an l-bit message is given by,
electRx
lEE
(3)
4. Distributed Coverage Algorithm
This Section provides details of our Distributed Coverage Algorithm. The main objective of
this algorithm is to select a set of sensor nodes such that each point of interest in the
monitoring region is covered by at least one sensor node. Figure 1 describe the flowchart for
DCA and its explanation is articulated in the following paragraph.
The algorithm consists of three main procedures. In the first procedure, when sensor nodes
boot (immediately after deployment in the monitoring region) the initial network discovery
process begins. The intial state of all sensor nodes in taken as ‘Plain Nodes’. At this point
sensor nodes broadcast a 'Hello' message using a tansmission radius equal to ݎ
. A timer
‘T1’is started locally inside each sensor node. The timer ‘T1’ ensures that sensor nodes have
enough time to complete the neighborhood discovery process by receiving 'Hello' messages
from other sensor nodes that are within their communication range. When timer ‘T1’
expires, each node compiles a list of its one-hop neighbors. Each node then calculates a
probability (referred to here as ‘Active Probability’) by simply generating a random value
between 0 and 1 to become an ‘Active Candidate’. In the next procedure, each node compares
its ‘Active Probability’ to a pre-defined value . If the computed value of ‘Active Probability’ is
less than , it changes its status to ‘Active Candidate’ and broadcasts an announcement
message to its neighbors within range ݎ
௦
. The announcement message contains the value of
its computed probability. Again the timer ‘T2’ is used here to ensure that an ‘Active
Candidate’ is able to successfully receive announcement messages from other active
candidates in its neighborhood. When the timer expires a list of active candidate messages
(ACM) is build using information such as node id and ‘Active Probability’. The ACM is sorted
with respect to ‘Active Probability’ in decreasing order. If the entry and the head of ACM has
a value lower than the node’s computed probability, the sensor node changes its status to
Ԣܨ݈݅݊ܽActive’ and broadcasts a notification message. Any ties are broken in favor of the
sensor node with higher node id. In the final procedure, all nodes check if they received
‘Final Active’ message. Any node that did not receive this message changes its status to
become ‘Final Active’ for the current round.