Advances in Lasers and Electro Optics Part 3 pdf
Bạn đang xem bản rút gọn của tài liệu. Xem và tải ngay bản đầy đủ của tài liệu tại đây (4.36 MB, 50 trang )
Semiconductor Ridge Microcavities Generating Counterpropagating Entangled Photons
87
stands for hermitian conjugate term. The integration is performed over the interaction
volume which, in our case, is the illuminated portion of the waveguide.
The suitability of a photon pair source for a given quantum optics application largely
depends on the joint spectral intensity (JSI) of the generated photons, S(ω
s
, ω
i
), defined as the
probability that the signal (idler) photon frequency is
ω
s
, (
ω
i
). In the following we make
explicit the link between the JSI and the characteristics of the pump beam in order to clarify
the physical parameters that can be used to tailor the two-photon state.
A classical pump field on the air side of the air/semiconductor interface is given by:
()sin()
(,) ( ) ()
ik z t
p
Ezt dE Aze
ωθωω
ωω
−
⎡
⎤
⎣
⎦
=
∫
(5)
where we have neglected the pump variation along the y axis.
In this expression: the spatial profile A(z) can be engineered through linear optics;
ω
E()
is the
spectral distribution, characterized by a center frequency
ω
p
and a bandwidth
σ
p
;
θ
(
ω
) is the
angle of incidence of the
ω
component of the field, which can be engineered through a
dispersive element, such as a quartz wedge or a diffraction grating.
Following the derivation of (Grice et al., 2001) and assuming incident signal and idler fields
in the vacuum states, the first-order perturbation solution of the Schrödinger equation using
Equation 4 gives the generated two photon state:
ˆˆ
(,)()()
si sissi i
ddf a a vac
ψωωωωωω
++
=∝
∫∫
(6)
Here
ˆ
s
a
+
and
ˆ
i
a
+
are the photon creation operators for the signal and idler beams, and the
probability amplitude f(
ω
s
,
ω
i
) is given by:
(,) ( )(,)
ωω ω ω
φ
ωω
∝+
s
isisi
fE
(7)
with the phase-matching function:
(,)
(2)
(,) ()()
si
ik z
si eff
dz z A z e
ωω
φω ω χ
Δ
=
∫
(8)
(,) ( )sin( ) () ()
s
isi sissii
kk
ωω ω ω θω ω
β
ω
β
ω
Δ=+ +−+
being the z component of the wave
vector mismatch, and
β
s,i
(
ω
) the effective propagation constant of the signal and idler photon
respectively.
As the JSI is related to the two-photon probability amplitude by the simple relation
2
(,) (,)
si si
Sf
ωω ωω
= , it is clear that the pump beam characteristics are a useful means to
control the JSI.
The possibilities to tailor the JSI offered by the counterpropagating geometry are numerous
and a complete review is beyond the scope of this chapter; let us focus here on some simple
examples of pump-beam shaping that are sufficient to provide a large class of JSI. In
particular we will show that the pump spectral profile can be used as the only parameter to
generate generalized frequency-correlated states. Different techniques and geometries have
been reported in the purpose of generating frequency-uncorrelated photon pairs in guided-
wave co-propagating schemes. All these techniques require to fulfil particular conditions on
group-velocity matching and hence on material dispersion. Here we show that there is no
need for such requirements for our source: frequency uncorrelated, as well as frequency
Advances in Lasers and Electro Optics
88
correlated and anti-correlated states, are easily obtained by properly choosing the pump
pulse duration.
In order to investigate a feasible experimental situation, let us consider a Gaussian spectral
pump distribution:
2
() exp
p
p
E
ωω
ω
σ
⎡
⎤
⎛⎞
−
⎢
⎥
∝−
⎜⎟
⎜⎟
⎢
⎥
⎝⎠
⎣
⎦
(9)
Moreover, let us assume a uniform profile of the pump field along the waveguide, and a
fixed angle of incidence
θ
(independent of the pump frequency components). Under these
conditions, we obtain:
()
2
(,) exp ,
si p
s
isi
p
f
ωωω
ωω
φ
ωω
σ
⎡⎤
⎛⎞
+−
⎢⎥
∝−
⎜⎟
⎜⎟
⎢⎥
⎝⎠
⎣⎦
(10)
with
() () ()
,sinc (,)exp (,)
22
si si si
LL
kik
φω ω ω ω ω ω
⎛⎞⎛ ⎞
=Δ −Δ
⎜⎟⎜ ⎟
⎝⎠⎝ ⎠
(11)
The probability amplitude of the two-photon state is thus the product of two functions: one
depending on the pump spectral properties, and the other, the phase matching function
,
φ
on the spatial pump properties. In the following we will consider a perfect phase matching
situation with
0
s
ω
and
0
i
ω
be the signal and idler frequencies. The elimination of frequency
correlations can easily be shown if we approximate the
sinc( / 2)x function by the Gaussian
2
exp( )
x
γ
− , with
0.0482
γ
=
(this value of
γ
is chosen to obtain the same width at half
maximum for the two functions). By introducing the reciprocal group velocities:
0
,
,
,
()
'
s
i
si
si
d
d
ωω
βω
β
ω
=
=
and
() 1
'
p
k
k
dc
ωω
ω
ω
=
==
(12)
and performing a first-order development of the phase-matching function we obtain for the
joint spectral density:
02 2 2
2
02 2 2
2
00 2
2
1
( , ) exp 2( ) ( 'sin ' )
1
exp 2( ) ( 'sin ' )
1
exp 4( )( ) ( 'sin ' )( 'sin ' )
si s s s
p
ii i
p
ssii s i
p
SLk
Lk
Lk k
ωω ω ω γ θ β
σ
ωω γ θβ
σ
ωωωω γ θβ θβ
σ
⎡⎤
⎛⎞
⎢⎥
∝−− + −
⎜⎟
⎜⎟
⎢⎥
⎝⎠
⎣⎦
⎡⎤
⎛⎞
⎢⎥
×−− + +
⎜⎟
⎜⎟
⎢⎥
⎝⎠
⎣⎦
⎡
⎛⎞
×−− − + − +
⎜⎟
⎜⎟
⎝⎠
⎣
⎤
⎢
⎥
⎢
⎥
⎦
(13)
In this expression the condition:
2
2
1
('sin ')('sin ') 0
si
Lk k
γθβθβ
σ
+− += (14)
Semiconductor Ridge Microcavities Generating Counterpropagating Entangled Photons
89
allows the factorization of the JSI and thus the generation of a frequency-uncorrelated state.
We notice that this condition can always be fulfilled in our geometry by a proper choice of
the pump pulse duration, Figure 3 reports numerical simulations of the JSI obtained for
three different sets of waveguide lengths and pump pulse durations. In a 2D representation
with signal and idler frequency as coordinates, the JSI level curves of ideal frequency
correlated and anti-correlated states are segments parallel to the
ω
s
+
ω
i
and
ω
s
-
ω
i
directions
respectively. When the correlation is not perfect, these segments become ellipses, the higher
the degree of correlation the higher the eccentricity. The JSI level curves of uncorrelated
frequency states are ellipses with axes in the
ω
s
and
ω
i
directions; in this case the JSI can be
factorized as a product of independent probabilities for the signal and idler photons,
(,) ()()
s
isi
Spp
ωω ω ω
= : the measurement of the frequency of one of the emitted photons
does not yield any information about the frequency of the other one.
The ellipse in Figure 3 (left) represents a state with frequency anti-correlation: the length of
its major axis is set by the phase matching function, which depends on the waveguide
length L. The anticorrelation can readily be maximized as the ellipse minor axis is made
arbitrarily small by increasing the pump pulse duration ( 0
σ
→ ).
A frequency correlated state is depicted in Figure 3 (centre): here the length of the major axis
is set by the pump pulse duration, whereas that of the minor axis depends on the phase-
matching function and can be reduced by increasing the waveguide length. It is worth
noting that the counterpropagating geometry allows an easy generation of such a state
thanks to the sharply peaked phase-matching versus
ω
s
-
ω
i
. We stress that alternative
geometries require more stringent conditions, on either group velocities or other pump
properties (extended phase matching (Giovannetti et al., 2002), achromatic phase matching
(Torres et al., 2005)).
Finally a frequency uncorrelated case is shown in Figure 3 (right). Here
σ
and L have been
chosen to equal the major and minor axes length of the ellipse. The JSI appears as a circle
and is a special case of frequency uncorrelated state with equal individual bandwidth of the
generated photons.
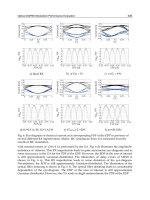
Fig. 3. Two-dimensional representation of the two-photon joint spectral intensity for three
pumping configurations. Here L is the waveguide length (completely illuminated) and
τ the
pulse duration of the pump beam: (a) L=0,22 mm and
τ=11 ps (b) L=1,1 mm and τ= 2.2 ps,
(c) L=0.5 mm and
τ= 5 ps. These configurations correspond to an anti-correlated, correlated
and uncorrelated state, respectively.
Advances in Lasers and Electro Optics
90
In order to quantify the separability of the generated state one has to perform a Schmidt
decomposition (Law et al., 2000) of the two-photon probability amplitude f(
ω
s
,
ω
i
), i.e. a basis
transformation into a set of orthonormal Schmidt modes
{ψ
n
,
ϕ
n
}
.
The function f is then expressed as:
() ()()
,
s
innsni
n
f
ωω λ
ψ
ω
ϕ
ω
=
∑
(15)
where
λ
n
,
ϕ
n
,
ψ
n
are solutions of the eigenvalue problem:
()() () ()
*
,,
s
nnns
ffd d
ωω ωω ω
ψ
ωωλ
ψ
ω
′′ ′ ′′ ′′ ′ ′
=
∫∫
(16)
()() () ()
*
,,
innni
ffd d
ωω ωω ω
ϕ
ωωλ
ϕ
ω
′′ ′′ ′ ′′ ′ ′
=
∫∫
(17)
with
1
n
λ
=
∑
(18)
If the sum in expression (15) has a unique term, f is factorizable and the photons of the pair
are not entangled. If the sum in expression (15) contains a large number of terms the state of
the pair is strongly entangled. The measure of the correlation degree is provided by the
entropy S:
()
2
1
log
N
nn
n
S
λλ
=
=−
∑
(19)
where N is the number of Schmidt modes used in the decomposition. S is equal to zero for a
non entangled state and is the more important the more the state is entangled. To give an
example, Figure 4 reports the Schmidt decomposition of a frequency correlated and a
frequency anti-correlated state.
Fig. 4. Schmidt decomposition for a frequency anti-correlated and a frequency correlated
mode. L is the length of the guide (completely illuminated) and Δλ
p
the spectral width of the
pump beam.
Semiconductor Ridge Microcavities Generating Counterpropagating Entangled Photons
91
The relative simplicity of frequency entanglement control by a suitable choice of the pump
bandwidth is peculiar of the counterpropagating geometry. Further theoretical
developments have been made towards the generation of photon pairs with arbitrary joint
spectrum (Walton et al., 2004; Perina, 2008). In particular, a more refined shaping of the
pump beam using achromatic phase matching (i.e. allowing the angle
θ
to vary with ω) has
been shown to generate uncorrelated twin photons with independent spectral bandwidth
(Walton et al., 2004).
4. Experimental results
4.1 Surface emitted second harmonic generation
A practical mean to characterize the efficiency enhancement due to the integration of a
vertical microcavity for the pump beam is Surface Emitted Second Harmonic Generation
(SESHG) (Caillet et al., 2009). SESHG, which was first demonstrated in 1979 (Normandin &
Stegeman, 1979), is the reverse of SPDC at degeneracy (
ω
s
=
ω
i
=
ω
p
/2): the non-linear overlap
of two counterpropagating modes yields a second harmonic field radiating from the upper
surface of the waveguide. Because of its intrinsic higher produced signal, this interaction is
well suited to provide a characterization of the effect of the added vertical microcavity and a
quantitative estimation of the parametric gain.
The sample resulted by our numerical simulations was grown by metal organic chemical
vapor deposition on (100) GaAs substrate. The planar structure was then chemically etched
to create 2.5-3.5
μm-thick ridges with 6-9 μm widths. The epitaxial structure consists in 4.5
period Al
0.25
Ga
0.75
As/ Al
0.80
Ga
0.20
As QPM waveguide core, 41-period asymmetrical
Al
0.25
Ga
0.75
As/ Al
0.80
Ga
0.20
As DBR (serving as lower cladding + back mirror) and 18-period
asymmetrical Al
0.25
Ga
0.75
As/ Al
0.80
Ga
0.20
As DBR (serving as upper cladding + top mirror).
Figure 5 reports the tuning curves calculated on the nominal structure.
Fig. 5. Calculated tuning curves as a function of the pump incident angle for a pump
wavelength of 775 nm.
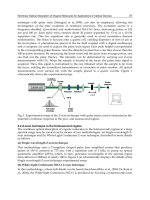
The SESHG measurements were performed employing one end-fire coupled fundamental
frequency (FF) beam relying on Fresnel reflection at the opposite facet to obtain back
propagating modes (see Fig. 6).
Advances in Lasers and Electro Optics
92
Fig. 6. Scheme of SESHG set up. TE and TM modes are end-fire excited through the same
input facet, relying on their Fresnel reflection at the opposite facet. By doing so, two
nonlinear processes occur: the interaction of the TE mode with the reflected part of the TM
one, and the interaction of the TM mode with the reflected part of the TE one. This
symmetric configuration results in the generation of two second harmonic waves of
comparable amplitudes, which radiate with angles
θ and –θ, respectively: an interference
pattern can thus be observed at the waveguide surface.
The fundamental frequency was linearly polarized at 45° relative to the substrate so that the
input power was equally divided between TE and TM eigenfields. The input beam was
supplied by an external-cavity cw tunable laser beam, amplified with an Er
3+
-doped fiber.
The SH field was acquired with an optical system mounted over the waveguide,
perpendicularly to its plane. This consists of a CCD camera Bosch LTC 0335/50 1/3 inch
format 512×582 pixels and an Edmund video lens trinocular VZM microscope for near field
acquisition. In order to study the dependence of SESHG power vs the FF power, the
generated signal was measured with a large area Si photodiode plus a lock-in synchronous
detection.
The near-field image of the SH field obtained for a FF injected at 1.565
μm is shown in
Figure 7 ; we note that the difference between the resonance wavelength calculated for the
nominal structure and the measured one is only 7,5 nm (which is totally compatible with the
technological tolerances). The period
Λ of the pattern provides a straightforward measure of
θ
through the relation sin 2
p
θλ
=Λ. In this case θ = 0.4° which is in excellent agreement
with the value obtained by numerical predictions.
Fig. 7. Complete view of SESHG near field for a FF injected at 1.56
μm.
In Figure 8 the detected SESHG power is plotted versus the guided FF power: SESHG
power data are in good agreement with the parabolic fit curve, as expected for a quadratic
nonlinear process.
Semiconductor Ridge Microcavities Generating Counterpropagating Entangled Photons
93
Fig. 8. SESHG power vs. FF power at 1.56
μm (photodiode acquisition).
As we have pointed out, the net frequency dependence of the enhancement factor is
dominated by the cavity; the spectrum of the second harmonic field allows thus the
characterization of the effect of the integrated vertical cavity.
Figure 9 reports the experimental spectrum obtained with our sample; the experimental
points are fitted with a Lorentzian, which is the expected theoretical shape close to the
resonance wavelength. The calculated full width at half maximum of the Lorentzian, in the
limit of perfect reflectivity of the bottom mirror, is:
2
2
T
nd
λ
γ
π
= (16)
with T the transmission coefficient of the upper mirror. The calculated value for our structure
is
γ
= 0.55 nm, which is in excellent agreement with the experimental data (
γ
= 0.54 nm).
Fig. 9. Experimental spectrum of the SESHG signal (dots) and fit with a Lorentzian (solid
line).
4.2 Parametric fluorescence and coincidence histogram
Since the sample described in the previous section presented elevated optical losses that
have been imputed to the growth technique, a second sample was grown using the
Advances in Lasers and Electro Optics
94
technique of molecular beam epitaxy. The epitaxial structure consists in 4.5 period
Al
0.25
Ga
0.75
As/ Al
0.80
Ga
0.20
As QPM waveguide core, 41-period asymmetrical Al
0.25
Ga
0.75
As/
Al
0.80
Ga
0.20
As DBR (serving as lower cladding + back mirror) and 18-period asymmetrical
Al
0.25
Ga
0.75
As/ Al
0.80
Ga
0.20
As DBR (serving as upper cladding + top mirror).
Figure 10 shows our first parametric fluorescence spectrum; the pump beam is provided by
a TE polarized, pulsed Ti: Sa laser with
λ
p
=759,5 nm and a 3 kHz repetition rate. The pulse
peak power is P
p
=10 W and its duration is 150 ns. The pump beam is focused on top of the
waveguide ridge using a cylindrical lens with an angle
θ
in the xz plane. The generated
photons are collected from one of the facets of the sample with a microscope objective,
spectrally analyzed with a monochromator, and then coupled into a fibered InGaAs single-
photon avalanche photodiode (IdQuantique).
The spectra obtained for
θ
=3°, show the existence of the two expected processes (see Figure
5) and demonstrate the possibility of direct generation of polarization-entangled states. The
amplitude difference in the observed signal is due to the fact that the long wavelength
photons are collected after their reflection on the facet opposite to the detection. An anti-
reflection coating to both facets of the sample would allow an automatic separation of the
photons of each pair and their direct coupling into two optical fibers, through standard
pigtailing process. The amount of detected photons allows deducing the brightness of our
twin photon source, which we estimate around 10
-11
W
-1
, which represents an improvement
of at least two orders of magnitude with respect to (Lanco et al., 2006).
Fig. 10. Experimental spectrum of the parametric fluorescence for the two parametric
interactions. The background noise here is due to the dark counts of the detectors.
To further assess the twin character of the emitted photons, the time correlations between
the detected counts have been analyzed. The scheme of the setup is shown in Figure 11 and
the histogram of the time delays is shown in Fig. 12, for the case of interaction 1 with
°= 3
θ
.
With a sampling interval of 40 ps, the histogram results from an acquisition time of 25
minutes. The peak observed for t
s
= t
i
demonstrates unambiguously the twin character of the
generated photons; the 500 ps full width at half maximum of the histogram corresponds to
the timing jitter of both detectors. The flat background is produced by the accidental
coincidences essentially dues to dark counts: indeed, switching the pump polarization from
TE to TM leads to the suppression of the t
s
= t
i
peak, without modifying this background.
Finally, no time-correlation is found between photons that are generated with different
Semiconductor Ridge Microcavities Generating Counterpropagating Entangled Photons
95
interactions: this agrees with the expectations, since these photons are not generated within
the same nonlinear process.
Fig. 11. Experimental set-up for the coincidence measurement. IF: interferential filter. FF:
fibered filter. APD: single photon avalanche photodiode. The signal collected by the
detectors is sent to a time-interval analyzer to built the time-correlation histogram.
Fig. 12. Time-correlation histogram between counterpropagating photons.
5. Conclusion and perspectives
These results open the way to the demonstration of several interesting features associated to
the counterpropagating geometry, as the direct generation of polarization entangled Bell
state or the control of the generated two-photon state via an appropriate choice of the spatial
and spectral pump beam profile. Indeed recent developments in quantum information
theory have arisen a growing interest on ‘generalized’ states of frequency correlation (like
frequency-correlated or frequency-uncorrelated photons). For example: i) quantum
teleportation and entanglement swapping require the synchronized creation of multiple
photon pairs, which is achieved by using a short pump pulse (thus relaxing the strict
frequency anti-correlation of the generated photons mentioned above); ii) linear optical
quantum computation requires uncorrelated photons in order to guarantee their
Advances in Lasers and Electro Optics
96
indistinguishability; iii) improvements on clock synchronization need frequency correlation
to overcome media dispersion.
The efficiency of this room temperature working device, along with the high-quality
quantum properties of the generated photons and their telecom wavelength, makes this
source a serious candidate for integrated quantum photonics.
6. Acknowledgments
The authors thank Isabelle Sagnes and Aristide Lemaître (Laboratoire de Photonique et
Nanostructures CNRS UPR20, France) for sample growth and Pascal Filloux for ridge
processing.
7. References
Andronico, A.; Caillet, X.; Favero, I.; Ducci, S. & Berger, V. (2008). Semiconductor
microcavities for enhanced nonlinear optics interactions. J. of European Optical
Society – Rapid Publications, 3, (September 2008) (08030-1-08030-7), 1990-2573.
Aspect, A.; Grangier, P. & Roger, G. (1982). Experimental Realization of Einstein-Podosky-
Rosen-Bohm Gedankenexperiment: A New Violation of Bell's Inequalities. Phys.
Rev. Lett., 49, 2, (July 1982) (91-94), 0031-9007.
Banaszek, K.; U'Ren, A. B. & Walmsley, I. A. (2001). Generation of correlated photons in
controlled spatial modes by downconversion in nonlinear waveguides. Optics
Letters, 26, 17, (September 2001) (1367-1369), 0146-9592.
Bouwmeester, D.; Pan, J.W.; Mattle, K.; Eibl, M.; Weinfurter, H. & Zeilinger, A. (1997).
Experimental quantum teleportation. Nature, 390, (December 1997) (575-579), 0028-
0836.
Caillet, X.; Berger, V.; Leo, G.; Sagnes, I. & Ducci, S. (2009). A semiconductor ridge micro
cavity to generate counterpropagating twin photons, Proceedings of SPIE 7222
72221J, 0277-786X, pp. 72221J1-8, San Jose (CA, USA), January 2009, SPIE.
Deutsch, D. & Ekert, A. (1998). Quantum Computation. Phys. World, 11, 3, (March 1998) (47-
52), 0953-8585.
Ducci, S.; Lanco, L.; Seurin, Y.; Leo, G.; Berger, V.; De Rossi, A. & Marcadet, X. (2005).
Semiconductor sources of twin photons for quantum information. J. of Optics B:
Quantum and Semiclassical Optics, 7, (June 2005) (S158-S165), 1464-4266.
Fan, J. & Migdall, A. (2007). A broadband high spectral brightness fiber-based two-photon
source. Opt. Express, 15, 6, (March 2007) (2915-2920), 1094-4087.
Giovannetti, V.; Maccone, L.; Shapiro, J. H. & Wong, F. N. C. (2002). Extended phase-
matching conditions for improved entanglement generation. Phys. Rev. A, 66, 4,
(October 2002) (043813-1-043813-9), 1050-2947.
Gisin, N.; Ribordy, G.; Tittel, W. & Zbinden, H. (2002). Rev. Mod. Phys. 74, 1, (March 2002)
(145-195), 0034-6861.
Grice, W. P.; U’Ren, A. B. & Walmsley, I. A. (2001). Eliminating frequency and space-time
correlations in multiphoton states. Phys. Rev. A, 64, 6, (November 2001) (063815-1-
063815-7), 1050-2947.
Semiconductor Ridge Microcavities Generating Counterpropagating Entangled Photons
97
Kwiat, P. G.; Mattle, K.; Weinfurter, H.; Zeilinger, A.; Sergienko, A.V. & Shih, Y. H. (1995).
New High-Intensity Source of Polarization-Entangled Photon Pairs. Phys. Rev. Lett.,
75, 24, (December 1995) (4337-4341), 0031-9007.
Lanco, L.; Ducci, S.; Likforman, J P.; Marcadet, X.; van Houwelingen, J. A. W.; Zbinden, H.;
Leo, G. and Berger, V. (2006). Semiconductor Waveguide Source of
Counterpropagating Twin Photons. Phys. Rev. Lett., 97, 17, (October 2006) (173901-
1-173901-4), 0031-9007.
Law, C. K.;Walmsley, I. A. & Eberly, J. H. (2000) Continuous Frequency Entanglement:
effective Finite Hilbert Space and Entropy Control. Phys. Rev. Lett. 84, 23, ( June
2000) (5304-5307), 0031-9007.
Migdall, A. (1999). Correlated-Photon Metrology Withiout Absolute Standards. Phys. Today,
52, 1 (January 1999) (41-46), 0031-9228.
Normandin, R. & Stegeman, G. I. (1979). Nondegenerate four-wave mixing in integrated
optics. Opt. Lett., 4, 58 (February 1979) (58-59), 0146-9592.
Perina, J. (2008). Quantum properties of counterpropagating two-photon states generated in
a planar waveguide. Phys. Rev. A, 77, 1, (January 2008) (013803-1-013803-14), 1050-
2947.
Rarity, J. G.; Fulconis, J.; Duligall, J.; Wadsworth, W. J. & Russel, P. S. J. (2005). Photonic
crystal fiber source of correlated photon pairs. Opt. Express, 13, 2, (January 2005)
(534-544), 1094-4087.
Sergienko, A.V. & Jaeger, G.S. (2003). Quantum information processing and precise optical
measurement with entangled-photon pairs. Contemporary Phys., 44, 4, (July 2003)
(341-356), 0010-7514.
Stevenson, R. M.; Young, R. J.; Atkinson, P.; Cooper, K.; Ritchie, D. A. & Shields, A. J. (2006).
A semiconductor source of triggered entangled photon pairs. Nature, 439, (January
2006) (179-182), 0028-0836.
Tanzilli, S.; De Riedmatten, H.; Tittel, W.; Zbinden, H.; Baldi, P.; De Micheli, M.; Ostrowsky,
D. B. & Gisin, N. (2001). Highly efficient photon-pair source using a Periodically
Poled Lithium Niobate waveguide. Electronics Letters, 37, 1, (January 2001) (26-28),
0013-5194.
Tittel, W.; Brendel, J.; Zbinden, H. & Gisin, N. (1998). Violation of Bell Inequalities by
Photons More Than 10 km Apart. Phys. Rev. Lett., 81, 17, (October 1998) (3563-3566),
0031-9007.
Torres, J. P.; Macia, F.; Carrasco, S. & Torner, L. (2005). Engineering the frequency
correlations of entangled two-photon states by achromatic phase matching. Optics
Letters, 30, 3, (February 2005) (314-316), 0146-9592.
Walther, P.; Resch, K. J.; Rudolf, T.; Schenck, E.; Weinfurter, H.; Vedral, V.; Aspelmeyer, M.
& Zeilinger, A. (2005). Experimental one-way quantum computing. Nature, 434,
(March 2005) (169-176), 0028-0836.
Walton, Z. D.; Booth, M. C.; Sergienko, A. V.; Saleh B. E. A. & Teich, M. C. (2003).
Controllable frequency entanglement via auto-phase-matched spontaneous
parametric down-conversion. Phys. Rev. A, 67, 5 (May 2003) (053810-1-053810-4),
1050-2947.
Advances in Lasers and Electro Optics
98
Walton, Z. D.; Sergienko, A. V.; Saleh, B. E. A. & Teich, M. C. (2004). Generation of
polarization-entangled photon pairs with arbitrary joint spectrum. Phys. Rev. A, 70,
5, (November 2004) (052317-1-052317-5), 1050-2947.
Wang, L. J.; Hong, C. K. & Friberg, S. R. (2001). Generation of correlated photons via four-
wave mixing in optical fibres. J. Opt. B: Quantum and Semiclass. Opt., 3, (October
2001) (346-352), 1464-4266.
Weihs, G.; Jennewein, T.; Simon, C.; Weinfurter, H. & Zeilinger, A. (1998). Violation of Bell's
Inequality under Strict Einstein Locality Conditions. Phys. Rev. Lett., 81, 23,
(December 1998) (5039-5043), 0031-9007.
6
Two-Wave Mixing in Broad-Area
Semiconductor Amplifier
Mingjun Chi
1
, Jean-Pierre Huignard
2
and Paul Michael Petersen
1
1
Department of Photonics Engineering, Technical University of Denmark
2
Thales Research & Technology
1
Denmark
2
France
1. Introduction
Two-wave mixing (TWM) is an interesting area in nonlinear optics and has been intensively
investigated in the past three decades. TWM can take place in many different nonlinear
media, such as second-order nonlinear media like photorefractive materials (Marrakchi et
al., 1981; Huignard & Marrakchi, 1981; Yeh, 1983; 1989; Garrett et al., 1992), third-order
nonlinear materials like Kerr media (Silberberg &Bar-Joseph, 1982; 1984; Yeh, 1986; 1989;
Grandclément et al., 1987; McGraw, 1992), and in gain media like YAG (Brignon &
Huignard, 1993). The microcosmic physical process for TWM in different nonlinear media is
different. But in general the TWM process can be explained as: two coherent beams are
incident on a nonlinear medium and a interference pattern is formed in the medium, such a
pattern is characterized by a periodic spatial variation of the intensity; thus a refractive
index and/or a gain (absorption) periodic variations will be induced because of the
nonlinear response of the medium, and these refractive index and gain variations are
usually called volume refractive index (or phase) grating and gain (or absorption) grating;
the two beams propagate through the volume gratings formed by them and they undergo
Bragg scattering (the Bragg condition is satisfied automatically); one beam scatters into the
other and vice versa, so the energy and phase exchanges may occur between these two
beams, i.e., the TWM takes place.
Nonlinear four-wave mixing in narrow-stripe and broad-area semiconductor lasers and
amplifiers is of interest as a method to obtain high phase conjugate reflectivity (Nakajima &
Frey, 1985; 1986; Frey, 1986; Agrawal, 1987; Kürz et al., 1996). The nonlinear four-wave
mixing can also be used to measure carrier dynamics and gain behaviour directly in the
devices, as well as for understanding device physics and application (Lucente et al., 1988a;
1988b; Zhu, 1997a; 1997b; 1997c). The gain and refractive index gratings created in broad-
area semiconductor lasers by coherent four-wave mixing are very interesting nonlinear
interactions which may be applied to realize high brightness semiconductor lasers as well as
to study the carrier dynamics and the physics of the devices (Petersen et al., 2005). But no
work on TWM was done in broad-area semiconductor amplifiers previously.
In this chapter, we present both the theoretical and experimental results of TWM in broad-
area semiconductor amplifier. For the generality, we assume that the frequencies of the
Advances in Lasers and Electro Optics
100
pump beam and the signal beam are different, i.e., a moving gain grating and a moving
refractive index grating are induced in the broad-area semiconductor amplifier. The
coupled-wave equations of TWM are derived based on Maxwell’s wave equation and rate
equation of the carrier density. The analytical solutions of the coupled-wave equations are
obtained in the condition of small signal when the total light intensity is far below the
saturation intensity of the amplifier. The results show that the optical gain of the amplifier is
affected by both the moving phase grating and the moving gain grating. The different
contributions from both the refractive index grating and the gain grating to the TWM gain
are analyzed. Depending on the moving direction of the gratings and the anti-guiding
parameter, the optical gain of the amplifier may increase or decrease due to the TWM.
As a special case, the degenerate TWM (the frequencies of the pump beam and the signal
beam are the same, i.e., a static gain grating and a static refractive index grating are induced
in the semiconductor amplifier) in an 810 nm, 2 mm long and 200 μm wide GaAlAs broad-
area amplifier is investigated experimentally. In this case, the theoretical results show that
when the amplifier is operated below transparency the optical gain of both beams is
increased due to the induced gain grating, and when the amplifier is operated above
transparency the optical gain of both beams is decreased due to the gain grating. The
refractive index grating does not affect the optical gain of both beams; and there is no
energy exchange between the pump and the signal beams. The dependence of the TWM
gain on the output power of the pump and angle between the two beams is measured. The
experimental results show good agreement with the theory. A diffusion length of 2.0 μm for
the carrier is determined from the experiment.
2. Theory of TWM in broad-area semiconductor amplifier
Z=0
Z=Z
0
A
1
Z
Semiconductor
amplifier
Moving gratings
Electrode
A
2
x
K
Fig. 1. Configuration of the TWM in a broad-area semiconductor amplifier with moving
gratings, K shows the direction of the grating vector.
The TWM geometry is shown in Fig. 1, the pump beam of amplitude A
1
and the signal beam
of amplitude A
2
are coupled into the broad-area amplifier. Both beams are linearly polarized
along the Y direction, and the frequencies are ω
1
and ω
2
respectively. The two beams
Two-Wave Mixing in Broad-Area Semiconductor Amplifier
101
interfere in the medium to form a moving interference pattern, and a moving modulation of
the carrier density in the active medium is caused, thus both a moving gain and a moving
phase gratings are created. The nonlinear interaction in the gain medium is governed by
Maxwell’s wave equation:
22 2
2
22 22
0
1nE P
E
ct ct
ε
∂∂
∇− =
∂∂
, (1)
where n is the refractive index of the semiconductor material at transparency, c is the
velocity of light in vacuum, and ε
0
is the vacuum permittivity. The total electric field is given
by (Agrawal, 1987; Chi et al., 2006; 2008):
11 22
()()
12
itit
EAe Ae
ωω
⋅− ⋅−
=+
Kr Kr
, (2)
where
K
1
and K
2
are the wave vectors of the pump and the signal in the amplifier. P is the
induced polarization in the semiconductor amplifier. It is given by (Agrawal, 1987; Chi et
al., 2006; 2008):
0
()PNE
ε
χ
= , (3)
where the susceptibility χ is given by (Agrawal, 1987; Chi et al., 2006; 2008):
() ( )()
nc
NigN
χβ
ω
=− +
, (4)
the quantity β is the anti-guiding parameter accounting for the carrier-induced refractive
index change in semiconductor amplifier, and g(N) is the gain for the light intensity that is
assumed to vary linearly with the carrier density N, i.e.,
0
() ( )gN aN N=−Γ
where a is the
gain cross-section, Γ is the confinement factor, and N
0
is the carrier density at transparency.
The carrier density N is governed by the following rate Eq. (Petersen et al., 2005; Chi et al.,
2006; 2008):
2
2
()
E
dN I N
DNgN
dt qV
τω
=−+∇−
=
, (5)
where I is the injected current, q is the electron charge, V is the active volume, τ is the
spontaneous recombination lifetime and D is the ambipolar diffusion constant. In the TWM
process the origin of the gain and the refractive index gratings is the modulation of the
carrier density due to the interference between A
1
and A
2
. Thus the carrier density that leads
to the formation of the moving gratings may be written as:
[
]
[
]
*
exp ( ) exp ( )
B
NN N iKx t N iKx t
δδ
=+Δ −+ +Δ − , (6)
where N
B
is the average carrier density, ΔN is the induced carrier modulation.
[
]
21 12 1
4sin( )2K
πθθ λ
=−= −KK is the grating vector; θ
1
is the angle between the pump
beam and the Z axis, and θ
2
is the angle between the signal beam and the Z axis; we assume
12
θθ
=− , thus the direction of the grating vector is in the X direction; λ
1
is the wavelength of
the pump beam in the amplifier (where we assume that
12
λλ
≅
, since usually the frequency
Advances in Lasers and Electro Optics
102
difference of the signal and the pump beams is less than a few gigahertz).
21
δω ω
=− is the
frequency difference between the signal and pump beams. In the following perturbation
analysis it is assumed that ΔN << N
B
. Inserting Eqs. (2) and (6) into Eq. (5), we find after
some simple calculations that the average carrier density N
B
and the carrier modulation ΔN
are given by:
2
00
2
0
1
s
B
s
IqV NE P
N
EP
τ
+
=
+
, (7)
()
*
012
2
2
0
1
Bs
s
NNAAP
N
DK E P i
τδτ
−
Δ=−
++ +
, (8)
where
222
012
EAA=+ is the average intensity, and ()( )
s
Pa
ωτ
=Γ= is the saturation
intensity of the amplifier.
Inserting Eqs. (2) and (3) into Eq. (1), and using the obtained results of the average carrier
density N
B
and the carrier modulation ΔN, after some calculations, the coupled-wave
equations for TWM with moving gratings in a broad-area semiconductor amplifier are
obtained:
2
2
1
1 1
22
2
00
()
cos 1 0
11
s
ss
AP
Ai
iA
z
EP DK EPi
αβ
θ
τδτ
⎡⎤⎛ ⎞
∂+
⎜⎟
−− − =
⎢⎥
⎜⎟
∂
++++
⎢⎥
⎣⎦⎝ ⎠
, (9)
2
1
2
2 2
22
2
00
()
cos 1 0
11
s
ss
AP
Ai
iA
z
EP DK EPi
αβ
θ
τδτ
⎡⎤⎛ ⎞
∂+
⎜⎟
−− − =
⎢⎥
⎜⎟
∂
+++−
⎢⎥
⎣⎦⎝ ⎠
, (10)
where
0
()2aI qV N
ατ
=Γ −
is the small-signal gain coefficient of the amplifier. Since the
refractive index of the semiconductor material is high, normally the angles θ
1
and θ
2
are less
than 2º in experiment (Chi et al., 2006); so the cosine factor in Eqs. (9) and (10) is neglected
below.
In the small signal approximation, and if we assume that the total intensity of the two beams
is much less than the saturation intensity, i.e.,
22
21
s
AAP<< << , the terms accounting for
saturation in the denominator and the term accounting for the coupling in Eq. (9) may be
neglected. Thus the coupled-wave equations can be solved analytically. The solutions are:
[
]
110
exp (1 )AA i z
β
α
=−, (11)
{
}
2
220 1
exp (1 ) ( 1)/2
z
AA i z e
α
βα γ
⎡
⎤
=−−−
⎣
⎦
, (12)
where A
10
and A
20
are the amplitudes of the pump and the signal beams at the front facet of
the amplifier. γ
1
is a parameter defined as:
()
2
10
1
2
1
1
1
s
A
P
DK i
γ
τδτ
⎡
⎤
⎢
⎥
=+
⎢
⎥
+−
⎣
⎦
. (13)
Two-Wave Mixing in Broad-Area Semiconductor Amplifier
103
The first term in Eq. (13) is for the saturation effect, the second term is for the beam
coupling.
Define the TWM gain of the signal beam g
TWM
as the natural logarithm of the ratio of the
output intensity of signal with the coherent pump to that with the non-coherent pump:
2
22
2
2 0 coherent pump
10 10
TWM
2
22 2
20
non-coherent pump
()
()
1
ln
(1 ) ( )
()
s
Az
Az A
DK
g
PDK
Az
τ
β
δτ
τδτ
⎛⎞
−
++
⎜⎟
==−
⎜⎟
++
⎜⎟
⎝⎠
, (14)
where z
0
is the length of the semiconductor amplifier. The non-coherent pump means the
pump beam is not coherent with the signal beam, but the intensity is the same as the
coherent pump, thus the term accounting for saturation in Eq. (14) vanishes. In experiment,
the coherent pump and the non-coherent pump can be achieved by changing the
polarization direction of the pump beam (Chi et al., 2006). Eq. (14) shows that g
TWM
changes
linearly with the output intensity (power) of the pump, and it decreases quickly when the
angle between the two beams increases because the diffusion of carriers washes out the
gratings as the angle between the two beams increases. Eq. (14) also shows that depending
on the detuning frequency δ, the TWM gain can be positive or negative no matter the
amplifier is operated above or below the transparency (i.e.,
22
10 10
()Az A= ). These
phenomena will be discussed below.
3. Experiment of the degenerate TWM in a broad-area amplifier
In order to verify the theory described in Section 2, a special case of TWM, i.e., degenerate
TWM, in a broad-area semiconductor amplifier is investigated experimentally. For this case,
the frequencies of the pump and the signal are the same, i.e., δ = 0; thus a static refractive
index grating and a static gain grating are induced in the amplifier. The coupled-wave
equations (9) and (10) in this case are changed to:
2
2
1
1
22
2
00
()
10
11
s
ss
AP
Ai
iA
z
EP DK EP
αβ
τ
⎡⎤⎛ ⎞
∂+
⎜⎟
−− − =
⎢⎥
⎜⎟
∂
+++
⎢⎥
⎣⎦⎝ ⎠
, (15)
2
1
2
2
22
2
00
()
10
11
s
ss
AP
Ai
iA
z
EP DK EP
αβ
τ
⎡⎤⎛ ⎞
∂+
⎜⎟
−− − =
⎢⎥
⎜⎟
∂
+++
⎢⎥
⎣⎦⎝ ⎠
. (16)
The equations show that the coupling term between the two beams decreases the optical
gain (above transparency) or absorption (below transparency) for both beams
simultaneously. This is different to the situation in photorefractive materials, where one
beam is amplified and the other is decreased at the same time (Marrakchi et al., 1981;
Huignard & Marrakchi, 1981; Yeh, 1983; 1989). This is also different to the situation in Kerr
media, where the intensity of one beam is not affected by the other beam in the degenerate
TWM case (Yeh, 1986; 1989; Chi et al., 2009).
To clarify this phenomenon, the relative position of the intensity pattern, the carrier density
grating, the refractive index grating and the gain grating is shown in Fig. 2 when the
amplifier is operated above the transparency. Because of the spatial hole-burning effect, the
Advances in Lasers and Electro Optics
104
carrier density grating is π out of phase with the intensity pattern. Since the gain varies
linearly with the carrier density, the gain grating is also π out of phase with the intensity
pattern. The refractive index grating is in phase with the interference intensity pattern due
to the anti-guiding effect. The refractive index grating has no contribution to the energy
coupling between the two beams, when it is in phase or π out of phase with the interference
pattern (Yeh, 1989). The gain grating will decrease the optical gain of both beams
simultaneously because it is π out of phase with the interference pattern. Reversely, the gain
grating will decrease the absorption of both beams when the amplifier is operating below
the transparency since the gain grating is in phase with the interference pattern in that case
(Chi et al., 2009).
0 3 6 9 121518
0
2
4
6
8
Gain pattern g(x)
Index pattern n(x)
Carrier density pattern N(x)
Intensity pattern I(x)
A.U.
Lateral position
Fig. 2. The relative position of the interference pattern, the carrier density grating, the
refractive index and the gain gratings formed in the broad-area amplifier.
Since δ = 0, the TWM gain for the degenerate TWM is changed to:
()
2
22
2 0 coherent pump
10 10
TWM
2
2
20
non-coherent pump
()
()
ln
1
()
s
Az
Az A
g
DK P
Az
τ
⎛⎞
−
⎜⎟
==−
⎜⎟
+
⎜⎟
⎝⎠
. (17)
Eq. (17) shows that the g
TWM
is negative when the amplifier is operated above the
transparency, is positive when it is operated below the transparency, and is zero when it is
operated at transparency. It agrees with the analyse above. Eq. (17) also shows that the g
TWM
decreases linearly with the output intensity (power) of the pump, and it decreases quickly
when the angle between the two beams increases because the diffusion of carriers washes
out the gratings as the angle between the two beams increases. These analyses will be
verified by experiments of TWM in a semiconductor amplifier below.
The experimental set-up is shown in Fig. 3. The set-up is arranged like a Mach-Zehnder
interferometer. The pump beam A
1
and the signal beam A
2
are derived from a tunable diode
laser system based on a tapered amplifier (Chi et al., 2005). The wavelength used in the
experiment is 813.5 nm. We use the same method as Goldberg (Goldberg et al., 1993) to
Two-Wave Mixing in Broad-Area Semiconductor Amplifier
105
couple the two beams into the broad-area amplifier. In each arm, a combination of a
cylindrical lens of 150 mm focal length and an aspherical lens of 8.0 mm focal length with a
N.A. of 0.5 (this lens is shared by the two arms) is used as an afocal telescope to inject the
two beams into the amplifier. The input coupling efficiency of this setup is around 50%. The
two cylindrical lenses can be translated in the arrow direction to vary the injection angle in
the junction plane. After the amplifier, a cylindrical lens of 5.0 mm focal length is used to
collimate the output beam in the fast axis. A half-wave plate is inserted in the pump arm to
change the polarization direction of the pump. All the components are antireflection coated
for the near infrared wavelength.
Fig. 3. Experimental set-up for the TWM in a broad-area amplifier. M: mirror, BSs: beam
splitter, HWP: half-wave plate, BAA: broad-area amplifier (the units are in mm).
The broad-area amplifier is an 810 nm, 2 mm long and 200 μm wide GaAlAs amplifier. It
was grown by the Metallorganic Chemical Vapor Phase Deposition (MOCVD) technique on
a GaAs substrate by Alcatel Thales III-V Lab. The structure contains a Large Optical Cavity
(LOC), which has a thickness of approximately 1 µm, and which consists of a tensile-
strained GaInP quantum well, two GaInP barriers and two AlGaInP claddings. Both facets
of the amplifier are antireflection coated; the reflectivity is less than 0.1%.
First, the dependence of the g
TWM
on the output power of the pump is measured. The input
powers of the pump and the signal measured before the aspherical lens are 21.0 and 4.1
mW. The angle between the two beams is around 4°. The output power of the signal was
measured at different injected current of the amplifier with a co-polarized pump (the
polarization direction of both beams is perpendicular to the chip of the amplifier) and an
orthogonally-polarized pump. The output power of the pump was measured when it is
coherent with the signal. The experimental results are shown in Fig. 4. It is clearly seen that
the g
TWM
decreases linearly with the output pump power. Fitting the experimental data with
Eq. (17), the two parameters: the input power of the pump
2
10
A and the
()
2
11
s
DK P
τ
+ are
obtained. The
2
10
A is round 9.1 mW, corresponding to a coupling efficiency of 43%; and
using the result of Dτ obtained later, the saturation power P
s
is found to be around 220 mW,
which is much larger than the output power of the pump in this experiment. Using the
value of
2
10
A and Eq. (11), the optical gain of 1.7 is obtained for the highest output power
of the pump. The g
TWM
is about 5% of the optical gain.
The dependence of the g
TWM
on the grating vector is also measured by changing the angle
between the two beams. The direction of the pump beam is fixed during the experiment; the
angle is changed by changing the direction of the signal beam. The injected powers of the
pump and the signal measured before the aspherical lens are 21.0 and 4.1 mW; the output
Advances in Lasers and Electro Optics
106
0 102030405060
-0,12
-0,10
-0,08
-0,06
-0,04
-0,02
0,00
g
TWM
Output power of pump (mW)
Fig. 4. The g
TWM
versus the output power of the pump. The squares are the measured data;
the line is the fitted result with Eq. (17).
0,0 0,3 0,6 0,9 1,2 1,5
-0,08
-0,06
-0,04
-0,02
0,00
g
TWM
Grating vector (μm
-1
)
Fig. 5. The g
TWM
versus the grating vector in the BAA. The squares are the measured data:
the curve is the fitted result with Eq. (17).
power of the pump is around 35 mW. The experimental results are shown in Fig. 5. Fitting
the experimental data with Eq. (17), Dτ is obtained to be 4.1 μm
2
, leading to a diffusion
length
LD
τ
= of 2.0 μm. Assuming that τ is 5 ns (Marciante & Agrawal, 1996), D is
calculated to be 8.2 cm
2
/s. This is in good agreement with the direct measured value of 9.5
cm
2
/s (Lucente et al., 1988b). We should mention that the output power of the pump beam
is decreased a little when the polarization direction of it is changed from perpendicular to
the chip to parallel to the chip. We do not know the reason of this decrease but the effect of
this decrease on the measured g
TWM
is small.
To obtain the coupled-wave equations of TWM, three assumptions are made. Here we
should discuss the validity of these assumptions in our experiment. The first is the plane-
Two-Wave Mixing in Broad-Area Semiconductor Amplifier
107
wave assumption. In the experiment, since the two beams are coupled into the amplifier
from an external laser, the mode of the two beams in the slow axis is determined by the
external laser and the focusing optics. The two beams are nearly Gaussian beams in the slow
axis, they are collimated by the aspherical lens and the width of the beams is around 140
μm. We believe the plane-wave assumption is a good approximation for these two beams in
this direction. The wave guiding mode of the field distribution in the fast axis does not affect
the derivation of the equations (Marciante & Agrawal, 1996). The second is the linear
variation of the material gain g(N) on the carrier density. The transparent current of the
amplifier used here is around 1.1 A, and the highest current used in our experiment is 1.8 A,
according to Eq. (7), the carrier density N
B
is calculated to be around 1.5 N
0
, not much higher
than the transparent carrier density. The third assumption is the small population
modulation in Eq. (6). With the injected current of 1.8 A, according to Eq. (8),
NΔ is
calculated to be around 2% of
N
0
(≈1.3% of N
B
), it is much less than the average carrier
density N
B.
Therefore, we believe the assumptions made in the theory are valid in our
experiment.
In conclusion, the degenerate TWM in broad-area semiconductor amplifier is investigated
experimentally. The experimental results show good agreement with the theory. The
validity of the theory is discussed.
4. Calculations and discussion
Unlike the condition of degenerate TWM, where only static gratings are generated; the
coupling term between the two beams has different contribution to the optical gain of these
two beams for the nondegenerate TWM (Chi et al., 2008). The nondegenerate TWM may
increase the power of one beam and decrease the power of another beam in this case, i.e.,
energy exchange occurs.
According to Eq. (14), the dependence of g
TWM
on the frequency difference δ with different
anti-guiding parameter
β is calculated; here we assume that the amplifier is operated above
the transparent current. The calculated results are shown in Fig. 6. In the calculation, we use
the same parameters used in and obtained from the TWM experiment in a GaAlAs broad-
area semiconductor amplifier with static gratings described in Section 3 (Chi et al., 2006);
i.e.,
2
10
()Az = 48.8 mW,
2
10
A = 9.1 mW, P
s
= 220 mW, Dτ = 4.1 μm
2
, K = 0.51 μm
-1
(the K
value corresponds to a 4.0º angle between the two beams). Assuming that
τ is 5 ns
(Marciante & Agrawal, 1996). From Fig. 6 we can find that when
δ = 0, the g
TWM
is negative
and independent of
β; if β = 0, the g
TWM
is always negative and the curve of the TWM gain
versus
δ is symmetric around the axis of δ = 0. If β ≠ 0, however, the g
TWM
is negative when δ
> 0, and the
g
TWM
can be negative or positive when δ < 0. These properties can be explained
by analyzing the different contributions from the refractive index grating and the gain
grating formed in the broad-area semiconductor amplifier to the TWM gain.
Since the frequencies of the pump and the signal are different, a moving interference pattern
is generated in the amplifier:
22
()
*
012
iKx t
EE AAe cc
δ
−+
⎡
⎤
=+ +
⎣
⎦
. Inserting Eq. (8) into Eq. (6),
the carrier density is obtained:
()
[]
*
012
2
2
0
exp ( ) . .
1
Bs
B
s
NNAAP
NN iKx t cc
DK E P i
δ
τδτ
⎧
⎫
−
⎪
⎪
=+− −+ +
⎨
⎬
++ +
⎪
⎪
⎩⎭
. (18)
Advances in Lasers and Electro Optics
108
-1,0 -0,6 -0,2 0,2 0,6 1,0
-0,3
-0,2
-0,1
0,0
0,1
0,2
g
TWM
δ (GHz)
β=0
β=2
β=3
β=4
β=5
Fig. 6. The calculated TWM gain g
TWM
versus δ with different anti-guiding parameter β
according to Eq. (14).
The modulation part N
m
of the carrier density for the generating of the gain and the phase
gratings is:
()
()
()
[]
*
12 0
2
22
2
0
exp ( ) . .
1
Bs
m
s
AA N N P
NiKxtcc
DK E P
δπθ
τδτ
−
=−++−+
++ +
, (19)
where
2
2
0
1
s
arctg
DK E P
δτ
θ
τ
=
++
(-π/2 <θ < π/2). (20)
Eq. (19) shows, because of the hole-burning effect and the finite response time of the broad-
area amplifier, there is a phase difference π-θ between the interference pattern and the
carrier density grating. Since the gain varies linearly with the carrier density, the gain
grating Δg is also π-θ out of phase with the intensity pattern, i.e.,
()
()
()
[]
*
0
12
2
2
2
2
0
exp ( ) . .
2
1
B
s
s
aN N
AA
giKxtcc
P
DK E P
δπθ
τδτ
Γ−
Δ= − + + − +
++ +
. (21)
The refractive index grating is π out of phase with the gain grating because of the anti-
guiding effect, so the refractive index grating Δn is –θ out of phase with the intensity pattern
and proportional to the anti-guiding parameter β, i.e.,
()
()
()
[]
*
10
12
2
2
2
2
0
exp ( ) . .
4
1
B
s
s
aNN
AA
niKxtcc
P
DK E P
λ
β
δθ
π
τδτ
Γ−
Δ= − + − +
++ +
. (22)
Two-Wave Mixing in Broad-Area Semiconductor Amplifier
109
The relative position of the interference pattern, the carrier density grating, the refractive
index grating and the gain grating formed in the broad-area amplifier is shown in Fig. 7.
-3 0 3 6 9 12 15 18
0
1
2
3
4
5
6
7
8
π−θ
−θ
Gain pattern g(x)
Index pattern n(x)
Carrier density pattern N(x)
Intensity pattern I(x)
A.U.
Lateral position
π−θ
Fig. 7. The relative position of the interference pattern, the carrier density grating, the
refractive index grating and the gain grating formed in the BAA, assuming
2
2
0
1
s
DK E P
τδτ
++ =, i.e., θ = π/4.
The TWM gain caused by the gain grating g
gain
is (Chi et al., 2009):
()
()
2
22
2
0
cos( )
1
gain
s
g
DK E P
πθ
τδτ
−
∝
++ +
. (23)
Here we should notice that the effect of the gain grating is the same for both beams, i.e., to
increase (below transparent current) or decrease (above transparent current) the intensity of
the pump and the signal beams simultaneously, thus it will not cause the energy exchange
between the two beams. The TWM gain caused by the phase grating g
phase
is (Yeh, 1989; Chi
et al., 2009):
()
()
2
2
2
2
0
sin( )
1
phase
s
g
DK E P
βθ
τδτ
−
∝
++ +
. (24)
When δ ≠ 0, the refractive index grating will cause energy exchange between the two beams,
since there is a phase difference -θ (θ ≠ 0) between the intensity pattern and the refractive
index grating (Yeh, 1989). The TWM gain g
TWM
is the sum of g
gain
and g
phase
.
When δ = 0, (i.e., static gratings are induced in the amplifier), θ is equal to zero; thus the gain
grating is π out of phase with the interference pattern, and the phase grating is in phase with
the interference pattern. According to Eqs (23) and (24), the gain of the phase grating g
phase
is
zero; and the g
TWM
equal to g
gain
, is negative and independent of β (Chi et al., 2006). If β = 0,
only the gain grating is generated; according to Eqs. (20) and (23), the TWM gain g
TWM
is
always negative and is symmetric around the axis of δ = 0. If β ≠ 0, both a gain grating and a
Advances in Lasers and Electro Optics
110
phase grating are generated. When δ > 0 (θ > 0), according to Eqs. (23) and (24), both the g
gain
and the g
phase
are negative, so the g
TWM
is negative; when δ < 0 (θ < 0), the g
gain
is negative
and the g
phase
is positive, so the g
TWM
can be positive or negative.
The parameters β and τ can be obtained by fitting the measured results of g
TWM
versus δ. The
optimal δ to achieve the maximum TWM gain depends on the device parameters τ, D, β and
the grating vector K. From Eq. (14), the optimal δ is
22
(1 )(1 1 )
opt
DK
δτ
ββ
τ
=− + ± + .
5. Conclusion
In conclusion, the TWM in broad-area semiconductor amplifier in nondegenerate condition
is investigated theoretically. The coupled-wave equations are derived and analytical
solutions are obtained when the intensity of the pump is much larger than that of the signal,
but much less than the saturation intensity of the amplifier. A special case of TWM,
degenerate TWM, is investigated experimentally in a GaAlAs broad-area semiconductor
amplifier. The experimental results show good agreement with the theory, and the validity
of the theory for this experiment is discussed. A diffusion length of 2.0 μm is determined
from the experiment. The TWM gain in broad-area semiconductor amplifier is calculated as
a function of the frequency difference between the pump and the signal based on the data
obtained from the degenerate TWM experiment; and the calculated results are discussed
based on the different contributions from the refractive index grating and the gain grating to
the TWM gain. Depending on δ and β, the TWM gain in semiconductor broad-area amplifier
can be positive or negative. The energy exchange between the pump and signal beams
occurs when δ ≠ 0.
6. Acknowledgements
The authors acknowledge the financial support of the European community through the
project WWW.BRIGHTER.EU (Grant No. FP6-IST-035266). Mingjun Chi wishes to
acknowledge the Danish Research Agency under grant no. 26-04-0229.
7. References
Agrawal, G.P. (1987). Four-wave mixing and phase conjugation in semiconductor laser
media. Opt. Lett., Vol. 12, No. 4, 260-262
Brignon, A. & Huignard, J P. (1993). Two-wave mixing in Nd:YAG by gain saturation. Opt.
Lett., Vol. 18, No. 19, 1639-1641
Chi, M.; Jensen, O.B.; Holm, J.; Pedersen, C.; Andersen, P.E.; Erbert, G.; Sumpf, B. & Petersen
P.M. (2005). Tunable high-power narrow-linewidth semiconductor laser based on
an external-cavity tapered amplifier. Opt. Express, Vol. 13, No. 26, 10589-10596
Chi, M.; Jensen, S.B.; Huignard, J P. & Petersen, P.M. (2006). Two-wave mixing in a broad-
area semiconductor amplifier. Opt. Express, Vol. 14, No. 25, 12373-12379
Chi, M.; Huignard, J P. & Petersen, P.M. (2008). Nonlinear gain amplification due to two-
wave mixing in a broad-area semiconductor amplifier with moving gratings. Opt.
Express, Vol. 16, No. 8, 5565-5571
Chi, M.; Huignard, J P. & Petersen, P.M. (2009). A general theory of two-wave mixing in
nonlinear media. J. Opt. Soc. Am. B, Vol. 26, No. 8, 1578-1584
Two-Wave Mixing in Broad-Area Semiconductor Amplifier
111
Frey, R. (1986). On-axis intracavity nearly degenerate four-wave mixing in lasers. Opt. Lett.,
Vol. 11, No. 2, 91-93
Garrett, M.H.; Chang, J.Y.; Jenssen, H.P. & Warde, C. (1992). High beam-coupling gain and
deep- and shallow-trap effects in cobalt-doped barium titanate, BaTiO
3
:Co. J. Opt.
Soc. Am. B, Vol. 9, No. 8, 1407-1415
Goldberg, L.; Mehuys, D.; Surette, M.R. & Hall, D.C. (1993). High-power, near-diffraction-
limited large-area travelling-wave semiconductor amplifiers. IEEE J. Quantum
Electron., Vol. 29, No. 6, 2028-2042
Grandclément, D.; Grynberg, G. & Pinard, M. (1987). Observation of continuous-wave self-
oscillation due to pressure-induced two-wave mixing in Sodium. Phys. Rev. Lett.,
Vol. 59, No. 1, 40-43
Huignard, J P. & Marrakchi, A. (1981). Coherent signal beam amplification in two-wave
mixing experiments with photorefractive Bi
12
SiO
20
crystals. Opt. Commun., Vol. 38,
No. 4, 249-254
Kürz, P.; Nagar, R. & Mukai, T. (1996). Highly efficient phase conjugation using spatially
nondegenerate four-wave mixing in a broad-area laser diode. Appl. Phys. Lett., Vol.
68, No. 9, 1180-1182
Lucente, M.; Carter, G.M. & Fujimoto J.G. (1988a). Nonlinear mixing and phase conjugation
in broad-area diode lasers. Appl. Phys. Lett., Vol. 53, No. 6, 467-469
Lucente, M.; Fujimoto J.G. & Carter, G.M. (1988b) Spatial and frequency dependence of four-
wave mixing in broad-area diode lasers. Appl. Phys. Lett., Vol. 53, No. 20, 1897-1899
Marciante, J.R. & Agrawal, G.P. (1996). Nonlinear mechanisms of filamentation in broad-
area semiconductor lasers. IEEE J. Quantum Electron., Vol. 32, No. 4, 590-596
Marrakchi, A.; Huignard, J P. & Günter, P. (1981). Diffraction efficiency and energy transfer
in two-wave mixing experiments with Bi
12
SiO
20
crystals. Appl. Phys., Vol. 24, No. 2,
131-138
McGraw, R. (1992). Light-scattering-noise limits to two-wave-mixing gain in Kerr media. J.
Opt. Soc. Am. B, Vol. 9, No. 1, 98-103
Nakajima, H. & Frey, R. (1985). Intracavity nearly degenerate four-wave mixing in a
(GaAl)As semiconductor laser. Appl. Phys. Lett., Vol. 47, No. 8, 769-771
Nakajima, H. & Frey, R. (1986). Collinear nearly degenerate four-wave mixing in intracavity
amplifying media. IEEE J. Quantum Electron., Vol. 22, No. 8, 1349-1354
Petersen, P.M.; Samsøe, E.; Jensen, S.B. & Andersen, P.E. (2005). Guiding of laser modes
based on self-pumped four-wave mixing in a semiconductor amplifier. Opt.
Express, Vol. 13, No. 9, 3340-3347
Silberberg, Y. & Bar-Joseph, I. (1982). Instabilities, self-oscillation, and chaos in a simple
nonlinear optical interaction. Phys. Rev. Lett., Vol. 48, No. 22, 1541-1543
Silberberg, Y. & Bar-Joseph, I. (1984). Optical instabilities in a nonlinear Kerr medium. J. Opt.
Soc. Am. B, Vol. 1, No. 4, 662-670
Yeh, P. (1983). Contra-directional two-wave mixing in photorefractive media. Opt. Commun.,
Vol. 45, No. 5, 323-326
Yeh, P. (1986). Exact solution of a nonlinear model of two-wave mixing in Kerr media. J. Opt.
Soc. Am. B, Vol. 3, No. 5, 747-750
Yeh, P. (1989). Two-wave mixing in nonlinear media. IEEE J. Quantum Electron., Vol. 25, No.
3, 484-519