Fuel Injection Part 3 ppt
Bạn đang xem bản rút gọn của tài liệu. Xem và tải ngay bản đầy đủ của tài liệu tại đây (649.1 KB, 20 trang )
Liquid Sprays Characteristics in Diesel Engines 33
Sauters medium diameter according to (Hiroyasu & Arai, 1990) and (Hiroyasu et al., 1989)
1.
For incomplete spray
0,37 -0,47
0,25
-0,32
l l
g g
μ ρ
SMD = 0,38d Re We
μ ρ
(34)
2.
For complete spray
-0,28
l l o
SMD = 8,7 Re We d (35)
These formulae have been the most used to determine Sauters medium diameter, even
though these correlations experimentally obtained have been modified over the years, they
maintain a very important basis in which to determine Sauters medium diameter. Each of
these formulae may experience further modifications and better approximations according
to the quality of the specific model or experiment.
4. Measurement techniques
Some problems of fluid mechanics are complex where multiphase systems are concern and
when combustion phenomena are produced. In many cases current knowledge is still
incomplete due to the complexity of the physical-chemical processes: (non-stationary
processes, irreversible processes and out-of-balance chemical reactions) that occur at the
limits of different scientific disciplines such as fluid mechanics, thermodynamics and
chemistry. In order to progress in its study we need available experimental data that
provide information of the different processes and degrees of interest for the study, such as
for example, mass and energy transport, movement and the size of particles, concentration
of the different species, thermodynamic properties, and chemical composition among
others.
The physical phenomena of interaction matter-radiation (absorption, dispersion,
interference, diffraction, among others) are very sensitive to small variations in the localize
physical parameters of the fluid, and furthermore they do not interact with the physical
processes in the environment of fluid mechanics, and so are useful in the analysis of these
problems. Technological advance in diverse fields basically optics, electronics and
information technology have allowed for this development of equipment able to measure
some localized physical parameters of fluids in a very precise way, and are the basis for the
development of optical techniques of measurement and visualization used in studies of
fluid mechanics.
4.1. Classical visualization techniques
The classical visualization methods are based on the variations of the refraction rate that are
produced in the fluids heart due to the changes in its physical properties. When an beam of
light propagates through a fluid, the variations of the refraction rate causes variations in
both the intensity and in wave phase, therefore the emerging light contains information of
the fluid properties in the light beam trajectory propagation. Basically these optical
techniques can be divided in 3 types: Shadowgraphy, Schlieren and Interferometry, which
have been used since the 1860’s, (Foucault, 1859) in France and (Toepler, 1864) in Germany
gave the first insights of the Schlieren technique. Toepler was the first to develop this
technique for the study of liquids and gas flow, and later on used by (Hayashi et al., 1984)
and (Konig & Sheppard, 1990), among others.
-Shadowgraphy: the environment is illuminated with a straightening of a light beam and the
image is taken
after the emerging light propagates freely through the space. The
visualization technique with diffused rear illumination is a similar technique but the
environment is lit up with a diffuse beam light. The difference between these techniques
consists on placing a diffuser between the beam and the environment to illuminate. These
techniques allow visualizing the liquid phase of the fuel spray and are greatly used in the
study of the injection process of combustion internal engines. The visualization with rear
diffused illumination technique allows the estimation of the different macroscopic
parameters in an injection process. (Zaho & Ladommatos, 2001) have studied the spray
penetration and consider this technique to be reliable and easy to use for this type of
analysis.
-Schlieren photography: this technique is similar to that of the shadowgraphy, the difference
is that the image is taken after a spatial filtering
in the image plane of the light source.
Adjusting adequately the spatial filtering
dimensions it is possible to visualize both the
liquid and vapour phase of the fuel spray, but not to quantify them. These techniques have
been used in the injection and combustion processes of the internal combustion engine
(Preussner et al., 1998), (Spicher & Kollmeire, 1986) and (Spicher et al., 1991), as well as in
the analysis of propulsion systems (Murakamis & Papamoschou, 2001) and (Papampschou,
2000).
4.2. Scattering techniques
The classical visualization techniques incorporate the information throughout the beams
propagation trajectory, by which the information about the existing three-dimensional
structures in the vessel
of the fluid is lost. This information can be obtained illuminating the
fluid with planes of light and taking pictures of the dispersed light by the environment,
normally in the perpendicular direction of the plane. This kind of visualization techniques
can be included in a much general group which is the scattering technique. The light
scattering phenomena can be of two types, elastic or inelastic, depending on if the process
produces or not the radiation frequency.
4.2.1. Elastic scattering techniques
The elastic dispersion phenomena of light are studied within the theory of Lorenz-Mie.
There are basically two approximations depending on the size of the particles: Mie
scattering and Rayleigh scattering.
-The Mie scattering is an interaction of the elastic type of light with particles of much greater
size than that of its wave length (droplets, ligaments, among others). The characteristics of
the scattered light are related to the form, size, refraction rate and number of scattering
particles. These properties are the basis of the different optical techniques of measurement
described as follows:
Fuel Injection34
1.
Visualization with a laser sheet the fluid is illuminated with a laser sheet beam
obtaining images of the scattered light (Mie regime), normally on the perpendicular
direction of the sheet
. This technique allows estimating the macroscopic characteristics
of fuel sprays and analysing the existence of internal structures, ligaments, among
others. This technique is one of the most used in the study of the injection process in an
internal combustion engine (Dec, 1992) and (Preussner et al., 1998).
2.
Technique of laser anemometry: it is based on the interaction of coherent light with the
existing particles in movement inside the heart of the fluid in such a way that the sizes
of these particles allow them to be treated in Mie scattered imaging. These interactions
produce a change in the frequency of radiation (Doppler Effect) that can be related to
both the speed and size of the particles. In the so called Laser Doppler Anemometry
(LDA), two coherent light beams interact in one region (control volume) with the
existing moving particles in the fluid and the fluctuation of the disseminated light
intensity allows the estimation of the particles speed. (The obtained light intensity is
basically intensity with a background modulated by a cosine function, whose temporal
variation depends solely on the frequencies of the dispersed beams. The frequency of
modulation for this signal can be related to the velocity of the particles). The Phase
Doppler Anemometry (PDA) is based on the same principle but it uses several photo
sensors placed in different spatial positions. With which it’s possible to estimate the
diameter of the diffusive particles considering them spherical by the temporal phase lag
between signals received by each photo detector. This technique requires a series of
optical accessories that difficult its use in measurement of a real thermo engine.
Although some investigators
(Auriemma et al., 2001), (Corcione et al., 1998), (Cossali et
al., 1996), (Georjon et al., 1997) and (Guerrassi & Champoussin, 1996) have used the
phase Doppler anemometry to develop very specific analysis, the mayor usage is still
the characterization of the distribution of diameters and velocities of fuel droplets in
accessible optical models that simulate similar conditions of those found in real thermal
engines (Arrègle, 1998) and (Jiménez et al., 2000).
3.
The velocimetry imaging techniques allow velocity field measuring in a fluids plane
that is illuminated with a screen of light. There are several ways to use these techniques,
depending on the method selected to register and to process information, however all
of them are very important: in Particle Image Velocimetry (PIV) the fluid is illuminated
with several light pulses and the instant images are registered using multiple exposure
techniques. The instant velocities are obtained dividing the particles displacement in
each time consecutive image by
two pulses. In Particle Shadow Velocimetry the fluid is
illuminated in a long period of time in which the displacement of the particles are
registered as lines on the image and the velocities are calculated dividing the line length
by
time interval. In Particle Tracking Velocimetry a series of consecutive exposures take
place (several light pulses) in one image and the velocity is estimated by tracking the
particles. The velocimetry techniques are used mainly to analyse flow of gases en the
thermal engine. Some of the most recent applications for this technique can be found in
the literature (Choi & Guezennec, 1999), (Kakuhou et al., 1999), (Nauwerck et al., 2000),
(Neussert et al., 1995), and (Trigui et al., 1994), where the main application is focussed
to the study of mixture formation inside the combustion chamber of a thermal engine,
furthermore it considered to be one of the best techniques for this kind of analysis.
4.
Rayleigh scattering is of the elastic kind, where the size of particles is much smaller of
that of the lights wavelength, for example the gas molecules. The intensity of the
scattered light is proportional to the total density of all kinds of existing particles inside
the illuminated zone and provides images of global concentration of all the species,
although it doesn’t allow discrimination between them. Furthermore for example, the
Rayleigh signal for a particle approximate 1 µm is close to twenty orders of magnitude
lower than the Mie signal, for which the signal is highly affected by both the presence of
large particles and by the background light. The two most commonly used procedures
to reduce the interference of particles are shown by (Zhao et al., 1993). The main
researchers using the Rayleigh technique (Espey & Dec, 1994), (Lee & Foster, 1995) and
(Zhao et al., 1991) have been basically to determine concentrations of vapour and liquid
phases and mainly in zones with high flame presence. As well as in the temperature
measure and species concentration for the combustion diagnostic.
4.2.2. Inelastic scattering techniques
On the other hand, the inelastic scattering of light is studied in the quantum mechanics field,
specifically in the study of matter-radiation interaction phenomena. These phenomena are
extremely sensitive to the frequency of radiation and the species chemical composition
because they depend on electronic transitions between molecular energy levels caused by
the absorption of photons of defined frequency that stimulate the molecules to higher
energetic conditions. After which the molecules come to stable conditions releasing radiant
energy where its spectral characteristics are also very well defined. Different optical
techniques of measure are bases on these phenomena, detailed as follows:
-Laser Induced Incandescence is a technique based on the thermal emission that is produced
when the carbon particles are stimulated with a very intense electromagnetic radiation. The
obtained signal is proportional to the volume fraction of the carbon particles concentrated in
the measured zone. Because of this, the technique is very useful for the study of combustion
processes (Dec, 1992), (Dec et al., 1991), (Dec & Espey, 1992), (Winklhoefer et al., 1993) and
(Zhao & Ladommatos, 1998), mainly to determine the qualitative distribution of soot in the
high radiation zone during a injection-combustion process.
-Laser Induced Fluorescence (LIF) is a technique based on the fluorescent properties that
some molecules present. When these molecules absorb electromagnetic energy of a
determine frequency they acquire a higher energetic condition (stimulation) and afterwards
they return to their original energetic state releasing this energy (fluorescence). The spectral
characteristics of this radiation are determined by the molecules characteristics. If the fluid
doesn’t have fluorescent molecules, molecular tracers that present fluorescence can be
added. For example: NO, NO
2
, acetone, biacetyl, rodamina, or different colorants. The
fluorescent signal is proportional to the density of the tracers inside the illuminated zone. In
many cases the environment is illuminated using laser beam sheet and the technique is then
known as planar induced laser fluorescence (PLIF). In the planar laser induced exciplex
fluorescence (PLIEF) tracers called exciplex (complex excitation), like for example:
naphthalene mixtures and TMPD (tetramethyl-1,4-phenylenediamine) that allow to separate
spectrally the corresponding liquid and vapour phase fluorescence of a biphasic system, and
therefore measure simultaneously each ones concentration (Juliá, 2003). Although this
Liquid Sprays Characteristics in Diesel Engines 35
1.
Visualization with a laser sheet the fluid is illuminated with a laser sheet beam
obtaining images of the scattered light (Mie regime), normally on the perpendicular
direction of the sheet
. This technique allows estimating the macroscopic characteristics
of fuel sprays and analysing the existence of internal structures, ligaments, among
others. This technique is one of the most used in the study of the injection process in an
internal combustion engine (Dec, 1992) and (Preussner et al., 1998).
2.
Technique of laser anemometry: it is based on the interaction of coherent light with the
existing particles in movement inside the heart of the fluid in such a way that the sizes
of these particles allow them to be treated in Mie scattered imaging. These interactions
produce a change in the frequency of radiation (Doppler Effect) that can be related to
both the speed and size of the particles. In the so called Laser Doppler Anemometry
(LDA), two coherent light beams interact in one region (control volume) with the
existing moving particles in the fluid and the fluctuation of the disseminated light
intensity allows the estimation of the particles speed. (The obtained light intensity is
basically intensity with a background modulated by a cosine function, whose temporal
variation depends solely on the frequencies of the dispersed beams. The frequency of
modulation for this signal can be related to the velocity of the particles). The Phase
Doppler Anemometry (PDA) is based on the same principle but it uses several photo
sensors placed in different spatial positions. With which it’s possible to estimate the
diameter of the diffusive particles considering them spherical by the temporal phase lag
between signals received by each photo detector. This technique requires a series of
optical accessories that difficult its use in measurement of a real thermo engine.
Although some investigators
(Auriemma et al., 2001), (Corcione et al., 1998), (Cossali et
al., 1996), (Georjon et al., 1997) and (Guerrassi & Champoussin, 1996) have used the
phase Doppler anemometry to develop very specific analysis, the mayor usage is still
the characterization of the distribution of diameters and velocities of fuel droplets in
accessible optical models that simulate similar conditions of those found in real thermal
engines (Arrègle, 1998) and (Jiménez et al., 2000).
3.
The velocimetry imaging techniques allow velocity field measuring in a fluids plane
that is illuminated with a screen of light. There are several ways to use these techniques,
depending on the method selected to register and to process information, however all
of them are very important: in Particle Image Velocimetry (PIV) the fluid is illuminated
with several light pulses and the instant images are registered using multiple exposure
techniques. The instant velocities are obtained dividing the particles displacement in
each time consecutive image by
two pulses. In Particle Shadow Velocimetry the fluid is
illuminated in a long period of time in which the displacement of the particles are
registered as lines on the image and the velocities are calculated dividing the line length
by
time interval. In Particle Tracking Velocimetry a series of consecutive exposures take
place (several light pulses) in one image and the velocity is estimated by tracking the
particles. The velocimetry techniques are used mainly to analyse flow of gases en the
thermal engine. Some of the most recent applications for this technique can be found in
the literature (Choi & Guezennec, 1999), (Kakuhou et al., 1999), (Nauwerck et al., 2000),
(Neussert et al., 1995), and (Trigui et al., 1994), where the main application is focussed
to the study of mixture formation inside the combustion chamber of a thermal engine,
furthermore it considered to be one of the best techniques for this kind of analysis.
4.
Rayleigh scattering is of the elastic kind, where the size of particles is much smaller of
that of the lights wavelength, for example the gas molecules. The intensity of the
scattered light is proportional to the total density of all kinds of existing particles inside
the illuminated zone and provides images of global concentration of all the species,
although it doesn’t allow discrimination between them. Furthermore for example, the
Rayleigh signal for a particle approximate 1 µm is close to twenty orders of magnitude
lower than the Mie signal, for which the signal is highly affected by both the presence of
large particles and by the background light. The two most commonly used procedures
to reduce the interference of particles are shown by (Zhao et al., 1993). The main
researchers using the Rayleigh technique (Espey & Dec, 1994), (Lee & Foster, 1995) and
(Zhao et al., 1991) have been basically to determine concentrations of vapour and liquid
phases and mainly in zones with high flame presence. As well as in the temperature
measure and species concentration for the combustion diagnostic.
4.2.2. Inelastic scattering techniques
On the other hand, the inelastic scattering of light is studied in the quantum mechanics field,
specifically in the study of matter-radiation interaction phenomena. These phenomena are
extremely sensitive to the frequency of radiation and the species chemical composition
because they depend on electronic transitions between molecular energy levels caused by
the absorption of photons of defined frequency that stimulate the molecules to higher
energetic conditions. After which the molecules come to stable conditions releasing radiant
energy where its spectral characteristics are also very well defined. Different optical
techniques of measure are bases on these phenomena, detailed as follows:
-Laser Induced Incandescence is a technique based on the thermal emission that is produced
when the carbon particles are stimulated with a very intense electromagnetic radiation. The
obtained signal is proportional to the volume fraction of the carbon particles concentrated in
the measured zone. Because of this, the technique is very useful for the study of combustion
processes (Dec, 1992), (Dec et al., 1991), (Dec & Espey, 1992), (Winklhoefer et al., 1993) and
(Zhao & Ladommatos, 1998), mainly to determine the qualitative distribution of soot in the
high radiation zone during a injection-combustion process.
-Laser Induced Fluorescence (LIF) is a technique based on the fluorescent properties that
some molecules present. When these molecules absorb electromagnetic energy of a
determine frequency they acquire a higher energetic condition (stimulation) and afterwards
they return to their original energetic state releasing this energy (fluorescence). The spectral
characteristics of this radiation are determined by the molecules characteristics. If the fluid
doesn’t have fluorescent molecules, molecular tracers that present fluorescence can be
added. For example: NO, NO
2
, acetone, biacetyl, rodamina, or different colorants. The
fluorescent signal is proportional to the density of the tracers inside the illuminated zone. In
many cases the environment is illuminated using laser beam sheet and the technique is then
known as planar induced laser fluorescence (PLIF). In the planar laser induced exciplex
fluorescence (PLIEF) tracers called exciplex (complex excitation), like for example:
naphthalene mixtures and TMPD (tetramethyl-1,4-phenylenediamine) that allow to separate
spectrally the corresponding liquid and vapour phase fluorescence of a biphasic system, and
therefore measure simultaneously each ones concentration (Juliá, 2003). Although this
Fuel Injection36
technique has much application in injection-combustion processes (Felton et al., 1995),
(Fujimoto et al., 1997), (Hiroshi et al., (1997), (Kido et al, 1993) and (Kim & Ghandhi, 2001), it
is not considered to be the most appropriate to detect species when compared to other, like
for example: Mie-Scaterring. This is due to the incoherencies presented when detecting
species in these types of processes (Preussner et al., 1998) and (Takagi et al., 1998).
Phosphorescent particle tracking (PPT) is a similar technique to that of particle tracking
velocimetry (PTV). The phosphorescence is an inelastic diffusion of light characterized by it
long temporal duration, much higher than that of fluorescence, which makes it ideal to track
the movement of particles in the fluid.
5. Experimental characterization of the liquid length penetration
5.1. Introduction
The main objective of this section is to carry out the characterization of the liquid length
penetration of a diesel spray. To achieve this it has been necessary to consider a group of
experiments which allow the determination of the influence that the injection parameters
and the thermodynamic variables have upon the penetration of a diesel spray in evaporative
conditions. The first developed study is based on the analysis of the penetration of the spray
in its liquid phase, where it is expected to define the degree of influence that the following
have over this phenomena: thermodynamic variables (pressure, temperature and density)
present in the combustion chamber at the moment when the fuel is injected, the injection
pressure and the geometry of the nozzle. To make this study it’s necessary to use the
ombroscopy
technique for the taking of digital images, as well as an acquisition system to
process data. It is to point out that the ombroscopy
has been the most used technique in the
macroscopic characterization of diesel sprays, specifically in the study of the liquid phase
penetration. As mentioned in section 4, the techniques of measure to carry out studies of the
liquid phase of diesel sprays are very diverse. The most used until know are expressed in
this chapters literature. (Cambell et al., 1995), (Canaan et al., 1998), (Christoph & Dec, 1995),
(Felton et al., 1995), (Hiroyasu & Miao, 2002) and (Knapp et al., 1999).
5.2. Experimental work approach
A working plan that groups the different experiments to carry out has been structured in
such a way to analyse qualitatively the injection process. To achieve this, the experimental
work has been planned as follows:
The use of the experimental in system with the inert atmosphere method and through the
ombroscopy
technique analyse the penetration of the liquid phase of the diesel spray.
- Parametric analysis to consider:
1. Influence of the injection process on the liquid length penetration.
2. Influence of the diameter of the nozzle on the liquid length penetration.
The analysis of the liquid length penetration is useful to determine the geometric design of
combustion chambers for high speed regime diesel engines with direct injection. For
example, in low speed regime and light load the hydrocarbon emissions will be reduced if
the contact of the spray (liquid length) with the combustion chambers wall is avoided. For
high speed regimes and heavy loads, the reduction of fumes can be achieved by contact
between the spray and the chamber wall. Because of these, the necessity to measure the
liquid penetration in diesel engines of direct injection emerges, motivating the use of
measure techniques even more complex and sophisticated.
In previous studies (Christoph & Dec, 1995) investigated the effects that temperature and
the fluids density have on the liquid phase penetration. In this study they used a Diesel
engine witch optical access views, and through the elastic-scatter technique they obtained
images of the spray. (Zhang et al., 1997) analyzed the effects that the injection pressures,
diameter of the nozzle and admission air temperature have on liquid length penetration. For
this they used a compression machine which had an equivalent compression ratio to that
found in a Diesel engine. In this analysis an argon laser beam was used as the light source
and an E-10 camera was also used to capture the images. (Siebers, 1998) investigated the
maximum axial penetration of the liquid phase of an evaporated diesel spray in a chamber
of constant volume, using the Mie-scattered technique for image capturing. The main
altered parameters where the injection pressure, orifice diameter of the nozzle, temperature
and density of the working fluid in the inside of the chamber.
The investigation of the sprays liquid phase for a common rail system at high temperatures
was made by (Bruneaux & Lemenand, 2002). The variation in parameters in this
investigation where: the injection pressure, the temperature of the working fluid and the
diameter of the nozzle. This study was made in a chamber similar to the one used by
(Verhoeven et al., 1998), in which it was possible to maintain high pressures and
temperatures inside the chamber and so simulating similar conditions found in a real Diesel
engine. The technique of measure used was based on a light source supported by a planar
laser induced exciplex fluorescence system and a charged-coupled device (CCD) camera to
capture images. It’s evident that each investigator uses in his experiments defined and
heterogeneous techniques of measure. However occasionally and in some complexity
degree the final results tend to be very similar independently of the used, reason why the
motivation to develop the basis for the experiments presented in this chapter arose with one
of the most flexible visualization techniques, the ombroscopy.
The characterization of the liquid length penetration of an evaporated diesel spray was done
under the following methodology:
1.
Experimental system configuration: to undertake the experiments that lead to
obtain information about the liquid length penetration of the spray without flame,
it has been necessary to form the experimental system in an inert atmosphere.
Furthermore to conceive as a first phase the use of ombroscopy
technique to obtain
images of the liquid phase of the spray (Figure 5 shows the schematics diagram of
the global experimental setup configuration).
Liquid Sprays Characteristics in Diesel Engines 37
technique has much application in injection-combustion processes (Felton et al., 1995),
(Fujimoto et al., 1997), (Hiroshi et al., (1997), (Kido et al, 1993) and (Kim & Ghandhi, 2001), it
is not considered to be the most appropriate to detect species when compared to other, like
for example: Mie-Scaterring. This is due to the incoherencies presented when detecting
species in these types of processes (Preussner et al., 1998) and (Takagi et al., 1998).
Phosphorescent particle tracking (PPT) is a similar technique to that of particle tracking
velocimetry (PTV). The phosphorescence is an inelastic diffusion of light characterized by it
long temporal duration, much higher than that of fluorescence, which makes it ideal to track
the movement of particles in the fluid.
5. Experimental characterization of the liquid length penetration
5.1. Introduction
The main objective of this section is to carry out the characterization of the liquid length
penetration of a diesel spray. To achieve this it has been necessary to consider a group of
experiments which allow the determination of the influence that the injection parameters
and the thermodynamic variables have upon the penetration of a diesel spray in evaporative
conditions. The first developed study is based on the analysis of the penetration of the spray
in its liquid phase, where it is expected to define the degree of influence that the following
have over this phenomena: thermodynamic variables (pressure, temperature and density)
present in the combustion chamber at the moment when the fuel is injected, the injection
pressure and the geometry of the nozzle. To make this study it’s necessary to use the
ombroscopy
technique for the taking of digital images, as well as an acquisition system to
process data. It is to point out that the ombroscopy
has been the most used technique in the
macroscopic characterization of diesel sprays, specifically in the study of the liquid phase
penetration. As mentioned in section 4, the techniques of measure to carry out studies of the
liquid phase of diesel sprays are very diverse. The most used until know are expressed in
this chapters literature. (Cambell et al., 1995), (Canaan et al., 1998), (Christoph & Dec, 1995),
(Felton et al., 1995), (Hiroyasu & Miao, 2002) and (Knapp et al., 1999).
5.2. Experimental work approach
A working plan that groups the different experiments to carry out has been structured in
such a way to analyse qualitatively the injection process. To achieve this, the experimental
work has been planned as follows:
The use of the experimental in system with the inert atmosphere method and through the
ombroscopy
technique analyse the penetration of the liquid phase of the diesel spray.
- Parametric analysis to consider:
1. Influence of the injection process on the liquid length penetration.
2. Influence of the diameter of the nozzle on the liquid length penetration.
The analysis of the liquid length penetration is useful to determine the geometric design of
combustion chambers for high speed regime diesel engines with direct injection. For
example, in low speed regime and light load the hydrocarbon emissions will be reduced if
the contact of the spray (liquid length) with the combustion chambers wall is avoided. For
high speed regimes and heavy loads, the reduction of fumes can be achieved by contact
between the spray and the chamber wall. Because of these, the necessity to measure the
liquid penetration in diesel engines of direct injection emerges, motivating the use of
measure techniques even more complex and sophisticated.
In previous studies (Christoph & Dec, 1995) investigated the effects that temperature and
the fluids density have on the liquid phase penetration. In this study they used a Diesel
engine witch optical access views, and through the elastic-scatter technique they obtained
images of the spray. (Zhang et al., 1997) analyzed the effects that the injection pressures,
diameter of the nozzle and admission air temperature have on liquid length penetration. For
this they used a compression machine which had an equivalent compression ratio to that
found in a Diesel engine. In this analysis an argon laser beam was used as the light source
and an E-10 camera was also used to capture the images. (Siebers, 1998) investigated the
maximum axial penetration of the liquid phase of an evaporated diesel spray in a chamber
of constant volume, using the Mie-scattered technique for image capturing. The main
altered parameters where the injection pressure, orifice diameter of the nozzle, temperature
and density of the working fluid in the inside of the chamber.
The investigation of the sprays liquid phase for a common rail system at high temperatures
was made by (Bruneaux & Lemenand, 2002). The variation in parameters in this
investigation where: the injection pressure, the temperature of the working fluid and the
diameter of the nozzle. This study was made in a chamber similar to the one used by
(Verhoeven et al., 1998), in which it was possible to maintain high pressures and
temperatures inside the chamber and so simulating similar conditions found in a real Diesel
engine. The technique of measure used was based on a light source supported by a planar
laser induced exciplex fluorescence system and a charged-coupled device (CCD) camera to
capture images. It’s evident that each investigator uses in his experiments defined and
heterogeneous techniques of measure. However occasionally and in some complexity
degree the final results tend to be very similar independently of the used, reason why the
motivation to develop the basis for the experiments presented in this chapter arose with one
of the most flexible visualization techniques, the ombroscopy.
The characterization of the liquid length penetration of an evaporated diesel spray was done
under the following methodology:
1.
Experimental system configuration: to undertake the experiments that lead to
obtain information about the liquid length penetration of the spray without flame,
it has been necessary to form the experimental system in an inert atmosphere.
Furthermore to conceive as a first phase the use of ombroscopy
technique to obtain
images of the liquid phase of the spray (Figure 5 shows the schematics diagram of
the global experimental setup configuration).
Fuel Injection38
Fig. 5. Schematic diagram of the experimental setup.
2.
Configuration of the group of experiments: The considered group of experiments
defines the variables to be analysed, as well to determine their influence on the
liquid length penetration of the spray. The main variables for study are:
-Injection pressure.
-Orifice diameter of the nozzle.
-Working fluid density constant.
Figure 6 shows the schematics of the nozzle that has been used in the experiments. It has
been experimented with five nozzles of similar geometry with single axisymetric orifice and
same kind of jacket.
Fig. 6. Scheme of the nozzle used in the experiments.
Four nozzles were tested at four different injection pressures, while the intake temperature
and pressure were kept constant at 70 °C and 1.3 bar, respectively. The four nozzles have
single axisymmetric holes with 115, 130, 170 and 200 µm in diameter, and the injection
pressure was 300, 700, 1100 and 1300 bar. Table 1 shows the estimated mass flow rates and
discharge coefficients for each nozzle and injection pressure. A diagnostic thermodynamic
model developed by (Martínez et al., 2007) was employed to calculate the working fluid
properties (temperature and density) in the cylinder. Cylinder pressure was measured with
a transducer installed on a lateral wall. The pressure at bottom dead center was measured
with a resistive transducer located between the prechamber intake and the chamber itself. A
temperature sensor was also installed in the prechamber intake to measure the working
fluid temperature at bottom dead centre. Since pressure and temperature data were
available, thermodynamic conditions were characterized at top dead center ± 3 crank angle
degrees, which is considered the most stable region during the fuel injection process
(Martínez et al., 2007).
Injection
pressure
(bar)
Nozzle
diameter
(μm)
Measured mass
flow rate
(g/s)
Theoretical
mass flow rate
(g/s)
C
d
300 115 1.53 2.04 0.746
700 115 2.52 3.38 0.745
1100 115 3.13 4.32 0.725
1300 115 3.34 4.72 0.708
300 130 2.27 2.61 0.870
700 130 3.50 4.32 0.810
1100 130 4.05 5.52 0.734
1300 130 4.42 6.03 0.733
300 170 3.36 4.46 0.753
700 170 5.32 7.38 0.721
1100 170 6.47 9.43 0.686
1300 170 6.87 10.30 0.666
300 200 3.63 6.18 0.587
700 200 6.74 10.20 0.660
1100 200 8.53 13.10 0.653
1300 200 9.29 14.30 0.651
Table 1. Injection parameters and their corresponding mass flow rates and discharge
coefficients.
5.3. Mathematical correlation
Liquid phase penetration of a jet injected into an inert environment has well defined stages.
The first stage begins with the injection and ends when the jet breaks up. This is the intact
length stage or the first break-up regime, (Hiroyasu & Aray, 1990) suggested the following
correlation to estimate the time for the first break-up regime to occur:
f n
b
d a
15.8ρ d
t =
C 2ρ ΔP
(36)
where Cd is the discharge coefficient, dn (µm) is the nozzle diameter, ΔP (Pa) is the pressure
drop through the nozzle, and ρ
f
and ρ
a
(kg/m
3
) are the fuel and working fluid densities,
respectively. For the particular conditions studied here, Equation (36) predicts times for the
first break-up regime between 25 and 30 µs, and our experimental measurements indicate an
average time of 50 µs. Experimental evidence (Ahmadi et al., 1991), (Auriemma et al., 2001),
(Christoph & Dec, 1995) and (Martínez et al., 2007) indicates that the liquid penetration
Liquid Sprays Characteristics in Diesel Engines 39
Fig. 5. Schematic diagram of the experimental setup.
2.
Configuration of the group of experiments: The considered group of experiments
defines the variables to be analysed, as well to determine their influence on the
liquid length penetration of the spray. The main variables for study are:
-Injection pressure.
-Orifice diameter of the nozzle.
-Working fluid density constant.
Figure 6 shows the schematics of the nozzle that has been used in the experiments. It has
been experimented with five nozzles of similar geometry with single axisymetric orifice and
same kind of jacket.
Fig. 6. Scheme of the nozzle used in the experiments.
Four nozzles were tested at four different injection pressures, while the intake temperature
and pressure were kept constant at 70 °C and 1.3 bar, respectively. The four nozzles have
single axisymmetric holes with 115, 130, 170 and 200 µm in diameter, and the injection
pressure was 300, 700, 1100 and 1300 bar. Table 1 shows the estimated mass flow rates and
discharge coefficients for each nozzle and injection pressure. A diagnostic thermodynamic
model developed by (Martínez et al., 2007) was employed to calculate the working fluid
properties (temperature and density) in the cylinder. Cylinder pressure was measured with
a transducer installed on a lateral wall. The pressure at bottom dead center was measured
with a resistive transducer located between the prechamber intake and the chamber itself. A
temperature sensor was also installed in the prechamber intake to measure the working
fluid temperature at bottom dead centre. Since pressure and temperature data were
available, thermodynamic conditions were characterized at top dead center ± 3 crank angle
degrees, which is considered the most stable region during the fuel injection process
(Martínez et al., 2007).
Injection
pressure
(bar)
Nozzle
diameter
(μm)
Measured mass
flow rate
(g/s)
Theoretical
mass flow rate
(g/s)
C
d
300 115 1.53 2.04 0.746
700 115 2.52 3.38 0.745
1100 115 3.13 4.32 0.725
1300 115 3.34 4.72 0.708
300 130 2.27 2.61 0.870
700 130 3.50 4.32 0.810
1100 130 4.05 5.52 0.734
1300 130 4.42 6.03 0.733
300 170 3.36 4.46 0.753
700 170 5.32 7.38 0.721
1100 170 6.47 9.43 0.686
1300 170 6.87 10.30 0.666
300 200 3.63 6.18 0.587
700 200 6.74 10.20 0.660
1100 200 8.53 13.10 0.653
1300 200 9.29 14.30 0.651
Table 1. Injection parameters and their corresponding mass flow rates and discharge
coefficients.
5.3. Mathematical correlation
Liquid phase penetration of a jet injected into an inert environment has well defined stages.
The first stage begins with the injection and ends when the jet breaks up. This is the intact
length stage or the first break-up regime, (Hiroyasu & Aray, 1990) suggested the following
correlation to estimate the time for the first break-up regime to occur:
f n
b
d a
15.8ρ d
t =
C 2ρ ΔP
(36)
where Cd is the discharge coefficient, dn (µm) is the nozzle diameter, ΔP (Pa) is the pressure
drop through the nozzle, and ρ
f
and ρ
a
(kg/m
3
) are the fuel and working fluid densities,
respectively. For the particular conditions studied here, Equation (36) predicts times for the
first break-up regime between 25 and 30 µs, and our experimental measurements indicate an
average time of 50 µs. Experimental evidence (Ahmadi et al., 1991), (Auriemma et al., 2001),
(Christoph & Dec, 1995) and (Martínez et al., 2007) indicates that the liquid penetration
Fuel Injection40
length, LL, increases proportionally to the square root of time from the injection onset until
the second break-up regime is reached at time tr. Thereafter the liquid penetration length
varies little and hence it is considered constant from a macroscopic point of view. Therefore,
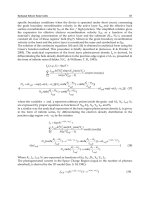
a mathematical correlation suitable to model the liquid penetration length is:
r
0 < t < t : LL t = α t (37)
r max
t > t : LL t = Cte = LL (38)
which is illustrated in Figure 7. Coefficients α and LL depend on numerous parameters,
such as the fluid thermodynamic conditions and geometrical parameters of the injection
system. A satisfactory mathematical correlation must take into account the effect of the
nozzle diameter, the discharge coefficient, the injection pressure, and the working fluid
density. These parameters have been previously found to be enough to characterize the
liquid penetration length (Bae & Kang, 2000), (Bae et al., 2000), (Bermúdez et al., 2002, 2003),
(Bracco, 1983), (Canaan et al., 1998) and (Chehroudi et al., 1985). It is therefore expected that
a detailed analysis of these parameters can yield an accurate correlation that can be of
assistance in the successful designing of combustion chambers required by modern heavy
duty diesel engines. In this paper we attempt power law correlations for α and LLmax
(Equations 39 and 40).
Fig. 7. Plot showing different stages of the considered model.
A B C D
n a in
y
d
α µ d ρ P C (39)
E F G H
max n a in
y
d
LL µ d ρ P C
(40)
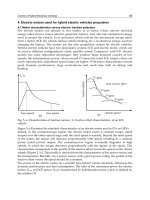
5.4 Determination of the fuel injection onset
The fuel injection onset can be determined assuming that LL increases proportionally to the
square root of time until the second break-up regime is reached at tr, i.e. LL = α t
1/2
for
0 < t < tr. Time tr is defined as the time when the ratio between LL to t
1/2
with a correlation
coefficient R
2
= 99 %. Coefficient α is estimated by fitting experimental data measured before
the second break-up regime is reached, as shown in Figure 8, where the experimental data
can be approximated by LL = 1.07 t
0.497
with a correlation coefficient R
2
= 99.8 %.
Fig. 8. Estimation of α and the fuel injection onset
5.5. Determination of the discharge coefficient
The discharge coefficients of each nozzle hole at the injection pressures studied here were
estimated using the following correlation:
f
d
f
m
C =
An 2ΔPρ
(41)
where the discharge coefficient C
d
is defined as the ratio of the mass flow rate injected in the
cylinder and the theoretical mass flow rate computed from the Bernoulli equation. The
mass flow rate of fuel injection was measured by a fuel rate indicator (EVI-IAV).
Experimental measurements provided enough data to estimate the discharge coefficient for
each nozzle and injected condition, which are shown in Table 1.
6. Results and discussion
Equation 42 is the best fit for predicting penetration length in the fuel injection process
before the second break-up regime, when :
r
tt
0
1
0.56 027 0.23 0.08
2
n a iny d
LL t = 6.47d ρ P C t
(42)
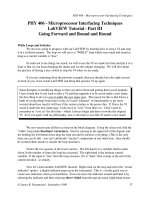
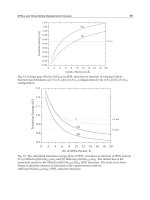
Figures 9 (a, b) and 10 (a, b) show a comparison between calculated (Equation 42) and
experimental liquid penetration lengths. In all cases curves and experimental data are in
good agreement and the correlation coefficient is R
2
= 93.3 %, which means only 6.7 % of all
data are not accounted by the proposed correlation. Analyzing Equation 42 we find that the
liquid length penetration is strongly affected by the nozzle diameter whose exponent in
Equation 42 is greatest. The density of the working fluid and the injection pressure have
comparable and inverted effects on the liquid penetration length, ∂LL/∂ρa ≈ − (P
inj
/ρ
a
)
(∂LL/∂P
inj
) or ∂ρa/∂P
inj
≈ − (ρ
a
/P
inj
). Additionally we notice from Equation 42 that the liquid
velocity penetration, ∂LL/∂t, is proportional to P
inj
0.23
, which is the same proportionality as
Liquid Sprays Characteristics in Diesel Engines 41
length, LL, increases proportionally to the square root of time from the injection onset until
the second break-up regime is reached at time tr. Thereafter the liquid penetration length
varies little and hence it is considered constant from a macroscopic point of view. Therefore,
a mathematical correlation suitable to model the liquid penetration length is:
r
0 < t < t : LL t = α t (37)
r max
t > t : LL t = Cte = LL (38)
which is illustrated in Figure 7. Coefficients α and LL depend on numerous parameters,
such as the fluid thermodynamic conditions and geometrical parameters of the injection
system. A satisfactory mathematical correlation must take into account the effect of the
nozzle diameter, the discharge coefficient, the injection pressure, and the working fluid
density. These parameters have been previously found to be enough to characterize the
liquid penetration length (Bae & Kang, 2000), (Bae et al., 2000), (Bermúdez et al., 2002, 2003),
(Bracco, 1983), (Canaan et al., 1998) and (Chehroudi et al., 1985). It is therefore expected that
a detailed analysis of these parameters can yield an accurate correlation that can be of
assistance in the successful designing of combustion chambers required by modern heavy
duty diesel engines. In this paper we attempt power law correlations for α and LLmax
(Equations 39 and 40).
Fig. 7. Plot showing different stages of the considered model.
A B C D
n a in
y
d
α µ d ρ P C (39)
E F G H
max n a in
y
d
LL µ d ρ P C
(40)
5.4 Determination of the fuel injection onset
The fuel injection onset can be determined assuming that LL increases proportionally to the
square root of time until the second break-up regime is reached at tr, i.e. LL = α t
1/2
for
0 < t < tr. Time tr is defined as the time when the ratio between LL to t
1/2
with a correlation
coefficient R
2
= 99 %. Coefficient α is estimated by fitting experimental data measured before
the second break-up regime is reached, as shown in Figure 8, where the experimental data
can be approximated by LL = 1.07 t
0.497
with a correlation coefficient R
2
= 99.8 %.
Fig. 8. Estimation of α and the fuel injection onset
5.5. Determination of the discharge coefficient
The discharge coefficients of each nozzle hole at the injection pressures studied here were
estimated using the following correlation:
f
d
f
m
C =
An 2ΔPρ
(41)
where the discharge coefficient C
d
is defined as the ratio of the mass flow rate injected in the
cylinder and the theoretical mass flow rate computed from the Bernoulli equation. The
mass flow rate of fuel injection was measured by a fuel rate indicator (EVI-IAV).
Experimental measurements provided enough data to estimate the discharge coefficient for
each nozzle and injected condition, which are shown in Table 1.
6. Results and discussion
Equation 42 is the best fit for predicting penetration length in the fuel injection process
before the second break-up regime, when :
r
tt 0
1
0.56 027 0.23 0.08
2
n a iny d
LL t = 6.47d ρ P C t
(42)
Figures 9 (a, b) and 10 (a, b) show a comparison between calculated (Equation 42) and
experimental liquid penetration lengths. In all cases curves and experimental data are in
good agreement and the correlation coefficient is R
2
= 93.3 %, which means only 6.7 % of all
data are not accounted by the proposed correlation. Analyzing Equation 42 we find that the
liquid length penetration is strongly affected by the nozzle diameter whose exponent in
Equation 42 is greatest. The density of the working fluid and the injection pressure have
comparable and inverted effects on the liquid penetration length, ∂LL/∂ρa ≈ − (P
inj
/ρ
a
)
(∂LL/∂P
inj
) or ∂ρa/∂P
inj
≈ − (ρ
a
/P
inj
). Additionally we notice from Equation 42 that the liquid
velocity penetration, ∂LL/∂t, is proportional to P
inj
0.23
, which is the same proportionality as
Fuel Injection42
for LL itself. On the other hand, an increase in the working fluid density causes the liquid
penetration resistance to rise, which yields a shortening in the liquid penetration length. It is
worth mentioning that the effect of ρa on LL reported here is in good agreement with
experimental data presented by (Dent, 1971), who suggested the following correlation:
1
-0.25
2
a
LL t µ ρ t (43)
Equation 42 reveals that under the experimental conditions studied here, 0.58 < Cd < 0.87,
the liquid penetration length is very insensitive to the value of the discharge coefficient,
which causes a maximum variation of the liquid penetration length of only about 3 %.
Fig. 9. Comparison between experimental data and the proposed correlation, equation 42.
(a): P
inj
= 300 bar and (b): P
inj
= 700 bar, ρ
a
= 26 kg/m
3
and Tg = 906 K.
Fig. 10. Comparison between experimental data and the proposed correlation, equation 42.
(a): P
inj
= 1100 bar and (b): P
inj
= 1300 bar, ρ
a
= 26 kg/m
3
and Tg = 906 K.
(a)
(b)
(a)
(b)
7. Conclusions and remarks
Experimental measurements were carried out to estimate the liquid penetration length of a
diesel fuel jet injected in an inert environment. The effects of the characteristic parameters,
i.e. the nozzle diameter, discharge coefficient, injection pressure, and working fluid density
were analyzed. The transient fuel injection process was recorded using optical access, and
the liquid penetration length before the second break-up regime was measured using the
ombroscopy technique. The aim of the present research is to generate a correlation that
accurately predicts liquid penetration length at conditions typical of modern Heavy Duty
common rail diesel engines operating with direct fuel injection. A statistical analysis of our
experimental measurements suggests a power function correlation to model the liquid
penetration length. The proposed model is in good agreement with experimental data and
yields a correlation coefficient R
2
= 93.3 %. Furthermore, the suggested correlation illustrates
important details about how the main parameters affect the fuel injection process. The
nozzle diameter has the greatest effect on liquid penetration length. A reduction in nozzle
diameter yields a shorter penetration length because it causes an earlier start of the second
break-up regime. Increasing the injection pressure provokes premature droplet break-up
within the jet, which results mainly due to cavitation at the nozzle exit. If the working fluid
density in the combustion chamber increases the penetration length is shorter and the
second break-up regime is delayed due to the free-share flow between the working fluid
and the fuel jet, which produces higher evaporation rates of droplets from the diesel jet.
Finally, under the experimental conditions studied here, the discharge coefficient has a
negligible effect on the liquid penetration length. However, the discharge coefficient
influences the cavitation phenomenon at the nozzle exit and modifies the droplet velocity
within the jet.
8. References
Ahmadi Befrui, Wieseler B. y Winklhofer E. (1991) “The propagation of Fuel Spray in a
Research Diesel Engine A Joint Numerical and Experimental Analysis". SAE
Technical Paper 910181.
Arai M., Tabata M., Shimizu M. y Hiroyasu H. (1984) “Disintegrating Process and Spray
Characterization of Fuel Jet Injected by a Diesel Nozzle". SAE Technical Paper
840275.
Arrègle J. (1998) Análisis de la Estructura y Dinámica Interna de Chorros Diesel. Tesis
Doctoral, E.T.S. Ingenieros Industriales. Universidad Politécnica de Valencia, Spain.
Auriemma M., Corcione F. E., DIMartino U. y Valentino G. (2001) “Analysis of the Intake
Flow in a Diesel Engine Head Using Dynamic Steady Flow Conditions". SAE
Technical Paper 2001-01-1307.
Bae Ch. y Kang J. (2000) “Diesel Spray Characteristics of Common-Rail VCO Nozzle
Injector". Congreso THIESEL-2000, Valencia, Spain.
Bae Ch. y Kang J. (2000) “Diesel Spray Development of VCO Nozzles for High Pressure
Direct-Injection". SAE Technical Paper 2000-01-1254.
Bae Ch., Yu J., Kang J., Cuenca R. y Lee O. (2000) “The Influence of Injector Parameters on
Diesel Spray". Congreso THIESEL-2002, Valencia, Spain.
Liquid Sprays Characteristics in Diesel Engines 43
for LL itself. On the other hand, an increase in the working fluid density causes the liquid
penetration resistance to rise, which yields a shortening in the liquid penetration length. It is
worth mentioning that the effect of ρa on LL reported here is in good agreement with
experimental data presented by (Dent, 1971), who suggested the following correlation:
1
-0.25
2
a
LL t µ ρ t (43)
Equation 42 reveals that under the experimental conditions studied here, 0.58 < Cd < 0.87,
the liquid penetration length is very insensitive to the value of the discharge coefficient,
which causes a maximum variation of the liquid penetration length of only about 3 %.
Fig. 9. Comparison between experimental data and the proposed correlation, equation 42.
(a): P
inj
= 300 bar and (b): P
inj
= 700 bar, ρ
a
= 26 kg/m
3
and Tg = 906 K.
Fig. 10. Comparison between experimental data and the proposed correlation, equation 42.
(a): P
inj
= 1100 bar and (b): P
inj
= 1300 bar, ρ
a
= 26 kg/m
3
and Tg = 906 K.
(a)
(b)
(a)
(b)
7. Conclusions and remarks
Experimental measurements were carried out to estimate the liquid penetration length of a
diesel fuel jet injected in an inert environment. The effects of the characteristic parameters,
i.e. the nozzle diameter, discharge coefficient, injection pressure, and working fluid density
were analyzed. The transient fuel injection process was recorded using optical access, and
the liquid penetration length before the second break-up regime was measured using the
ombroscopy technique. The aim of the present research is to generate a correlation that
accurately predicts liquid penetration length at conditions typical of modern Heavy Duty
common rail diesel engines operating with direct fuel injection. A statistical analysis of our
experimental measurements suggests a power function correlation to model the liquid
penetration length. The proposed model is in good agreement with experimental data and
yields a correlation coefficient R
2
= 93.3 %. Furthermore, the suggested correlation illustrates
important details about how the main parameters affect the fuel injection process. The
nozzle diameter has the greatest effect on liquid penetration length. A reduction in nozzle
diameter yields a shorter penetration length because it causes an earlier start of the second
break-up regime. Increasing the injection pressure provokes premature droplet break-up
within the jet, which results mainly due to cavitation at the nozzle exit. If the working fluid
density in the combustion chamber increases the penetration length is shorter and the
second break-up regime is delayed due to the free-share flow between the working fluid
and the fuel jet, which produces higher evaporation rates of droplets from the diesel jet.
Finally, under the experimental conditions studied here, the discharge coefficient has a
negligible effect on the liquid penetration length. However, the discharge coefficient
influences the cavitation phenomenon at the nozzle exit and modifies the droplet velocity
within the jet.
8. References
Ahmadi Befrui, Wieseler B. y Winklhofer E. (1991) “The propagation of Fuel Spray in a
Research Diesel Engine A Joint Numerical and Experimental Analysis". SAE
Technical Paper 910181.
Arai M., Tabata M., Shimizu M. y Hiroyasu H. (1984) “Disintegrating Process and Spray
Characterization of Fuel Jet Injected by a Diesel Nozzle". SAE Technical Paper
840275.
Arrègle J. (1998) Análisis de la Estructura y Dinámica Interna de Chorros Diesel. Tesis
Doctoral, E.T.S. Ingenieros Industriales. Universidad Politécnica de Valencia, Spain.
Auriemma M., Corcione F. E., DIMartino U. y Valentino G. (2001) “Analysis of the Intake
Flow in a Diesel Engine Head Using Dynamic Steady Flow Conditions". SAE
Technical Paper 2001-01-1307.
Bae Ch. y Kang J. (2000) “Diesel Spray Characteristics of Common-Rail VCO Nozzle
Injector". Congreso THIESEL-2000, Valencia, Spain.
Bae Ch. y Kang J. (2000) “Diesel Spray Development of VCO Nozzles for High Pressure
Direct-Injection". SAE Technical Paper 2000-01-1254.
Bae Ch., Yu J., Kang J., Cuenca R. y Lee O. (2000) “The Influence of Injector Parameters on
Diesel Spray". Congreso THIESEL-2002, Valencia, Spain.
Fuel Injection44
Bermúdez V., García J. M., Juliá E. y Martínez S. (2002) “Instalación Experimental para el
Estudio del Proceso de Inyección-Combustión en Motor Diesel de Inyección
Directa". XV Congreso Nacional de Ingeniería Mecánica, Cádiz, Spain.
Bermúdez V., García J. M., Juliá E. y Martínez S. (2003) “Engine with Optically Accessible
Cylinder Head: a Research Tool for Injection and Combustion Processes". SAE
Technical Paper 2003-01-1110.
Bracco F. V. (1983) Structure of High Speed Full Cone Sprays. Recent Advances in Gas
Dynamics, Plenum Publishing Corporation, N.Y.
Bruneaux G. y Lemenand C. (2002) “A Study of Liquid Phase Structure in Very High
Pressure Common Rail Diesel Injection Using Optical Diagnostics". Congreso
THIESEL-2002, Valencia, Spain.
Cambell P., Sinko K. y Chehroudi B. (1995) “Liquid and Vapour Phase Distributions in a
Piloted Diesel Fuel Spray". SAE Technical Paper 950445.
Canaan R. E., Dec J. E. y Green R. M. (1998) “The Influence of Fuel Volatility on the liquid-
Phase Fuel Penetration in a Heavy-Duty D.I. Diesel Engine". SAE Technical Paper
980510.
Chehroudi B., Chen S. H., Bracco F. V. y Onuma Y. (1985) “On the Intact Core of Full-Cone
Sprays". SAE Technical Paper 850216.
Choi W. Ch. y Guezennec Y. G. (1999) “Study of the Flow Field Development During the
Intake Stroke in an I.C. Engine Using 2-D PIV and 3-D PTV". SAE Technical Paper
1999-01-0957.
Christoph E. y Dec J. E. (1995) “The Effect of TDC Temperature and Density on the Liquid-
Phase Fuel Penetration in a D.I. Diesel Engine". SAE Technical Paper 952456.
Corcione F. E., Vaglieco B. M. y Valentino G. (1998) “A Study of Physical and Chemical
Delay in a High Swirl Diesel System Via Multiwavelength". SAE Technical Paper
980502.
Correas D. (1998) Estudio Teórico Experimental del Chorro Libre Diesel Isotermo. Tesis
Doctoral, E.T.S. Ingenieros Industriales. Universidad Politécnica de Valencia, Spain.
Cossali G. E., Gerla A., Coghe A. y Brunello G. (1996) “Effect of Gas Density and
Temperature on Air Entrainment in a Transient Diesel Spray". SAE Technical Paper
960862.
Dec J. E. (1992) “Soot Distribution in a D.I. Diesel Engine Using 2-D Imaging of Laser-
Induced Incandescence, Elastic Scattering, and Flame Luminosity". SAE Technical
Paper 920115.
Dec J. E., Axel O., Loye Z. y Siebers D. L. (1991) “Soot Distribution in a D.I. Diesel Engine
Using 2-D Laser-Induced Incandescence Imaging". SAE Technical Paper 910224.
Dec J. E. y Espey Ch. (1992) “Soot and Fuel Distribution in a D.I. Diesel Engine via 2-D
Imaging". SAE Technical Paper 922307.
Dent J. C. (1971) “A Basis for the Comparison of Various Experimental Methods for
Studying Spray Penetration". SAE Technical Paper 710571.
Espey C. y Dec J. (1994) “Quantitative 2-D Fuel Vapor Concentration Imaging in a Firing D.I.
Diesel Engine Using Planar Laser Induced Rayleigh Scattering". SAE Technical
Paper 940682.
Felton P. G., Kyristsis D. C. y Fulcher S. K. (1995) “LIF Visualization of Liquid Fuel in the
Intake Manifold during Cold Start". SAE Technical Paper 952464.
Foucault L. (1859) Memoiré sur la Construction des Télescopes en Verre Argenté, Vol. 5, pp.
197-237. Ann. Observ. Imp. París.
Fujimoto M., Tabata M. y Tanaka T. (1997) “Planar Measurements of NO in an S.I. Engine
Based on Laser Induced Fluorescence". SAE Technical Paper 970877.
Georjon T., Chalé H. G., Champoussin J. C., Marié J. L. y Lance M. (1997) “A Droplet
Tagging Method to Investigate Diesel Spray". SAE Technical Paper 970351.
G
ülder Ö. L., Snelling D. R. y Smallwood G. J. (1992) “Diesel Spray Structure Investigation
by Laser Diffraction and Sheet Illumination". SAE Technical Paper 920577.
Guerrassi N. y Champoussin J. C. (1996) “Experimental Study and Modelling of Diesel
Spray/Wall Impingement". SAE Technical Paper 960864.
Ha J., Sato G. T., Tanabe H., Fujimoto H. y Kuniyoshi H. (1983) “Investigation on the
Initial Part and the Spray Formation Delay of Diesel Spray". SAE Technical Paper
830451.
Hay N. y Jones P. L. (1972) “Comparison of the Various Correlations for Spray Penetration".
SAE Technical Paper 720776.
Hayasi T., Taki M., Kojima S. y Kondo T. (1984) “Photographic Observation of Knock With a
Rapid Compression and Expansion Machine". SAE Technical Paper 841336.
Heywood J. B. (1988) Internal Combustion Engine Fundamentals, pp. 522-536. McGraw-Hill
International Editions.
Hiroshi N., Hiroyuki E., Yoshihiro D., Matsuhei N., Hiroshi O. y Taizo S. (1997) “NO
Measurement in an Diesel Spray Flame Using Laser Induced Fluorescence". SAE
Technical Paper 970874.
Hiroyasu H. y Arai M. (1990) “Structures of Fuel Sprays in Diesel Engines". SAE Technical
Paper 900475.
Hiroyasu H., Arai M. y Tabata M. (1989) “Empirical Equations for the Sauter Mean Diameter
of a Diesel Spray". SAE Technical Paper 890464.
Hiroyasu H. y Kadota T. (1974) “Fuel Droplet Size Distribution in Diesel Combustion
Chamber". SAE Technical Paper 740715.
Hiroyasu H., Kodata T. y Arai M. (1980) Fuel Spray Characterization in Diesel Engines.
Combustion Modelling in Reciprocant Engines, Mattavi and Amann, Plenum
Press.
Hiroyasu H. y Miao H. (2002) “Optical Techniques for Diesel Spray and Combustion".
Congreso THIESEL-2002, Valencia, Spain.
Jaward B., Gulari E. y Heinen N. A. (1999) Characteristics of Intermittent Fuel Spray. 1999.
Jiménez J., Castro F. y Giménez B. (2000) “The Tip Evolution of an Evaporative Intermittent
Fuel Spray". Congreso THIESEL-2000, Valencia, Spain.
Juliá E. (2003) Medida de Concentraciones de Combustible en Chorros Diesel Mediante
Técnicas de Fluorescencia Inducida por Láser. Tesis Doctoral, E.T.S. Ingenieros
Industriales. Universidad Politécnica de Valencia, Spain.
Kakuhou A., Urushihara T., Itoh T. y Takagi Y. (1999) “Characteristics of Mixture Formation
in a Direct-Injection S.I. Engine With Optimized In-Cylinder Swirl Air Motion".
SAE Technical Paper 1999-01-0505.
Kido A., Ogawa H. y Miyamoto N. (1993) “Quantitative Measurements and Analysis of
Ambient Gas Entrainment into Intermittent Gas Jets By Laser-Induced Fluorescence
of Gas (LIFA)". SAE Technical Paper 930970.
Liquid Sprays Characteristics in Diesel Engines 45
Bermúdez V., García J. M., Juliá E. y Martínez S. (2002) “Instalación Experimental para el
Estudio del Proceso de Inyección-Combustión en Motor Diesel de Inyección
Directa". XV Congreso Nacional de Ingeniería Mecánica, Cádiz, Spain.
Bermúdez V., García J. M., Juliá E. y Martínez S. (2003) “Engine with Optically Accessible
Cylinder Head: a Research Tool for Injection and Combustion Processes". SAE
Technical Paper 2003-01-1110.
Bracco F. V. (1983) Structure of High Speed Full Cone Sprays. Recent Advances in Gas
Dynamics, Plenum Publishing Corporation, N.Y.
Bruneaux G. y Lemenand C. (2002) “A Study of Liquid Phase Structure in Very High
Pressure Common Rail Diesel Injection Using Optical Diagnostics". Congreso
THIESEL-2002, Valencia, Spain.
Cambell P., Sinko K. y Chehroudi B. (1995) “Liquid and Vapour Phase Distributions in a
Piloted Diesel Fuel Spray". SAE Technical Paper 950445.
Canaan R. E., Dec J. E. y Green R. M. (1998) “The Influence of Fuel Volatility on the liquid-
Phase Fuel Penetration in a Heavy-Duty D.I. Diesel Engine". SAE Technical Paper
980510.
Chehroudi B., Chen S. H., Bracco F. V. y Onuma Y. (1985) “On the Intact Core of Full-Cone
Sprays". SAE Technical Paper 850216.
Choi W. Ch. y Guezennec Y. G. (1999) “Study of the Flow Field Development During the
Intake Stroke in an I.C. Engine Using 2-D PIV and 3-D PTV". SAE Technical Paper
1999-01-0957.
Christoph E. y Dec J. E. (1995) “The Effect of TDC Temperature and Density on the Liquid-
Phase Fuel Penetration in a D.I. Diesel Engine". SAE Technical Paper 952456.
Corcione F. E., Vaglieco B. M. y Valentino G. (1998) “A Study of Physical and Chemical
Delay in a High Swirl Diesel System Via Multiwavelength". SAE Technical Paper
980502.
Correas D. (1998) Estudio Teórico Experimental del Chorro Libre Diesel Isotermo. Tesis
Doctoral, E.T.S. Ingenieros Industriales. Universidad Politécnica de Valencia, Spain.
Cossali G. E., Gerla A., Coghe A. y Brunello G. (1996) “Effect of Gas Density and
Temperature on Air Entrainment in a Transient Diesel Spray". SAE Technical Paper
960862.
Dec J. E. (1992) “Soot Distribution in a D.I. Diesel Engine Using 2-D Imaging of Laser-
Induced Incandescence, Elastic Scattering, and Flame Luminosity". SAE Technical
Paper 920115.
Dec J. E., Axel O., Loye Z. y Siebers D. L. (1991) “Soot Distribution in a D.I. Diesel Engine
Using 2-D Laser-Induced Incandescence Imaging". SAE Technical Paper 910224.
Dec J. E. y Espey Ch. (1992) “Soot and Fuel Distribution in a D.I. Diesel Engine via 2-D
Imaging". SAE Technical Paper 922307.
Dent J. C. (1971) “A Basis for the Comparison of Various Experimental Methods for
Studying Spray Penetration". SAE Technical Paper 710571.
Espey C. y Dec J. (1994) “Quantitative 2-D Fuel Vapor Concentration Imaging in a Firing D.I.
Diesel Engine Using Planar Laser Induced Rayleigh Scattering". SAE Technical
Paper 940682.
Felton P. G., Kyristsis D. C. y Fulcher S. K. (1995) “LIF Visualization of Liquid Fuel in the
Intake Manifold during Cold Start". SAE Technical Paper 952464.
Foucault L. (1859) Memoiré sur la Construction des Télescopes en Verre Argenté, Vol. 5, pp.
197-237. Ann. Observ. Imp. París.
Fujimoto M., Tabata M. y Tanaka T. (1997) “Planar Measurements of NO in an S.I. Engine
Based on Laser Induced Fluorescence". SAE Technical Paper 970877.
Georjon T., Chalé H. G., Champoussin J. C., Marié J. L. y Lance M. (1997) “A Droplet
Tagging Method to Investigate Diesel Spray". SAE Technical Paper 970351.
G
ülder Ö. L., Snelling D. R. y Smallwood G. J. (1992) “Diesel Spray Structure Investigation
by Laser Diffraction and Sheet Illumination". SAE Technical Paper 920577.
Guerrassi N. y Champoussin J. C. (1996) “Experimental Study and Modelling of Diesel
Spray/Wall Impingement". SAE Technical Paper 960864.
Ha J., Sato G. T., Tanabe H., Fujimoto H. y Kuniyoshi H. (1983) “Investigation on the
Initial Part and the Spray Formation Delay of Diesel Spray". SAE Technical Paper
830451.
Hay N. y Jones P. L. (1972) “Comparison of the Various Correlations for Spray Penetration".
SAE Technical Paper 720776.
Hayasi T., Taki M., Kojima S. y Kondo T. (1984) “Photographic Observation of Knock With a
Rapid Compression and Expansion Machine". SAE Technical Paper 841336.
Heywood J. B. (1988) Internal Combustion Engine Fundamentals, pp. 522-536. McGraw-Hill
International Editions.
Hiroshi N., Hiroyuki E., Yoshihiro D., Matsuhei N., Hiroshi O. y Taizo S. (1997) “NO
Measurement in an Diesel Spray Flame Using Laser Induced Fluorescence". SAE
Technical Paper 970874.
Hiroyasu H. y Arai M. (1990) “Structures of Fuel Sprays in Diesel Engines". SAE Technical
Paper 900475.
Hiroyasu H., Arai M. y Tabata M. (1989) “Empirical Equations for the Sauter Mean Diameter
of a Diesel Spray". SAE Technical Paper 890464.
Hiroyasu H. y Kadota T. (1974) “Fuel Droplet Size Distribution in Diesel Combustion
Chamber". SAE Technical Paper 740715.
Hiroyasu H., Kodata T. y Arai M. (1980) Fuel Spray Characterization in Diesel Engines.
Combustion Modelling in Reciprocant Engines, Mattavi and Amann, Plenum
Press.
Hiroyasu H. y Miao H. (2002) “Optical Techniques for Diesel Spray and Combustion".
Congreso THIESEL-2002, Valencia, Spain.
Jaward B., Gulari E. y Heinen N. A. (1999) Characteristics of Intermittent Fuel Spray. 1999.
Jiménez J., Castro F. y Giménez B. (2000) “The Tip Evolution of an Evaporative Intermittent
Fuel Spray". Congreso THIESEL-2000, Valencia, Spain.
Juliá E. (2003) Medida de Concentraciones de Combustible en Chorros Diesel Mediante
Técnicas de Fluorescencia Inducida por Láser. Tesis Doctoral, E.T.S. Ingenieros
Industriales. Universidad Politécnica de Valencia, Spain.
Kakuhou A., Urushihara T., Itoh T. y Takagi Y. (1999) “Characteristics of Mixture Formation
in a Direct-Injection S.I. Engine With Optimized In-Cylinder Swirl Air Motion".
SAE Technical Paper 1999-01-0505.
Kido A., Ogawa H. y Miyamoto N. (1993) “Quantitative Measurements and Analysis of
Ambient Gas Entrainment into Intermittent Gas Jets By Laser-Induced Fluorescence
of Gas (LIFA)". SAE Technical Paper 930970.
Fuel Injection46
Kim T. y Ghandhi J. B. (2001) “Quantitative 2-D Fuel Vapor Consentration Measurements in
an Evaporating Diesel Spray Using the Exciplex Fluorescence Method". SAE
Technical Paper 2001-01-3495.
Knapp M., Luczak A., Beushausen V., Hentschel W. y Andresen P. (1999) “Vapour/Liquid
Visualization with Laser Induced Exciplex Fluorescence in an SI Engine for
Different Injection Timings". SAE Technical Paper 961122.
Konig G. y Sheppard C. G. W. (1990) “End Gas Autoignition and Knock in a Spark Ignition
Engine". SAE Technical Paper 902135.
Lee K. y Foster D. (1995) “Cycle-by-Cycle Variation in Combustion and Mixture
Concentration in the Vicinity of Spark Plug Gap". SAE Technical Paper 950814.
Martínez S., Sánchez F., Rodríguez G., Riesco J y Gallegos A. (2007) “Simultaneous
Measurement of Evaporating Fuel Spray Using Laser Induced Exciplex
Flourescence” International Journal of Kones.
Martínez S., Sánchez F., Riesco J., Gallegos A y Aceves S. (2007) “Liquid penetration length
in direct diesel fuel injection” Applied Thermal Engineering.
Murakamis E. y Papamoschou D. (2001) Experiments on Mixing Enhancement in Dual-
Steam Jets. Department of Mechanical and Aeorospace Engineering, University of
California at Irvine, Irvine, CA.
Naber J. D. y Siebers D. L. (1996) “Effects of Gas Density and Vaporization on Penetration
and Dispersion of Diesel Sprays". SAE Technical Paper 960034.
Nauwerck A., Gindele J., Spicher U., Rosskamp H. y Landwehr G. (2000) “Investigation of
the Transient In-Cylinder Flow Inside a Two-Stroke Engine With Particle Image
Velocimetry". SAE Technical Paper 2000-01-0902.
Neussert H. J., Spiegel L. y Ganser J. (1995) “Particle Tracking Velocimetry A Powerful Tool
to Shape the In-Cylinder Flow of Modern Multi-Valve Engine Concepts". SAE
Technical Paper 950102.
Nishida M., Nakahira T., Komori M., Tsujimura K. y Yamaguchi I. (1992) “Observation of
High Pressure Fuel Spray With Laser Light Sheet Method". SAE Technical Paper
920459.
Papamoschou D. (2000) Mixing Enhancement Using Axial Flow. Department of Mechanical
and Aeorospace Engineering, University of California, Irvine, CA.
Payri F., Desantes J. M. y Arrµegle J. (1996) “Characterization of D.I. Diesel Sprays in High
Density Conditions". SAE Technical Paper 960774.
Preussner C., Döring C., Fehler S. y Kampmann S. (1998) “GDI Interaction Between Mixture
Preparation, Combustion System and Injector Performance". SAE Technical Paper
980498.
Ramos J. I. (1989) Internal Combustion Engine Modeling, pp. 150-158. Hemisphere
Publishing Corporation.
Ranz W. E. y Marshall W. R. (1952) Evaporation from Drops, Vol. 48 parte I, pp. 141-146.
Canad. J. Chemical Engineering Progress.
Ranz W. E. y Marshall W. R. (1952) Evaporation from Drops, Vol. 48 parte II, pp. 173-179.
Canad. J. Chemical Engineering Progress.
Ranz W. E. y Marshall W. R. (1958) Some Experiments on Orifice Sprays, Vol. 36, pág. 175.
Canad. J. Chemical Engineering Progress.
Reitz R. D. y Bracco F. B. (1979) “On the Dependence of Spray Angle and Other Spray
Parameters on Nozzle Design and Operating Conditions". SAE Technical Paper
790494.
Reitz R. D. y Bracco F. V. (1979) Ultra-High-Speed Filming of Atomizing Jets, Physics of
fluids, Vol. 22, pp. 1054-1064. Physics of Fluids.
Reitz R. D. y Bracco F. V. (1982) Mechanism of Atomization of a Liquid Jet, Vol. 25. Physics
of Fluids.
Schmalzing C. O., Stapf P., Maly R. R., Renner G., Stetter H. y Dwyer H. A. (1999) “A
Holistic Hydraulic and Spray Model - Liquid and Vapor Phase Penetration of Fuel
Sprays in DI Diesel Engines". SAE Technical Paper 1999-01-3549.
Siebers D. L. (1998) “Liquid-Phase Fuel Penetration in Diesel Sprays". SAE Technical Paper
980809.
Siebers D. L. (1999) “Scaling Liquid-Phase Fuel Penetration in Diesel Spray Based on
Mixing-Limited Vaporization". SAE Technical Paper 1999-01- 0528.
Spicher U. y Kollmeire H. (1986) “Detection of Flame Propagation During Knocking Using
Simultaneously High Speed Schlieren Cinematography and Multi-Optical Fibre
Techique". SAE Technical Paper 861523.
Spicher U., Kroger H. y Ganser J. (1991) “Detection of Knocking of Combustion Using
Simultaneously High Speed Schlieren Cinematography and Multi- Optical Fibre
Techique". SAE Technical Paper 912312.
Takagi Y., Itoh T., Muranaka S., Liyama A., Iwakiri Y., Urushihara T. y Naitoh K. (1998)
“Simultaneous Attainment of low Fuel Consumption, High Output Power and Low
Exhaust Emissions in Direct Injection SI Engines". SAE Technical Paper 980149.
Tinaut F. V., Castro F., Melgar A., Sanchez M. L. y Gimenez B. (1993) Visualization and
Measurement of Speed and Size in Diesel Sprays, pp. 78-83. Societée de Ingenieurs
de l´Automovile.
Toepler A. (1864) Memoiré sur la Construction des Télescopes en Verre Argenté. Cohen M.
and Sohn, Bonn.
Trigui N., Kent J. C., Guezennec Y. G. y Choi W. C. (1994) “Characterization of Intake-
Generated Flow Fields in I.C. Engine Using 3-D Particle Tracking Velocimetry (3-D
PTV)". SAE Technical Paper 940279.
Verhoeven D., Vanhemelryck J. L. y Baritaud T. (1998) “Macroscopic and Ingnition
Characteristics of High-Pressure Sparys of Single-Component Fuels". SAE
Technical Paper 981069.
Winklhofer E., Fuchs H. y Philipp H. (1993) “Diesel Spray Combustion an Optical Imaging
Analysis". SAE Technical Paper 930862.
Xu M. y Hiroyasu H. (1990) “Development of a New Optical Technique for Measuring
Diesel Spray Penetration". SAE Technical Paper 902077.
Yule A. J. y Salters D. G. (1995) The Break-up Zone of a Diesel Sprays. Part 1: Length of Zone
and Volume of Unatomized Liquid, Vol. 5, pp. 157-174. Atomization and Sprays.
Zhang L., Tsurushima T., Ueda T., Ishii Y., Itou T., Minamia T. y Yokota K. (1997)
“Measurement of Liquid Phase Penetration of Evaporating Spray in a DI Diesel
Engine". SAE Technical Paper 971645.
Zhao F. Q., Kadota T. y Takemoto T. (1991) “Temporal and Cyclic Fluctuation of Fuel Vapor
Concentration in a Spark Ignition Engine". SAE Technical Paper 912346.
Liquid Sprays Characteristics in Diesel Engines 47
Kim T. y Ghandhi J. B. (2001) “Quantitative 2-D Fuel Vapor Consentration Measurements in
an Evaporating Diesel Spray Using the Exciplex Fluorescence Method". SAE
Technical Paper 2001-01-3495.
Knapp M., Luczak A., Beushausen V., Hentschel W. y Andresen P. (1999) “Vapour/Liquid
Visualization with Laser Induced Exciplex Fluorescence in an SI Engine for
Different Injection Timings". SAE Technical Paper 961122.
Konig G. y Sheppard C. G. W. (1990) “End Gas Autoignition and Knock in a Spark Ignition
Engine". SAE Technical Paper 902135.
Lee K. y Foster D. (1995) “Cycle-by-Cycle Variation in Combustion and Mixture
Concentration in the Vicinity of Spark Plug Gap". SAE Technical Paper 950814.
Martínez S., Sánchez F., Rodríguez G., Riesco J y Gallegos A. (2007) “Simultaneous
Measurement of Evaporating Fuel Spray Using Laser Induced Exciplex
Flourescence” International Journal of Kones.
Martínez S., Sánchez F., Riesco J., Gallegos A y Aceves S. (2007) “Liquid penetration length
in direct diesel fuel injection” Applied Thermal Engineering.
Murakamis E. y Papamoschou D. (2001) Experiments on Mixing Enhancement in Dual-
Steam Jets. Department of Mechanical and Aeorospace Engineering, University of
California at Irvine, Irvine, CA.
Naber J. D. y Siebers D. L. (1996) “Effects of Gas Density and Vaporization on Penetration
and Dispersion of Diesel Sprays". SAE Technical Paper 960034.
Nauwerck A., Gindele J., Spicher U., Rosskamp H. y Landwehr G. (2000) “Investigation of
the Transient In-Cylinder Flow Inside a Two-Stroke Engine With Particle Image
Velocimetry". SAE Technical Paper 2000-01-0902.
Neussert H. J., Spiegel L. y Ganser J. (1995) “Particle Tracking Velocimetry A Powerful Tool
to Shape the In-Cylinder Flow of Modern Multi-Valve Engine Concepts". SAE
Technical Paper 950102.
Nishida M., Nakahira T., Komori M., Tsujimura K. y Yamaguchi I. (1992) “Observation of
High Pressure Fuel Spray With Laser Light Sheet Method". SAE Technical Paper
920459.
Papamoschou D. (2000) Mixing Enhancement Using Axial Flow. Department of Mechanical
and Aeorospace Engineering, University of California, Irvine, CA.
Payri F., Desantes J. M. y Arrµegle J. (1996) “Characterization of D.I. Diesel Sprays in High
Density Conditions". SAE Technical Paper 960774.
Preussner C., Döring C., Fehler S. y Kampmann S. (1998) “GDI Interaction Between Mixture
Preparation, Combustion System and Injector Performance". SAE Technical Paper
980498.
Ramos J. I. (1989) Internal Combustion Engine Modeling, pp. 150-158. Hemisphere
Publishing Corporation.
Ranz W. E. y Marshall W. R. (1952) Evaporation from Drops, Vol. 48 parte I, pp. 141-146.
Canad. J. Chemical Engineering Progress.
Ranz W. E. y Marshall W. R. (1952) Evaporation from Drops, Vol. 48 parte II, pp. 173-179.
Canad. J. Chemical Engineering Progress.
Ranz W. E. y Marshall W. R. (1958) Some Experiments on Orifice Sprays, Vol. 36, pág. 175.
Canad. J. Chemical Engineering Progress.
Reitz R. D. y Bracco F. B. (1979) “On the Dependence of Spray Angle and Other Spray
Parameters on Nozzle Design and Operating Conditions". SAE Technical Paper
790494.
Reitz R. D. y Bracco F. V. (1979) Ultra-High-Speed Filming of Atomizing Jets, Physics of
fluids, Vol. 22, pp. 1054-1064. Physics of Fluids.
Reitz R. D. y Bracco F. V. (1982) Mechanism of Atomization of a Liquid Jet, Vol. 25. Physics
of Fluids.
Schmalzing C. O., Stapf P., Maly R. R., Renner G., Stetter H. y Dwyer H. A. (1999) “A
Holistic Hydraulic and Spray Model - Liquid and Vapor Phase Penetration of Fuel
Sprays in DI Diesel Engines". SAE Technical Paper 1999-01-3549.
Siebers D. L. (1998) “Liquid-Phase Fuel Penetration in Diesel Sprays". SAE Technical Paper
980809.
Siebers D. L. (1999) “Scaling Liquid-Phase Fuel Penetration in Diesel Spray Based on
Mixing-Limited Vaporization". SAE Technical Paper 1999-01- 0528.
Spicher U. y Kollmeire H. (1986) “Detection of Flame Propagation During Knocking Using
Simultaneously High Speed Schlieren Cinematography and Multi-Optical Fibre
Techique". SAE Technical Paper 861523.
Spicher U., Kroger H. y Ganser J. (1991) “Detection of Knocking of Combustion Using
Simultaneously High Speed Schlieren Cinematography and Multi- Optical Fibre
Techique". SAE Technical Paper 912312.
Takagi Y., Itoh T., Muranaka S., Liyama A., Iwakiri Y., Urushihara T. y Naitoh K. (1998)
“Simultaneous Attainment of low Fuel Consumption, High Output Power and Low
Exhaust Emissions in Direct Injection SI Engines". SAE Technical Paper 980149.
Tinaut F. V., Castro F., Melgar A., Sanchez M. L. y Gimenez B. (1993) Visualization and
Measurement of Speed and Size in Diesel Sprays, pp. 78-83. Societée de Ingenieurs
de l´Automovile.
Toepler A. (1864) Memoiré sur la Construction des Télescopes en Verre Argenté. Cohen M.
and Sohn, Bonn.
Trigui N., Kent J. C., Guezennec Y. G. y Choi W. C. (1994) “Characterization of Intake-
Generated Flow Fields in I.C. Engine Using 3-D Particle Tracking Velocimetry (3-D
PTV)". SAE Technical Paper 940279.
Verhoeven D., Vanhemelryck J. L. y Baritaud T. (1998) “Macroscopic and Ingnition
Characteristics of High-Pressure Sparys of Single-Component Fuels". SAE
Technical Paper 981069.
Winklhofer E., Fuchs H. y Philipp H. (1993) “Diesel Spray Combustion an Optical Imaging
Analysis". SAE Technical Paper 930862.
Xu M. y Hiroyasu H. (1990) “Development of a New Optical Technique for Measuring
Diesel Spray Penetration". SAE Technical Paper 902077.
Yule A. J. y Salters D. G. (1995) The Break-up Zone of a Diesel Sprays. Part 1: Length of Zone
and Volume of Unatomized Liquid, Vol. 5, pp. 157-174. Atomization and Sprays.
Zhang L., Tsurushima T., Ueda T., Ishii Y., Itou T., Minamia T. y Yokota K. (1997)
“Measurement of Liquid Phase Penetration of Evaporating Spray in a DI Diesel
Engine". SAE Technical Paper 971645.
Zhao F. Q., Kadota T. y Takemoto T. (1991) “Temporal and Cyclic Fluctuation of Fuel Vapor
Concentration in a Spark Ignition Engine". SAE Technical Paper 912346.
Fuel Injection48
Zhao F. Q., Taketomi M., Nishida K. y Hiroyasu. (1993) “Quantitative Imaging of the Fuel
Concentration in a S.I. Engine with Laser Rayleigh Scattering". SAE Technical Paper
932641.
Zhao H. y Ladommatos N. (1998) Optical Diagnostics for Soot and Temperature
Measurement in Diesel Engines, Vol. 1, pp. 244-254. Department of Mechanical
Engineering, Brunel University, U.K.
Zhao H. y Ladommatos N. (2001) Engine Combustion Instrumentation and Diagnostics, pp.
457-470. Society of Automotive Engineers, Inc.Warrendale, Pa.
Experimental Cells for Diesel Spray Research 49
Experimental Cells for Diesel Spray Research
Simón Martínez-Martínez, Miguel García Yera and Vicente R. Bermúdez
X
Experimental Cells for Diesel Spray Research
Simón Martínez-Martínez
1
, Miguel García Yera
1
and Vicente R. Bermúdez
2
1
Universidad Autónoma de Nuevo León
México
2
Universidad Politécnica de Valencia
Spain
1. Introduction
The study of the combustion process in Diesel engines has been going even deeper into
depth with the application of new techniques of measure and more rigorous methodologies.
This has taken into new expectations in the development of parametric studies and in the
construction of tools (physical models or experimental setup) that allow the reproduction of
similar thermodynamic conditions to the ones present in the inside of a cylinder in a real
thermal engine, making it possible to obtain greater approximations between the theoretical
relation and the experimental one.
2. Experimental setup classification
The physical models or experimental setup used to study the injection-combustion process
usually are of very specific characteristics, depending on the phenomena to analyse. These
models can be classified in the three following groups:
2.1. According to the type of the working fluid
-Models with cold working fluid are used to study sprays in non-evaporating conditions,
but many times in conditions similar to the existing ones in a real thermal engine.
- Models with hot working fluid, this kind of model is the best way to study sprays in
evaporating conditions and in the majority of times it’s possible to simulate a real thermal
engine in its temperature and density conditions.
2.2. According to the atmosphere type
-Models with inert atmosphere are used to study diesel spray without the presence of flame.
Its greater application is basically the biphasic study of the spray (liquid and vapour).
-Models with reactive atmosphere, this kind of model is generally applicable to combustion
studies and normally atmospheric air is used to achieve the reaction.
3
Fuel Injection50
2.3. According to the geometry of the chamber
Models of constant volume vessel are used to study the diesel sprays in non reactive
atmosphere and reactive atmosphere. This kind of model is not of common use, most of all
on the development of studies of the sprays by means of reactive atmospheres since they
require previous ignitions of mixtures of combustible gases to achieve high pressures and
temperatures in the inside of the injection chamber.
Historically the first developed studies about combustion process in a thermal engine were
by means of direct recording of the luminosity of the flame, and afterwards by the Schieren
technique for studies of auto-ignition and the knocking combustion. The visualization
involves the formation of visible images directly or indirectly by the action of light over
sensible materials to the latter. Therefore the light and the recording of the formed images
are essential to any form of visualization. The light can be generated by the object itself if it’s
luminous (auto-ignition or combustion). If it’s not, the light source has to be deployed to
illuminate the object to reflect (free injection). Traditionally the photographic films were the
only way to register images for the chemical processes induced by the action of light,
however in some applications; the photoelectric devices are now substituting the
photographic film. Due to the nature of the engines combustions, each image must be taken
in a very short amount of time to freeze any fluid movement or of the flame during the
exposure. This can be obtained by intermittent recording with high speeds of the shutter to
register an image from a cycle, and a sequence of images in function of the turning angle of
the crankshaft along many engine cycles or by means of the recording of hundreds of
images per second to obtain a image sequence within the same engine cycle (relating to the
first recording case as a projection of a high speed monostable image, and the last one as
high speed continuous, correspondingly). These recording methods and other techniques of
measure have been evolving gradually and increasing their application to the different
kinds of existing models, such as it will be mentioned in the subsequent sections.
The analysis of diesel sprays has had very important advancements beginning with the
physical model implementation because during time, very specific studies have been
developed. In the last decade of the 20th century, (Hiroyasu et al., 1989) was one of the
pioneers in the use of injection models and in the implementation of visualization methods
(Fraunhofer diffraction). Hiroyasu, in his investigations to study Sauter’s medium diameter
(SMD), used an injection model with the only possibility of doing experiments under low
atmospheric conditions (pressures of the order of 3 bar and temperature of 285 K), which
allowed relatively good microscopic studies to be made but with limitations to study the
diesel spray under the thermodynamic variables that can be achieves in a real thermal
engine.
To develop his experiment of SMD, (Minami et al., 1990) used a similar model to that one
employed by (Hiroyasu et al., 1989), where the objective was to obtain the density
conditions similar to the existing ones inside the combustion chamber of a real thermal
engine. This author to develop his experiments used as the working fluid pressurized
nitrogen at 20 bar and the injection pressures analysed were of the order of 2000 bar. These
pressures could not be analysed using the model of Hiroyasu due to the low densities that
were achieved in his model, so that it resulted irrelevant to do certain kinds of studies,
mostly in high injection pressures. Minami employed the Fraunhofer technique to visualize
the diameter of the droplets, using a lighting source based in a ruby laser beam pulsed at 30
ns and with a wavelength of 694 nm. Unlike Hiroyasu, Minami expanded the beam making
it parallel to the spray through lenses, which afterwards is attenuated by the own fuel spray,
where the transmission of light is focused by a parabolic mirror with which an image of the
filmed spray on the 35 mm film is obtained. It was possible in this model to analyse the
penetration of the spray by installing a high speed photographic camera to take the images
and replacing the beam of light by halogen lamp as the light source.
There where basically two problems to clear up the interference of stripes in the
photographic plane when using this technique:
- The first issue was due to the interferences caused by the thickness of the visualization
window which was approximately 50 mm. This problem was solved by changing the
trajectory of the beam between the reference and the object, using a intensity rate of 9:1 and
fixing the point that focuses the lens of the relay as close as possible to the photographic plate.
- The second problem was generated by the collision of waves, which were produced in the
interior of the chamber in a short amount of time during the period of injection. This was a
consequence of the fuel injection velocity that surpassed the sound velocity. The collision of
waves inside the combustion chamber made it difficult to take pictures because of the
reflection inside it. The problem was solved by changing the time of synchronization of the
injection time in reference to the picture taking, changing to times of 0,2 to 0,4 ms after start
of injection.
The evaporated diesel spray studied by (Tabata et al., 1991) was made using a model similar
to that presented by others scientist (Hiroyasu et al., 1989) and (Minami et al., 1990), with a
small difference in its configuration. A heat system was installed in the interior of the
chamber which had the objective of heating up the working fluid (nitrogen) to conditions
that were optimal to achieve fuel evaporation. The main drawback studying evaporated
diesel spray was the low range of available densities for high permissible temperatures. Due
to this inconvenience it was impossible to reproduce similar thermodynamic conditions to
those found in a thermal engine. It was limited to predict behaviours at low pressures
(pressures inside the injection chamber in the order of 20 bar). (Higgins et al., 2000) studied
the ignition of the spray and the behaviour of the pre-mixture of burn in a model of constant
volume, where it was possible to achieve pressures inside the chamber of 350 bar and a
temperature range of 800 K to 1100 K for densities between 7.27 kg/m3 y 45 kg/m3. This
model, unlike those used by other authors (Hiroyasu et al., 1989), (Minami et al., 1990) and
(Tabata et al., 1991) has two spark plugs and a ventilator to equalize the atmospheric
conditions in the inside of the chamber, besides of having the walls electrically conditioned
to simulate the conditions of the wall temperature found in a thermal engine. Another
objective for this conditioner was to avoid the vapours of the fuel to condensate on the
visualization windows. This model didn’t require any kind of modifications to develop
burning or free injection studies, unlike the one used by (Minami et al., 1990), which did
need very sophisticated adaptations to be able to make more complex studies, as the
burning study.
Experimental Cells for Diesel Spray Research 51
2.3. According to the geometry of the chamber
Models of constant volume vessel are used to study the diesel sprays in non reactive
atmosphere and reactive atmosphere. This kind of model is not of common use, most of all
on the development of studies of the sprays by means of reactive atmospheres since they
require previous ignitions of mixtures of combustible gases to achieve high pressures and
temperatures in the inside of the injection chamber.
Historically the first developed studies about combustion process in a thermal engine were
by means of direct recording of the luminosity of the flame, and afterwards by the Schieren
technique for studies of auto-ignition and the knocking combustion. The visualization
involves the formation of visible images directly or indirectly by the action of light over
sensible materials to the latter. Therefore the light and the recording of the formed images
are essential to any form of visualization. The light can be generated by the object itself if it’s
luminous (auto-ignition or combustion). If it’s not, the light source has to be deployed to
illuminate the object to reflect (free injection). Traditionally the photographic films were the
only way to register images for the chemical processes induced by the action of light,
however in some applications; the photoelectric devices are now substituting the
photographic film. Due to the nature of the engines combustions, each image must be taken
in a very short amount of time to freeze any fluid movement or of the flame during the
exposure. This can be obtained by intermittent recording with high speeds of the shutter to
register an image from a cycle, and a sequence of images in function of the turning angle of
the crankshaft along many engine cycles or by means of the recording of hundreds of
images per second to obtain a image sequence within the same engine cycle (relating to the
first recording case as a projection of a high speed monostable image, and the last one as
high speed continuous, correspondingly). These recording methods and other techniques of
measure have been evolving gradually and increasing their application to the different
kinds of existing models, such as it will be mentioned in the subsequent sections.
The analysis of diesel sprays has had very important advancements beginning with the
physical model implementation because during time, very specific studies have been
developed. In the last decade of the 20th century, (Hiroyasu et al., 1989) was one of the
pioneers in the use of injection models and in the implementation of visualization methods
(Fraunhofer diffraction). Hiroyasu, in his investigations to study Sauter’s medium diameter
(SMD), used an injection model with the only possibility of doing experiments under low
atmospheric conditions (pressures of the order of 3 bar and temperature of 285 K), which
allowed relatively good microscopic studies to be made but with limitations to study the
diesel spray under the thermodynamic variables that can be achieves in a real thermal
engine.
To develop his experiment of SMD, (Minami et al., 1990) used a similar model to that one
employed by (Hiroyasu et al., 1989), where the objective was to obtain the density
conditions similar to the existing ones inside the combustion chamber of a real thermal
engine. This author to develop his experiments used as the working fluid pressurized
nitrogen at 20 bar and the injection pressures analysed were of the order of 2000 bar. These
pressures could not be analysed using the model of Hiroyasu due to the low densities that
were achieved in his model, so that it resulted irrelevant to do certain kinds of studies,
mostly in high injection pressures. Minami employed the Fraunhofer technique to visualize
the diameter of the droplets, using a lighting source based in a ruby laser beam pulsed at 30
ns and with a wavelength of 694 nm. Unlike Hiroyasu, Minami expanded the beam making
it parallel to the spray through lenses, which afterwards is attenuated by the own fuel spray,
where the transmission of light is focused by a parabolic mirror with which an image of the
filmed spray on the 35 mm film is obtained. It was possible in this model to analyse the
penetration of the spray by installing a high speed photographic camera to take the images
and replacing the beam of light by halogen lamp as the light source.
There where basically two problems to clear up the interference of stripes in the
photographic plane when using this technique:
- The first issue was due to the interferences caused by the thickness of the visualization
window which was approximately 50 mm. This problem was solved by changing the
trajectory of the beam between the reference and the object, using a intensity rate of 9:1 and
fixing the point that focuses the lens of the relay as close as possible to the photographic plate.
- The second problem was generated by the collision of waves, which were produced in the
interior of the chamber in a short amount of time during the period of injection. This was a
consequence of the fuel injection velocity that surpassed the sound velocity. The collision of
waves inside the combustion chamber made it difficult to take pictures because of the
reflection inside it. The problem was solved by changing the time of synchronization of the
injection time in reference to the picture taking, changing to times of 0,2 to 0,4 ms after start
of injection.
The evaporated diesel spray studied by (Tabata et al., 1991) was made using a model similar
to that presented by others scientist (Hiroyasu et al., 1989) and (Minami et al., 1990), with a
small difference in its configuration. A heat system was installed in the interior of the
chamber which had the objective of heating up the working fluid (nitrogen) to conditions
that were optimal to achieve fuel evaporation. The main drawback studying evaporated
diesel spray was the low range of available densities for high permissible temperatures. Due
to this inconvenience it was impossible to reproduce similar thermodynamic conditions to
those found in a thermal engine. It was limited to predict behaviours at low pressures
(pressures inside the injection chamber in the order of 20 bar). (Higgins et al., 2000) studied
the ignition of the spray and the behaviour of the pre-mixture of burn in a model of constant
volume, where it was possible to achieve pressures inside the chamber of 350 bar and a
temperature range of 800 K to 1100 K for densities between 7.27 kg/m3 y 45 kg/m3. This
model, unlike those used by other authors (Hiroyasu et al., 1989), (Minami et al., 1990) and
(Tabata et al., 1991) has two spark plugs and a ventilator to equalize the atmospheric
conditions in the inside of the chamber, besides of having the walls electrically conditioned
to simulate the conditions of the wall temperature found in a thermal engine. Another
objective for this conditioner was to avoid the vapours of the fuel to condensate on the
visualization windows. This model didn’t require any kind of modifications to develop
burning or free injection studies, unlike the one used by (Minami et al., 1990), which did
need very sophisticated adaptations to be able to make more complex studies, as the
burning study.
Fuel Injection52
The effects on the diesel spray caused by the geometry of the chamber were studied by
(Montajir et al., 2000). To develop the investigations they based themselves on an
experimental installation which consisted in a small thermal engine of slow speed regime
and with a combustion head of rectangular geometry adapted with a window for
visualization. In this model as in the ones described previously, nitrogen was used as the
working fluid (injected in the cylinder a temperature of 293 K and with a pressure inside the
chamber of 45 bar) to visualize the diesel spray without combustion. To achieve the
development of studies in different thermodynamic scopes with this model, the main option
was to change the compression ratio. This was achieved by placing spacer rings between the
cylinder and the combustion head. This modification used to be also very complex and
expensive. Furthermore it didn’t allow continuity in the experimental session because of the
constant stops required to carry out mechanical changes in the installation.
The stratification effects of the combustion were studied by (Plackmann et al., 1998) using a
model of constant volume, also called combustion constant volume vessel. Where the
visualization took place through three quartz windows. One of the windows was located in
the back side and the other two in the middle section of the pump. This model was
pressurized with an air-propane mixture with pressures of 40 bar; these fluids were used as
oxidant and test combustible respectively. The ignition took place by the means of two
diametrically opposite electrodes which function as a spark plug to provoke the spark. One
of the electrodes was connected to a high tension source that came from a discharge
capacitive ignition system and the other one to mass, being this last system to be the one
that caused the difference in electric potential to achieve the ignition of the mixture.
In their studies about the behaviour of gasoline direct injection (GDI), (Shelby et al., 1998)
used an engine with three optical accesses made out of quartz. To carry out the visualization
of burning the planar laser induced fluorescence (PLIF) as the technique of measure and a
high speed camera to film the combustion process were used. The camera was placed
perpendicularly to the beam, having with this the advantage of taking images directly. This
thermal engine unlike the one used by (Montjair et al., 2000) had completely transparent
walls, which allowed a complete capture of the phenomena (injection-combustion).
Furthermore, it required complex routines at the moment of doing any changes in the
installations configuration.
With the purpose of visualizing the atomization process in a gasoline direct injection
system, (Preussner et al., 1998) used a model pressurized with oxygen (pressure and
temperature of 20 bar and 673 K correspondingly). Where the combustion products of each
cycle were constantly evacuated by the use of nitrogen and the visualization of the
atomization process was done through windows located on the far ends of the injection
chamber. Mie-Scattering was the technique of measure used during the experiments. In
addition to this technique, the scientists developed tests with the laser induced fluorescence
technique, which proved not to be the most appropriate for some measures in the gasoline
direct injection systems, because it is an optical method of measure somewhat incoherent to
detect concentration of species compared to Mie-Scattering. However, it was possible to use
other techniques of measure. One disadvantage presented by this model was the way of
evacuating the burn gases, because it was required to introduce nitrogen to the injection
chamber when the cycle ended to expel these gases and was not recoverable, which made
expensive the experimentation, besides of needing very long test routines because of
discontinuity in the tests due to the type of cleaning used.
In his experiments to study the effects of vaporization, (Takagi et al., 1998) used an
experimental installation based on a thermal engine of 2.0 litres provided with sapphire
walls and only one optic access for image capturing. The optic access was placed in one
section of the piston head, being the most appropriate collation place due to the geometric
characteristics of the model. In the same way as Preussner, laser induced fluorescence was
used as the technique of measure, obtaining extremely satisfying results in addition to
confirm (Preussner et al., 1998) theories, who postulated that the laser induced fluorescence
technique was no the best option to study the combustion effects due to the problems
generated to detect species. Something that does not exist in the case of vapour
concentration studies, as long as the fuel is mixed with tracers to make it behave as a
fluorescent source (the combustible by its own nature tends to illuminate when its subject to
high pressure and temperature, which is why tracers are required to carry out concentration
studies, because the presence of tracers allows to define the different wavelengths for each
element that constitutes the mixture). This model wasn’t sufficiently flexible enough for the
use of other techniques of measure due to the fact that the sampling process of images was
of the intrusive kind, therefore making it an inappropriate method for the study of internal
processes in an internal combustion engine.
To study the effects of the injection pressure and the diameter of the nozzle on the fumes
emissions, (Siebers & Pickett, 2002) used a model consisting in a chamber of constant
volume where it is possible to simulate similar thermodynamic conditions to the one in a
Diesel engine (Figure 1). Other applications for this model are described in (Naber &
Siebers, 1996), (Siebers, 1998), (Siebers & Higgins, 2001) and (Siebers et al., 2002). The
chamber has four optic accesses placed orthogonally and equidistant, having the advantage
of using different optical techniques simultaneously making more than one analysis in each
experiment. But it also has disadvantages, mainly the way of obtaining the appropriate
thermodynamic conditions in the chamber’s interior. These conditions such as the
temperature and density are achieved by causing the ignition (by means of a spark plug) of
the combustible gases in the inside of the chamber, the method is unusual and in many cases
even dangerous. The range of operation for the temperature as for the density is in the order
of (600 a 1400) K and (3,6 a 60) kg/m
3
respectively. Furthermore, it’s possible to regulate the
concentration of oxygen in the interior of the chamber from cero (e.g., for inert conditions) to
values greater than 21% in volume, depending on the type of study aiming for.