Wireless Sensor Networks Application Centric Design Part 10 docx
Bạn đang xem bản rút gọn của tài liệu. Xem và tải ngay bản đầy đủ của tài liệu tại đây (1010.94 KB, 30 trang )
Design of Radio-Frequency Transceivers for Wireless Sensor Networks 259
The main problem of the low-IF receiver architecture is the image rejection since the IF is so
low that it is difficult to separate the image from the desired signal by filters. The imbalance
between I and Q channel signals in the low-IF receiver determines the possible maximum
image rejection. The image rejection IR and the imbalances of the I/Q amplitude and the
phase have the following relationship:
IR
= 10lg
1
+ 2(1 + ∆)cosγ + (1 + ∆)
2
1 −2(1 + ∆)cosγ + (1 + ∆)
2
(13)
where γ is the I and Q phase imbalance from the nominal 90
◦
offset in degree, ∆ is the I and
Q amplitude imbalance, which is usually expressed in dB by using the formula 10lg
(1 + ∆).
For a full-duplex system, the receiver suffers from transmission leakage interferences particu-
larly in the LNA. If a strong interference tone appears near the desired signal of the receiver,
the amplitude modulation of the transmission leakage will cross-modulate the interference
tone in the LNA. The spectrum of the cross-modulated tone may partially spread into the
receiver channel bandwidth when the single-tone interferer is enough close to the desired sig-
nal. The receiver will be desensitized if the cross-modulation product getting into the receiver
channel band is high enough. The expression of the allowed single-tone interferer is (Gu,
2005):
I
st
= 10lg
10
D
max
10
−10
N
n f
10
10
−[2 (IIP3
lna
−IL
dRx
)−2(P
Tx
−R
dTx
)−C]
10
+ 10
N
pn
+10lgBW
10
+ 10
N
sp
10
(14)
where D
max
can be got by equation (5), N
n f
can be obtained by equation (9), P
Tx
is the trans-
mitter output power at the antenna in dBm, and C is the correction factor approximately equal
to (Gu, 2005):
C
= M
A
+ 6 + 10lg
1.5
× BW − ∆ f
2
× BW
(15)
where ∆ f is the space between the interference tone and the carrier frequency of the desired
receiving signal. M
A
can be calculated by the probability density function p(x) of the trans-
mission signals and the normalized low-frequency product of the second-order distortion:
M
A
= 10lg
∞
−∞
(10
x
10
)
2
−10
IM2
dc
10
2
p(x)dx
(16)
IM2
dc
= 10lg
∞
−∞
10
x
10
2
p(x)dx
(17)
For the transmitter, the modulation accuracy is represented by EVM, which is defined as the
mean square error between the samples of the actual and the ideal signals, normalized by the
average power of the idea signal. The EVM of transmitters is influenced by the inter-symbol
or inter-chip interference, the close-in phase noise of synthesized LO, the carrier leakage, the
I and Q imbalance, the nonlinearity, the in-channel bandwidth noise, the reverse modulation
of LO, and so on.
The influence caused by inter-symbol or inter-chip interferences can be obtained by:
EVM
isi
=
+∞
∑
k=−∞
∆I
2
isi
(k) (18)
∆I
isi
(k) =
h
ir
(t
0
+ kT
s
)
h
ir
(t
0
)
=
t
0
+∆t
t
0
−∆t
|h
ir
(t + kT
s
)|dt
t
0
+∆t
t
0
−∆t
|h
ir
(t)|dt
(19)
where h
ir
(t) is the impulse response of the pulse-shaping filter, k is equal to ±1, ±2, ±3, . . .,
Ts is the period of a symbol, and 2∆t is the during of a sampling pulse.
The influence caused by close-in phase noise of synthesized LO can be obtained by:
EVM
pn
=
2 ×10
N
phase
10
× BW
l f,pll
(20)
where N
phase
is the average phase noise in dBc/Hz within the PLL loop bandwidth, and
BW
l f,pll
is the bandwidth of the PLL loop filter in Hz.
The carrier leakage is mainly caused by the DC offset of the baseband, the LO-to-RF leakage
and the IF-to-RF leakage. The influence on EVM caused by carrier leakage can be obtained by:
EVM
cl
=
CL
o f fset
10
+
CL
lo
10
+
CL
i f
10
(21)
where CL
o f fset
, CL
lo
and CL
i f
represents the leakage results from the DC offset, the LO-to-RF
leakage and the IF-to-RF leakage, respectively.
The EVM caused by the I and Q imbalance can be expressed as:
EVM
iq
=
10
IR
10
(22)
where IR is the image suppression, which can be calculated by equation (13).
It’s assumed that only the signal amplitude equal to and greater than the output 1-dB com-
pression of the power amplifier P
−1
will affect the modulation accuracy, then the EVM caused
by nonlinearity of the transmitter chain can be expressed as:
EVM
nonlin
=
∞
0
P(δ) ×
10
δ+1
20
−1
dδ (23)
δ
= P
Tx
− P
−1
(24)
where P
Tx
is the output power level, and P
δ
is the amplitude probability density function of
the signal.
The EVM caused by in-channel bandwidth noise can be expressed by:
EVM
ibn
=
10
N
ibn
−P
Tx
10
(25)
where N
ibn
is the integrated noise over the channel bandwidth, and P
Tx
is the transmission
power in dBm.
The transmission signals may be reflected from the load of the modulator, then the reflected
signals and their harmonics may modulate the LO if the frequency of the carrier or the har-
monics of the reflected signals is equal to LO frequency. Then reverse modulation occurs. The
EVM caused by reverse modulation is:
EVM
rm
=
10
N
rm
10
(26)
where N
rm
is the integrated reverse modulation noise of the synthesized LO over the trans-
mission signal bandwidth below the LO level.
Wireless Sensor Networks: Application-Centric Design260
The overall EVM of the transmission signal can be expressed as:
EVM
total
= EVM
2
isi
+ EVM
2
pn
+ EVM
2
cl
+ EVM
2
iq
(27)
+ EVM
2
nonlin
+ EVM
2
ibn
+ EVM
2
rm
+ . . .
The ACPR specification is generally defined as ratio of the power integrated over an assigned
bandwidth in the adjacent/alternate channel to the total desired transmission power. The
ACPR can be expressed as:
ACPR
=
f
a
+∆B
f
a
SPD( f)df
f
o
+BW /2
f
o
−BW /2
SPD( f)df
(28)
where f
a
is the start frequency of the adjacent/alternate channel, ∆B is the bandwidth of
measuring adjacent/alternate channel power, which varies with different mobile systems. The
general formula for the ACPR of a transmission signal at the output of the power amplifier
with an output third intercept point OIP3 can be expressed as:
ACPR
≈ 2(P
Tx
−OIP3) −9 + C
0
+ 10lg
∆B
BW
(29)
C
0
≈ 0.85 ×(PAR −3) (30)
where P
Tx
is the transmission signal power at the output of the power amplifier, PAR is the
peak-to-average ratio of the random noise. In the mobile communication systems, the ad-
jacent/alternate power may be tested in a bandwidth ∆B that is different from the desired
transmission signal bandwidth BW.
We only discuss the noise emissions that are those located outside of alternate channels here.
In general, we like to have lower gain power amplifier for achieving low noise emission, but
this is completely opposite to the gain setting of the power amplifier to obtain a good ACPR
performance. The noise emission in mW/Hz of the transmitter has an expression as:
P
nm
= G
Tx
× P
n,in
+ kT
0
G
Tx
(NF
Tx
−1) (31)
where P
n,in
in mW/Hz is the noise at the transmitter input, G
Tx
is the overall transmitter gain,
NF
Tx
is the overall noise factor of the transmitter, and kT
0
= 10
−174/10
mW/Hz.
4. The design of key modules in the transceiver
A common used transceiver is composed of a LNA, Mixers, filters, IF circuits, a PA, ADCs and
DACs, a PLL and so on. The individual performance and the matching among these modules
determine the performance of the whole transceiver system. A general description of these
modules will be given in this section.
4.1 Low-Noise Amplifier
The specifications of a LNA can be summarized into:
• The working frequency;
• The noise figure;
• The third intercept point;
• The voltage or power gain;
• The reflection coefficient at the input port and the isolation between the output port and the
input port;
• The power consumption;
The most important specification of the LNA is the noise figure since the first stage of a re-
ceiver chain decides the noise performance of the whole system. One of the common used
LNAs is the inductively source degenerated type, and a typical design example is shown in
Fig. 7(a). M1 is a common-source amplifier transistor, L
S
is the source degenerated inductor,
L
G
is the gate inductor, V
IN
is the input Port, and V
OUT
is the output port; M2 is a common-
gate transistor that is used for isolation and gain enhancement; the load Z
L
can be a resistor,
a inductor or a inductor-capacitor tank. This structure has a large gain and a low noise figure,
but the input reflection is a problem. There is a trade-off between the noise figure and the
input impedance matching.
Fig. 7. (a)An inductively source degenerated LNA. (b)The common-gate input type.
Another common used LNA is the common-gate input type, as shown in Fig. 7(b). If the
transconductance of the common-gate transistor M3 is g
m
, then the input resistance is equal
to 1/g
m
. Therefore, the input matching of common-gate LNA is easier to realize compared to
the source degenerated LNA. However, the noise performance is poor, since the common-gate
amplifier has a low gain.
The WSN receivers usually have a high sensitivity, as shown in Table 1. According to equa-
tion (1), the sensitivity is proportional to the noise figure of the RF front end. Therefore, in
WSN applications, we often adopt the inductively source degenerated LNA assisted by some
low-noise technologies.
4.2 Mixer
The mixers in transceivers can be divided into two types: 1)the up-converting mixers and
2)the down-converting mixers. The up-converting mixers are used in the transmitter, while
the down-converting mixers are used for the receiver. The specifications of a mixer can be
summarized into:
• The working frequency including RF frequency, LO frequency, and IF frequency;
• The noise figure;
• The third intercept point;
Design of Radio-Frequency Transceivers for Wireless Sensor Networks 261
The overall EVM of the transmission signal can be expressed as:
EVM
total
= EVM
2
isi
+ EVM
2
pn
+ EVM
2
cl
+ EVM
2
iq
(27)
+ EVM
2
nonlin
+ EVM
2
ibn
+ EVM
2
rm
+ . . .
The ACPR specification is generally defined as ratio of the power integrated over an assigned
bandwidth in the adjacent/alternate channel to the total desired transmission power. The
ACPR can be expressed as:
ACPR
=
f
a
+∆B
f
a
SPD( f)df
f
o
+BW /2
f
o
−BW /2
SPD( f)df
(28)
where f
a
is the start frequency of the adjacent/alternate channel, ∆B is the bandwidth of
measuring adjacent/alternate channel power, which varies with different mobile systems. The
general formula for the ACPR of a transmission signal at the output of the power amplifier
with an output third intercept point OIP3 can be expressed as:
ACPR
≈ 2(P
Tx
−OIP3) −9 + C
0
+ 10lg
∆B
BW
(29)
C
0
≈ 0.85 ×(PAR −3 ) (30)
where P
Tx
is the transmission signal power at the output of the power amplifier, PAR is the
peak-to-average ratio of the random noise. In the mobile communication systems, the ad-
jacent/alternate power may be tested in a bandwidth ∆B that is different from the desired
transmission signal bandwidth BW.
We only discuss the noise emissions that are those located outside of alternate channels here.
In general, we like to have lower gain power amplifier for achieving low noise emission, but
this is completely opposite to the gain setting of the power amplifier to obtain a good ACPR
performance. The noise emission in mW/Hz of the transmitter has an expression as:
P
nm
= G
Tx
× P
n,in
+ kT
0
G
Tx
(NF
Tx
−1) (31)
where P
n,in
in mW/Hz is the noise at the transmitter input, G
Tx
is the overall transmitter gain,
NF
Tx
is the overall noise factor of the transmitter, and kT
0
= 10
−174/10
mW/Hz.
4. The design of key modules in the transceiver
A common used transceiver is composed of a LNA, Mixers, filters, IF circuits, a PA, ADCs and
DACs, a PLL and so on. The individual performance and the matching among these modules
determine the performance of the whole transceiver system. A general description of these
modules will be given in this section.
4.1 Low-Noise Amplifier
The specifications of a LNA can be summarized into:
• The working frequency;
• The noise figure;
• The third intercept point;
• The voltage or power gain;
• The reflection coefficient at the input port and the isolation between the output port and the
input port;
• The power consumption;
The most important specification of the LNA is the noise figure since the first stage of a re-
ceiver chain decides the noise performance of the whole system. One of the common used
LNAs is the inductively source degenerated type, and a typical design example is shown in
Fig. 7(a). M1 is a common-source amplifier transistor, L
S
is the source degenerated inductor,
L
G
is the gate inductor, V
IN
is the input Port, and V
OUT
is the output port; M2 is a common-
gate transistor that is used for isolation and gain enhancement; the load Z
L
can be a resistor,
a inductor or a inductor-capacitor tank. This structure has a large gain and a low noise figure,
but the input reflection is a problem. There is a trade-off between the noise figure and the
input impedance matching.
Fig. 7. (a)An inductively source degenerated LNA. (b)The common-gate input type.
Another common used LNA is the common-gate input type, as shown in Fig. 7(b). If the
transconductance of the common-gate transistor M3 is g
m
, then the input resistance is equal
to 1/g
m
. Therefore, the input matching of common-gate LNA is easier to realize compared to
the source degenerated LNA. However, the noise performance is poor, since the common-gate
amplifier has a low gain.
The WSN receivers usually have a high sensitivity, as shown in Table 1. According to equa-
tion (1), the sensitivity is proportional to the noise figure of the RF front end. Therefore, in
WSN applications, we often adopt the inductively source degenerated LNA assisted by some
low-noise technologies.
4.2 Mixer
The mixers in transceivers can be divided into two types: 1)the up-converting mixers and
2)the down-converting mixers. The up-converting mixers are used in the transmitter, while
the down-converting mixers are used for the receiver. The specifications of a mixer can be
summarized into:
• The working frequency including RF frequency, LO frequency, and IF frequency;
• The noise figure;
• The third intercept point;
Wireless Sensor Networks: Application-Centric Design262
• The second intercept point (for zero-IF or low-IF receivers);
• The voltage or power conversion gain;
• The isolation between the RF port and the LO port, the RF port and the IF port, and the LO
port and the IF port;
• The magnitude and phase imbalance between I and Q channel down converters (for the
receivers and transmitters that use I and Q dual-path converters);
• The power consumption;
A classical mixer is known as the Gilbert cell, as shown in Fig. 8. I
B
is a current source, RF+
and RF− are the differential RF input ports, LO+ and LO− are the differential LO input ports,
and the output differential currents are I
OUT
+ and I
OUT
−; M1 and M2 convert the input RF
voltage into current, and M3-M6 are used as switches for mixing.
Fig. 8. The Gilbert cell.
The Gilbert mixer is a typical example of active mixers, which have high gain, low noise, but
poor linearity. Another type of mixers are called passive mixers, which usually have low gain,
large noise and high linearity. The passive mixers can be divided into two types: 1)voltage-
mode mixers: the MOS switches are used for voltage switches, and loaded with high resis-
tance. Because of the nonlinearity of the switches, distortions will be enlarged when the am-
plitudes of RF and IF signals are increased and the switches are modulated. 2)Current-mode
mixers: the MOS switches are used for current switches, and loaded with low resistance. So
the amplitudes of RF and IF signals are relatively low in current-mode mixers, then the linear-
ity is improved. A typical example of current-mode passive mixers is shown in Fig. 9 (Valla
et al., 2005). The input I
IN
is a differential current signal, the output V
OUT
is a voltage sig-
nal. Transistors M1-M4 are used for switches that are controlled by the LO signals LO
+ and
LO
−. An OTA (OperaTional Amplifier) together with resistors R1, R2 and capacitors C1, C2
is adopted to amplify and filter the signals. Two additional capacitors C3 and C4 are used to
generate an extra pole to suppress the amplitude. The LNA and mixers are often designed
and tested together to realize an optimized trade-off among gain, noise figure and linearity
for different applications.
The distribution of WSN nodes is random, and the distance between two nodes may be very
short or very long, so the dynamic range of the transceivers is very important. According
to equation (11), in order to improve the SFDR performance, the noise figure needs to be
Fig. 9. A typical current-mode passive mixer.
decreased and the IIP3 needs to be enhanced. Therefore, a combination of a low-noise induc-
tively source degenerated LNA and a current-mode passive mixer can be adopted for WSN
usages.
4.3 Active Filter
According to the pattern of implement, the active filters usually used for transceivers can be
summarized into three types: 1)switched-capacitor filters, in which the resistors are replaced
by switched capacitors; 2)active-RC filters, which is composed of OTAs and resistor-capacitor
networks; 3)gm-C filters, in which the resistors and inductors are replaced by transconductors.
For switched-capacitor filters, the advantages can be summarized here: 1)high precision with-
out tuning, 2)small chip area and low power, and 3)insensitive to parasitics. However, there
are several disadvantages: 1)affected by sampling, 2)requirement for extra clock generation
circuit, and 3)not suitable for high-frequency applications.
For active-RC filters, the advantages can be summarized into: 1)high precision with tuning,
2)easy to design with classical RC structures, 3)insensitive to parasitics, 4)no sampling effect,
and 5)large dynamic range. The disadvantages can be summarized into: 1)requirement for
tuning circuits and 2)limited working frequency caused by OTAs.
For gm-C filters, the advantages can be summarized into: 1)high precision with tuning, 2)able
to be realized based on simple open-loop OTAs, 3)lower power consumption than active-RC
filters, 4)no sampling effect, and 5)good frequency performance. The disadvantages can be
summarized into: 1)requirement for complex on-chip tuning circuits, 2)poor dynamic range,
and 3)sensitive to parasitics.
According to the transfer characters, the filters can also be divided into four types: 1)Butter-
worth filters, which has the maximum flat amplitude in the pass band; 2)Chebyshev filters,
which has the minimum ripples in the pass band; 3)Bessel filters, which has the maximum flat
of group delay; 4)Ellipse filters, which has the minimum transition band. The other characters
of these filters are summarized into Table 3.
Design of Radio-Frequency Transceivers for Wireless Sensor Networks 263
• The second intercept point (for zero-IF or low-IF receivers);
• The voltage or power conversion gain;
• The isolation between the RF port and the LO port, the RF port and the IF port, and the LO
port and the IF port;
• The magnitude and phase imbalance between I and Q channel down converters (for the
receivers and transmitters that use I and Q dual-path converters);
• The power consumption;
A classical mixer is known as the Gilbert cell, as shown in Fig. 8. I
B
is a current source, RF+
and RF− are the differential RF input ports, LO+ and LO− are the differential LO input ports,
and the output differential currents are I
OUT
+ and I
OUT
−; M1 and M2 convert the input RF
voltage into current, and M3-M6 are used as switches for mixing.
Fig. 8. The Gilbert cell.
The Gilbert mixer is a typical example of active mixers, which have high gain, low noise, but
poor linearity. Another type of mixers are called passive mixers, which usually have low gain,
large noise and high linearity. The passive mixers can be divided into two types: 1)voltage-
mode mixers: the MOS switches are used for voltage switches, and loaded with high resis-
tance. Because of the nonlinearity of the switches, distortions will be enlarged when the am-
plitudes of RF and IF signals are increased and the switches are modulated. 2)Current-mode
mixers: the MOS switches are used for current switches, and loaded with low resistance. So
the amplitudes of RF and IF signals are relatively low in current-mode mixers, then the linear-
ity is improved. A typical example of current-mode passive mixers is shown in Fig. 9 (Valla
et al., 2005). The input I
IN
is a differential current signal, the output V
OUT
is a voltage sig-
nal. Transistors M1-M4 are used for switches that are controlled by the LO signals LO
+ and
LO
−. An OTA (OperaTional Amplifier) together with resistors R1, R2 and capacitors C1, C2
is adopted to amplify and filter the signals. Two additional capacitors C3 and C4 are used to
generate an extra pole to suppress the amplitude. The LNA and mixers are often designed
and tested together to realize an optimized trade-off among gain, noise figure and linearity
for different applications.
The distribution of WSN nodes is random, and the distance between two nodes may be very
short or very long, so the dynamic range of the transceivers is very important. According
to equation (11), in order to improve the SFDR performance, the noise figure needs to be
Fig. 9. A typical current-mode passive mixer.
decreased and the IIP3 needs to be enhanced. Therefore, a combination of a low-noise induc-
tively source degenerated LNA and a current-mode passive mixer can be adopted for WSN
usages.
4.3 Active Filter
According to the pattern of implement, the active filters usually used for transceivers can be
summarized into three types: 1)switched-capacitor filters, in which the resistors are replaced
by switched capacitors; 2)active-RC filters, which is composed of OTAs and resistor-capacitor
networks; 3)gm-C filters, in which the resistors and inductors are replaced by transconductors.
For switched-capacitor filters, the advantages can be summarized here: 1)high precision with-
out tuning, 2)small chip area and low power, and 3)insensitive to parasitics. However, there
are several disadvantages: 1)affected by sampling, 2)requirement for extra clock generation
circuit, and 3)not suitable for high-frequency applications.
For active-RC filters, the advantages can be summarized into: 1)high precision with tuning,
2)easy to design with classical RC structures, 3)insensitive to parasitics, 4)no sampling effect,
and 5)large dynamic range. The disadvantages can be summarized into: 1)requirement for
tuning circuits and 2)limited working frequency caused by OTAs.
For gm-C filters, the advantages can be summarized into: 1)high precision with tuning, 2)able
to be realized based on simple open-loop OTAs, 3)lower power consumption than active-RC
filters, 4)no sampling effect, and 5)good frequency performance. The disadvantages can be
summarized into: 1)requirement for complex on-chip tuning circuits, 2)poor dynamic range,
and 3)sensitive to parasitics.
According to the transfer characters, the filters can also be divided into four types: 1)Butter-
worth filters, which has the maximum flat amplitude in the pass band; 2)Chebyshev filters,
which has the minimum ripples in the pass band; 3)Bessel filters, which has the maximum flat
of group delay; 4)Ellipse filters, which has the minimum transition band. The other characters
of these filters are summarized into Table 3.
Wireless Sensor Networks: Application-Centric Design264
Type
Amplitude-Frequency Characteristic Phase-Frequency
Pass Band Stop Band Transition Band characteristic
Butterworth Flat
Monotonic Gentle Monotonic
Moderate
Decreasing Decreasing
Chebyshev Fluctuant
Monotonic Steep Monotonic
Poor
Decreasing Decreasing
Bessel Flat
Monotonic Slowly Monotonic
Excellent
Decreasing Decreasing
Ellipse Fluctuant Fluctuant
Steep Monotonic
Poor
Decreasing
Table 3. The characteristics of different filters.
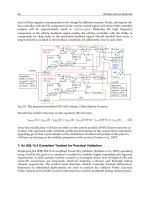
In wireless transceivers, there is a special kind of filter named complex filter, which is usu-
ally used in low-IF receivers for image rejection. A classical complex filter is designed in
1995 (Crols & Steyaert, 1995). Fig. 10 shows the block diagram, which has I/Q dual-path in-
puts and I/Q dual-path outputs. The input of the Q path Q
IN
is 90
◦
delay of the input of the
I path I
IN
, and the output of Q path Q
OUT
is also 90
◦
delay of the output of the I path I
OUT
.
That is Q
IN
= −jI
IN
and Q
OUT
= −jI
OUT
. The transfer function of this complex filter can be
Fig. 10. The block diagram of a first-order complex filter.
expressed as:
H
c f
(jω) =
A
1 + j(ω − ω
c
)/ω
o
(32)
where ω
c
is the central frequency, and 2ω
o
is the double-sideband bandwidth. It is equivalent
to a low-pass filter’s pass band moved by ω
c
, and then the transfer curves of positive and
negative frequency become asymmetric. As a result, the image can be rejected.
As shown in Table 2, low-IF transceivers has the advantages of easy to be integrated and
immune to DC offset, so the low-IF SDR transceiver is adopted in many WSN applications.
Besides, the data rate of WSN is usually not very high, then the IF can be relatively low and
gm-C filters are not necessary. Therefore, an active-RC complex filter is suitable for such WSN
receivers because of their low power, large dynamic range and image rejection function.
4.4 Phase-Locked Loop
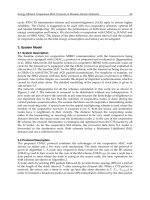
The PLL is the core part of a transceiver system, as it’s used for both the down-converting
in receiver and the up-converting in transmitter. A typical sigma-delta charge-pump PLL is
shown in Fig. 11 (Zhao et al., 2009), which is composed of a PFD (Phase-Frequency Detector), a
charge pump, a loop filter, a VCO (Voltage-Controlled Oscillator), a multi-modulus frequency
divider, and a sigma-delta modulator. Although the all-digital PLL has appeared in recent
years, the classical charge-pump PLL is still widely used in the industrial community.
Fig. 11. A typical sigma-delta charge-pump PLL (Zhao et al., 2009).
For WSN transceivers, we tend to design low-power, full-integrated and fast-settling PLL.
The power of the PLL is mainly limited by these modules: 1)VCO (Voltage-Controlled Os-
cillator), 2)prescaler, and 3)the buffer connected at the output of VCO. Therefore, the power
reduction of these modules is significant to the low-power design of PLL.
For full-integrated design, the chip area needs to be decreased. In a typical PLL, the LF (Loop
Filter) and the inductors in LC-tank VCO take up the largest chip area. In order to decrease
the area of LF, some one has proposed a discrete-time architecture (Zhang et al., 2003). For the
applications in low-frequency bands, the inductors will be large if the resonant frequency of
the VCO is low, so the VCO is required to be designed at a high frequency with a frequency
divider connected after it.
The settling speed of PLL is decided by the loop bandwidth. Too Large bandwidth brings
not only fast settling, but also large in-band noise and spurs. As a result, there is a trade-off
between the settling speed, and the phase noise and the spur performance. How to set the
trade-off depends on the requirement of the transceiver system.
As we referenced in section 2.2, the PLL can be adopted for directly digital modulation, and
such method is proposed by Perrott in 1997 (Perrott et al., 1997). The architecture of such PLL
based transmitter is shown in Fig. 12. The data stream can be shaped by a filter firstly, then the
shaped data are input into the sigma-delta modulator in order to change the dividing ratio. As
a result, the output frequency can be modulated by the variation of dividing ratio according
to the input data, and the FSK signals can be generated in this way. A PA is connected at the
output of the PLL so that the FSK signals can be emitted through an antenna. Generally, the
data rate can not be larger than the bandwidth of the PLL. Although some one has proposed
a compensation technology with a digital filter whose transfer function is the reciprocal of
PLL’s (Perrott et al., 1997), mismatch and inaccuracy depress the performance in actual de-
signs. As a result, we would rather enlarge the bandwidth of PLL to obtain a relatively high
data rate.
Design of Radio-Frequency Transceivers for Wireless Sensor Networks 265
Type
Amplitude-Frequency Characteristic Phase-Frequency
Pass Band Stop Band Transition Band characteristic
Butterworth Flat
Monotonic Gentle Monotonic
Moderate
Decreasing Decreasing
Chebyshev Fluctuant
Monotonic Steep Monotonic
Poor
Decreasing Decreasing
Bessel Flat
Monotonic Slowly Monotonic
Excellent
Decreasing Decreasing
Ellipse Fluctuant Fluctuant
Steep Monotonic
Poor
Decreasing
Table 3. The characteristics of different filters.
In wireless transceivers, there is a special kind of filter named complex filter, which is usu-
ally used in low-IF receivers for image rejection. A classical complex filter is designed in
1995 (Crols & Steyaert, 1995). Fig. 10 shows the block diagram, which has I/Q dual-path in-
puts and I/Q dual-path outputs. The input of the Q path Q
IN
is 90
◦
delay of the input of the
I path I
IN
, and the output of Q path Q
OUT
is also 90
◦
delay of the output of the I path I
OUT
.
That is Q
IN
= −jI
IN
and Q
OUT
= −jI
OUT
. The transfer function of this complex filter can be
Fig. 10. The block diagram of a first-order complex filter.
expressed as:
H
c f
(jω) =
A
1
+ j(ω −ω
c
)/ω
o
(32)
where ω
c
is the central frequency, and 2ω
o
is the double-sideband bandwidth. It is equivalent
to a low-pass filter’s pass band moved by ω
c
, and then the transfer curves of positive and
negative frequency become asymmetric. As a result, the image can be rejected.
As shown in Table 2, low-IF transceivers has the advantages of easy to be integrated and
immune to DC offset, so the low-IF SDR transceiver is adopted in many WSN applications.
Besides, the data rate of WSN is usually not very high, then the IF can be relatively low and
gm-C filters are not necessary. Therefore, an active-RC complex filter is suitable for such WSN
receivers because of their low power, large dynamic range and image rejection function.
4.4 Phase-Locked Loop
The PLL is the core part of a transceiver system, as it’s used for both the down-converting
in receiver and the up-converting in transmitter. A typical sigma-delta charge-pump PLL is
shown in Fig. 11 (Zhao et al., 2009), which is composed of a PFD (Phase-Frequency Detector), a
charge pump, a loop filter, a VCO (Voltage-Controlled Oscillator), a multi-modulus frequency
divider, and a sigma-delta modulator. Although the all-digital PLL has appeared in recent
years, the classical charge-pump PLL is still widely used in the industrial community.
Fig. 11. A typical sigma-delta charge-pump PLL (Zhao et al., 2009).
For WSN transceivers, we tend to design low-power, full-integrated and fast-settling PLL.
The power of the PLL is mainly limited by these modules: 1)VCO (Voltage-Controlled Os-
cillator), 2)prescaler, and 3)the buffer connected at the output of VCO. Therefore, the power
reduction of these modules is significant to the low-power design of PLL.
For full-integrated design, the chip area needs to be decreased. In a typical PLL, the LF (Loop
Filter) and the inductors in LC-tank VCO take up the largest chip area. In order to decrease
the area of LF, some one has proposed a discrete-time architecture (Zhang et al., 2003). For the
applications in low-frequency bands, the inductors will be large if the resonant frequency of
the VCO is low, so the VCO is required to be designed at a high frequency with a frequency
divider connected after it.
The settling speed of PLL is decided by the loop bandwidth. Too Large bandwidth brings
not only fast settling, but also large in-band noise and spurs. As a result, there is a trade-off
between the settling speed, and the phase noise and the spur performance. How to set the
trade-off depends on the requirement of the transceiver system.
As we referenced in section 2.2, the PLL can be adopted for directly digital modulation, and
such method is proposed by Perrott in 1997 (Perrott et al., 1997). The architecture of such PLL
based transmitter is shown in Fig. 12. The data stream can be shaped by a filter firstly, then the
shaped data are input into the sigma-delta modulator in order to change the dividing ratio. As
a result, the output frequency can be modulated by the variation of dividing ratio according
to the input data, and the FSK signals can be generated in this way. A PA is connected at the
output of the PLL so that the FSK signals can be emitted through an antenna. Generally, the
data rate can not be larger than the bandwidth of the PLL. Although some one has proposed
a compensation technology with a digital filter whose transfer function is the reciprocal of
PLL’s (Perrott et al., 1997), mismatch and inaccuracy depress the performance in actual de-
signs. As a result, we would rather enlarge the bandwidth of PLL to obtain a relatively high
data rate.
Wireless Sensor Networks: Application-Centric Design266
Fig. 12. A transmitter based on PLL directly digital modulation.
For WSN usages, the data rate is often not high, so such PLL directly digital modulation is a
reasonable choice for common frequency and phase modulation schemes, such as FSK, MSK,
and so on. As a result, mixers can be moved away, the cost and power consumption of the
WSN transmitter can be saved a lot.
4.5 Power Amplifier
Generally, PA is the most power hungry module of a transceiver. Therefore, the output power
of PA is usually relatively small for WSN usages, as shown in Table 1. The types of PA can be
divided into class A, B, C, AB, D, E, F and F
−1
.
For class-A PAs, the amplifier MOSFET is kept in the saturation region. The transistor always
dissipates power because the product of drain current and drain voltage is always positive.
It should be noticed that the maximum theoretical drain efficiency of class-A PAs is just 50%.
However, drain efficiencies of 30
∼50% are common for practical class-A PA designs. The nor-
malized power output capability is about 1/8. The class-A amplifier provides high linearity
at the cost of low efficiency and relatively large device stresses.
In a class-B PA, the device is shut off in half of every cycle. It should be mentioned that
most practical class-B PAs are push-pull configurations of two MOSFETs. The peak drain
current and maximum output voltage are the same as for the class-A PAs. The maximum
drain efficiency for a class-B PA is 78.5%. The normalized power capability of the class-B PAs
is 1/8, the same as for class-A PAs, since the output power, maximum drain voltage, and
maximum drain current are the same.
In a class-C PA, the transistor conducts less than half the time. As the conduction angle shrinks
toward zero, the efficiency approaches 100%, but the gain and output power unfortunately
also tend toward zero at the same time. Furthermore, the normalized power capability of
class-C PAs approaches zero as the conduction angle approaches zero. In one word, the effi-
ciency can be large, but at the cost of normalized power capability, gain, and linearity.
The class-AB Pas conducts between 50% and 100% of a cycle. Both the conduction angle and
efficiency of class-AB PA vary between that of class-A PA and class-B PA.
In a class-D PA, only one transistor is driven on at a given time, and one transistor handles
the positive half-cycles and the other handles the negative half-cycles, just as a push-pull
class-B PA. The difference between class-D and class-B is that the transistors are driven hard
enough to make them act like switches for class-D PA, rather than as linear amplifiers. The
normalized power capability of class-D PAs is about 0.32, which is better than a class-B push-
pull and much better than a class-A PA. The MOS switches in class-D PAs function well only
at frequencies substantially below f
T
, which is the cut-off frequency. Usually, one transistor
fails to turn completely off before the other turns on, then the efficient is deteriorated.
The class-E PA uses a high-order reactive network that provides enough space to shape the
switch voltage to have both zero value and zero slope at switch turn-on, then the switch loss
is reduced. The efficiency can approach theoretically 100% with idea switches. The normal-
ized power capability is about 0.098, which is worse than class-A PA. The class-E PA is more
demanding of its switch performance than even class-A PAs because of the poor power capa-
bility and the reduced efficiency due to switch turn-off losses.
The termination of a class-F PA appears as an open circuit at odd harmonics of the carrier
beyond the fundamental and as a short circuit at even harmonics, while the class-F
−1
employs
a termination that appears as an open circuit at even harmonics and as a short circuit at the
odd harmonics. The class-F PA is capable of 100% efficiency in principle. The normalized
power capability of class-F PAs is about 0.16, which is half that of the class-D PAs.
In summary, there is a trade-off between the efficiency and the linearity. For receivers with
constant-envelope modulation, such as FSK, high-efficiency PAs can be adopted; for linear
operation such as ASK (Amplitude Shift Keying), or systems with high ACPR requirement,
high-linearity PAs can be adopted.
The high-efficiency PAs such as class-E are usually used in WSN transceivers, as the power
consumption is the most significant specifications of WSN system.
4.6 IF circuits
The function of IF circuits includes demodulation, data decision, and clock recovery. There
are two main kinds of IF circuits: 1)the digital scheme. In common receivers, an ADC is
connected after the RF front end, and the frequency detecting, data decision and received
signal strength indicating are all realized in digital domain, then the performance of the circuit
can be easily improved in digital domain. Such is the general architecture for SDR as we
described in section 2.5. However, the ADC usually consumes a large amount of power, and a
high-linearity AGC circuit is required before the ADC. 2)The analog scheme. For low-power
applications such as WSN, the CMOS analog resolution is sometimes a reasonable choice since
the power consumption can be saved a lot.
4.7 ADC and DAC
There are two kinds of ADCs in a WSN node. One is connected after the sensor and used for
data sampling, as shown in Fig. 1; and another is used in the transceiver, as shown in Fig. 6.
The main parameters of an ADC can be summarized into several aspects:
• Resolution: The minimum voltage level that can be discriminated by the ADC is V
re f
/2
N
for a N-bit ADC with an input range from 0 to V
re f
.
• DNL (Differential Non-Linearity): The maximum deviation between the actual conversion
step and the idea conversion step.
• INL (Integrated Non-Linearity): The maximum deviation of actual center of bin from its
idea location.
• Offset: The non-zero voltage or current at the output of the ADC when the input is zero
since the OTAs or comparators have offset voltages and offset currents.
• Gain Error: The deviation of actual input voltage from the idea value when the ADC out-
puts the full-scale bits.
Design of Radio-Frequency Transceivers for Wireless Sensor Networks 267
Fig. 12. A transmitter based on PLL directly digital modulation.
For WSN usages, the data rate is often not high, so such PLL directly digital modulation is a
reasonable choice for common frequency and phase modulation schemes, such as FSK, MSK,
and so on. As a result, mixers can be moved away, the cost and power consumption of the
WSN transmitter can be saved a lot.
4.5 Power Amplifier
Generally, PA is the most power hungry module of a transceiver. Therefore, the output power
of PA is usually relatively small for WSN usages, as shown in Table 1. The types of PA can be
divided into class A, B, C, AB, D, E, F and F
−1
.
For class-A PAs, the amplifier MOSFET is kept in the saturation region. The transistor always
dissipates power because the product of drain current and drain voltage is always positive.
It should be noticed that the maximum theoretical drain efficiency of class-A PAs is just 50%.
However, drain efficiencies of 30
∼50% are common for practical class-A PA designs. The nor-
malized power output capability is about 1/8. The class-A amplifier provides high linearity
at the cost of low efficiency and relatively large device stresses.
In a class-B PA, the device is shut off in half of every cycle. It should be mentioned that
most practical class-B PAs are push-pull configurations of two MOSFETs. The peak drain
current and maximum output voltage are the same as for the class-A PAs. The maximum
drain efficiency for a class-B PA is 78.5%. The normalized power capability of the class-B PAs
is 1/8, the same as for class-A PAs, since the output power, maximum drain voltage, and
maximum drain current are the same.
In a class-C PA, the transistor conducts less than half the time. As the conduction angle shrinks
toward zero, the efficiency approaches 100%, but the gain and output power unfortunately
also tend toward zero at the same time. Furthermore, the normalized power capability of
class-C PAs approaches zero as the conduction angle approaches zero. In one word, the effi-
ciency can be large, but at the cost of normalized power capability, gain, and linearity.
The class-AB Pas conducts between 50% and 100% of a cycle. Both the conduction angle and
efficiency of class-AB PA vary between that of class-A PA and class-B PA.
In a class-D PA, only one transistor is driven on at a given time, and one transistor handles
the positive half-cycles and the other handles the negative half-cycles, just as a push-pull
class-B PA. The difference between class-D and class-B is that the transistors are driven hard
enough to make them act like switches for class-D PA, rather than as linear amplifiers. The
normalized power capability of class-D PAs is about 0.32, which is better than a class-B push-
pull and much better than a class-A PA. The MOS switches in class-D PAs function well only
at frequencies substantially below f
T
, which is the cut-off frequency. Usually, one transistor
fails to turn completely off before the other turns on, then the efficient is deteriorated.
The class-E PA uses a high-order reactive network that provides enough space to shape the
switch voltage to have both zero value and zero slope at switch turn-on, then the switch loss
is reduced. The efficiency can approach theoretically 100% with idea switches. The normal-
ized power capability is about 0.098, which is worse than class-A PA. The class-E PA is more
demanding of its switch performance than even class-A PAs because of the poor power capa-
bility and the reduced efficiency due to switch turn-off losses.
The termination of a class-F PA appears as an open circuit at odd harmonics of the carrier
beyond the fundamental and as a short circuit at even harmonics, while the class-F
−1
employs
a termination that appears as an open circuit at even harmonics and as a short circuit at the
odd harmonics. The class-F PA is capable of 100% efficiency in principle. The normalized
power capability of class-F PAs is about 0.16, which is half that of the class-D PAs.
In summary, there is a trade-off between the efficiency and the linearity. For receivers with
constant-envelope modulation, such as FSK, high-efficiency PAs can be adopted; for linear
operation such as ASK (Amplitude Shift Keying), or systems with high ACPR requirement,
high-linearity PAs can be adopted.
The high-efficiency PAs such as class-E are usually used in WSN transceivers, as the power
consumption is the most significant specifications of WSN system.
4.6 IF circuits
The function of IF circuits includes demodulation, data decision, and clock recovery. There
are two main kinds of IF circuits: 1)the digital scheme. In common receivers, an ADC is
connected after the RF front end, and the frequency detecting, data decision and received
signal strength indicating are all realized in digital domain, then the performance of the circuit
can be easily improved in digital domain. Such is the general architecture for SDR as we
described in section 2.5. However, the ADC usually consumes a large amount of power, and a
high-linearity AGC circuit is required before the ADC. 2)The analog scheme. For low-power
applications such as WSN, the CMOS analog resolution is sometimes a reasonable choice since
the power consumption can be saved a lot.
4.7 ADC and DAC
There are two kinds of ADCs in a WSN node. One is connected after the sensor and used for
data sampling, as shown in Fig. 1; and another is used in the transceiver, as shown in Fig. 6.
The main parameters of an ADC can be summarized into several aspects:
• Resolution: The minimum voltage level that can be discriminated by the ADC is V
re f
/2
N
for a N-bit ADC with an input range from 0 to V
re f
.
• DNL (Differential Non-Linearity): The maximum deviation between the actual conversion
step and the idea conversion step.
• INL (Integrated Non-Linearity): The maximum deviation of actual center of bin from its
idea location.
• Offset: The non-zero voltage or current at the output of the ADC when the input is zero
since the OTAs or comparators have offset voltages and offset currents.
• Gain Error: The deviation of actual input voltage from the idea value when the ADC out-
puts the full-scale bits.
Wireless Sensor Networks: Application-Centric Design268
• SNR (Signal-to-Noise Ratio): The theory equation of SNR for a N-bit ADC can be expressed
as:
SNR
= 6.02N + 1.76 (33)
• SNDR (Signal-to-Noise and Distortion Ratio): The power of the noise and harmonics di-
vided by the power of signal.
• SFDR (Spurious Free Dynamic Range): The ratio of the signal’s power to the maximum
harmonic’s power.
• ENOB (Effective Number of Bits): The ENOB can be calculated by:
ENOB
= ( SNDR − 1.76)/6.02 (34)
• THD (Total Harmonic Distortion): The ratio of all the harmonics’ power to the signal’s
power.
Besides the specifications above, another very important parameter is power consumption. In
the aspect of architecture, the ADCs can be divided into flash, SAR (Successive AppRoxima-
tion), folding, pipeline, sigma-delta, and so on.
For the ADC connected after the sensor in a WSN node, SAR ADCs may be the best choice
since the data collection is executed at most of the time. There are two reasons: 1)The only
power hungry module in a SAR ADC is the comparator, so the overall power consumption
is low; 2)the circuit structure of a SAR ADC is simple, so the cost of chip area is small. In the
WSN transceivers, the data rate is not high and the modulation scheme is simple, so a low
bandwidth and low precision ADC is usually enough. Therefore, a SAR ADC may also be a
good choice for WSN transceivers.
The specifications of DAC also includes DNL, INL, SNR, SNDR, SFDR, power consumption,
and so on. The DACs are often used in transmitters, as shown in Fig. 6, the shaped digital
waves are converted to analog signals that are sent to up-converting mixers for modulation.
As a result, the performance of the DACs will affect the EVM and ACPR of the transmitters.
5. Conclusion
The goal of this chapter is to give a brief manual for WSN transceiver design. Section 1 gives
an introduction of WSN and the RF transceivers for WSN. The WSN transceivers are classi-
fied by both modulation schemes and architectures in section 2. How to calculate and assign
the system specifications are described in section 3. The design of key modules is analyzed
briefly in section 4. The readers is expected to master a top-to-down design method for WSN
transceivers through the chapter.
6. References
Crols, J. & Steyaert, M. (1995). An analog integrated polyphase filter for a high performance
low-IF receiver, Symposium on VLSI Circuits, Digest of Technical Papers, pp. 87–88.
Gu, Q. (2005). RF System Design of Transceivers for Wireless Communications, Springer Sci-
ence+Business Media, LLC,.
Jri, L., Chen, Y. & Yenlin, H. (2010). A Low-Power Low-Cost Fully-Integrated 60-GHz
Transceiver System With OOK Modulation and On-Board Antenna Assembly, IEEE
Journal of Solid-State Circuits, DOI-10.1109/JSSC.2009.2034806, 45(2): 264–275.
Perrott, M. H., Tewksbury, T. L. & Sodini, C. G. (1997). A 27-mW CMOS fractional-N syn-
thesizer using digital compensation for 2.5-Mb/s GFSK modulation, IEEE Journal of
Solid-State Circuits, DOI-10.1109/4.643663, 32(12): 2048–2060.
Pletcher, N. M., Gambini, S. & Rabaey, J. (2009). A 52 µW Wake-Up Receiver With -72 dBm
Sensitivity Using an Uncertain-IF Architecture, IEEE Journal of Solid-State Circuits,
DOI-10.1109/JSSC.2008.2007438, 44(1): 269–280.
Seungkee, M., Shashidharan, S., Stevens, M., Copani, T., Kiaei, S., Bakkaloglu, B. &
Chakraborty, S. (2010). A 2mW CMOS MICS-band BFSK transceiver with recon-
figurable antenna interface, IEEE Radio Frequency Integrated Circuits Symposium,,
pp. 289–292.
Valla, M., Montagna, G., Castello, R., Tonietto, R. & Bietti, I. (2005). A 72-mW CMOS 802.11a
direct conversion front-end with 3.5-dB NF and 200-kHz 1/f noise corner, IEEE Jour-
nal of Solid-State Circuits, DOI-10.1109/JSSC.2004.842847, 40(4): 970– 977.
Zhang, B., Allen, P. E. & Huard, J. M. (2003). A fast switching PLL frequency synthesizer
with an on-chip passive discrete-time loop filter in 0.25-µm CMOS, IEEE Journal of
Solid-State Circuits, 38(6): 855– 865.
Zhao, B., Mao, X., Yang, H. & Wang, H. (2009). A 1.41-1.72 GHz sigma-delta fractional-N
frequency synthesizer with a PVT insensitive VCO and a new prescaler, Analog Inte-
grated Circuits and Signal Processing, 59(3): 265–273.
Design of Radio-Frequency Transceivers for Wireless Sensor Networks 269
• SNR (Signal-to-Noise Ratio): The theory equation of SNR for a N-bit ADC can be expressed
as:
SNR
= 6.02N + 1.76 (33)
• SNDR (Signal-to-Noise and Distortion Ratio): The power of the noise and harmonics di-
vided by the power of signal.
• SFDR (Spurious Free Dynamic Range): The ratio of the signal’s power to the maximum
harmonic’s power.
• ENOB (Effective Number of Bits): The ENOB can be calculated by:
ENOB
= ( SNDR − 1.76)/6.02 (34)
• THD (Total Harmonic Distortion): The ratio of all the harmonics’ power to the signal’s
power.
Besides the specifications above, another very important parameter is power consumption. In
the aspect of architecture, the ADCs can be divided into flash, SAR (Successive AppRoxima-
tion), folding, pipeline, sigma-delta, and so on.
For the ADC connected after the sensor in a WSN node, SAR ADCs may be the best choice
since the data collection is executed at most of the time. There are two reasons: 1)The only
power hungry module in a SAR ADC is the comparator, so the overall power consumption
is low; 2)the circuit structure of a SAR ADC is simple, so the cost of chip area is small. In the
WSN transceivers, the data rate is not high and the modulation scheme is simple, so a low
bandwidth and low precision ADC is usually enough. Therefore, a SAR ADC may also be a
good choice for WSN transceivers.
The specifications of DAC also includes DNL, INL, SNR, SNDR, SFDR, power consumption,
and so on. The DACs are often used in transmitters, as shown in Fig. 6, the shaped digital
waves are converted to analog signals that are sent to up-converting mixers for modulation.
As a result, the performance of the DACs will affect the EVM and ACPR of the transmitters.
5. Conclusion
The goal of this chapter is to give a brief manual for WSN transceiver design. Section 1 gives
an introduction of WSN and the RF transceivers for WSN. The WSN transceivers are classi-
fied by both modulation schemes and architectures in section 2. How to calculate and assign
the system specifications are described in section 3. The design of key modules is analyzed
briefly in section 4. The readers is expected to master a top-to-down design method for WSN
transceivers through the chapter.
6. References
Crols, J. & Steyaert, M. (1995). An analog integrated polyphase filter for a high performance
low-IF receiver, Symposium on VLSI Circuits, Digest of Technical Papers, pp. 87–88.
Gu, Q. (2005). RF System Design of Transceivers for Wireless Communications, Springer Sci-
ence+Business Media, LLC,.
Jri, L., Chen, Y. & Yenlin, H. (2010). A Low-Power Low-Cost Fully-Integrated 60-GHz
Transceiver System With OOK Modulation and On-Board Antenna Assembly, IEEE
Journal of Solid-State Circuits, DOI-10.1109/JSSC.2009.2034806, 45(2): 264–275.
Perrott, M. H., Tewksbury, T. L. & Sodini, C. G. (1997). A 27-mW CMOS fractional-N syn-
thesizer using digital compensation for 2.5-Mb/s GFSK modulation, IEEE Journal of
Solid-State Circuits, DOI-10.1109/4.643663, 32(12): 2048–2060.
Pletcher, N. M., Gambini, S. & Rabaey, J. (2009). A 52 µW Wake-Up Receiver With -72 dBm
Sensitivity Using an Uncertain-IF Architecture, IEEE Journal of Solid-State Circuits,
DOI-10.1109/JSSC.2008.2007438, 44(1): 269–280.
Seungkee, M., Shashidharan, S., Stevens, M., Copani, T., Kiaei, S., Bakkaloglu, B. &
Chakraborty, S. (2010). A 2mW CMOS MICS-band BFSK transceiver with recon-
figurable antenna interface, IEEE Radio Frequency Integrated Circuits Symposium,,
pp. 289–292.
Valla, M., Montagna, G., Castello, R., Tonietto, R. & Bietti, I. (2005). A 72-mW CMOS 802.11a
direct conversion front-end with 3.5-dB NF and 200-kHz 1/f noise corner, IEEE Jour-
nal of Solid-State Circuits, DOI-10.1109/JSSC.2004.842847, 40(4): 970– 977.
Zhang, B., Allen, P. E. & Huard, J. M. (2003). A fast switching PLL frequency synthesizer
with an on-chip passive discrete-time loop filter in 0.25-µm CMOS, IEEE Journal of
Solid-State Circuits, 38(6): 855– 865.
Zhao, B., Mao, X., Yang, H. & Wang, H. (2009). A 1.41-1.72 GHz sigma-delta fractional-N
frequency synthesizer with a PVT insensitive VCO and a new prescaler, Analog Inte-
grated Circuits and Signal Processing, 59(3): 265–273.
MAC & Mobility In Wireless Sensor Networks 271
MAC & Mobility In Wireless Sensor Networks
Marwan Al-Jemeli, Vooi Voon Yap and Fawnizu Azmadi Bin Hussin
X
MAC & Mobility In Wireless Sensor Networks
Marwan Al-Jemeli
1
, Vooi Voon Yap
2
and Fawnizu Azmadi Bin Hussin
1
1
Universiti Teknologi PETRONAS
2
Universiti Tuanku Abdul Rahman
Malaysia
1. Introduction
The recent climate change has a significant impact on our planet environment. Therefore,
deploying sensor networks to monitor the environment is becoming important. With sensor
networks deployed in strategic location can provide the scientific communities useful data
to be analyzed and take action if necessary. Typical environmental applications of sensor
networks include, but not limited to, monitoring environmental conditions that affect crops
and livestock, biological, Earth, and environmental monitoring and many more. Monitoring
hazardous environment like volcanic activities is one of the important applications for
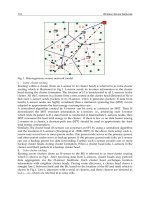
Wireless Sensor Network (WSN) (Sohraby et al, 2007). WSN communicate wirelessly to pass
and process information – see Figure 1.
These sensor networks are deployed far away from the nearest permanent energy source
available which make them depending on their own energy source to provide the needed
information.
WSNs usually consist of a large number of low-cost, low-power, multifunctional (or uni-
functional) wireless devices deployed over a geographical area in an ad hoc fashion and
with or without careful planning (this depends on the application mainly whether it is
related to a real-time applications or non-real-time application). Individually, these devices
have limited resources and have limited processing and communication capabilities. The
cooperative operation behavior of these sensing devices gives a significant impact on a wide
range of applications in several fields, including science and engineering, military settings,
critical infrastructure protection, and environmental monitoring (Yu et al, 2006).
Networking distributed sensors are used in military and industrial applications and it dates
back at least to the 1970s. back then the systems were primarily wired and small in scale.
wireless technologies and low-power Very Large Scale of Integration (VLSI) design became
feasible and emerged in 1990 and after that researchers began envisioning and investigating
large-scale embedded wireless sensor networks for dense sensing applications
(Krishnamachari, 2005).
However, wireless sensor networks have a major problem, that is, “network life time”. Since
WSN uses batteries, it does them in terms of storage, and processing power. Limited
capabilities results in limited information efficiency. Current available technology on-shelf
15
Wireless Sensor Networks: Application-Centric Design272
allow us to produce sensors that consumes as little power as 100mW which means that the
sensors can remain operational efficiently (depending on the application and the deployed
nodes own capabilities) for about 10 months. Yet the life time of the network can be
extended for further than 10 months.
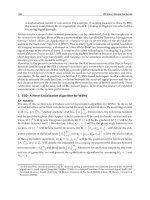
Fig. 1. Wireless Sensor Networks Example.
Some researchers proposed methods includes energy harvesting, solar energy and vibration
energy. But these methods can only provide a small amount of energy to power these
sensors, typically 20mw or less (Mainwaring et al,2002; Raghunathan et al, 2002).
Maintenance and recharging these sensors is not a good option, and it will increase the
expenses to keep the network alive and operational. Another alternative is to use energy
efficient information processing and transacting algorithms to manage the network
operation. We envisage that efficient routing and Medium Access Control (MAC) Protocols
can help resolve this problem.
Information processing and routing is a technique used widely when it comes to provide a
longer life time operation in wireless sensor networks however these techniques lacks the
integrity as it has to compensate between either providing an energy efficient operation
with the lack of high throughput or vice versa (Boukerche et al, 2005; Branyard et al, 2006).
Mobile
Client
Web
Client
Inst. Client
Wind
Speed > 5
One of the major levels of tweaking in networking systems is to manipulate the timing when
to deliver particular packets at a precise times to achieve efficient operation. From the
literature provided most of the available approaches consider the main purpose of
manipulating information processing technique is to achieve better energy consumption in
the nodes while sacrificing the system throughput quality and robustness (Branyard et al,
2006). the next section will discuss MAC theory and the related works that where done in
this area of research follows it in section three our own theory and methodology. Section
four and five will discuss the results that where obtained during our research . Section six
will review Mobility issues in brief and section seven reviews our proposed future goals in
this research.
2. MAC protocols effect in WSNs
MAC is the second layer after the physical layer in the Open System Interconnection (OSI)
model in networking systems, MAC protocols controls when to send and receive
distinguished packet between different nodes in a network. It controls the network interface
when to establish the connection or the transaction between two or more hosts.
Manipulating the operation of a MAC protocol can give its effect in terms of energy
consumption and message delay between nodes (Van Hoesel, Havigna, 2004).
Different MAC protocols were defined for WSN because of its application dependency.
MAC protocols have to compensate between providing energy efficient consumption with
the availability of decent throughput to make the system dependable (Van Hoesel, Havigna,
2004; Law et al, 2005) .
An essential characteristic of wireless communication is that it provides an inherently
shared medium. All MAC protocols for wireless networks manage the usage of the radio
interface to ensure efficient utilization of the shared bandwidth. MAC protocols designed
for wireless sensor networks have an additional goal of managing radio activity to conserve
energy. Thus, while traditional MAC protocols must balance throughput, delay, and
fairness concerns, WSN MAC protocols place an emphasis on energy efficiency as well
(Krishnamachari, 2005). MAC layer affects the energy efficiency mainly through the
adjustment of transmission scheduling and channel access. A common way to do that is via
sleep scheduling from a long time scale, or time-division multiple access (TDMA), from a
short time scale perspective. Similar to the shutdown technique of CPUs, sleep scheduling
also explores the energy vs. response time tradeoffs in wireless communication. From
previous studies, the response time is translated to network or application layer
transmission delay or throughput.
(Mathioudakis et al, 2008) presented the most energy wastage sources in MAC protocols for
WSNs:
The first source is caused by collisions, which occur when two or more nodes attempt
to transmit simultaneously. The need to re-transmit a packet that has been corrupted by
collision increases the energy consumption.
The second source of energy wastage is idle-listening, where a node listens for traffic
that it is not sent. In a sample fetching operation, a silent channel can be high in several
sensor applications.
The third source of waste is overhearing, which occurs when a sensor node receives
packets that are destined for other nodes.
MAC & Mobility In Wireless Sensor Networks 273
allow us to produce sensors that consumes as little power as 100mW which means that the
sensors can remain operational efficiently (depending on the application and the deployed
nodes own capabilities) for about 10 months. Yet the life time of the network can be
extended for further than 10 months.
Fig. 1. Wireless Sensor Networks Example.
Some researchers proposed methods includes energy harvesting, solar energy and vibration
energy. But these methods can only provide a small amount of energy to power these
sensors, typically 20mw or less (Mainwaring et al,2002; Raghunathan et al, 2002).
Maintenance and recharging these sensors is not a good option, and it will increase the
expenses to keep the network alive and operational. Another alternative is to use energy
efficient information processing and transacting algorithms to manage the network
operation. We envisage that efficient routing and Medium Access Control (MAC) Protocols
can help resolve this problem.
Information processing and routing is a technique used widely when it comes to provide a
longer life time operation in wireless sensor networks however these techniques lacks the
integrity as it has to compensate between either providing an energy efficient operation
with the lack of high throughput or vice versa (Boukerche et al, 2005; Branyard et al, 2006).
Mobile
Client
Web
Client
Inst. Client
Wind
Speed > 5
One of the major levels of tweaking in networking systems is to manipulate the timing when
to deliver particular packets at a precise times to achieve efficient operation. From the
literature provided most of the available approaches consider the main purpose of
manipulating information processing technique is to achieve better energy consumption in
the nodes while sacrificing the system throughput quality and robustness (Branyard et al,
2006). the next section will discuss MAC theory and the related works that where done in
this area of research follows it in section three our own theory and methodology. Section
four and five will discuss the results that where obtained during our research . Section six
will review Mobility issues in brief and section seven reviews our proposed future goals in
this research.
2. MAC protocols effect in WSNs
MAC is the second layer after the physical layer in the Open System Interconnection (OSI)
model in networking systems, MAC protocols controls when to send and receive
distinguished packet between different nodes in a network. It controls the network interface
when to establish the connection or the transaction between two or more hosts.
Manipulating the operation of a MAC protocol can give its effect in terms of energy
consumption and message delay between nodes (Van Hoesel, Havigna, 2004).
Different MAC protocols were defined for WSN because of its application dependency.
MAC protocols have to compensate between providing energy efficient consumption with
the availability of decent throughput to make the system dependable (Van Hoesel, Havigna,
2004; Law et al, 2005) .
An essential characteristic of wireless communication is that it provides an inherently
shared medium. All MAC protocols for wireless networks manage the usage of the radio
interface to ensure efficient utilization of the shared bandwidth. MAC protocols designed
for wireless sensor networks have an additional goal of managing radio activity to conserve
energy. Thus, while traditional MAC protocols must balance throughput, delay, and
fairness concerns, WSN MAC protocols place an emphasis on energy efficiency as well
(Krishnamachari, 2005). MAC layer affects the energy efficiency mainly through the
adjustment of transmission scheduling and channel access. A common way to do that is via
sleep scheduling from a long time scale, or time-division multiple access (TDMA), from a
short time scale perspective. Similar to the shutdown technique of CPUs, sleep scheduling
also explores the energy vs. response time tradeoffs in wireless communication. From
previous studies, the response time is translated to network or application layer
transmission delay or throughput.
(Mathioudakis et al, 2008) presented the most energy wastage sources in MAC protocols for
WSNs:
The first source is caused by collisions, which occur when two or more nodes attempt
to transmit simultaneously. The need to re-transmit a packet that has been corrupted by
collision increases the energy consumption.
The second source of energy wastage is idle-listening, where a node listens for traffic
that it is not sent. In a sample fetching operation, a silent channel can be high in several
sensor applications.
The third source of waste is overhearing, which occurs when a sensor node receives
packets that are destined for other nodes.
Wireless Sensor Networks: Application-Centric Design274
The fourth is caused by control packet overheads, which are required to regulate access
to the transmission channel. Sending and receiving control packets consumes energy
too, and less useful data packets can be transmitted.
The fifth source is over-emitting where the destination node is not ready to receive
during the transmission procedure, and hence the packet is not correctly received.
Finally, the transition between different operation modes, such as sleep, idle, receive
and transmit, can result in significant energy consumption. Limiting the number of
transitions between sleep and active modes leads to a considerable energy saving.
2.1 Related Approaches
For wireless sensor networks the literature provided a lot of protocols and divided it into
two major categories (Shukur et al, 2009):
1. Contention Based MAC Protocols (CSMA carrier sense multiple access). The
wireless nodes here contend to enter the medium of connectivity (which is the
wireless medium in case of WSNs) and the winner node reserves the medium to
itself until it finishes its operation. Examples for this kind of protocols are: IEEE
802.11, S-MAC (Ye et al, 2001), T-MAC (Van Dam, Longendean, 2003), R-MAC (Du
et al, 2007) and others.
2. TDMA (time division multiple access) Based MAC Protocols. The medium here is
divided into time slots each node knows its time slot when to enter the medium
and do its operation. One popular TDMA based MAC protocol for WSNs is
ALOHA (PARK et al, 2006).
Contention based MAC protocols offers a more scalability approach over TDMA based
approaches because of the nature of TDMA approaches that requires slotting the time into
slots to each node which is improper when deploying a large number of nodes. To list dome
of the works in this area of research, follows are some approaches regarding CSMA based
MAC protocols:
A popular contention based MAC protocol for wireless networks is the IEEE 802.11 which is
the standard for WLAN applications. IEEE 802.11 performs well in terms of latency and
throughput but it is not efficient in terms of energy consumption because of the idle
listening problem. It has been shown that when the node is in idle listening state it
consumes energy equivalent to the receiving energy and that is why this protocol is not
suitable for WSNs applications (Ye et al, 2001).
Sensor-MAC, S-MAC is a contention based MAC protocol designed explicitly for wireless
sensor networks proposed by (Ye et al, 2001). While reducing energy consumption is the
primary goal of this design, the protocol also has good scalability and collision avoidance
capability. It achieves good scalability and collision avoidance by utilizing a combined
scheduling and contention scheme. It also achieves efficient energy consumption by using a
scheme of periodic listening and sleeping which reduces energy consumption. In addition, it
uses synchronization to form virtual clusters of nodes on the same sleep schedule. These
schedules coordinate nodes to minimize additional latency. The protocol also uses the same
mechanism to avoid the overhearing problem and hidden channel problem that is used in
IEEE 802.11. But the S-MAC has a problem of latency because of periodic listen and sleep
scheme which is dependent on the duty cycle.
WSNs applications have some unique operation characteristics, for example, low message
rate, insensitivity to latency. These characteristics can be exploited to reduce energy
consumption by introducing an active/sleep duty cycle. To handle load variations in time
and location, (Van Dam, Langendeon, 2003) proposed the Timeout MAC T-MAC protocol.
T-MAC can handle an adaptive duty cycle in a novel way: by dynamically ending the active
part of it. This reduces the amount of energy wasted on idle listening, in which nodes wait
for potentially incoming messages, while still maintaining a reasonable throughput. T-MAC
uses TA (time out) packet to end the active part when there is no data to send/receive on the
node. The protocol balances between energy efficient consumption and latency efficient
throughput due to the scheme of burst data sending more effective in terms of energy
consumption.
The concept of periodic listen and sleep approach was explored by (Suh, Ko, 2005). They
proposed a novel MAC scheme named as TEEM (Traffic aware, Energy Efficient MAC)
protocol. The proposed TEEM is based on the often cited contention-based MAC protocol S-
MAC. The protocol achieves energy efficient consumption by utilizing ‘traffic information’
of each sensor node.
Thus, Suh and Ko show that the listen time of nodes can be reduced by putting them into
sleep state earlier when they expect no data traffic to occur. In this method, they made two
important modifications to the S-MAC protocol: the first modification was to make all nodes
turn off the radio interface much earlier when no data packet transfer is expected to occur in
the networks, and secondly eliminating communication of a separate RTS control packet
even when data traffic is likely to occur. However, it lacks on latency efficiency to conserve
energy.
The cross-layer approach protocol was investigated by (Pack et al, 2006) . They proposed a
task aware MAC protocol for WSNs. The TA-MAC protocol determines the channel access
probability depending on a node’s and its neighbor nodes’ traffic loads through the
interaction with the data dissemination protocol. In this approach the TA-MAC protocol can
reduce energy consumption and improve the throughput by eliminating unnecessary
collisions. The TA-MAC protocol is feasible because it can be integrated with other energy
efficient MAC protocol example, SMAC. The TA-MAC protocol focuses on the
determination of channel access probability that is orthogonal to the previous MAC
protocols for WSNs.
Another work that explores the cross-layer approach was presented by (Du et al, 2007) . The
proposed scheme called Routing-enhanced MAC protocol (RMAC), exploits cross-layer
routing information in order provide delay guarantee without sacrificing energy efficiency.
Most importantly, RMAC can deliver a data packet multiple hops in a single operational
cycle. During the SLEEP period in RMAC, a relaying node for a data packet goes to sleep
and then wake up when its upstream node has the data packet ready to transmit to it. After
the data packet is received by this relaying node, it can also immediately forward the packet
to its next downstream node, as that node has just woken up and is ready to receive the data
packet. The mechanism is implemented using a packet called Pioneer. This packet travels to
MAC & Mobility In Wireless Sensor Networks 275
The fourth is caused by control packet overheads, which are required to regulate access
to the transmission channel. Sending and receiving control packets consumes energy
too, and less useful data packets can be transmitted.
The fifth source is over-emitting where the destination node is not ready to receive
during the transmission procedure, and hence the packet is not correctly received.
Finally, the transition between different operation modes, such as sleep, idle, receive
and transmit, can result in significant energy consumption. Limiting the number of
transitions between sleep and active modes leads to a considerable energy saving.
2.1 Related Approaches
For wireless sensor networks the literature provided a lot of protocols and divided it into
two major categories (Shukur et al, 2009):
1. Contention Based MAC Protocols (CSMA carrier sense multiple access). The
wireless nodes here contend to enter the medium of connectivity (which is the
wireless medium in case of WSNs) and the winner node reserves the medium to
itself until it finishes its operation. Examples for this kind of protocols are: IEEE
802.11, S-MAC (Ye et al, 2001), T-MAC (Van Dam, Longendean, 2003), R-MAC (Du
et al, 2007) and others.
2. TDMA (time division multiple access) Based MAC Protocols. The medium here is
divided into time slots each node knows its time slot when to enter the medium
and do its operation. One popular TDMA based MAC protocol for WSNs is
ALOHA (PARK et al, 2006).
Contention based MAC protocols offers a more scalability approach over TDMA based
approaches because of the nature of TDMA approaches that requires slotting the time into
slots to each node which is improper when deploying a large number of nodes. To list dome
of the works in this area of research, follows are some approaches regarding CSMA based
MAC protocols:
A popular contention based MAC protocol for wireless networks is the IEEE 802.11 which is
the standard for WLAN applications. IEEE 802.11 performs well in terms of latency and
throughput but it is not efficient in terms of energy consumption because of the idle
listening problem. It has been shown that when the node is in idle listening state it
consumes energy equivalent to the receiving energy and that is why this protocol is not
suitable for WSNs applications (Ye et al, 2001).
Sensor-MAC, S-MAC is a contention based MAC protocol designed explicitly for wireless
sensor networks proposed by (Ye et al, 2001). While reducing energy consumption is the
primary goal of this design, the protocol also has good scalability and collision avoidance
capability. It achieves good scalability and collision avoidance by utilizing a combined
scheduling and contention scheme. It also achieves efficient energy consumption by using a
scheme of periodic listening and sleeping which reduces energy consumption. In addition, it
uses synchronization to form virtual clusters of nodes on the same sleep schedule. These
schedules coordinate nodes to minimize additional latency. The protocol also uses the same
mechanism to avoid the overhearing problem and hidden channel problem that is used in
IEEE 802.11. But the S-MAC has a problem of latency because of periodic listen and sleep
scheme which is dependent on the duty cycle.
WSNs applications have some unique operation characteristics, for example, low message
rate, insensitivity to latency. These characteristics can be exploited to reduce energy
consumption by introducing an active/sleep duty cycle. To handle load variations in time
and location, (Van Dam, Langendeon, 2003) proposed the Timeout MAC T-MAC protocol.
T-MAC can handle an adaptive duty cycle in a novel way: by dynamically ending the active
part of it. This reduces the amount of energy wasted on idle listening, in which nodes wait
for potentially incoming messages, while still maintaining a reasonable throughput. T-MAC
uses TA (time out) packet to end the active part when there is no data to send/receive on the
node. The protocol balances between energy efficient consumption and latency efficient
throughput due to the scheme of burst data sending more effective in terms of energy
consumption.
The concept of periodic listen and sleep approach was explored by (Suh, Ko, 2005). They
proposed a novel MAC scheme named as TEEM (Traffic aware, Energy Efficient MAC)
protocol. The proposed TEEM is based on the often cited contention-based MAC protocol S-
MAC. The protocol achieves energy efficient consumption by utilizing ‘traffic information’
of each sensor node.
Thus, Suh and Ko show that the listen time of nodes can be reduced by putting them into
sleep state earlier when they expect no data traffic to occur. In this method, they made two
important modifications to the S-MAC protocol: the first modification was to make all nodes
turn off the radio interface much earlier when no data packet transfer is expected to occur in
the networks, and secondly eliminating communication of a separate RTS control packet
even when data traffic is likely to occur. However, it lacks on latency efficiency to conserve
energy.
The cross-layer approach protocol was investigated by (Pack et al, 2006) . They proposed a
task aware MAC protocol for WSNs. The TA-MAC protocol determines the channel access
probability depending on a node’s and its neighbor nodes’ traffic loads through the
interaction with the data dissemination protocol. In this approach the TA-MAC protocol can
reduce energy consumption and improve the throughput by eliminating unnecessary
collisions. The TA-MAC protocol is feasible because it can be integrated with other energy
efficient MAC protocol example, SMAC. The TA-MAC protocol focuses on the
determination of channel access probability that is orthogonal to the previous MAC
protocols for WSNs.
Another work that explores the cross-layer approach was presented by (Du et al, 2007) . The
proposed scheme called Routing-enhanced MAC protocol (RMAC), exploits cross-layer
routing information in order provide delay guarantee without sacrificing energy efficiency.
Most importantly, RMAC can deliver a data packet multiple hops in a single operational
cycle. During the SLEEP period in RMAC, a relaying node for a data packet goes to sleep
and then wake up when its upstream node has the data packet ready to transmit to it. After
the data packet is received by this relaying node, it can also immediately forward the packet
to its next downstream node, as that node has just woken up and is ready to receive the data
packet. The mechanism is implemented using a packet called Pioneer. This packet travels to
Wireless Sensor Networks: Application-Centric Design276
all sensors in down-stream to synchronize the duty-cycles of the nodes to guarantee a multi-
hop packet delivery. In this way the protocol achieved latency efficient operation.
(Erazo, Qain, 2007) developed the S-MAC to SEA-MAC, a protocol which aims for energy
efficient operation for WSNs for environment monitoring. The protocol assumes only the
base station node has the time synchronization schedule. Sensor nodes are active only when
there is a sample to be taken from the environment which decreases the duty-cycle of the
node and preserves energy. The packet which is responsible for initiating important data
delivery in SEA-MAC is called TONE packet which is shorter in period than SYNC packet in
S-MAC.
The literature trawl has revealed that few protocols use TDMA-based scheduling because of
the overhead of time slot scheduling as sensor network deployment usually includes large
number of sensors. A protocol that uses TDMA-based scheduling is the Energy and Rate
(ER) proposed by (Kannan et al, 2003). The ER_MAC protocol has the ability of avoiding
extra energy wastage.
The main advantages of ER-MAC are:
packet loss due to collisions is absent because two nodes do not transmit in the
same slot. Although packet loss may occur due to other reasons like interference,
loss of signal strength etc.
no contention mechanism is required for a node to start sensing its packets since
the slots are pre-assigned to each node. No extra control overhead packets for
contention are required.
ER-MAC uses the concept of periodic listen and sleep. A sensor node switches off its radio
and goes into a sleep mode only when it is in its own time slot and does not have anything
to transmit. It has to keep the radio awake in the slots assigned to its neighbors in order to
receive packets from them even if the node with current slot has nothing to transmit.
Real-Time MAC (RT-MAC) proposed by (Sahoo, Baronia, 2007) is another TDMA-based
MAC protocol that can provide delay guarantee. TDMA based MAC protocols suffers from
latency caused by the assigning of time slots which takes up a lot of time because of the
number of sensor nodes deployed. RT-MAC overcomes this problem by reutilizing the
connection channel between two successive channel accesses of a sensor node. RT-MAC also
allows sensors to go to sleep which preserves energy. Although it provides delay guarantee,
the RT-MAC protocol requires a lot of computation that exhaust the sensor node itself in
some cases like clock drifting problem.
There are other works on design of MAC protocol based on TDMA scheme (Ganeriwal et al,
2003; Egea-L'opez et al, 2006); they all share the same complexity in time slot assigning.
To summarize the investigated literature, we devised a table that illustrates the categories of
MAC protocols proposed for WSNs showing their advantages and disadvantages. Refer to
Table 2:
MAC
Protocol
Category Main Advantage Main Disadvantage
IEEE 802.11
CSMA/C
A
The Highest system throughput
Inefficient energy
consumption
S-MAC
CSMA/C
A
Scalable, energy efficient due to
the sleep/listen scheme
Suffers from Latency issues
T-MAC
CSMA/C
A
Energy efficient, Reasonable
throughput
Requires extended control
packet to achieve efficient
operation
TEEM
CSMA/C
A
Energy efficient due to the
eliminating the use of RTS
packet
Suffers from Latency issues
TA-MAC
CSMA/C
A
Cross-Layer approach Suffers from latency issues
R-MAC
CSMA/C
A
Enhanced throughput
Control Packet Delivery
overhead
SEA-MAC
CSMA/C
A
Energy efficient operation Suffers from Latency issues
ER-MAC TDMA Collision free environment Scalability and latency issues
RT-MAC TDMA
Increased the system
throughput
Excessive calculation and
clock drifting problems
Table 1. Summary of the related approaches for MAC Protocols.
3. Proposed solution and the methodology behind it
In this section we ill discuss our proposed solution and describe the operation on the
protocol. It also discusses how it manages control packets and data packets exchanges
between the network nodes. Energy consumption and packet exchange delay analysis are
also discussed. To prove the method proposed we devised simulation experiments using the
most common tool to simulate networking systems the Network Simulator 2 (NS2)
(Issariyakul, Hossain, 2008). The analysis equations were based on the theory of S-MAC.
3.1 The Network Simulator 2 (NS2)
NS2 is the most widely used tool in researches involved in general networking systems
analysis and wireless networking systems includes Mobile networking, Satellite networking,
Wireless Sensor Networks, LAN networks and other network technologies. NS2 is built
using C++ language and uses OTcl (Object Oriented Tcl) language as an interface with the
simulator. The network topology is built using OTcl and the packet operation protocol is
written in C++ (Issariyakul, Hossain, 2008).
3.1.2 Mobile Networking In NS2
The wireless model essentially consists of the MobileNode at the core, with additional
supporting features that allows simulations of multi-hop ad-hoc networks, wireless LANs
etc. A MobileNode thus is the basic Node object with added functionalities of a wireless and
mobile node like ability to move within a given topology, ability to receive and transmit
signals to and from a wireless channel.
MAC & Mobility In Wireless Sensor Networks 277
all sensors in down-stream to synchronize the duty-cycles of the nodes to guarantee a multi-
hop packet delivery. In this way the protocol achieved latency efficient operation.
(Erazo, Qain, 2007) developed the S-MAC to SEA-MAC, a protocol which aims for energy
efficient operation for WSNs for environment monitoring. The protocol assumes only the
base station node has the time synchronization schedule. Sensor nodes are active only when
there is a sample to be taken from the environment which decreases the duty-cycle of the
node and preserves energy. The packet which is responsible for initiating important data
delivery in SEA-MAC is called TONE packet which is shorter in period than SYNC packet in
S-MAC.
The literature trawl has revealed that few protocols use TDMA-based scheduling because of
the overhead of time slot scheduling as sensor network deployment usually includes large
number of sensors. A protocol that uses TDMA-based scheduling is the Energy and Rate
(ER) proposed by (Kannan et al, 2003). The ER_MAC protocol has the ability of avoiding
extra energy wastage.
The main advantages of ER-MAC are:
packet loss due to collisions is absent because two nodes do not transmit in the
same slot. Although packet loss may occur due to other reasons like interference,
loss of signal strength etc.
no contention mechanism is required for a node to start sensing its packets since
the slots are pre-assigned to each node. No extra control overhead packets for
contention are required.
ER-MAC uses the concept of periodic listen and sleep. A sensor node switches off its radio
and goes into a sleep mode only when it is in its own time slot and does not have anything
to transmit. It has to keep the radio awake in the slots assigned to its neighbors in order to
receive packets from them even if the node with current slot has nothing to transmit.
Real-Time MAC (RT-MAC) proposed by (Sahoo, Baronia, 2007) is another TDMA-based
MAC protocol that can provide delay guarantee. TDMA based MAC protocols suffers from
latency caused by the assigning of time slots which takes up a lot of time because of the
number of sensor nodes deployed. RT-MAC overcomes this problem by reutilizing the
connection channel between two successive channel accesses of a sensor node. RT-MAC also
allows sensors to go to sleep which preserves energy. Although it provides delay guarantee,
the RT-MAC protocol requires a lot of computation that exhaust the sensor node itself in
some cases like clock drifting problem.
There are other works on design of MAC protocol based on TDMA scheme (Ganeriwal et al,
2003; Egea-L'opez et al, 2006); they all share the same complexity in time slot assigning.
To summarize the investigated literature, we devised a table that illustrates the categories of
MAC protocols proposed for WSNs showing their advantages and disadvantages. Refer to
Table 2:
MAC
Protocol
Category Main Advantage Main Disadvantage
IEEE 802.11
CSMA/C
A
The Highest system throughput
Inefficient energy
consumption
S-MAC
CSMA/C
A
Scalable, energy efficient due to
the sleep/listen scheme
Suffers from Latency issues
T-MAC
CSMA/C
A
Energy efficient, Reasonable
throughput
Requires extended control
packet to achieve efficient
operation
TEEM
CSMA/C
A
Energy efficient due to the
eliminating the use of RTS
packet
Suffers from Latency issues
TA-MAC
CSMA/C
A
Cross-Layer approach Suffers from latency issues
R-MAC
CSMA/C
A
Enhanced throughput
Control Packet Delivery
overhead
SEA-MAC
CSMA/C
A
Energy efficient operation Suffers from Latency issues
ER-MAC TDMA Collision free environment Scalability and latency issues
RT-MAC TDMA
Increased the system
throughput
Excessive calculation and
clock drifting problems
Table 1. Summary of the related approaches for MAC Protocols.
3. Proposed solution and the methodology behind it
In this section we ill discuss our proposed solution and describe the operation on the
protocol. It also discusses how it manages control packets and data packets exchanges
between the network nodes. Energy consumption and packet exchange delay analysis are
also discussed. To prove the method proposed we devised simulation experiments using the
most common tool to simulate networking systems the Network Simulator 2 (NS2)
(Issariyakul, Hossain, 2008). The analysis equations were based on the theory of S-MAC.
3.1 The Network Simulator 2 (NS2)
NS2 is the most widely used tool in researches involved in general networking systems
analysis and wireless networking systems includes Mobile networking, Satellite networking,
Wireless Sensor Networks, LAN networks and other network technologies. NS2 is built
using C++ language and uses OTcl (Object Oriented Tcl) language as an interface with the
simulator. The network topology is built using OTcl and the packet operation protocol is
written in C++ (Issariyakul, Hossain, 2008).
3.1.2 Mobile Networking In NS2
The wireless model essentially consists of the MobileNode at the core, with additional
supporting features that allows simulations of multi-hop ad-hoc networks, wireless LANs
etc. A MobileNode thus is the basic Node object with added functionalities of a wireless and
mobile node like ability to move within a given topology, ability to receive and transmit
signals to and from a wireless channel.
Wireless Sensor Networks: Application-Centric Design278
3.1.3 Routing and MAC protocols provided in NS2
Two MAC layer protocols are implemented for mobile networks, which are IEEE 802.11 and
TDMA, while S-MAC was added to NS2 as a Patch by (Ye et al,2001). The four different ad-
hoc routing protocols currently implemented for mobile networking in NS2 are dsdv, dsr,
aodv and tora.
3.2 The Proposed Scheme
The proposed scheme (Shukur, Yap, 2009, a; Shukur, Yap, 2009, b) considers the following:
1. Combining the functionality of SYNC packet with RTS packet will provide both
energy and latency efficient operation which will eliminate the need of sending
two packets and decrease control packet overhead. This packet from now on would
be referred to as SEEK.
2. To increase the throughput of the system (SEEK) packet will be sent all the way to
the down stream nodes before sending CTS packet to the upper stream node. This
will open the way to DATA packet to move through the stream of nodes until
DATA packet reaches the base station node. Figure 2 Describes the approach
mentioned above.
3.2.1 Energy Consumption analysis
The first step is to analyze the proposed approach energy consumption for three nodes
operation. The following assumptions are made for the analysis (using the scenario shown
in Figure 3-3 below:
1. All nodes in the way are by all means available for any packet transmission.
2. The packet delivery direction is from node 1 to node 3.
3. No collision happens between nodes (assuming that Carrier Sense is successful in
each transmission start).
4. SEEK packet follow this rule (SYNC<SEEK<SYNC+RTS).
5. DATA packet could be transmitted in one hop.
6. All control packets are fixed in size.
7. In a more realistic scenario upper-layer routing information provides the shortest
route to the destination.
8. DATA packet can be transferred in one hop.
9. If the next node in the way is in sleep mode (SEEK) works as the signal that wakes
up the node.
Fig. 2. Proposed Scheme operation for Synchronization in MAC layer Protocol.
The analysis scenario is described in Figure 3:
Fig. 3. Analysis Scenario.
Each Node operation is represented by a formula following the devised Synchronization
timeline which is described in figure 2 above. Starting with the operation of Node (1) form
Flow directio
n
Node 1
Node 2
Node 3
MAC & Mobility In Wireless Sensor Networks 279
3.1.3 Routing and MAC protocols provided in NS2
Two MAC layer protocols are implemented for mobile networks, which are IEEE 802.11 and
TDMA, while S-MAC was added to NS2 as a Patch by (Ye et al,2001). The four different ad-
hoc routing protocols currently implemented for mobile networking in NS2 are dsdv, dsr,
aodv and tora.
3.2 The Proposed Scheme
The proposed scheme (Shukur, Yap, 2009, a; Shukur, Yap, 2009, b) considers the following:
1. Combining the functionality of SYNC packet with RTS packet will provide both
energy and latency efficient operation which will eliminate the need of sending
two packets and decrease control packet overhead. This packet from now on would
be referred to as SEEK.
2. To increase the throughput of the system (SEEK) packet will be sent all the way to
the down stream nodes before sending CTS packet to the upper stream node. This
will open the way to DATA packet to move through the stream of nodes until
DATA packet reaches the base station node. Figure 2 Describes the approach
mentioned above.
3.2.1 Energy Consumption analysis
The first step is to analyze the proposed approach energy consumption for three nodes
operation. The following assumptions are made for the analysis (using the scenario shown
in Figure 3-3 below:
1. All nodes in the way are by all means available for any packet transmission.
2. The packet delivery direction is from node 1 to node 3.
3. No collision happens between nodes (assuming that Carrier Sense is successful in
each transmission start).
4. SEEK packet follow this rule (SYNC<SEEK<SYNC+RTS).
5. DATA packet could be transmitted in one hop.
6. All control packets are fixed in size.
7. In a more realistic scenario upper-layer routing information provides the shortest
route to the destination.
8. DATA packet can be transferred in one hop.
9. If the next node in the way is in sleep mode (SEEK) works as the signal that wakes
up the node.
Fig. 2. Proposed Scheme operation for Synchronization in MAC layer Protocol.
The analysis scenario is described in Figure 3:
Fig. 3. Analysis Scenario.
Each Node operation is represented by a formula following the devised Synchronization
timeline which is described in figure 2 above. Starting with the operation of Node (1) form
Flow directio
n
Node 1
Node 2
Node 3
Wireless Sensor Networks: Application-Centric Design280
the Scenario above (figure 3) the formula of Energy consumption can be represented as
follow:
d
T
)(t
rectP
c
T
)
1
m
3
α(t
rectP
s
T
t
rect
t
P(t)
1
S
(1) Xd(t) )
3
αY(tX(t)(t)
1
S
Where:
T
s
: SEEK packet time length.
T
c
: CTS packet time length.
T
d
: DATA packet time length.
α : the delay in each state of transmitting SEEK packet and receiving CTS packet.
P
t
: Transmission Power.
P : Reception Power.
X(t): rectangular function of delay for SEEK packet.
Y(t): rectangular function of delay for CTS packet out from the exact node.
Z(t): rectangular function of delay for CTS packet received from the down stream node.
X
d
(t): rectangular function of delay for DATA packet.
Node (2) energy consumption is equal to the following equation:
d
T
)
4
α(t
rectP
c
T
)
4
α(t
rectP
c
T
)
4
α(t
rectP
c
T
)
1
m(t
rect
t
P
s
T
)
1
α(t
rect
t
P
(t)
2
S
) (2 )
4
αXd(t)
4
αZ(tY(t))
1
αX(t(t)
2
S
Finally Node (3) energy consumption:
d
T
)
4
α(t
P
c
T
)
1
n(t
rect
t
P
s
T
)
2
α(t
rect
t
P(t)
3
S
(3) )
4
α(t
d
XZ(t)Y(t))
2
αX(t(t)
3
S
From Equation (1,2 and 3) we can compute the energy consumed by following equation (4):
E
s
= S
1
(t) + S
2
(t) + S
3
(t) …………………………………(4)
Where (E
s
) represents the energy consumed by the proposed analysis system in Figure
(3-3). Substitute equations (1, 2 & 3) into (4) results in:
d
T
)
4
α(t
P
c
T
)
1
n(t
rect
t
P
s
T
)
2
α(t
rect
t
P
d
T
)
4
α(t
rectP
c
T
)
4
α(t
rectP
d
T
4
αlt
rectP
c
T
4
αt
rectP
c
T
1
mt
rect
t
P
s
T
1
αt
rect
t
P
d
T
lt
rectP
c
T
1
m
3
αt
rectP
s
T
t
rect
t
Pt
s
E
3.2.2 System Delay analysis
The proposed scheme deals with more that one node in a duty-cycle because of the
concurrent (SEEK) packet transmission so the packet delay will only be counted as (extra
SEEK packet) and (extra CTS packet) in the middle nodes, Below is the mathematical delay
approach of the proposed scheme following the same parameters and the same assumptions
made for energy consumption:
Node 1 delay:
D
1
(t) = T
s
+ T
c
+ T
d
…………….… …… (5)
Node 2 delay:
D
2
(t) = α + T
s
+ 2 * T
c
+ T
d
……………………… …. (6)
Node 3 delay:
D
3
(t) = T
s
+ T
c
+ T
d
………………………………… (7)
From (5, 6 and 7) above a system delay equation can be derived:
D
s
(t) =
2
1
*
N
cs
TT
…………………………………(9)
N: the number of nodes in the system.
While for S-MAC (Ye et al, 2001), because each node have to go through the same operation
to send the data packet it is possible to describe S-MAC delay operation for the same system
as:
SYNC
t
: time length for SYNC packet.
RTS
t
: time length for RTS packet.
CTS
t
: time length for CTS packet.
DATA
t
: time length for DATA packet.
MAC & Mobility In Wireless Sensor Networks 281
the Scenario above (figure 3) the formula of Energy consumption can be represented as
follow:
d
T
)(t
rectP
c
T
)
1
m
3
α(t
rectP
s
T
t
rect
t
P(t)
1
S
(1) Xd(t) )
3
αY(tX(t)(t)
1
S
Where:
T
s
: SEEK packet time length.
T
c
: CTS packet time length.
T
d
: DATA packet time length.
α : the delay in each state of transmitting SEEK packet and receiving CTS packet.
P
t
: Transmission Power.
P : Reception Power.
X(t): rectangular function of delay for SEEK packet.
Y(t): rectangular function of delay for CTS packet out from the exact node.
Z(t): rectangular function of delay for CTS packet received from the down stream node.
X
d
(t): rectangular function of delay for DATA packet.
Node (2) energy consumption is equal to the following equation:
d
T
)
4
α(t
rectP
c
T
)
4
α(t
rectP
c
T
)
4
α(t
rectP
c
T
)
1
m(t
rect
t
P
s
T
)
1
α(t
rect
t
P
(t)
2
S
) (2 )
4
αXd(t)
4
αZ(tY(t))
1
αX(t(t)
2
S
Finally Node (3) energy consumption:
d
T
)
4
α(t
P
c
T
)
1
n(t
rect
t
P
s
T
)
2
α(t
rect
t
P(t)
3
S
(3) )
4
α(t
d
XZ(t)Y(t))
2
αX(t(t)
3
S
From Equation (1,2 and 3) we can compute the energy consumed by following equation (4):
E
s
= S
1
(t) + S
2
(t) + S
3
(t) …………………………………(4)
Where (E
s
) represents the energy consumed by the proposed analysis system in Figure
(3-3). Substitute equations (1, 2 & 3) into (4) results in:
d
T
)
4
α(t
P
c
T
)
1
n(t
rect
t
P
s
T
)
2
α(t
rect
t
P
d
T
)
4
α(t
rectP
c
T
)
4
α(t
rectP
d
T
4
αlt
rectP
c
T
4
αt
rectP
c
T
1
mt
rect
t
P
s
T
1
αt
rect
t
P
d
T
lt
rectP
c
T
1
m
3
αt
rectP
s
T
t
rect
t
Pt
s
E
3.2.2 System Delay analysis
The proposed scheme deals with more that one node in a duty-cycle because of the
concurrent (SEEK) packet transmission so the packet delay will only be counted as (extra
SEEK packet) and (extra CTS packet) in the middle nodes, Below is the mathematical delay
approach of the proposed scheme following the same parameters and the same assumptions
made for energy consumption:
Node 1 delay:
D
1
(t) = T
s
+ T
c
+ T
d
…………….… …… (5)
Node 2 delay:
D
2
(t) = α + T
s
+ 2 * T
c
+ T
d
……………………… …. (6)
Node 3 delay:
D
3
(t) = T
s
+ T
c
+ T
d
………………………………… (7)
From (5, 6 and 7) above a system delay equation can be derived:
D
s
(t) =
2
1
*
N
cs
TT
…………………………………(9)
N: the number of nodes in the system.
While for S-MAC (Ye et al, 2001), because each node have to go through the same operation
to send the data packet it is possible to describe S-MAC delay operation for the same system
as:
SYNC
t
: time length for SYNC packet.
RTS
t
: time length for RTS packet.
CTS
t
: time length for CTS packet.
DATA
t
: time length for DATA packet.
Wireless Sensor Networks: Application-Centric Design282
Node 1 delay (S-MAC):
D
1
(t) = SYNC
t
+ RTS
t
+ CTS
t
+ DATA
t
. ……… ……… …. (10)
Node 2 delay (S-MAC):
D
2
(t) = D
1
(t) + SYNC
t
+ RTS
t
+ CTS
t
+ DATA
t
. …… …………. (11)
Node 3 delay (S-MAC):
D
3
(t) = D
2
(t) + SYNC
t
+ RTS
t
+ CTS
t
+ DATA
t
. …… …… … (12)
From (10, 11 and 12) we can reach to a system delay equation using S-MAC:
D
S-MAC
(t) =
N
1
t
DATA
t
CTS
t
RTS
t
SYNC1)(t)D(N
…… (13)
4. Implementation of the proposed solution
This section will discuss the implementaiton of the methodology and the simulation
parameters used. Two simulation scenarios are devised and simulation parameters with a
range of duty-cycles from (5% - 25%) for the first scenario and from (5%-40%) for the second
scenario in three steps to cover most of operation environment that can a WSN suffer. The
first simulation scenario (Figure 3) is represented by a straight line of nodes deployment .:
Fig. 3.a: A straight node deplyment used as the first simultion scene.
The simulation environment was built and made using NS2 version 2.33, the scenario
consists of five nodes in one row Starts from node 0 to node 4 considering node 4 as the
destination node in the simulation. Our main revals during where S-MAC protocol (as it is
considered the base protocol to propose the Sleep-Listen Theory) and SEA-MAC because it
is an inprovment over S-MAC in terms of the control packets handling. The proposed
approach will be referred as Proposed Protocol (PP-) before or after any protocol name.
below is a table of the parameters that where allocated for the scenarion above:
Parameter Amplitude
Simulation time 700 second
Duty-Cycle 5%, 10%, 25%
Routing Protocol None
Node Idle power 100 mW
Node Rx Power 100 mW
Node Tx Power 100 mW
Node Sleep Power 1 mW
Transition Power 20 mW
Transition time 5 ms
Energy model NS2 Energy model
Propogation model TwoRayGround
Initial Energy for each node 1000 mJ
Table 3. the simulation parameters for the first scene
The second simulation (Figure 4) scenario consist of ten nodes. nine nodes 0-8 formed a
square deployment and one node 9 was separated from the other as a base node. The
simulations are conducted on a wide range of duty cycles from 5% - 40% in three steps (5, 25
and 40).
Fig. 4. square shape node deployment to simulate the second scene.
MAC & Mobility In Wireless Sensor Networks 283
Node 1 delay (S-MAC):
D
1
(t) = SYNC
t
+ RTS
t
+ CTS
t
+ DATA
t
. ……… ……… …. (10)
Node 2 delay (S-MAC):
D
2
(t) = D
1
(t) + SYNC
t
+ RTS
t
+ CTS
t
+ DATA
t
. …… …………. (11)
Node 3 delay (S-MAC):
D
3
(t) = D
2
(t) + SYNC
t
+ RTS
t
+ CTS
t
+ DATA
t
. …… …… … (12)
From (10, 11 and 12) we can reach to a system delay equation using S-MAC:
D
S-MAC
(t) =
N
1
t
DATA
t
CTS
t
RTS
t
SYNC1)(t)D(N
…… (13)
4. Implementation of the proposed solution
This section will discuss the implementaiton of the methodology and the simulation
parameters used. Two simulation scenarios are devised and simulation parameters with a
range of duty-cycles from (5% - 25%) for the first scenario and from (5%-40%) for the second
scenario in three steps to cover most of operation environment that can a WSN suffer. The
first simulation scenario (Figure 3) is represented by a straight line of nodes deployment .:
Fig. 3.a: A straight node deplyment used as the first simultion scene.
The simulation environment was built and made using NS2 version 2.33, the scenario
consists of five nodes in one row Starts from node 0 to node 4 considering node 4 as the
destination node in the simulation. Our main revals during where S-MAC protocol (as it is
considered the base protocol to propose the Sleep-Listen Theory) and SEA-MAC because it
is an inprovment over S-MAC in terms of the control packets handling. The proposed
approach will be referred as Proposed Protocol (PP-) before or after any protocol name.
below is a table of the parameters that where allocated for the scenarion above:
Parameter Amplitude
Simulation time 700 second
Duty-Cycle 5%, 10%, 25%
Routing Protocol None
Node Idle power 100 mW
Node Rx Power 100 mW
Node Tx Power 100 mW
Node Sleep Power 1 mW
Transition Power 20 mW
Transition time 5 ms
Energy model NS2 Energy model
Propogation model TwoRayGround
Initial Energy for each node 1000 mJ
Table 3. the simulation parameters for the first scene
The second simulation (Figure 4) scenario consist of ten nodes. nine nodes 0-8 formed a
square deployment and one node 9 was separated from the other as a base node. The
simulations are conducted on a wide range of duty cycles from 5% - 40% in three steps (5, 25
and 40).
Fig. 4. square shape node deployment to simulate the second scene.