Wireless Sensor Networks Application Centric Design Part 15 pot
Bạn đang xem bản rút gọn của tài liệu. Xem và tải ngay bản đầy đủ của tài liệu tại đây (1.02 MB, 30 trang )
A Gaussian Mixture Model-based Event-Driven
Continuous Boundary Detection in 3D Wireless Sensor Networks 409
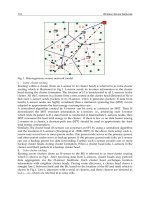
experiences a sharp increase in the number of BNs after 40 time slots. This was caused by a
phenomenon that the objects expand highly depending on the number of existing BNs.
However, at network initialization, we have relatively fewer existing BNs. As the cardinal
number designating the existence of BNs is over a special value (available at around 40 time
slots), the performance miraculously achieves a sudden improvement.
(a)
(b)
Fig. 15. Performance comparison for irregular variation object case using BD3D 3D model.
(a)Number of BNs based on time slots via varying d (r = 10m); (b)Number of BNs based on
time slots via varying r (d = 8m).
We hereby conclude that our BD3D for continuous boundary detection in 3D case works
well especially when d ൏ r using TSM. An in depth study about the impact of localization
impact on various routing protocols and its implications on design of location-dependent
system are left as future work.
0 10 20 30 40 50 60 70 80
0
50
100
150
200
250
300
350
400
450
500
Time slots
Number of BNs
d=4, r=10
d=8, r=10
d=12, r=10
d=16, r=10
0 10 20 30 40 50 60 70 80
0
50
100
150
200
250
300
350
400
450
Time slots
Number of BNs
r=20, d=8
r=15, d=8
r=10, d=8
r=5, d=8
6. Conclusions
This paper has proposed a novel Gaussian Mixture Model-based BD3D scheme for
boundary detection of continuously moving object in a 3D sensor network. We adequately
presented the proposed protocol, and the simulation results shown support our allegation
that the BD3D 2D model surely outperforms COBOM and DEMOCO in terms of average
residual energy per sensor node and the number of selected BNs, and the BD3D 3D model
achieves accurate boundary detections by soundly selecting EBN and non-EBN for both
regular variation and irregular variation object cases. Our future work will include
additional optimization desired to improve the performance of our algorithm and
verification of the precision of the expected boundaries and invention of a new protocol that
considers data losses and route failures due to unpredictable errors such as sensor node
failures, contention, interference and fading (Woo, et al, 2003; Seada, et al, 2004). Moreover,
the more accurate energy and mobility model will be addressed in future work.
Acknowledgements
This research was supported by Waseda University Global COE Program International
Research and Education Center for Ambient SoC sponsored by MEXT, Japan.
7. References
Kim, J.H.; Kim, K.B.; Sajjad, H.C.; Yang, W.C.;&Park, M.S.(2008). DEMOCO: Energy-
Efficient Detection and Monitoring for Continuous Objects in Wireless Sensor
Networks. IEICE Trans. Com. 2008, E91–B, pp.3648-3656.
Zhong, C.& Worboys, M.(2007) Energy-efficient continuous boundary monitoring in sensor
networks. Technical Report, 2007. Available online:
(accessed on 31 July 2010).
Basu, A.; Jie, G.; Joseph, S.B.M.& Girishkumar, S.(2006) Distributed Localization by Noisy
Distance and Angle Information. In Proceedings of ACM MOBIHOC’06, Los
Angeles, CA, USA, 2006;pp. 262-273
Eren, T.; Goldenberg, D.K.; Whiteley, W.& Yang, Y.R.(2004). Rigidity, Computation, and
Randomization in Network Localization. In Proceedings of IEEE
INFOCOM’04,March 2004, Hongkong, China.
He, T.; Huang C.D.; Blum, B.M.; John A.S.& Tarek, A.(2003) Range-Free Localization
Schemes for Large Scale Sensor Networks. In Proceedings of ACM MOBICOM’03,
Annapolis, MD, USA, June 2003; pp. 81-95
Nissanka, B.; Priyantha Hari, B.; Erik, D.& Seth, T.(2003) Anchor-Free Distributed
Localization in Sensor Networks. LCS Technical Report #892; MIT: Cambridge,
MA, USA, April 2003.
Guo, Z.; Zhou, M.& Jiang, G.(2008) Adaptive optimal sensor placement and boundary
estimation for dynamic mass objects. IEEE Trans. Syst. Man Cybern B. Cybern.
2008, 38, 222-32.
Olfati-Saber, R.(2007). Distributed tracking for mobile sensor networks with information
driven mobility. In Proceedings of Amer. Control Conference, New York, NY, USA,
July, 2007; pp. 4606-4612.
Wireless Sensor Networks: Application-Centric Design410
Funke, S. & Klein, C(2006). Hole Detection or: How Much Geometry Hides in Connectivity?
In Proceedings of the Twenty-Second Annual Symposium on Computational
Geometry, SCG ’06, ACM Press: New York, NY, USA, 2006; pp. 377-385.
Funke, S.& Milosavljevic, N.(2007). Network sketching or: how much geometry hides in
connectivity?–part ii. In Proceedings of the Eighteenth Annual ACM-SIAM
Symposium on Discrete Algorithms (SODA2007), New Orleans, LA, USA, 2007; pp.
958-967.
Peng, R.& Sichitiu, M.L.(2006) Angle of Arrival Localization for Wireless Sensor Networks.
In Proceedings of Third Annual IEEE Communications Society Conference on
Sensor, Mesh and Ad Hoc Communications and Networks (Secon06), Reston, VA,
USA, September 2006; pp. 25-28.
Lance, D.; Kristofer S.J.P.& Laurent EL G.(2001) Convex Position Estimation in Wireless
Sensor Networks. In Proceedings of IEEE INFOCOM’01, Anchorage, April 2001,
AK, USA.
Hu, L.X & David, E.(2004) Localization for Mobile Sensor Networks. In Proceedings of ACM
MOBICOM’04, Philadelphia, PA, USA, September 2004; pp. 45-57.
Ji, X. & Zha, H.(2004) Sensor Positioning in Wireless Ad-hoc Sensor Networks Using
Multidimensional Scaling. In Proceedings of INFOCOM’04, March 2004,
Hongkong, China.
Yi, S.; Wheeler, R.; Zhang, Y.& Markus, P.J.F.(2003) Localization From Mere Connectivity, In
Proceedings of ACM MOBIHOC’03, Annapolis, MD, USA, June 2003; pp. 201-212.
Yi, S. & Wheeler, R.(2004) Improved MDS-Based Localization. In Proceedings of IEEE
INFOCOM’04, Hongkong, China, March 2004; pp. 2640-2651.
Andreas, S.; Park, H. & Mani, B.S.(2002) The Bits and Flops of the N-hop Multilateration
Primitive for Node Localization Problems. In Proceedings of ACM WSNA02,
Atlanta, GA, USA, September 28, 2002; pp. 112-121.
Zhang, L.Q.; Zhou, X.B. & Cheng, Q.(2006) Landscape-3D: A Robust Localization Scheme for
Sensor Networks over Complex 3D Terrains. In Proceedings of 31st Annual IEEE
Conference on Local Computer Networks (LCN), IEEE Computer Society Press:
Tampa, FL, USA, November 2006;pp. 239-246.
Samitha, E. & Pubudu, P.(2010) RSS Based Technologies in Wireless Sensor Networks,
Mobile and Wireless Communications Network Layer and Circuit Level Design,
Fares, S.A., Fumiyuki Adachi, F., Eds.; INTECH Book: Vienna, Austria, 2010.
Bulusu, N.; Hohn, H. & Deborah, E.(2001) Density Adaptive Algorithms for Beacon
Placement in Wireless Sensor Networks. In Proceedings of IEEE ICDCS’01;
Phoenix, April 2001,AZ, USA.
Liu, L.; Wang, Z. & Zhou, M.(2009). An Innovative Beacon-Assisted Bi-Mode Positioning
Method in Wireless Sensor Networks. In Proceedings of IEEE International
Conference on Networking Sensing and Control (ICNSC09), Okayama, Japan,
March 2009, pp. 570-575.
Liu, L.; Manli, E.; Wang, Z.G. & Zhou, M.C.(2009). A 3D Self-positioning Method for
Wireless Sensor Nodes Based on Linear FMCW and TFDA. In Proceedings of IEEE
International Conference on Systems, Man, and Cybernetics, San Antonio, TX,
USA, October 2009; pp. 3069-3074.
Zhu, X.J.; Rik, S. & Gao, J.(2009). Segmenting a Sensor Field: Algorithm and Applications in
Network Design. ACM Trans. Sensor Netw. (TOSN) 2009, 5, 1-31.
McLachlan, G. & Peel, D.(2000). Finite Mixture Models; John Wiley & Sons: New York: NY,
USA, 2000.
Figueiredo, M. & Jain, A.K.(2002). Unsupervised learning of finite mixture models. IEEE
Trans. Patt. Anal. Mach. Int. 2002, 24, 381-396.
Akaike, H.(1973). Information Theory and an Extension of the Maximum Likelihood
Principle. In Proceedings of the Second International Symposium on Information
Theory, Akadémiai Kiadó: Budapest, Hungary, 1973; pp. 267-281
Schwarz, G.(1978). Estimating the dimension of a model. Ann. Statist. 1978, 6, 461-464.
Solla, S.A.; Leen, T.K. & Muller, K.R.(2000). The Infinite Gaussian Mixture Model. In
Advances in Neural Information Processing Systems; MIT Press: Cambridge, MA,
USA, 2000; pp. 554-560.
Chintalapudi, K. & Govindan, R.(2003) Localized edge detection in sensor fields. IEEE Ad
Hoc Netw. J. 2003, pp.59-70
Jin, G. & Nittel, S.(2006) NED: An Efficient Noise-Tolerant Event and Event Boundary
Detection Algorithm in Wireless Sensor Networks. In Proceedings of the 7th
International Conferences on Mobile Data Management, Nara, Japan, May, 2006;
pp. 1551-6245.
Min, D.; Chen, D.; Kai, X. & Cheng, X.(2005). Localized Fault-Tolerant Event Boundary
Detection in Sensor Networks. IEEE Infocom. 2005; Miami, FL, USA, March, 2005;
pp. 902-913.
Heinzelman, W.R.; Chandrakasan, A. & Balakrishnan. H.(2000). Energy-Efficient
Communication Protocol for Wireless Microsensor Networks. In the Proceedings of
the Hawaii International Conference on System Sciences, Maui, Hawaii, USA,
January 4-7, 2000; pp.3005-3014.
Schwarz, G.(1978). Estimating the dimension of a model. Ann. Stat. 1978, 6, pp.461-464.
Zivkovic, Z. & van der Heijden, F.(2004). Recursive Unsupervised Learning of Finite
Mixture Models. In Proceedings of IEEE Transactions on Pattern Analysis and
Machine Intelligence, Washington, DC, USA, May 2004; pp. 651-656.
Woo, A.; Tong, T. & Culler, D.(2003). Taming the underlying challenges of reliable multihop
routing in sensor networks. In Proceedings of the 1st International Conference on
Embedded Networked Sensor Systems, Los Angeles, CA, USA, 2003; pp. 14-27.
Seada, A.K.; Zuniga, M.; Helmy, A. & Bhaskar, K.(2004). Energy-Efficient Forwarding
Strategies for Geographic Routing in Lossy Wireless Sensor Networks. In
Proceedings of the 2nd International Conference on Embedded Networked Sensor
Systems, Baltimore, MD, USA, 2004; pp. 108-121.
A Gaussian Mixture Model-based Event-Driven
Continuous Boundary Detection in 3D Wireless Sensor Networks 411
Funke, S. & Klein, C(2006). Hole Detection or: How Much Geometry Hides in Connectivity?
In Proceedings of the Twenty-Second Annual Symposium on Computational
Geometry, SCG ’06, ACM Press: New York, NY, USA, 2006; pp. 377-385.
Funke, S.& Milosavljevic, N.(2007). Network sketching or: how much geometry hides in
connectivity?–part ii. In Proceedings of the Eighteenth Annual ACM-SIAM
Symposium on Discrete Algorithms (SODA2007), New Orleans, LA, USA, 2007; pp.
958-967.
Peng, R.& Sichitiu, M.L.(2006) Angle of Arrival Localization for Wireless Sensor Networks.
In Proceedings of Third Annual IEEE Communications Society Conference on
Sensor, Mesh and Ad Hoc Communications and Networks (Secon06), Reston, VA,
USA, September 2006; pp. 25-28.
Lance, D.; Kristofer S.J.P.& Laurent EL G.(2001) Convex Position Estimation in Wireless
Sensor Networks. In Proceedings of IEEE INFOCOM’01, Anchorage, April 2001,
AK, USA.
Hu, L.X & David, E.(2004) Localization for Mobile Sensor Networks. In Proceedings of ACM
MOBICOM’04, Philadelphia, PA, USA, September 2004; pp. 45-57.
Ji, X. & Zha, H.(2004) Sensor Positioning in Wireless Ad-hoc Sensor Networks Using
Multidimensional Scaling. In Proceedings of INFOCOM’04, March 2004,
Hongkong, China.
Yi, S.; Wheeler, R.; Zhang, Y.& Markus, P.J.F.(2003) Localization From Mere Connectivity, In
Proceedings of ACM MOBIHOC’03, Annapolis, MD, USA, June 2003; pp. 201-212.
Yi, S. & Wheeler, R.(2004) Improved MDS-Based Localization. In Proceedings of IEEE
INFOCOM’04, Hongkong, China, March 2004; pp. 2640-2651.
Andreas, S.; Park, H. & Mani, B.S.(2002) The Bits and Flops of the N-hop Multilateration
Primitive for Node Localization Problems. In Proceedings of ACM WSNA02,
Atlanta, GA, USA, September 28, 2002; pp. 112-121.
Zhang, L.Q.; Zhou, X.B. & Cheng, Q.(2006) Landscape-3D: A Robust Localization Scheme for
Sensor Networks over Complex 3D Terrains. In Proceedings of 31st Annual IEEE
Conference on Local Computer Networks (LCN), IEEE Computer Society Press:
Tampa, FL, USA, November 2006;pp. 239-246.
Samitha, E. & Pubudu, P.(2010) RSS Based Technologies in Wireless Sensor Networks,
Mobile and Wireless Communications Network Layer and Circuit Level Design,
Fares, S.A., Fumiyuki Adachi, F., Eds.; INTECH Book: Vienna, Austria, 2010.
Bulusu, N.; Hohn, H. & Deborah, E.(2001) Density Adaptive Algorithms for Beacon
Placement in Wireless Sensor Networks. In Proceedings of IEEE ICDCS’01;
Phoenix, April 2001,AZ, USA.
Liu, L.; Wang, Z. & Zhou, M.(2009). An Innovative Beacon-Assisted Bi-Mode Positioning
Method in Wireless Sensor Networks. In Proceedings of IEEE International
Conference on Networking Sensing and Control (ICNSC09), Okayama, Japan,
March 2009, pp. 570-575.
Liu, L.; Manli, E.; Wang, Z.G. & Zhou, M.C.(2009). A 3D Self-positioning Method for
Wireless Sensor Nodes Based on Linear FMCW and TFDA. In Proceedings of IEEE
International Conference on Systems, Man, and Cybernetics, San Antonio, TX,
USA, October 2009; pp. 3069-3074.
Zhu, X.J.; Rik, S. & Gao, J.(2009). Segmenting a Sensor Field: Algorithm and Applications in
Network Design. ACM Trans. Sensor Netw. (TOSN) 2009, 5, 1-31.
McLachlan, G. & Peel, D.(2000). Finite Mixture Models; John Wiley & Sons: New York: NY,
USA, 2000.
Figueiredo, M. & Jain, A.K.(2002). Unsupervised learning of finite mixture models. IEEE
Trans. Patt. Anal. Mach. Int. 2002, 24, 381-396.
Akaike, H.(1973). Information Theory and an Extension of the Maximum Likelihood
Principle. In Proceedings of the Second International Symposium on Information
Theory, Akadémiai Kiadó: Budapest, Hungary, 1973; pp. 267-281
Schwarz, G.(1978). Estimating the dimension of a model. Ann. Statist. 1978, 6, 461-464.
Solla, S.A.; Leen, T.K. & Muller, K.R.(2000). The Infinite Gaussian Mixture Model. In
Advances in Neural Information Processing Systems; MIT Press: Cambridge, MA,
USA, 2000; pp. 554-560.
Chintalapudi, K. & Govindan, R.(2003) Localized edge detection in sensor fields. IEEE Ad
Hoc Netw. J. 2003, pp.59-70
Jin, G. & Nittel, S.(2006) NED: An Efficient Noise-Tolerant Event and Event Boundary
Detection Algorithm in Wireless Sensor Networks. In Proceedings of the 7th
International Conferences on Mobile Data Management, Nara, Japan, May, 2006;
pp. 1551-6245.
Min, D.; Chen, D.; Kai, X. & Cheng, X.(2005). Localized Fault-Tolerant Event Boundary
Detection in Sensor Networks. IEEE Infocom. 2005; Miami, FL, USA, March, 2005;
pp. 902-913.
Heinzelman, W.R.; Chandrakasan, A. & Balakrishnan. H.(2000). Energy-Efficient
Communication Protocol for Wireless Microsensor Networks. In the Proceedings of
the Hawaii International Conference on System Sciences, Maui, Hawaii, USA,
January 4-7, 2000; pp.3005-3014.
Schwarz, G.(1978). Estimating the dimension of a model. Ann. Stat. 1978, 6, pp.461-464.
Zivkovic, Z. & van der Heijden, F.(2004). Recursive Unsupervised Learning of Finite
Mixture Models. In Proceedings of IEEE Transactions on Pattern Analysis and
Machine Intelligence, Washington, DC, USA, May 2004; pp. 651-656.
Woo, A.; Tong, T. & Culler, D.(2003). Taming the underlying challenges of reliable multihop
routing in sensor networks. In Proceedings of the 1st International Conference on
Embedded Networked Sensor Systems, Los Angeles, CA, USA, 2003; pp. 14-27.
Seada, A.K.; Zuniga, M.; Helmy, A. & Bhaskar, K.(2004). Energy-Efficient Forwarding
Strategies for Geographic Routing in Lossy Wireless Sensor Networks. In
Proceedings of the 2nd International Conference on Embedded Networked Sensor
Systems, Baltimore, MD, USA, 2004; pp. 108-121.
Monitoring Wireless Sensor Network Performance by Tracking Node operational Deviation 413
Monitoring Wireless Sensor Network Performance by Tracking Node
operational Deviation
Yaqoob J. Y. Al-raisi and Nazar E. M. Adam
X
Monitoring Wireless Sensor
Network Performance by Tracking
Node operational Deviation
Yaqoob J. Y. Al-raisi
1
and Nazar E. M. Adam
2
1
HIS Department, Sultan Qaboos University Hospital,
Oman
2
Computer Engineering Department, Fahad Bin Sultan University
Saudi Arabia
1. Introduction
Wireless Sensor Network (WSN) is a very powerful tool that enables its users to closely
monitor, understand and control application processes. It is different from traditional wired
sensor networks in that its characteristics make it cheap to manufacture, implement and
deploy. However, this tool is still at an early stage and many aspects need to be addressed in
order to increase its reliability. One of these aspects is the degradation of network
performance as a result of network nodes deviation. This may directly reduces the quality
and the quantity of data collected by the network and may cause, in turn, the monitoring
application to fail or the network lifetime to be reduced.
Deviations in sensor node operations arise as a result of systematic or/and transient errors
(Elnahrawy, 2004). Systematic error is mainly caused by hardware faults, such as calibration
error after prolonged use, a reduction in operating power levels, or a change in operating
conditions; this type of error affects node operations continuously until the problem is
rectified. Transient errors, on the other hand, occur as a result of temporary external or
internal circumstances, such as various random environmental effects, unstable hardware,
software bugs, channel interface, and multi-path effects. This type of error deviates node
operations until the effect disappears.
These two types of error may directly and indirectly affect the quality and the quantity of
data collected by the WSN. They directly affect sensor measurements and cause drift by a
constant value (i.e. bias); they change the difference between a sensor measurement and the
actual value, (i.e. drift); and can cause sensor measurements to remain constant, regardless
of changes in the actual value, (i.e. complete failure). In addition, they affect the
communication and exchange of packets by dropping them. On the other hand, the above-
mentioned errors can have an indirect effect on the network’s collaboration function, the
construction of routing tables, the selection of the node reporting rate, and the selection of
data gathering points. Analysis of the data collected by the network (in some practical
deployments, such as (Ramanathan, 2004), (Tolle, 2005)), shows that these error reduces the
21
Wireless Sensor Networks: Application-Centric Design414
quality of network collected data by 49%; and in some cases, the network had to be
redeployed in order to collect the data because of the failure of the monitored application.
Analysis also indicate that a 51% overall improvement of WSN functionality can be
expected, as well as an improvement in the quality of the collected data, if real-time
monitoring tools are used.
2. Motivations
To detect and isolate operational deviations in WSNs researchers proposed several data
clearance, fault-tolerance, diagnosis, and performance measurement techniques.
Data cleaning techniques work at a high network level and consider reading impacts from a
deviated sensor on multi-sensor aggregation/fusion such as in (Yao-jung, 2004). Such
research proposes several methods that isolate deviated readings by tracking or predicting
correlation between neighbour node measurements. Most of this research uses complex
methods or models that need a high resource usage to detect and predict sensor
measurements. Moreover, these techniques rectify deviated data after detecting them
without checking their cause and their impact on network functionality.
Fault-tolerance techniques are important in embedded networks which are difficult to access
physically. The advantage of these techniques is their ability to address all network levels;
such as circuit level, logical level, memory level, program level and system level; but due to
WSNs scare recourses these techniques have a limited usage. In general WSNs fault-tolerant
techniques detect faults in fusion and aggregation operation, network deployment and
collaboration, coverage and connectivity, energy consumption, energy event fault tolerance,
reporting rate, network detection, and many others (Song, 2004, Linnyer, 2004, Bhaskar,
2004, Koushanfar, 2003, Luo, 2006). Faults are detected using logical decision predicates
computed in individual sensors (Bhaskar, 2004), faulty node detection (Koushanfar, 2003),
or event region and event boundary detection (Luo, 2006). These methods detect metrics
either at high or low network level without relating them to each other and without
checking their impact on network functionality. The main problem with these techniques is
the impact of deviation on network functionality and collected data accuracy before it is
detected.
Diagnosis techniques use passive or active monitoring to trace, visualize, simulate and
debug historical network log files in real and non real time as discussed in (Jaikaeo, 2001).
These techniques are used to detect faults at high or low network levels after testing their
cause. For example, Nithya at (Ramanathan, 2005) proposed a debugging system that
debugs low network level statistical changes by drawing correlations between seemingly
unrelated, distributed events and producing graphs that highlight those correlations. Most
of these diagnosis techniques are complex and use iteration tests for their detection. These
techniques assume a minimal cost associated with continuously transmitting of debug
information to centralized or distributed monitor nodes and send/receive test packets to
conform the detection of a faultier.
Finally, performance techniques are similar to diagnosis techniques but without iteration
tests and screw pack techniques. Unfortunately there is little literature and research on
systematic measurement and monitoring in wireless sensor networks. Yonggang in
(Yonggang, 2004) studied the effect of packet loss and their impact on network stability and
network processing. He studied the effect of the environmental conditions, traffic load,
network dynamics, collaboration behavior, and constraint recourse on packet delivery
performance using empirical experiments and simulations. Although packet delivery is
important in wireless communication and can predict network performance, it can give
wrong indications of network performance level due to collaboration behavior, and
measurement redundancy which makes a network able to tolerate a certain degree of
changes. Also, Yonggang proposed an energy map aggregation based approach that sends
messages recording significant energy level drops to the sink.
The work in this paper has been motivated by the need to find a tool that uses a very low
level of network resources and detects deviations in the network’s operations that affect the
quality and quantity of the data that are collected before they seriously degrade the
network’s overall functionality and reduce its lifetime.
3. Project Methodology
3.1 Layout of manuscript
The layout of this paper is organised as follows: Section 2 includes a discussion of related
work on functionality degradation detection in WSNs, followed by an explanation of the
algorithm’s approach. The fourth section explains the practical implementation of the
algorithm in a TinyOS ‘Surge’ multi-hop application; results of experiments at the network
level are then discussed. Finally, the paper ends with a conclusion and suggestions for
future work.
3.2 Algorithm Approach
In order to overcome the above-mentioned drawbacks, the Voting Median Base Algorithm
for Approximate Performance Measurements of Wireless Sensor Networks (VMBA)
algorithm is proposed. This algorithm is a passive voting algorithm that collects its metrics
directly from the application by utilizing the overhearing which exists in the
neighbourhood. The algorithm requires only readings of neighbours’ measurements and
does not rely on any information regarding global topology. This makes it scalable to any
network deployment size. The proposed algorithm uses parameters found in nodes for
other networking and application protocols which makes it much cheaper in terms of
resource usage. It uses only the transceiver to send warning messages if there is a network
performance degradation or when the node disagrees with the warning messages of
neighbours.
The algorithm is divided into four different modules; i.e. listening and filtering, data
analysis and threshold test, decision and confidence control and warning packet exchange.
In this section we give some definitions and then the VMBA functional algorithm is
presented.
A. Listening and Filtering Module
The listening and filtering module is responsible for examining the validity of the received
neighbour nodes measurements by filtering those readings beyond the range of the sensor’s
physical characteristics; as shown in the pseudo-code in Fig.1 . The module then constructs
neighbour readings tables and builds statistics in the loss table for neighbour readings.
Monitoring Wireless Sensor Network Performance by Tracking Node operational Deviation 415
quality of network collected data by 49%; and in some cases, the network had to be
redeployed in order to collect the data because of the failure of the monitored application.
Analysis also indicate that a 51% overall improvement of WSN functionality can be
expected, as well as an improvement in the quality of the collected data, if real-time
monitoring tools are used.
2. Motivations
To detect and isolate operational deviations in WSNs researchers proposed several data
clearance, fault-tolerance, diagnosis, and performance measurement techniques.
Data cleaning techniques work at a high network level and consider reading impacts from a
deviated sensor on multi-sensor aggregation/fusion such as in (Yao-jung, 2004). Such
research proposes several methods that isolate deviated readings by tracking or predicting
correlation between neighbour node measurements. Most of this research uses complex
methods or models that need a high resource usage to detect and predict sensor
measurements. Moreover, these techniques rectify deviated data after detecting them
without checking their cause and their impact on network functionality.
Fault-tolerance techniques are important in embedded networks which are difficult to access
physically. The advantage of these techniques is their ability to address all network levels;
such as circuit level, logical level, memory level, program level and system level; but due to
WSNs scare recourses these techniques have a limited usage. In general WSNs fault-tolerant
techniques detect faults in fusion and aggregation operation, network deployment and
collaboration, coverage and connectivity, energy consumption, energy event fault tolerance,
reporting rate, network detection, and many others (Song, 2004, Linnyer, 2004, Bhaskar,
2004, Koushanfar, 2003, Luo, 2006). Faults are detected using logical decision predicates
computed in individual sensors (Bhaskar, 2004), faulty node detection (Koushanfar, 2003),
or event region and event boundary detection (Luo, 2006). These methods detect metrics
either at high or low network level without relating them to each other and without
checking their impact on network functionality. The main problem with these techniques is
the impact of deviation on network functionality and collected data accuracy before it is
detected.
Diagnosis techniques use passive or active monitoring to trace, visualize, simulate and
debug historical network log files in real and non real time as discussed in (Jaikaeo, 2001).
These techniques are used to detect faults at high or low network levels after testing their
cause. For example, Nithya at (Ramanathan, 2005) proposed a debugging system that
debugs low network level statistical changes by drawing correlations between seemingly
unrelated, distributed events and producing graphs that highlight those correlations. Most
of these diagnosis techniques are complex and use iteration tests for their detection. These
techniques assume a minimal cost associated with continuously transmitting of debug
information to centralized or distributed monitor nodes and send/receive test packets to
conform the detection of a faultier.
Finally, performance techniques are similar to diagnosis techniques but without iteration
tests and screw pack techniques. Unfortunately there is little literature and research on
systematic measurement and monitoring in wireless sensor networks. Yonggang in
(Yonggang, 2004) studied the effect of packet loss and their impact on network stability and
network processing. He studied the effect of the environmental conditions, traffic load,
network dynamics, collaboration behavior, and constraint recourse on packet delivery
performance using empirical experiments and simulations. Although packet delivery is
important in wireless communication and can predict network performance, it can give
wrong indications of network performance level due to collaboration behavior, and
measurement redundancy which makes a network able to tolerate a certain degree of
changes. Also, Yonggang proposed an energy map aggregation based approach that sends
messages recording significant energy level drops to the sink.
The work in this paper has been motivated by the need to find a tool that uses a very low
level of network resources and detects deviations in the network’s operations that affect the
quality and quantity of the data that are collected before they seriously degrade the
network’s overall functionality and reduce its lifetime.
3. Project Methodology
3.1 Layout of manuscript
The layout of this paper is organised as follows: Section 2 includes a discussion of related
work on functionality degradation detection in WSNs, followed by an explanation of the
algorithm’s approach. The fourth section explains the practical implementation of the
algorithm in a TinyOS ‘Surge’ multi-hop application; results of experiments at the network
level are then discussed. Finally, the paper ends with a conclusion and suggestions for
future work.
3.2 Algorithm Approach
In order to overcome the above-mentioned drawbacks, the Voting Median Base Algorithm
for Approximate Performance Measurements of Wireless Sensor Networks (VMBA)
algorithm is proposed. This algorithm is a passive voting algorithm that collects its metrics
directly from the application by utilizing the overhearing which exists in the
neighbourhood. The algorithm requires only readings of neighbours’ measurements and
does not rely on any information regarding global topology. This makes it scalable to any
network deployment size. The proposed algorithm uses parameters found in nodes for
other networking and application protocols which makes it much cheaper in terms of
resource usage. It uses only the transceiver to send warning messages if there is a network
performance degradation or when the node disagrees with the warning messages of
neighbours.
The algorithm is divided into four different modules; i.e. listening and filtering, data
analysis and threshold test, decision and confidence control and warning packet exchange.
In this section we give some definitions and then the VMBA functional algorithm is
presented.
A. Listening and Filtering Module
The listening and filtering module is responsible for examining the validity of the received
neighbour nodes measurements by filtering those readings beyond the range of the sensor’s
physical characteristics; as shown in the pseudo-code in Fig.1 . The module then constructs
neighbour readings tables and builds statistics in the loss table for neighbour readings.
Wireless Sensor Networks: Application-Centric Design416
1: Each
i
S
senses the phenomenon and wait for
time T to receive N(
i
S
) readings
2: IF t > T THEN
3: For each unreceived
i
j
x
increment
i
j
L
;
4: IF
L
C
>
i
j
x
>
M
C
5: Remove
i
j
x
from data set and increment
i
j
D
6: Calculate
i
med
of the available
i
S
data set
Fig. 1. VMBA Algorithm Module 1
B. Data analysis and Threshold Test Module
The second module; i.e. data analysis and threshold test module; tests the content of these
tables. This is done by evaluating the data with regard to assigned dynamic or static limits
calculated from a reference value or median.
The proposed algorithm has followed a straightforward approach in calculating faulty
deviations in sensor functionality. Its analysis assumes that true measurements of a
phenomenon’s characteristics, following a Gaussian pdf, centred on the calculated median
of neighbourhood readings. Any deviation is controlled by the correlation expected at the
end of the sensing range of a node, and the sensor nodes’ measuring accuracy (where most
of the physical processes monitored by WSNs are typically modeled as diffusion models
with varying dispersion functions). This assumption is based on the fact that random errors
are normally distributed with a zero mean and standard deviation is equal to the
specification of the goals designed for the nodes and the network. Any sensor measurement
that is not in this region is considered deviated to a degree equal to the ratio of the distance
from the neighbourhood median value to the median value.
1: IF |
i
med
-
1i
med
| >
med
Increment
i
M
and let
i
med
=
1i
med
2:
j
d = |
i
med
-
i
j
x
|
3: IF
j
d
>
1
and |
i
i
x
-
i
j
x
| <
1
4: Increment
i
j
COV
5: ELSE increment
i
R
6: IF
i
R
k
> 40%
7: Increment
i
N
8: IF
i
R
k
*
j
d
>
1
9: Increment
i
j
D
Fig. 2. VMBA Algorithm Module 2
In addition, the second module tests the effect of losses on the reliability of the collected data
by calculating the degree of distortion in the neighbourhood data that has occurred because
of its affect on the collected data accuracy and network functionality. This is done by
calculating the ratio of the number of healthy readings to the total number readings as
shown in Fig 2 step 8.
C. Decision Confidence Control Module
The third module; i.e. Decision confidence control module; is concerned with tracking
changes in the health of neighbour nodes in an assigned time window. This is set depending
on the characteristics of the network application and the required response detection time. If
exceeded, a request is sent to module four in order to send a detection message to the sink
identifying suspected node number, the type of fault, the number of times it has been
detected and the effect of the detection on the neighbourhood data and communication. The
function of this module is shown in Fig 3.
1: Calculate
i
M
L
2: IF
i
M
L
> 60%
3: Send to module 4 a request to send an inefficient
power consumption warning message
4: IF
i
M
>
M
5: Send to module 4 a request to send a
neighbourhood malfunction due to losses
warning message
6: IF
i
j
COV
>
C
7: Send to module 4 a request to send to
detecting node j a coverage
problem message
8: IF distortion >
d
& median of
i
j
L
> 60%
9: Send to module 4 a request to send a
degrade detection in network
functionality message
10: IF
i
j
D
>
w
11: Send to module 4 a request
to send a detection of node
j malfunction message
Fig. 3. VMBA Algorithm Module 3
D. Warning Packet Exchange Module
When module four receives a send request, it checks its neighbours warning exchange
memory to ensure that none of the neighbour nodes have reported the same fault in that
monitoring window period. If none of the neighbours have so reported, it sends a message
or it cancels the request. In addition, this module tests warning messages received from its
neighbours with statistics from module three. If the suspected node flags up a counter
indication smaller than a threshold, a message will be released indicating
Monitoring Wireless Sensor Network Performance by Tracking Node operational Deviation 417
1: Each
i
S
senses the phenomenon and wait for
time T to receive N(
i
S
) readings
2: IF t > T THEN
3: For each unreceived
i
j
x
increment
i
j
L
;
4: IF
L
C
>
i
j
x
>
M
C
5: Remove
i
j
x
from data set and increment
i
j
D
6: Calculate
i
med
of the available
i
S
data set
Fig. 1. VMBA Algorithm Module 1
B. Data analysis and Threshold Test Module
The second module; i.e. data analysis and threshold test module; tests the content of these
tables. This is done by evaluating the data with regard to assigned dynamic or static limits
calculated from a reference value or median.
The proposed algorithm has followed a straightforward approach in calculating faulty
deviations in sensor functionality. Its analysis assumes that true measurements of a
phenomenon’s characteristics, following a Gaussian pdf, centred on the calculated median
of neighbourhood readings. Any deviation is controlled by the correlation expected at the
end of the sensing range of a node, and the sensor nodes’ measuring accuracy (where most
of the physical processes monitored by WSNs are typically modeled as diffusion models
with varying dispersion functions). This assumption is based on the fact that random errors
are normally distributed with a zero mean and standard deviation is equal to the
specification of the goals designed for the nodes and the network. Any sensor measurement
that is not in this region is considered deviated to a degree equal to the ratio of the distance
from the neighbourhood median value to the median value.
1: IF |
i
med
-
1i
med
| >
med
Increment
i
M
and let
i
med
=
1i
med
2:
j
d = |
i
med
-
i
j
x
|
3: IF
j
d
>
1
and |
i
i
x
-
i
j
x
| <
1
4: Increment
i
j
COV
5: ELSE increment
i
R
6: IF
i
R
k
> 40%
7: Increment
i
N
8: IF
i
R
k
*
j
d
>
1
9: Increment
i
j
D
Fig. 2. VMBA Algorithm Module 2
In addition, the second module tests the effect of losses on the reliability of the collected data
by calculating the degree of distortion in the neighbourhood data that has occurred because
of its affect on the collected data accuracy and network functionality. This is done by
calculating the ratio of the number of healthy readings to the total number readings as
shown in Fig 2 step 8.
C. Decision Confidence Control Module
The third module; i.e. Decision confidence control module; is concerned with tracking
changes in the health of neighbour nodes in an assigned time window. This is set depending
on the characteristics of the network application and the required response detection time. If
exceeded, a request is sent to module four in order to send a detection message to the sink
identifying suspected node number, the type of fault, the number of times it has been
detected and the effect of the detection on the neighbourhood data and communication. The
function of this module is shown in Fig 3.
1: Calculate
i
M
L
2: IF
i
M
L
> 60%
3: Send to module 4 a request to send an inefficient
power consumption warning message
4: IF
i
M
>
M
5: Send to module 4 a request to send a
neighbourhood malfunction due to losses
warning message
6: IF
i
j
COV
>
C
7: Send to module 4 a request to send to
detecting node j a coverage
problem message
8: IF distortion >
d
& median of
i
j
L
> 60%
9: Send to module 4 a request to send a
degrade detection in network
functionality message
10: IF
i
j
D
>
w
11: Send to module 4 a request
to send a detection of node
j malfunction message
Fig. 3. VMBA Algorithm Module 3
D. Warning Packet Exchange Module
When module four receives a send request, it checks its neighbours warning exchange
memory to ensure that none of the neighbour nodes have reported the same fault in that
monitoring window period. If none of the neighbours have so reported, it sends a message
or it cancels the request. In addition, this module tests warning messages received from its
neighbours with statistics from module three. If the suspected node flags up a counter
indication smaller than a threshold, a message will be released indicating
Wireless Sensor Networks: Application-Centric Design418
‘NO_FAULT_EVIDENCE’ regarding the received warning message. On the other hand, if
the threshold is higher or equal to the threshold, then the node cancels any similar warning
message request from module three during that monitoring period. This is to ensure the
reliability of the warning message detection and to correct any incorrect detection that may
occur because of losses or other network circumstances. Moreover, module four reduces the
algorithm warning packets released by checking if any of its neighbours sent the same
message at that time interval. If it been sent the algorithm is going to discard module three
requests as shown in Fig. 4 part 3.
1: Receiving neighbour warning
a) Check received warning with the same module 3 counter of reported node.
b) IF module 3 counter < 30%
c) Release ‘NO-EVIDENCE-OF-FAULT’ message
d) ELSE flag the stop sending of the same message from the node at this monitoring
time.
2: Receiving module 3 request
a) Test stop flag of received request warning
b) IF flag = 1 discard message
c) IF send message repeated 3 times send stop reporting the fault message and flag stop
fault counter.
d) ELSE send the requested message by module 3.
3: Testing warning packet release
a) IF detected fault returns to normal reset the same fault counters, send
‘FAULT_CLEAR’ message and recalculate protocol tables.
b) IF step 2 and 3-a alternate for the same fault three times in a predefined monitoring
window, the module send s an ‘UNSTABLE_DETECTION’ warning message to
report the detection and flags a permanent fault counter to stop reporting the
same fault.
c) By the end of the predefined period reset all counters.
Fig. 4. VMBA Algorithm Module 4
4. Performance Evaluation
VMBA algorithm performance can be evaluate on eight different aspects: deviation
detection in single and multi-hop levels, algorithm detection threshold, algorithm detection
confidence, algorithm spatial and temporary change tracking for sensor nodes, the impact of
packet losses on algorithm analysis, resource usage at node and network levels, the impact
of algorithm programming location in the protocol stack, and algorithm released warning
messages. In this paper, we considered the empirical performance evaluation of the
algorithm at the network level.
4.1 Algorithm Programming in Protocol Stacks
The algorithm was implemented on a Berkeley (Crossbow) Mica2 sensor motes testbed that
was programmed in nesC on TinyOS operation system. This is done by building the
proposed algorithm on the TinyOS multi-hop routing protocol.
The TinyOS multi-hop protocol consists of MultiHopEngineM; which provides the over all
packet movement logic for multi-hop functionality; and MultiHopLEPSM; which is used to
provide the link estimation and parent selection mechanisms. These two TinyOS
components were modified by added different functions from the proposed algorithm
modules as shown at Figure 5.
Fig. 5. Functions added to multi-hop components and links between the components
In order to send detected warning packets, a new packet type was constructed. This new
packet carries the algorithm detection parameters; as shown at Figure 6. It has a total length
of 20 bytes, the last 8 are used for algorithm detection, while the first 12 follow the multi-hop
protocol configuration. This is to route the released warning packet in the network.
Fig. 6. Algorithm warning message packet
Monitoring Wireless Sensor Network Performance by Tracking Node operational Deviation 419
‘NO_FAULT_EVIDENCE’ regarding the received warning message. On the other hand, if
the threshold is higher or equal to the threshold, then the node cancels any similar warning
message request from module three during that monitoring period. This is to ensure the
reliability of the warning message detection and to correct any incorrect detection that may
occur because of losses or other network circumstances. Moreover, module four reduces the
algorithm warning packets released by checking if any of its neighbours sent the same
message at that time interval. If it been sent the algorithm is going to discard module three
requests as shown in Fig. 4 part 3.
1: Receiving neighbour warning
a) Check received warning with the same module 3 counter of reported node.
b) IF module 3 counter < 30%
c) Release ‘NO-EVIDENCE-OF-FAULT’ message
d) ELSE flag the stop sending of the same message from the node at this monitoring
time.
2: Receiving module 3 request
a) Test stop flag of received request warning
b) IF flag = 1 discard message
c) IF send message repeated 3 times send stop reporting the fault message and flag stop
fault counter.
d) ELSE send the requested message by module 3.
3: Testing warning packet release
a) IF detected fault returns to normal reset the same fault counters, send
‘FAULT_CLEAR’ message and recalculate protocol tables.
b) IF step 2 and 3-a alternate for the same fault three times in a predefined monitoring
window, the module send s an ‘UNSTABLE_DETECTION’ warning message to
report the detection and flags a permanent fault counter to stop reporting the
same fault.
c) By the end of the predefined period reset all counters.
Fig. 4. VMBA Algorithm Module 4
4. Performance Evaluation
VMBA algorithm performance can be evaluate on eight different aspects: deviation
detection in single and multi-hop levels, algorithm detection threshold, algorithm detection
confidence, algorithm spatial and temporary change tracking for sensor nodes, the impact of
packet losses on algorithm analysis, resource usage at node and network levels, the impact
of algorithm programming location in the protocol stack, and algorithm released warning
messages. In this paper, we considered the empirical performance evaluation of the
algorithm at the network level.
4.1 Algorithm Programming in Protocol Stacks
The algorithm was implemented on a Berkeley (Crossbow) Mica2 sensor motes testbed that
was programmed in nesC on TinyOS operation system. This is done by building the
proposed algorithm on the TinyOS multi-hop routing protocol.
The TinyOS multi-hop protocol consists of MultiHopEngineM; which provides the over all
packet movement logic for multi-hop functionality; and MultiHopLEPSM; which is used to
provide the link estimation and parent selection mechanisms. These two TinyOS
components were modified by added different functions from the proposed algorithm
modules as shown at Figure 5.
Fig. 5. Functions added to multi-hop components and links between the components
In order to send detected warning packets, a new packet type was constructed. This new
packet carries the algorithm detection parameters; as shown at Figure 6. It has a total length
of 20 bytes, the last 8 are used for algorithm detection, while the first 12 follow the multi-hop
protocol configuration. This is to route the released warning packet in the network.
Fig. 6. Algorithm warning message packet
Wireless Sensor Networks: Application-Centric Design420
At the algorithm detection part, the first byte carries the total number of readings, that is the
number of neighbour nodes in addition to the monitoring node. The next two bytes carry
the number of neighbors detected by the node as dead and deviated respectively. This is
followed by a byte that carries the identification number of the detected faulty neighbour
node. The byte after this carries the type of fault codes; as shown in Table 1; and the final
two bytes carry the number of times that the monitoring node detect the reported fault.
5. Experimental Setting and Evaluation Metrics
Several experiments were conducted indoors at the High Speed Network Research Group
Lab in Loughborough University to test the proposed algorithm’s functionality in real
sensor network scenarios. These experiments were conducted in the presence of other
devices that are able to interfere with the sensor transmission and reduce the antennae
performance; these offer experiments in a dynamic topology and in circumstances of high
packet losses. Some of these experiments were conducted to test the algorithm’s
functionality under multi-hop and highly dynamic topology configurations. These
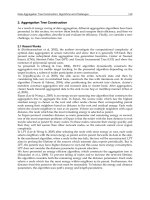
experiments used 13 Mica2 sensors, measuring temperature, distributed in an area of about
4mX5m. The nodes were programmed with the output power of -20 dBm and had top bent
antennae to limit their communication range. In this configuration, the nodes were divided
into two groups which overlapped in an area between them; thus, some of the nodes around
the edge could not hear or communicate with each other (as shown in Figure 7). Moreover,
this configuration forced the topology to be highly dynamic. This leads nodes to miss
hearing each other and frequently change their multi-hop routing parents in the sink. These
experiments used Mica2 nodes attached to a MIB510 programming board as a base station
connected to a computer serial port. A snooping node was also added to the network setting
with its power programmed to the maximum (i.e. 5dBm) in order to listen to
communications among all the nodes within the network and to track packet exchanges in
the multi-hop without increasing the usage of resources of the network’s sensor nodes.
Fault Type Code
TOPOLOGY_UNSTABLE 0
FAULT_TYPE_DEVIATION 1
FAULT_TYPE_COMMUNICATION 2
FAULT_TYPE_COVERAGE 3
FAULT_TYPE_ENERGY_CONSUMPTION
4
NO_EVEDENCE_OF_FAULT 5
FAULT_MESSAGE_STOP 6
FAULT_TYPE_DEID 7
FAULT_CLEAR 8
NEIGHBORHOOD_MULFUNCTION 9
PROTOCOL_EFFECT 10
Table 1. Codes of detected faults in algorithm warning messages
The metrics used to evaluate the results were, firstly, the percentage of incorrectly released
dead node warnings. This is the ratio of the number of false dead node detections released
by the algorithm as opposed to the total number of packets released by the application. This
indicates the impact of high network dynamics on the algorithm’s incorrect detection. The
second metric was the percentage of ‘NO-FAULT-EVIDENCE’ messages released by the
algorithm, which is the ratio of the number of ‘NO-FAULT-EVIDENCE‘ messages to the
total number of packets released by the application. This also indicates the impact of high
network dynamics but on neighbours’ passive tests of incorrect detections.
Fig. 7. Logical topology of the experiment at a time interval
These experiments tested the impact of the dead node window threshold, and monitoring
window size on the algorithm’s detection of dead nodes and the number of warning messages
released by it in a highly dynamic network. The algorithm parameters that were tested, as
shown in Table 2,and 3 were changed in different experiments to check their impact on the
deductibility performance of the network and the exchange of warning packets.
Window
Type
Small Monitoring window Big Monitoring
Window
Stop Reporting
Window
Diversion 120 seconds
(70% threshold)
480 seconds(8
minutes)
1920 seconds
(32 minutes)
Distortion 60 seconds (84% loss threshold and larger
than 25% accuracy of the two nodes)
240 seconds(4
minutes)
960 seconds
(16 minutes)
Dead 60 seconds 240 seconds(4
minutes)
960 seconds
(16 minutes)
Table 2. Sizes of monitoring windows in the experiments
Monitoring Wireless Sensor Network Performance by Tracking Node operational Deviation 421
At the algorithm detection part, the first byte carries the total number of readings, that is the
number of neighbour nodes in addition to the monitoring node. The next two bytes carry
the number of neighbors detected by the node as dead and deviated respectively. This is
followed by a byte that carries the identification number of the detected faulty neighbour
node. The byte after this carries the type of fault codes; as shown in Table 1; and the final
two bytes carry the number of times that the monitoring node detect the reported fault.
5. Experimental Setting and Evaluation Metrics
Several experiments were conducted indoors at the High Speed Network Research Group
Lab in Loughborough University to test the proposed algorithm’s functionality in real
sensor network scenarios. These experiments were conducted in the presence of other
devices that are able to interfere with the sensor transmission and reduce the antennae
performance; these offer experiments in a dynamic topology and in circumstances of high
packet losses. Some of these experiments were conducted to test the algorithm’s
functionality under multi-hop and highly dynamic topology configurations. These
experiments used 13 Mica2 sensors, measuring temperature, distributed in an area of about
4mX5m. The nodes were programmed with the output power of -20 dBm and had top bent
antennae to limit their communication range. In this configuration, the nodes were divided
into two groups which overlapped in an area between them; thus, some of the nodes around
the edge could not hear or communicate with each other (as shown in Figure 7). Moreover,
this configuration forced the topology to be highly dynamic. This leads nodes to miss
hearing each other and frequently change their multi-hop routing parents in the sink. These
experiments used Mica2 nodes attached to a MIB510 programming board as a base station
connected to a computer serial port. A snooping node was also added to the network setting
with its power programmed to the maximum (i.e. 5dBm) in order to listen to
communications among all the nodes within the network and to track packet exchanges in
the multi-hop without increasing the usage of resources of the network’s sensor nodes.
Fault Type Code
TOPOLOGY_UNSTABLE 0
FAULT_TYPE_DEVIATION 1
FAULT_TYPE_COMMUNICATION 2
FAULT_TYPE_COVERAGE 3
FAULT_TYPE_ENERGY_CONSUMPTION
4
NO_EVEDENCE_OF_FAULT 5
FAULT_MESSAGE_STOP 6
FAULT_TYPE_DEID 7
FAULT_CLEAR 8
NEIGHBORHOOD_MULFUNCTION 9
PROTOCOL_EFFECT 10
Table 1. Codes of detected faults in algorithm warning messages
The metrics used to evaluate the results were, firstly, the percentage of incorrectly released
dead node warnings. This is the ratio of the number of false dead node detections released
by the algorithm as opposed to the total number of packets released by the application. This
indicates the impact of high network dynamics on the algorithm’s incorrect detection. The
second metric was the percentage of ‘NO-FAULT-EVIDENCE’ messages released by the
algorithm, which is the ratio of the number of ‘NO-FAULT-EVIDENCE‘ messages to the
total number of packets released by the application. This also indicates the impact of high
network dynamics but on neighbours’ passive tests of incorrect detections.
Fig. 7. Logical topology of the experiment at a time interval
These experiments tested the impact of the dead node window threshold, and monitoring
window size on the algorithm’s detection of dead nodes and the number of warning messages
released by it in a highly dynamic network. The algorithm parameters that were tested, as
shown in Table 2,and 3 were changed in different experiments to check their impact on the
deductibility performance of the network and the exchange of warning packets.
Window
Type
Small Monitoring window Big Monitoring
Window
Stop Reporting
Window
Diversion 120 seconds
(70% threshold)
480 seconds(8
minutes)
1920 seconds
(32 minutes)
Distortion 60 seconds (84% loss threshold and larger
than 25% accuracy of the two nodes)
240 seconds(4
minutes)
960 seconds
(16 minutes)
Dead 60 seconds 240 seconds(4
minutes)
960 seconds
(16 minutes)
Table 2. Sizes of monitoring windows in the experiments
Wireless Sensor Networks: Application-Centric Design422
Window
Small
windows
Small
window size
Size of Big
window
Number of
small window
at the group
Total
monitoring
window size
1 Linear
increased
240 seconds
(4 minutes)
3 groups 4-8-12 48 minutes
2 Exponential
increased
8-12-16 64 minutes
3 10-14-18 72 minutes
4 14-16-20 80 minutes
Table 3. Size of monitoring windows
5.1 Effect of Network Topology and Packet Losses on the Algorithm’s Functionality
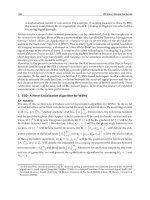
Figure 8 plots the relationship between the percentage of detected and ‘No_Fault_Evidence’
messages released from the algorithm for different application reporting rates. (Please note
that reporting rates logs were used in the figure to plot these). The results of the experiments
showed that at a 1 second reporting rate (a multi-hop protocol leads to congestion and an
overflow of communication), a large amount of wrong suspected dead warnings occurred
(around 3.2% of the total network packet exchange in the application). Furthermore, a large
number of ‘No_Fault_Evidence’ replies were released from neighbour messages (i.e. around
0.5% of the total packets in the network application). Reducing the application’s reporting
rate to 2 seconds reduced the number of suspected dead messages; these decreased sharply
to 0.5% of the total number of packets released by the network application. This happened
alongside a reduction in ‘No_Fault_Evidence’ messages which reached around 0.01% of the
total number of packets released. Thus, the number of suspected dead messages was
reduced to almost 0% when the application’s reporting rate was adjusted to 1 minute, along
with a decrease in ‘No_Fault_Evidence’ messages released from neighbours. When the
application’s reporting rate was increased to 30 minutes, a sharp increase occurred in the
number of suspected dead and ‘No_Fault_Evidence’ messages, as shown in the figure. Also,
Figure 8 shows that, by increasing the application’s reporting rate above 1 minute, the
number of ‘No_Fault_Evidence’ messages increases so that it becomes higher than the
number of suspected dead messages. This is as a result of the size of the monitoring
windows and the highly dynamic network topology.
From these experiments, it can be concluded that dead node warnings will not disappear
spatially in a monitored network when the network connections are highly dynamic. To
reduce the number of wrong suspected dead messages, different window sizes and
combinations were tested, as shown in Table 3. Figure 9 shows the relation between the
percentage of correct, positive detected (wrong detection) by the algorithm, together with
the negative false dead nodes for different sizes of large monitoring windows. The figure
illustrates that, as the big monitoring window size increased, the confidence of the
algorithm’s detection of dead neighbour nodes increased, along with a decrease in the
number of packets released by the algorithm. Although increasing window size will reduce
the number of wrong messages, it also increases the response detection time and the
probability of node failure occurring before releasing the warning message.
10
0
10
1
10
2
10
3
0
0.5
1
1.5
2
2.5
3
3.5
Reporting Rate (Seconds)
Percentage of Algorithm Warning Packets
Dead Warning
No-Fault-Evedence
Fig. 8. Changing reporting rates with the percentage of warning messages released with the
same window size
0
1
2
1 2 3 4
Big Window
Percentage of
Warning
Messages
Dead No_Fault_ Evidence
Message Stopped
Fig. 9. Percentage of warning messages released for different window configurations
To solve this problem, the algorithm was programmed such that it would select the
neighbours it would monitor; this selection depends on the amount of received packets. This
configuration reduced the number of wrong packets reported by 80% and reduced
‘No_Evidence_Fault’ by 70%, as Figure 10 shows, but it also added additional complexity to
algorithm’s source code and its functionality. Moreover, there will be uncovered neighbour
nodes in low density networks. In addition, the proposed algorithm was modified to send
warning messages concerning the detection of connectivity problems between neighbour
nodes. This makes the algorithm stop reporting a suspected node if the node is detected as
Monitoring Wireless Sensor Network Performance by Tracking Node operational Deviation 423
Window
Small
windows
Small
window size
Size of Big
window
Number of
small window
at the group
Total
monitoring
window size
1 Linear
increased
240 seconds
(4 minutes)
3 groups 4-8-12 48 minutes
2 Exponential
increased
8-12-16 64 minutes
3 10-14-18 72 minutes
4 14-16-20 80 minutes
Table 3. Size of monitoring windows
5.1 Effect of Network Topology and Packet Losses on the Algorithm’s Functionality
Figure 8 plots the relationship between the percentage of detected and ‘No_Fault_Evidence’
messages released from the algorithm for different application reporting rates. (Please note
that reporting rates logs were used in the figure to plot these). The results of the experiments
showed that at a 1 second reporting rate (a multi-hop protocol leads to congestion and an
overflow of communication), a large amount of wrong suspected dead warnings occurred
(around 3.2% of the total network packet exchange in the application). Furthermore, a large
number of ‘No_Fault_Evidence’ replies were released from neighbour messages (i.e. around
0.5% of the total packets in the network application). Reducing the application’s reporting
rate to 2 seconds reduced the number of suspected dead messages; these decreased sharply
to 0.5% of the total number of packets released by the network application. This happened
alongside a reduction in ‘No_Fault_Evidence’ messages which reached around 0.01% of the
total number of packets released. Thus, the number of suspected dead messages was
reduced to almost 0% when the application’s reporting rate was adjusted to 1 minute, along
with a decrease in ‘No_Fault_Evidence’ messages released from neighbours. When the
application’s reporting rate was increased to 30 minutes, a sharp increase occurred in the
number of suspected dead and ‘No_Fault_Evidence’ messages, as shown in the figure. Also,
Figure 8 shows that, by increasing the application’s reporting rate above 1 minute, the
number of ‘No_Fault_Evidence’ messages increases so that it becomes higher than the
number of suspected dead messages. This is as a result of the size of the monitoring
windows and the highly dynamic network topology.
From these experiments, it can be concluded that dead node warnings will not disappear
spatially in a monitored network when the network connections are highly dynamic. To
reduce the number of wrong suspected dead messages, different window sizes and
combinations were tested, as shown in Table 3. Figure 9 shows the relation between the
percentage of correct, positive detected (wrong detection) by the algorithm, together with
the negative false dead nodes for different sizes of large monitoring windows. The figure
illustrates that, as the big monitoring window size increased, the confidence of the
algorithm’s detection of dead neighbour nodes increased, along with a decrease in the
number of packets released by the algorithm. Although increasing window size will reduce
the number of wrong messages, it also increases the response detection time and the
probability of node failure occurring before releasing the warning message.
10
0
10
1
10
2
10
3
0
0.5
1
1.5
2
2.5
3
3.5
Reporting Rate (Seconds)
Percentage of Algorithm Warning Packets
Dead Warning
No-Fault-Evedence
Fig. 8. Changing reporting rates with the percentage of warning messages released with the
same window size
0
1
2
1 2 3 4
Big Window
Percentage of
Warning
Messages
Dead No_Fault_ Evidence
Message Stopped
Fig. 9. Percentage of warning messages released for different window configurations
To solve this problem, the algorithm was programmed such that it would select the
neighbours it would monitor; this selection depends on the amount of received packets. This
configuration reduced the number of wrong packets reported by 80% and reduced
‘No_Evidence_Fault’ by 70%, as Figure 10 shows, but it also added additional complexity to
algorithm’s source code and its functionality. Moreover, there will be uncovered neighbour
nodes in low density networks. In addition, the proposed algorithm was modified to send
warning messages concerning the detection of connectivity problems between neighbour
nodes. This makes the algorithm stop reporting a suspected node if the node is detected as
Wireless Sensor Networks: Application-Centric Design424
dead and if 3 clear dead messages are detected at the stop reporting monitoring window.
Figure 10 plots comparisons between the percentages of the algorithm’s released dead and
no evidence messages in a neighbourhood with and without the modification covering
connectivity problems. The figure shows that there is a reduction of 20% in the number of
‘No_Fault_Evidence’ messages as a result of a 34% reduction in the detection of dead
packets.
0
0.1
0.2
0.3
0.4
0.5
0.6
With Neighbor Selection Without Neighbor Selection
Packet Percentage
Dead No_Fault_Evidence
Fig. 10. Number of exchanged warning packets between selected and not selected neighbour
nodes.
6. Conclusion and Future Work
We proposed a distributed performance algorithm that enables each sensor node at sensor
network to detect the health of nodes at neighbourhood and their collaborative
functionality. This algorithm sends a warning packet to the sink reporting any degradation
detection.
The proposed algorithm tested using TinyOS ‘Surge’ multi-hop application on Berkely
Mica2 sensor nodes testbed. These empirical experiments showed that the high loss in WSN
causes proposed algorithm wrong detection of neighbour nodes aliveness and released
more ‘NO_EVIDENCE_FAULT’ messages. This controlled by adjusting the monitoring
window size and reduces the proposed algorithm wrong detection by 80% and the
‘NO_EVIDENCE_FAULT’ messages by 70%.
There are numerous aspects that can be considered in the future in order to extend this work
and improve the algorithm’s functionality, such as checking the impact of the mobility of
sensor nodes on the algorithm’s functionality. Also, it would be useful to study the impact
of faulty data on individual WSN protocols and compare these results with the proposed
approximate calculation that depends on the number of deviated nodes.
7. References
Elnahrawy Eiman and N. Badri, (2004). Cleaning and Querying Noisy Sensors, The First ACM
Conference on Embedded Networked Sensor Systems (SenSys'03), pp. 78-87.
N. Ramanathan, T. Schoellhammer, D. Estrin, M. Hansen, T. Harmon, E. Kohler, and M.
Srivastava,(2006). The Final Frontier: Embedding Networked Sensors in the Soil, CENS
Technical Report #68, Center for Embedded Networked Sensing, UCLA, USA.
G. Tolle, J. Polastre, R. Szewczyk, D. Culler, N. Turner, K. Tu, S. Burgess, T. Dawson, P.
Buonadonna, D. Gay, and W. Hong, (2005). A Macroscope in the Redwoods, ACM
Conference on Embedded Networked Sensor Systems (SenSys'05), pp. 51-63.
W. Yao-jung , M. Alice Agogine and G. Kai. (2004). Fuzzy Validation and Fusion for Wireless
Sensor Networks, in ASMEinternational Mechanical Engineering Congress and
RD&D Expo (IMECE2004),Anaheim, California, USA
H. Song and C. Edward. (2004). Continuous Residual Energy Monitoring in Wireless Sensor
Networks, in International Symposium on Parallel and Distributed Processing and
Applications (ISPA 2004), pp. 169-177.
Linnyer Beatrys Ruiz, Isabela G. Siqueria and Leonardo B. Oliveira. (2004). Fault
Management in Event-driven Wireless Sensor Networks, in MSWiM’04, October 4-6,
Venezia, Italy.
K. Bhaskar and S. S. Iyengar. (2004). Distributes Bayesian Algorithms for Fult-tolerant Event
Region Detection in Wireless Sensor Networks,IEEE Transaction on Computers, vol. 53,
pp. 421-250.
F. Koushanfar, M. Potkonjak and A. Sangiovanni-Vincentelli. (2003). On-line Fault Detection
of Sensor Measurements, in Sensors. Proceedings of IEEE, 2003, pp. 974-979.
X. Luo, M. Dong and Y. Huang(2006). "On Distributed Fault-tolerant Detection in Wireless
Sensor Networks," IEEE Transactions on Computers, vol. 55, pp. 58-70.
C. Jaikaeo, C. Srisathapornphat and C. Shen, (2001). Diagnosis of Sensor Networks, in
Communications, 2001. ICC 2001. IEEE International Conference, pp. 1627-1632.
N. Ramanathan, K. Chang, R. Kapur, L. Girod, E. Kohler and D. Estrin, (2005). Sympathy for
the Sensor Network Debugger, in The 3rd ACM Conf. Embedded Networked Sensor
Systems (SenSys 2005), pp. 255-267.
Z. Yonggang, (2004). Measurement and Monitoring in Wireless Sensor Networks, PhD Thesis,
Computer Science Department, University of Southern California, USA, June. 2004.
Monitoring Wireless Sensor Network Performance by Tracking Node operational Deviation 425
dead and if 3 clear dead messages are detected at the stop reporting monitoring window.
Figure 10 plots comparisons between the percentages of the algorithm’s released dead and
no evidence messages in a neighbourhood with and without the modification covering
connectivity problems. The figure shows that there is a reduction of 20% in the number of
‘No_Fault_Evidence’ messages as a result of a 34% reduction in the detection of dead
packets.
0
0.1
0.2
0.3
0.4
0.5
0.6
With Neighbor Selection Without Neighbor Selection
Packet Percentage
Dead No_Fault_Evidence
Fig. 10. Number of exchanged warning packets between selected and not selected neighbour
nodes.
6. Conclusion and Future Work
We proposed a distributed performance algorithm that enables each sensor node at sensor
network to detect the health of nodes at neighbourhood and their collaborative
functionality. This algorithm sends a warning packet to the sink reporting any degradation
detection.
The proposed algorithm tested using TinyOS ‘Surge’ multi-hop application on Berkely
Mica2 sensor nodes testbed. These empirical experiments showed that the high loss in WSN
causes proposed algorithm wrong detection of neighbour nodes aliveness and released
more ‘NO_EVIDENCE_FAULT’ messages. This controlled by adjusting the monitoring
window size and reduces the proposed algorithm wrong detection by 80% and the
‘NO_EVIDENCE_FAULT’ messages by 70%.
There are numerous aspects that can be considered in the future in order to extend this work
and improve the algorithm’s functionality, such as checking the impact of the mobility of
sensor nodes on the algorithm’s functionality. Also, it would be useful to study the impact
of faulty data on individual WSN protocols and compare these results with the proposed
approximate calculation that depends on the number of deviated nodes.
7. References
Elnahrawy Eiman and N. Badri, (2004). Cleaning and Querying Noisy Sensors, The First ACM
Conference on Embedded Networked Sensor Systems (SenSys'03), pp. 78-87.
N. Ramanathan, T. Schoellhammer, D. Estrin, M. Hansen, T. Harmon, E. Kohler, and M.
Srivastava,(2006). The Final Frontier: Embedding Networked Sensors in the Soil, CENS
Technical Report #68, Center for Embedded Networked Sensing, UCLA, USA.
G. Tolle, J. Polastre, R. Szewczyk, D. Culler, N. Turner, K. Tu, S. Burgess, T. Dawson, P.
Buonadonna, D. Gay, and W. Hong, (2005). A Macroscope in the Redwoods, ACM
Conference on Embedded Networked Sensor Systems (SenSys'05), pp. 51-63.
W. Yao-jung , M. Alice Agogine and G. Kai. (2004). Fuzzy Validation and Fusion for Wireless
Sensor Networks, in ASMEinternational Mechanical Engineering Congress and
RD&D Expo (IMECE2004),Anaheim, California, USA
H. Song and C. Edward. (2004). Continuous Residual Energy Monitoring in Wireless Sensor
Networks, in International Symposium on Parallel and Distributed Processing and
Applications (ISPA 2004), pp. 169-177.
Linnyer Beatrys Ruiz, Isabela G. Siqueria and Leonardo B. Oliveira. (2004). Fault
Management in Event-driven Wireless Sensor Networks, in MSWiM’04, October 4-6,
Venezia, Italy.
K. Bhaskar and S. S. Iyengar. (2004). Distributes Bayesian Algorithms for Fult-tolerant Event
Region Detection in Wireless Sensor Networks,IEEE Transaction on Computers, vol. 53,
pp. 421-250.
F. Koushanfar, M. Potkonjak and A. Sangiovanni-Vincentelli. (2003). On-line Fault Detection
of Sensor Measurements, in Sensors. Proceedings of IEEE, 2003, pp. 974-979.
X. Luo, M. Dong and Y. Huang(2006). "On Distributed Fault-tolerant Detection in Wireless
Sensor Networks," IEEE Transactions on Computers, vol. 55, pp. 58-70.
C. Jaikaeo, C. Srisathapornphat and C. Shen, (2001). Diagnosis of Sensor Networks, in
Communications, 2001. ICC 2001. IEEE International Conference, pp. 1627-1632.
N. Ramanathan, K. Chang, R. Kapur, L. Girod, E. Kohler and D. Estrin, (2005). Sympathy for
the Sensor Network Debugger, in The 3rd ACM Conf. Embedded Networked Sensor
Systems (SenSys 2005), pp. 255-267.
Z. Yonggang, (2004). Measurement and Monitoring in Wireless Sensor Networks, PhD Thesis,
Computer Science Department, University of Southern California, USA, June. 2004.
Building Context Aware Network of Wireless Sensors Using
a Scalable Distributed Estimation Scheme for Real-time Data Manipulation 427
Building Context Aware Network of Wireless Sensors Using a Scalable
Distributed Estimation Scheme for Real-time Data Manipulation
Amir Hossein Basirat and Asad I. Khan
X
Building Context Aware Network
of Wireless Sensors Using a Scalable
Distributed Estimation Scheme for
Real-time Data Manipulation
Amir Hossein Basirat and Asad I. Khan
Monash University
Australia
1. Introduction
Wireless sensor networks are an “exciting emerging domain of deeply networked systems of
low-power wireless motes with a tiny amount of CPU and memory and large federated
networks for high-resolution sensing of the environment” (Welsh et al., 2004). The capability
to support plethora of new diverse applications has placed Wireless Sensor Network
technology at threshold of an era of significant potential growth. The technology is
advancing rapidly under the push of the new technological developments and the pull of
vast and diverse potential applications. The near ubiquity of the internet coupled with
recent engineering achievements, are opening the door to a new generation of low-cost and
powerful sensor devices which are capable of delivering high-grade spatial and temporal
resolution. In that regard, distributed estimation and tracking is one of the most
fundamental collaborative information processing challenges in wireless sensor networks
(WSNs). Moreover, estimation issues in wireless networks with packet-loss are gaining lion
share of attention over the last few years. However, due to the inherent limitations of WSNs
in terms of power and computational resources, deploying any distributed estimation
technique within WSNs requires modifying the existing methods to address those
limitations effectively. In fact, the problem with current approaches lies in the significant
increase in the computational expenses of the deployed methods as the result of increase in
the size of the network. This increase puts a heavy practical burden on deployment of those
algorithms for resource-constrained wireless sensor networks.
Current decentralized Kalman filtering involves state estimation using a set of local Kalman
filters that communicate with all other nodes. The information flow is all-to-all with
approximate communication complexity of O(n
2
) which is not scalable for WSNs. In this
chapter an attempt is made to explore new ways in provisioning distributed estimation in
WSNs by introducing a light-weight distributed pattern recognition scheme which provides
single-cycle learning and entails a large number of loosely coupled parallel operations. In
fact, the focus of our approach would be on a novel scalable and distributed filtering scheme
in which each node only communicates messages with its neighbours on a network to
22
Wireless Sensor Networks: Application-Centric Design428
minimize the communication overhead to a high degree. In order to achieve higher level of
simplicity to increase effectiveness of algorithm deployment in terms of utilizing limited
available resources, a novel approach toward real-time distributed estimation is introduced,
using a simplified graph-based method called Distributed Hierarchical Graph Neuron
(DHGN). The proposed approach not only enjoys from conserving the limited power
resources of resource-constrained sensor nodes, but also can be scaled effectively to address
scalability issues which are of primary concern in wireless sensor networks. The proposed
scheme is not intending to replace existing complex methods which are treated in the
literature, but rather makes an attempt to reduce the computational expenses involved in
the processing of the gathered in-situ information from sensor nodes. Strength of DHGN lies
in the processing of non-uniform data patterns as it implements a finely distributable
framework at the smallest (atomic) logical sub-pattern level. The results are easily obtained
by summation at the overall pattern level. Hence, the algorithm is able to provide some sort
of divide and distribute filtering process throughout the network in a fine-grained manner
for minimizing the energy use. DHGN is also a highly scalable algorithm that allows real-
time in-network data manipulation; essential feature for real-time data processing in WSNs.
The outline for this chapter is as follows. Section 2 provides an overview of WSN technology
and its current research trends. Section 3 provides a discussion on the limitations of existing
approaches for data fusion and distributed estimation within WSNs. We will then introduce
our proposed distributed event detection and pattern classification scheme in Section 4.
Section 5 deals with performance metrics for our novel algorithm. Section 6 entails further
discussion on our proposed scheme and future direction of this research. Finally, section 7
concludes the chapter.
2. WSN Overview
A wireless sensor network (WSN) in its simplest form can be defined as (Chong & Kumar,
2003; Akyildiz, Su, Sankarasubramaniam & Cayirci, 2002; Culler, Estrin & Srivastava, 2004)
a network of (possibly low-size and low-complex) devices denoted as nodes that can sense
the environment and communicate the information gathered from the monitored field (e.g.,
an area or volume) through wireless links; the data is forwarded, possibly via multiple hops
relaying to a sink (sometimes denoted as controller or monitor ) that can use it locally or is
connected to other networks (e.g., the Internet) through a gateway. The nodes can be
stationary or moving. They can be aware of their location or not. They can be homogeneous
or not. A traditional single-sink WSN is illustrated in Figure 1. Almost all scientific papers in
the literature deal with such a definition. This single-sink scenario suffers from the lack of
scalability: by increasing the number of nodes the amount of data gathered by the sink
increases and once its capacity is reached the network size can not be augmented. Moreover,
for reasons related to medium access control (MAC) and routing aspects, network
performance cannot be considered independent from the network size. A more general
scenario includes multiple sinks in the network (see Figure 2). Given a level of node density,
a larger number of sinks will decrease the probability of isolated clusters of nodes that
cannot deliver their data owing to unfortunate signal propagation conditions.
Fig. 1. Traditional single-sink WSN
In principle, a multiple-sink WSN can be scalable (i.e., the same performance can be
achieved even by increasing the number of nodes), while this is clearly not true for a single-
sink network. However, a multi-sink WSN does not represent a trivial extension of a single-
sink case for the network engineer. There might be mainly two different cases: (1) all sinks
are connected through a separate network (either wired or wireless), or (2) the sinks are
disconnected. In the former case, a node needs to forward the data collected to any element
in the set of sinks. From the protocol viewpoint, this means that a selection can be done
based on a suitable criterion (e.g., minimum delay, maximum throughput, minimum
number of hops, etc.). The presence of multiple sinks in this case ensures better network
performance with respect to the single-sink case (assuming the same number of nodes is
deployed over the same area), but the communication protocols must be more complex and
should be designed according to suitable criteria. In the second case, when the sinks are not
connected, the presence of multiple sinks tends to partition the monitored field into smaller
areas; however from the communication protocols viewpoint no significant changes must be
included, apart from simple sink discovery mechanisms. Clearly, the most general and
interesting case (because of the better potential performance) is the first one, with the sinks
connected through any type of mesh network, or via direct links with a common gateway.
Both the single-sink and multiple-sink networks introduced above do not include the
presence of actuators, that is, devices able to manipulate the environment rather than
observe it. WSANs are composed of both sensing nodes and actuators (see Figure 3). Once
more, the inclusion of actuators does not represent a simple extension of a WSN from the
communication protocol viewpoint. In fact the information flow must be reversed in this
case: the protocols should be able to manage many-to-one communications when sensors
provide data, and one-to-many flows when the actuators need to be addressed, or even one-
to-one links if a specific actuator has to be reached.
Building Context Aware Network of Wireless Sensors Using
a Scalable Distributed Estimation Scheme for Real-time Data Manipulation 429
minimize the communication overhead to a high degree. In order to achieve higher level of
simplicity to increase effectiveness of algorithm deployment in terms of utilizing limited
available resources, a novel approach toward real-time distributed estimation is introduced,
using a simplified graph-based method called Distributed Hierarchical Graph Neuron
(DHGN). The proposed approach not only enjoys from conserving the limited power
resources of resource-constrained sensor nodes, but also can be scaled effectively to address
scalability issues which are of primary concern in wireless sensor networks. The proposed
scheme is not intending to replace existing complex methods which are treated in the
literature, but rather makes an attempt to reduce the computational expenses involved in
the processing of the gathered in-situ information from sensor nodes. Strength of DHGN lies
in the processing of non-uniform data patterns as it implements a finely distributable
framework at the smallest (atomic) logical sub-pattern level. The results are easily obtained
by summation at the overall pattern level. Hence, the algorithm is able to provide some sort
of divide and distribute filtering process throughout the network in a fine-grained manner
for minimizing the energy use. DHGN is also a highly scalable algorithm that allows real-
time in-network data manipulation; essential feature for real-time data processing in WSNs.
The outline for this chapter is as follows. Section 2 provides an overview of WSN technology
and its current research trends. Section 3 provides a discussion on the limitations of existing
approaches for data fusion and distributed estimation within WSNs. We will then introduce
our proposed distributed event detection and pattern classification scheme in Section 4.
Section 5 deals with performance metrics for our novel algorithm. Section 6 entails further
discussion on our proposed scheme and future direction of this research. Finally, section 7
concludes the chapter.
2. WSN Overview
A wireless sensor network (WSN) in its simplest form can be defined as (Chong & Kumar,
2003; Akyildiz, Su, Sankarasubramaniam & Cayirci, 2002; Culler, Estrin & Srivastava, 2004)
a network of (possibly low-size and low-complex) devices denoted as nodes that can sense
the environment and communicate the information gathered from the monitored field (e.g.,
an area or volume) through wireless links; the data is forwarded, possibly via multiple hops
relaying to a sink (sometimes denoted as controller or monitor ) that can use it locally or is
connected to other networks (e.g., the Internet) through a gateway. The nodes can be
stationary or moving. They can be aware of their location or not. They can be homogeneous
or not. A traditional single-sink WSN is illustrated in Figure 1. Almost all scientific papers in
the literature deal with such a definition. This single-sink scenario suffers from the lack of
scalability: by increasing the number of nodes the amount of data gathered by the sink
increases and once its capacity is reached the network size can not be augmented. Moreover,
for reasons related to medium access control (MAC) and routing aspects, network
performance cannot be considered independent from the network size. A more general
scenario includes multiple sinks in the network (see Figure 2). Given a level of node density,
a larger number of sinks will decrease the probability of isolated clusters of nodes that
cannot deliver their data owing to unfortunate signal propagation conditions.
Fig. 1. Traditional single-sink WSN
In principle, a multiple-sink WSN can be scalable (i.e., the same performance can be
achieved even by increasing the number of nodes), while this is clearly not true for a single-
sink network. However, a multi-sink WSN does not represent a trivial extension of a single-
sink case for the network engineer. There might be mainly two different cases: (1) all sinks
are connected through a separate network (either wired or wireless), or (2) the sinks are
disconnected. In the former case, a node needs to forward the data collected to any element
in the set of sinks. From the protocol viewpoint, this means that a selection can be done
based on a suitable criterion (e.g., minimum delay, maximum throughput, minimum
number of hops, etc.). The presence of multiple sinks in this case ensures better network
performance with respect to the single-sink case (assuming the same number of nodes is
deployed over the same area), but the communication protocols must be more complex and
should be designed according to suitable criteria. In the second case, when the sinks are not
connected, the presence of multiple sinks tends to partition the monitored field into smaller
areas; however from the communication protocols viewpoint no significant changes must be
included, apart from simple sink discovery mechanisms. Clearly, the most general and
interesting case (because of the better potential performance) is the first one, with the sinks
connected through any type of mesh network, or via direct links with a common gateway.
Both the single-sink and multiple-sink networks introduced above do not include the
presence of actuators, that is, devices able to manipulate the environment rather than
observe it. WSANs are composed of both sensing nodes and actuators (see Figure 3). Once
more, the inclusion of actuators does not represent a simple extension of a WSN from the
communication protocol viewpoint. In fact the information flow must be reversed in this
case: the protocols should be able to manage many-to-one communications when sensors
provide data, and one-to-many flows when the actuators need to be addressed, or even one-
to-one links if a specific actuator has to be reached.
Wireless Sensor Networks: Application-Centric Design430
Fig. 2. Multi-sink WSN
The complexity of the protocols in this case is even larger. Given the very large number of
nodes that can constitute a WSAN (more than hundreds sometimes), it is clear that MAC
and the network layer are very relevant parts of the protocol stack. Tens of proposals
specifically designed for WSANs have been made in the past few years. The communication
protocols of a WSAN should also allow an easy deployment of nodes; the network must be
able to self-organize and self-heal when some local failures are encountered.
Fig. 3. Typical WSAN
2.1 Current and future research on WSANs
Many technical topics of WSANs are still considered by research as the current solutions are
known to be non-optimized, or too much constrained. From the physical layer viewpoint,
standardization is a key issue for success of WSAN markets. Currently the basic options for
building HW/SW platforms for WSANs are Bluetooth, IEEE 802.15.4 and 802.15.4a. At least,
most commercially available platforms use these three standards for the air interface. For
low data rate applications (250 Kbits on the air), IEEE 802.15.4 seems to be the most flexible
technology currently available. Clearly, the need to have low-complexity and low-cost
devices does not push research in the direction of advanced transmission techniques. MAC
and network layer have attracted a lot of attention in the past years and still deserve
investigation. In particular, combined approaches that jointly consider MAC and routing
seem to be very successful.
Topology creation, control and maintenance are very hot topics. Especially with IEEE
802.15.4, which allows creation of several types of topologies (stars, mesh, trees, cluster-
trees), these issues play a very significant role. Transport protocols are needed for WSANs
depending on the specific type of application. However, some of the most relevant issues
investigated by research in WSANs are cross layer, dealing with vertical functionalities:
security, localization, time synchronization. Basically, the research in the field of WSANs
started very recently with respect to other areas of the wireless communication society, as
broadcasting or cellular networks. The first IEEE papers on WSANs were published after the
turn of the Millennium. The first European projects on WSANs were financed after year
2001. In the US the research on WSANs was boosted a few years before. Many theoretical
issues still need a lot of investments.
The e-Mobility technology platform gathers all major players in the area of wireless and
mobile communications. A strategic research agenda was released and updated in 2006.
According to their views, by the year 2020 mobile and wireless communications will play a
central role in all aspects of European citizen’s lives, not just telephony, and will be a major
influence on Europe’s economy, wirelessly enabling every conceivable business endeavour
and personal lifestyle. The aim of research in the field can be summarized as follows: The
improvement of the individual’s quality of life, achieved through the availability of an
environment for instant provision and access to meaningful, multi-sensory information and
content.
“Environment” means that the users will strongly interact with the environment that
surrounds them, for example by using devices for personal use, or by having the location as
a basis for many of the services to be used. This implies a totally different structure for the
networks. Also, the context recognized by the system and it acting dynamically on the
information is a major enabler for intelligent applications and services. This also means that
sensor networks and radio frequency identifications (RFIDs) are increasingly important.
“Multi-sensory” is related to all the users, devices, and also to the fact that the environment
will be capable of sensing the users presence. Also, virtual presence may be considered,
implying more sensory information being communicated, and an ideal of a rich
communication close to the quality achieved in interpersonal communications or direct
communications with another environment; this could also include non-invasive and
context-aware communication characterizing polite human interactions. Therefore, this
stretches mobile and wireless communications beyond radio and computer science into new
areas of science, like biology, medicine, psychology, sociology, and nano-technologies, and
Building Context Aware Network of Wireless Sensors Using
a Scalable Distributed Estimation Scheme for Real-time Data Manipulation 431
Fig. 2. Multi-sink WSN
The complexity of the protocols in this case is even larger. Given the very large number of
nodes that can constitute a WSAN (more than hundreds sometimes), it is clear that MAC
and the network layer are very relevant parts of the protocol stack. Tens of proposals
specifically designed for WSANs have been made in the past few years. The communication
protocols of a WSAN should also allow an easy deployment of nodes; the network must be
able to self-organize and self-heal when some local failures are encountered.
Fig. 3. Typical WSAN
2.1 Current and future research on WSANs
Many technical topics of WSANs are still considered by research as the current solutions are
known to be non-optimized, or too much constrained. From the physical layer viewpoint,
standardization is a key issue for success of WSAN markets. Currently the basic options for
building HW/SW platforms for WSANs are Bluetooth, IEEE 802.15.4 and 802.15.4a. At least,
most commercially available platforms use these three standards for the air interface. For
low data rate applications (250 Kbits on the air), IEEE 802.15.4 seems to be the most flexible
technology currently available. Clearly, the need to have low-complexity and low-cost
devices does not push research in the direction of advanced transmission techniques. MAC
and network layer have attracted a lot of attention in the past years and still deserve
investigation. In particular, combined approaches that jointly consider MAC and routing
seem to be very successful.
Topology creation, control and maintenance are very hot topics. Especially with IEEE
802.15.4, which allows creation of several types of topologies (stars, mesh, trees, cluster-
trees), these issues play a very significant role. Transport protocols are needed for WSANs
depending on the specific type of application. However, some of the most relevant issues
investigated by research in WSANs are cross layer, dealing with vertical functionalities:
security, localization, time synchronization. Basically, the research in the field of WSANs
started very recently with respect to other areas of the wireless communication society, as
broadcasting or cellular networks. The first IEEE papers on WSANs were published after the
turn of the Millennium. The first European projects on WSANs were financed after year
2001. In the US the research on WSANs was boosted a few years before. Many theoretical
issues still need a lot of investments.
The e-Mobility technology platform gathers all major players in the area of wireless and
mobile communications. A strategic research agenda was released and updated in 2006.
According to their views, by the year 2020 mobile and wireless communications will play a
central role in all aspects of European citizen’s lives, not just telephony, and will be a major
influence on Europe’s economy, wirelessly enabling every conceivable business endeavour
and personal lifestyle. The aim of research in the field can be summarized as follows: The
improvement of the individual’s quality of life, achieved through the availability of an
environment for instant provision and access to meaningful, multi-sensory information and
content.
“Environment” means that the users will strongly interact with the environment that
surrounds them, for example by using devices for personal use, or by having the location as
a basis for many of the services to be used. This implies a totally different structure for the
networks. Also, the context recognized by the system and it acting dynamically on the
information is a major enabler for intelligent applications and services. This also means that
sensor networks and radio frequency identifications (RFIDs) are increasingly important.
“Multi-sensory” is related to all the users, devices, and also to the fact that the environment
will be capable of sensing the users presence. Also, virtual presence may be considered,
implying more sensory information being communicated, and an ideal of a rich
communication close to the quality achieved in interpersonal communications or direct
communications with another environment; this could also include non-invasive and
context-aware communication characterizing polite human interactions. Therefore, this
stretches mobile and wireless communications beyond radio and computer science into new
areas of science, like biology, medicine, psychology, sociology, and nano-technologies, and
Wireless Sensor Networks: Application-Centric Design432
also requires full cooperation with other industries not traditionally associated with
communications.
Finally, the information should be multi-sensory and multi-modal, making use of all human
basic senses to properly capture context, mood, state of mind, and, for example, one’s state
of health. Clearly, the realization of this vision of mobile and wireless communications
demands multi-disciplinary research and development, crossing the boundaries of the
above sciences and different industries. Also, the number of electronic sensors and RFIDs
surrounding us is quickly increasing. This will increase the amount of data traffic. The
future system will be complex, consisting of a multitude of service and network types
ranging across wireless sensor networks, personal area, local area, home networks, moving
networks to wide area networks. Therefore, the e-Mobility vision emphasizes the key role
played by WSANs as elements of a more complex system linking different types of access
technologies.
ARTEMIS (advanced research & technology for embedded intelligence and systems) is the
technology platform for embedded systems. The term ‘embedded systems’ describes
electronic products, equipment or more complex systems, where the embedded computing
devices are not visible from the outside and are generally inaccessible by the user. The
sensor and actuator nodes of WSANs are embedded systems. According to the ARTEMIS
strategic research agenda, intelligent functions embedded in components and devices will
be a key factor in revolutionizing industrial production processes, from design to
manufacturing and distribution, particularly in the traditional sectors. These technologies
add intelligence to the control processes in manufacturing shop floors and improve the
logistic and distribution chains, resulting in an increasing productivity in a wide range of
industrial processes. The grand challenge in the area of sensors and actuators relates to the
support of huge amounts of input and output data envisaged in the application contexts
with minimal power requirements and fail-safe operation.
3. Data Fusion Techniques for WSANs
To fully exploit the potential of sensor networks, it is essential to develop energy-efficient
and bandwidth-efficient signal processing algorithms that can also be implemented in a
fully distributed manner. Distributed signal processing in a WSN has a communication
aspect not present in the traditional centralized signal processing framework, thus it differs
in several important aspects.
Sensor measurements are collected in a distributed fashion across the network.
This necessitates data sharing via inter-sensors communication. Given a low
energy budget per sensor, it is unrealistic for sensors to communicate all their full-
precision data samples with one another. Thus, local data compression becomes a
part of the distributed signal processing design. In contrast, in a traditional signal
processing framework where data is centrally collected, there is no need for
distributed data compression.
The design of optimal distributed signal processing algorithms depends on the
models used to describe: the nodes connectivity, the nodes distribution, the
knowledge of sensor noise distributions, the qualities of inter-sensors
communication channels, and the underlying application metrics. Distributed
signal processing over a wireless sensor network requires proper coordination and
planning of sensor computation as well as careful exploitation of the limited
communication capability per sensor. In other words, distributed signal processing
in sensor networks has communication aspects which are not present in the most of
traditional signal processing frameworks.
In a WSN, sensors may enter or leave the network dynamically, resulting in
unpredictable changes in network size and topology. This can be due to failure
between inter-sensors communication (propagation conditions, interference or
non-available communication channels), duty cycling, drained batteries or nodes
damages. This dynamism requires the necessity for distributed signal processing
algorithms to be robust to the changes in network topology or size. These
algorithms and protocols must also be robust to poor time synchronization across
the network and to inaccurate knowledge of sensor locations.
There are many theoretical challenges such as establishing models, metrics, bounds, and
algorithms for distributed multimodal sensor fusion, distributed management of sensor
networks including auto-configuration, energy-efficient application-specific protocol
designs, formal techniques for the study of architectures and protocols, representation of
information requirements, and sensor network capabilities on a common mathematical
framework that would enable efficient information filtering (Luo et al., 2006). From these
aspects, it is clear that the design of sensor networks under energy, bandwidth, and
application-specific constraints spans all layers of the protocol stacks and it is very
important to have a common framework enabling all these points be taken into account
even if with different approximations degrees.
In this view an example of cross-layer methodology of WSN design for environmental
monitoring will be shown in the following with particular emphasis on the impact of
distributed digital signal processing (DDSP) on the spatial process estimation error on one
side and network lifetime on the other side. Depending on the process under monitoring
and the goal of the WSAN, such as detection of distributed binary events and spatial process
estimation, several techniques can be pursued with envisaging of centralized and
distributed processing.
3.1 Distributed Estimation
Distributed estimation and tracking is one of the most fundamental collaborative
information processing problems in wireless sensor networks (WSN). Multi-sensor fusion
and tracking problems have a long history in signal processing, control theory, and robotics.
Moreover, estimation issues in wireless networks with packet-loss have been the center of
much attention lately. In most applications, the intelligent fusion of information from
geographically-dispersed sensor nodes, commonly known as distributed data fusion, is an
important issue. A related problem is the binary decentralized (or distributed) detection
problem, where a large number of identical sensor nodes deployed randomly over a wide
region, together with a global detector or fusion centre (FC), cooperatively undertake the
task of identifying the presence or absence of a phenomenon of interest (PoI) (see Figure 4).
Specifi cally, each node takes a local decision about the presence or absence of the PoI and
sends its decision to the FC which is responsible for the final decision based on the
information gathered from local sensors.
Building Context Aware Network of Wireless Sensors Using
a Scalable Distributed Estimation Scheme for Real-time Data Manipulation 433
also requires full cooperation with other industries not traditionally associated with
communications.
Finally, the information should be multi-sensory and multi-modal, making use of all human
basic senses to properly capture context, mood, state of mind, and, for example, one’s state
of health. Clearly, the realization of this vision of mobile and wireless communications
demands multi-disciplinary research and development, crossing the boundaries of the
above sciences and different industries. Also, the number of electronic sensors and RFIDs
surrounding us is quickly increasing. This will increase the amount of data traffic. The
future system will be complex, consisting of a multitude of service and network types
ranging across wireless sensor networks, personal area, local area, home networks, moving
networks to wide area networks. Therefore, the e-Mobility vision emphasizes the key role
played by WSANs as elements of a more complex system linking different types of access
technologies.
ARTEMIS (advanced research & technology for embedded intelligence and systems) is the
technology platform for embedded systems. The term ‘embedded systems’ describes
electronic products, equipment or more complex systems, where the embedded computing
devices are not visible from the outside and are generally inaccessible by the user. The
sensor and actuator nodes of WSANs are embedded systems. According to the ARTEMIS
strategic research agenda, intelligent functions embedded in components and devices will
be a key factor in revolutionizing industrial production processes, from design to
manufacturing and distribution, particularly in the traditional sectors. These technologies
add intelligence to the control processes in manufacturing shop floors and improve the
logistic and distribution chains, resulting in an increasing productivity in a wide range of
industrial processes. The grand challenge in the area of sensors and actuators relates to the
support of huge amounts of input and output data envisaged in the application contexts
with minimal power requirements and fail-safe operation.
3. Data Fusion Techniques for WSANs
To fully exploit the potential of sensor networks, it is essential to develop energy-efficient
and bandwidth-efficient signal processing algorithms that can also be implemented in a
fully distributed manner. Distributed signal processing in a WSN has a communication
aspect not present in the traditional centralized signal processing framework, thus it differs
in several important aspects.
Sensor measurements are collected in a distributed fashion across the network.
This necessitates data sharing via inter-sensors communication. Given a low
energy budget per sensor, it is unrealistic for sensors to communicate all their full-
precision data samples with one another. Thus, local data compression becomes a
part of the distributed signal processing design. In contrast, in a traditional signal
processing framework where data is centrally collected, there is no need for
distributed data compression.
The design of optimal distributed signal processing algorithms depends on the
models used to describe: the nodes connectivity, the nodes distribution, the
knowledge of sensor noise distributions, the qualities of inter-sensors
communication channels, and the underlying application metrics. Distributed
signal processing over a wireless sensor network requires proper coordination and
planning of sensor computation as well as careful exploitation of the limited
communication capability per sensor. In other words, distributed signal processing
in sensor networks has communication aspects which are not present in the most of
traditional signal processing frameworks.
In a WSN, sensors may enter or leave the network dynamically, resulting in
unpredictable changes in network size and topology. This can be due to failure
between inter-sensors communication (propagation conditions, interference or
non-available communication channels), duty cycling, drained batteries or nodes
damages. This dynamism requires the necessity for distributed signal processing
algorithms to be robust to the changes in network topology or size. These
algorithms and protocols must also be robust to poor time synchronization across
the network and to inaccurate knowledge of sensor locations.
There are many theoretical challenges such as establishing models, metrics, bounds, and
algorithms for distributed multimodal sensor fusion, distributed management of sensor
networks including auto-configuration, energy-efficient application-specific protocol
designs, formal techniques for the study of architectures and protocols, representation of
information requirements, and sensor network capabilities on a common mathematical
framework that would enable efficient information filtering (Luo et al., 2006). From these
aspects, it is clear that the design of sensor networks under energy, bandwidth, and
application-specific constraints spans all layers of the protocol stacks and it is very
important to have a common framework enabling all these points be taken into account
even if with different approximations degrees.
In this view an example of cross-layer methodology of WSN design for environmental
monitoring will be shown in the following with particular emphasis on the impact of
distributed digital signal processing (DDSP) on the spatial process estimation error on one
side and network lifetime on the other side. Depending on the process under monitoring
and the goal of the WSAN, such as detection of distributed binary events and spatial process
estimation, several techniques can be pursued with envisaging of centralized and
distributed processing.
3.1 Distributed Estimation
Distributed estimation and tracking is one of the most fundamental collaborative
information processing problems in wireless sensor networks (WSN). Multi-sensor fusion
and tracking problems have a long history in signal processing, control theory, and robotics.
Moreover, estimation issues in wireless networks with packet-loss have been the center of
much attention lately. In most applications, the intelligent fusion of information from
geographically-dispersed sensor nodes, commonly known as distributed data fusion, is an
important issue. A related problem is the binary decentralized (or distributed) detection
problem, where a large number of identical sensor nodes deployed randomly over a wide
region, together with a global detector or fusion centre (FC), cooperatively undertake the
task of identifying the presence or absence of a phenomenon of interest (PoI) (see Figure 4).
Specifi cally, each node takes a local decision about the presence or absence of the PoI and
sends its decision to the FC which is responsible for the final decision based on the
information gathered from local sensors.