Woven Fabric Engineering Part 2 doc
Bạn đang xem bản rút gọn của tài liệu. Xem và tải ngay bản đầy đủ của tài liệu tại đây (1.27 MB, 30 trang )
Anisotropy in Woven Fabric Stress and Elongation at Break
17
0.5; it depends on fibers length (staple), friction coefficients, yarn twist etc. (b) In fabric at
break in principal directions, C
fup
is similar or slightly higher; it depends on fabric packing
density and on other parameters. (c) In fabric at break in diagonal directions, C
fud
is maximal
due to jamming. Extremely it can be near to 1. From these reasons, final parameters C
fu1,2
as
a function of β
0
, will be predicted as parabolic relation (without derivation):
()
()
2
0
fu1,2 0 fud fup fup
4
CCC C
π
β
α
⎛⎞
=−⋅ +
⎜⎟
⎜⎟
⎝⎠
(34)
Fabric strip strength from broken yarns with implementation of jamming, F
j1,2b
, is from (33)
and (34):
2
j
1,2b fu1,2 a1,2b fu1,2 1,2 0 1,20
y
1,2b
cosFCFCSb F
β
=⋅=⋅⋅⋅ ⋅ (35)
Correction for cut yarn ends
With the exception of β
0
= 0 and β
0
= 90 º there are yarns, bearing fabric load, having one or
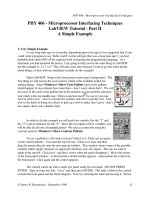
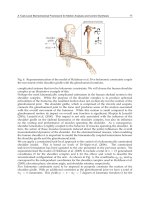
two free ends (Kovar & Dolatabadi, 2007). Near cut yarn end axial stress is zero and
gradually increases (linear increase is assumed) due to friction till it reaches yarn strength in
length l, see Fig. 14 a. In this area fabric jamming is not as important as in sample inner parts
and shear angle is smaller. This length l is hardly predictable and depends on many
parameters (setts, yarn properties including frictional, fabric finishing, shear deformation,
angle of load, jamming etc.). It can be evaluated experimentally by testing yarn pullout force
from the fabric (Pan & Yoon, 1993) or testing the samples of variable widths. By this effect,
some width on each side of fabric
in 1,20
sinbl
β
=
⋅ is inefficient; this is important mainly for
broken yarns. This strip b
in
can bear only about 50 % of full load. It results in reduction of
original sample width to effective one
ef b0 1,20
sinbbl
β
=
−⋅ .
Fig. 14. Free ends of yarns in fabric at bias load.
Woven Fabric Engineering
18
Total effective force from broken yarns with reduced fabric width, F
f1,2b
, is then from (35)
(
)
2 2
f1,2b fu1,2 1,2 ef 1,20 y1,2b fu1,2 1,2 b0 1,20 1,20
y
1,2b
cos sin cosFCSb FCSbl F
βββ
=⋅⋅⋅ ⋅=⋅⋅−⋅ ⋅ ⋅
(36)
Correction for critical angles
In our theory, unlimited sample length is assumed and the effect of critical angles is
neglected. Nevertheless for comparison with real experiments it should be mentioned;
tension concentration at jaws reaches high value for critical angles, at which only 1 yarn is
kept simultaneously by both pair of jaws and all others yarns have 1 end free. For critical
angle β
c0
it will be:
c0
tan 50 : 200
β
= , see Fig. 14 b (sample width is 50 mm, test length 200
mm). Near this angle an important drop in tested fabric strength is observed.
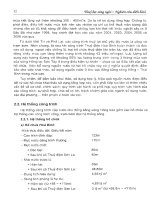
Example of results for plain weave fabric, warp and weft yarns are polypropylene/cotton
35/65 %, linear density T = 29.5 tex, warp sett S
1
= 2360 ends/m, weft sett S
2
= 1920 (lines 1
and 3) and S
2
= 1380 ends/m (lines 2 and 4) is shown in Fig. 15. Lines 3, 4 describes standard
experiment (EN ISO 13934-1), lines 1, 2 results of the new method (Kovar & Dolatabadi, 2010)
with the same size of samples. Drop in the sample strength near critical angles is evident.
Fig. 15. Influence of critical angles on fabric breaking stress.
Note: linear connection of measured points only assembles these points together; in any case
it is does not mean approximation of the results.
Force from unbroken yarns at fabric break
These yarns are, for fabric strength, important only near critical angle β
0c
(near 45 º). At other
load angles, tensile stress in these yarns is low or negative. We shall assume, that maximum
force corresponds with maximum length L
1,2b
(β
0
), Fig. 12, and that it can be calculated using
formula (33) on condition of similar tensile properties of warp and weft yarns.
Vertical projection of unbroken yarn length at fabric break, h
u1,2
, depends on this parameter
before load (h
1,20
) and on sample elongation at break (elongation of sample is proportional),
identified by broken yarns of the opposite system:
(
)
u1,2 1,20 2,1b
1hh
ε
=⋅+ . Length of unbroken
yarns in fabric width before load is
0
1,20
1,20
sin
b
L
β
= , corresponding length of unbroken yarns
at fabric break (Fig. 12), L
u1,2
, is using (29),
22
u1,2 b 1,2b
Lbh=+ .
Anisotropy in Woven Fabric Stress and Elongation at Break
19
Relative elongation of unbroken yarns is then
(
)
u1,2 1,20
u1,2
1,20
LL
L
ε
−
= (37)
and hence force, by which unbroken yarns contribute to sample strength, will be:
u1,2
u1,2b a1,2d
u1,20
L
FF
L
=⋅
(38)
where Fa1,2d is breaking load, calculated in accordance with (33) for β0 = 45 º.
Final results
Force F
12,b
is the sum of the forces from broken and unbroken yarns, equations (36) and (38):
1,2b f1,2b u1,2b
FF F
=
+ (39)
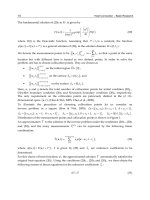
In Fig. 16 is an example of results, carried on the same fabric and with the same
experimental methods as shown in Fig. 13. Agreement is not excellent; it is caused by
simplifications in calculation and as well by imperfection of known experimental methods.
Results of patented method (experiment 2,
Kovar & Dolatabadi, 2010) shows, with exception
of principal directions, higher breaking stress than does standard method (experiment 1, EN
ISO 13934-1). Important drop is observed near previously mentioned critical angles β
0
14
and 76 º. Slower decrease of breaking stress near angle β
0
= 45 º is due to interactions
between warp and weft yarns that were not implemented into calculation yet.
Fig. 16. Example of calculated and measured fabric stress at break.
4. Measuring of rupture properties
Experiments always mean some scale of unification and simplification in comparison with
fabric real loading at the use. To simulate real practical situations is not possible – it would
result in too many different experimental methods. In general, the load put on textile fabric,
can be (a) tensile uniaxial, (b) tensile biaxial or (c) complex as combination of different form
Woven Fabric Engineering
20
of the load (elongation, bend, shear etc.). Nevertheless uniaxial and biaxial stresses are the
most important forms of load for investigation of textile fabrics rupture properties. Other
forms of deformation (bending, shear, lateral pressure etc.) seldom result in fabric break.
4.1 Uniaxial stress
The problems, connected with breaking test of woven fabrics due to great lateral contraction
that accompanies load in diagonal directions, have already been described in section 2 (Fig.
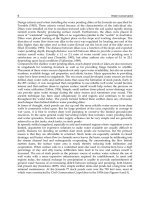
1). The principle of a new method (Kovar & Dolatabadi, 2010) is sample tension reduction
by fabric capstan friction, Fig. 17 (scheme and photographs at three stages of sample
elongation). A set of fast cylinders 5, 6 is connected with each pair of dynamometer jaws 1,
2. At sample elongation fabric slips towards central fabric part 4 in directions 8, what results
in tension reduction due to capstan friction; however, fabric lateral contraction on cylinders
is enabled. Total angle of contact is on each sample side is approximately 8.03 π (460 º) and
for friction coefficient f = 0.17 (this is low value of f, valid for fabric to smooth steel surface
friction at high load near break of the sample) decrease of sample tension will be
c
j
3.9
f
F
e
F
α
⋅
= (390 %). In Fig. 17 right is example of tested sample before elongation (a), at
elongation of 40 % (b) and 90 % near the break point (c).
Fig. 17. Patented method for fabric tensile properties measuring
Anisotropy in Woven Fabric Stress and Elongation at Break
21
4.2 Biaxial stress
Measuring of fabric tensile properties at biaxial stress is more complicated task, described
for example in (Bassett, Postle & Pan, 1999). If fast jaws 1 are used, Fig. 18 a, fabric would
soon break at sample corners as relative elongation of L
2
is many times greater than that of
sample length and width L
1
. MA is measured area of the sample. Two of solutions are
shown. In Fig. b are fast jaws replaced with sets of individual narrow free grippers and in
Fig. c is measured sample MA connected with four auxiliary fabrics cut into strips that
enable 2-D sample elongation, although jaws 1 are fast. Two mentioned methods are
suitable for measuring fabric anisotropy, nevertheless they need special equipment and
much of labor. It is not easy to investigate rupture properties by these methods. As the load
in two directions can be different, it would be useful to reduce number of tested samples by
election of only some variants such as: (a) uniaxial load (but different than at standard
methods, lateral contraction is now enabled), (b) restriction of lateral contraction similarly
with chapter 2.2, (c) the same load (absolutely or recounted per one yarn in the sample
width) or tension in two directions, (d) the same elongation in two directions.
Fig. 18. Principles of tensile properties measuring at biaxial load
The principle of measuring tensile properties when fabric lateral contraction is restricted
(simulation of sample infinite width, section 2.1) is shown in Fig. 19. The sample 1 is sewn
by several individual stitches into tubular form and by wires 3, placed beside jaws 2, is kept
in original width.
5. Discussion, current trends and future challenges in investigated problems
The problems of anisotropy of woven fabric rupture properties are very complex and till
now not in the gravity centre of researches. This section could make only a short step in
bringing new knowledge on this field. Partly another approach to similar problem solution
is used in (Dolatabadi et al., 2009; Dolatabadi & Kovar, 2009). Anisotropy of different fabric
properties is often investigated for textile based composites, where rupture properties are
very important, for example in (Hofstee & van Keulen, 2000).
There are lots of possibilities how to go on in research on this topic, for example:
a.
Investigation of influence of sample width on tensile properties with the goal to specify
better impact of cut yarn ends (Fig. 14).
b.
Research on biaxial and combined fabric load, the aim could be, for example, better
description of fabric behaviour at practical usage.
Woven Fabric Engineering
22
Fig. 19. Measuring of tensile properties at restricted lateral contraction (scheme, sample)
c.
Development of suitable experimental methods and its standardization; till now there is
no standard method for measuring rupture properties of fabrics with great lateral
contraction.
d.
Implementation of other variable parameters into calculation, such as variability in
yarns properties, unevenness of fabric structure etc.
e.
Research of another weaves (twill, sateen…), influence of structure on utilization of
strength of used fibres.
f.
Developing of suitable methods for simulation of fabric tension distribution at
particular load with the stress to be put on a great and variable Poison’s ratio of fabrics
etc.
There are other important anisotropic forms of fabric deformation, which are not described
in this chapter, such as bend (Cassidy & Lomov, 1998) and shear. Lateral contraction is as
well very important.
6. Acknowledgement
This work was supported by the research project No. 106/09/1916 of GACR (Grant Agency
of Czech Republic).
7. References
Bassett, R. J.; Postle, R. & Pan, N. (1999). Grip Point Spacing Along the Edges of an
Anisotropic Fabric Sheet in a Biaxial Tensile Test. Polymer composites, Vol. 20, No. 2
Cassidy, C. & Lomov, S. V. (1998). Anisotropy of fabrics and fusible interlinings.
International Journal of Clothing Science and Technology, Vol. 10 No. 5, pp. 379-390
Anisotropy in Woven Fabric Stress and Elongation at Break
23
Dai, X.; Li, Y. & Zhang, X. (2003). Simulating Anisotropic Woven Fabric Deformation with a
New Particle Model, Textile Res. J. 73 (12), 1091-1099
Dolatabadi, K. M.; Kovar, R. & Linka, A. (2009). Geometry of plain weave fabric under shear
deformation. Part I: measurement of exterior positions of yarns. J. Text. Inst., 100
(4), 368-380
Dolatabadi, K. M. & Kovar, R. (2009). Geometry of plain weave fabric under shear
deformation. Part II: 3D model of plain weave fabric before deformation and III: 3D
model of plain weave fabric under shear deformation. J. Text. Inst., 100 (5), 381-300
Du, Z., & Yu, W. (2008). Analysis of shearing properties of woven fabrics based on bias
extension, J. Text. Inst., 99, 385-392
Hearle, J. W. S.; Grosberg, P. & Backer, S. (1969). Structural Mechanics of Fibres, Yarns and
Fabrics. Vol. 1. New York, Sydney, Toronto
Hofstee, J. &van Keulen, F. (2000). Elastic stiffness analysis of a thermo-formed plain-weave
fabric composite. Part II: analytical models. Composites Science and Technology, 60,
1249-1261
Hu, J. (2004). Structure and mechanics of woven fabrics. Woodhead Publishing Ltd. P 102, ISBN
0-8493-2826-8
Kilby, W. F. (1963). Planar stress-strain relationships in woven fabrics. J. Text. Inst., 54, T 9-27
King, M. J.; Jearanaisilawong, P. & Socrate, S. (2005). A continuum constitutive model for the
mechanical behavior of woven fabrics. International Journal of Solids and Structures
42, 3867–3896
Kovar, R. & Gupta, B. S. (2009). Study of the Anisotropic Nature of the Rupture Properties of
a Woven Fabric. Textile Research Journal Vol 79(6), pp. 506-506
Kovar, R. & Dolatabadi, M. K. (2010). The way of measuring of textile fabric deformation
and relevant equipment. Czech patent No. 301 314
Kovar, R. & Dolatabadi, M. K. (2008). Crimp of Woven Fabric Measuring. Conference
Strutex 2008, TU of Liberec 2008, ISBN 978-80-7372-418-4
Kovar, R. & Dolatabadi, M. K. (2007). Impact of yarn cut ends on narrow woven fabric
samples strength. Strutex, TU Liberec, ISBN 978-80-7372-271-5
Kovar, R. (2003). Structure and properties of flat textiles (in Czech). TU of Liberec, ISBN 80-
7083-676-8, Liberec, CZ, 142 pages
Lo, M. W. & Hu, J. L. (2002). Shear Properties of Woven Fabrics in Various Directions, Textile
Res. J. 72 (5), 383-390
Lomov, S. V. et all, (2007) Model of internal geometry of textile fabrics: Data structure and
virtual reality implementation. J. Text. Inst., Vol. 98, No. 1 pp. 1–13
Pan, N. & Yoon, M. Y. (1996). Structural Anisotropy, Failure Criterion, and Shear Strength of
Woven Fabrics. Textile Res. J. 66 (4), 238-244
Pan, N. & Yoon, M. Y. (1993). Behavior of Yarn Pullout from Woven Fabrics: Theoretical and
Experimental. Textile Res. J. 63 (1), 629-637
Pan, N. (1996 b). Analysis of Woven Fabric Strength: Prediction of Fabric Strength Under
Uniaxial and Biaxial Extension, Composites Scence and Technology 56 311-327
Peng, X. Q. and Cao, J. (2004). A continuum mechanics-based non-orthogonal constitutive
model for woven composite fabrics.
Composites: Part A 36 (2005) 859–874
Woven Fabric Engineering
24
Postle, R.; Carnaby, G. A. & de Jong, S. (1988). The Mechanics of Wool Structures. Ellis
Horwood Limited Publishers, Chichester. ISBN 0-7458-0322-9
Sun, H. & Pan, N. (2005 a). Shear deformation analysis for woven fabrics. Composite
Structures 67, 317–322
Sun, H. & Pan, N. (2005 b). On the Poisson’s ratios of a woven fabric. University of
California Postprints, Paper 662
Zborilova, J. & Kovar, R. (2004). Uniaxial Woven Fabric Deformation. Conference STRUTEX,
TU of Liberec, pp. 89-92, ISBN 80-7083-891-4
Zheng, J. et all (2008). Measuring technology of the Anisotropy Tensile Properties of Woven
Fabrics. Textile Res. J., 78, (12), pp. 1116-1123
Zouari, R., Amar, S. B. & Dogui, A. (2008). Experimental and numerical analyses of fabric
off-axes tensile test. JOTI, Vol. 99, iFirst 2008, 1–11
European standard EN ISO 13934-1. Determination of maximum force and elongation at
maximum force using the strip method
CSN standard 80 0810 Zistovanie trznej sily a taznosti pletenin (Recognition of breaking
stress and strain of knitted fabrics)
2
Mechanical Properties of Fabrics from
Cotton and Biodegradable Yarns Bamboo,
SPF, PLA in Weft
Živa Zupin and Krste Dimitrovski
University of Ljubljana, Faculty of Natural Sciences and Engineering,
Department of Textiles
Slovenia
1. Introduction
Life standard is nowadays getting higher. The demands of people in all areas are increasing,
as well as the requirements regarding new textile materials with new or improved
properties which are important for the required higher comfort or industrial use. The
environmental requirements when developing new fibres are nowadays higher than before
and the classical petroleum-based synthetic fibres do not meet the criteria, since they are
ecologically unfriendly. Even petroleum as the primary resource material is not in
abundance. The classical artificial fibres, e.g. polypropylene, polyacrylic, polyester etc, are
hazardous to the environment. The main problems with synthetic polymers are that they are
non-degradable and non-renewable. Since their invention, the use of these synthetic fibres
has increased oil consumption significantly, and continues even today. It is evidenced that
polyester is nowadays most frequently used among all fibres, taking over from cotton. Oil
and petroleum are non-renewable (non-sustainable) resources and at the current rate of
consumption, these fossil fuels are only expected to last for another 50–60 years; the current
petroleum consumption rate is estimated to be 100,000 times the natural generation rate
(Blackburn, 2005).
Environmental trends are more inclined to the development of biodegradable fibres, which
are environment-friendly. A material is defined as biodegradable if it can be broken into
simpler substances (elements and compounds) by naturally occurring decomposers –
essentially, anything that can be ingested by an organism without harming the organism. It
is also necessary that it is non-toxic and decomposable in a relatively shot period on a
human time scale (Blackburn, 2005). The biodegradability of fibres also depends on their
chemical structure, molecular weight and super-molecular structure.
Biodegradable polymers can be classified into three main groups, i.e.:
• natural polysaccharides and biopolymers (cellulose, alginates, wool, silk, chitin, soya
bean protein),
• synthetic polymers, esp. aliphatic polyesters (poly (lactic acid), poly (ε-caprolactone)), and
• polyesters produced by microorganisms (poly (hydroxyalkanoate)s) (Blackburn, 2005).
All known natural fibres are biodegradable; however, they have some disadvantages in the
growing up and production processes. At growing cotton and other vegetable fibres, large
amounts of pesticides are used which has a negative influence on the environment.
Woven Fabric Engineering
26
In the research, three biodegradable fibres, i.e. bamboo fibres, fibres form polylactic acid
(PLA) and soybean protein fibres (SPF) were used for which the industrial procedures
already exist. At the same time, there are enough natural resources for the latter and they
are environment-friendly. The physical-mechanical properties of fabrics with biodegradable
yarns in weft and cotton yarns in warp were researched. We would like to determine
whether and to what extent physical and mechanical properties change and whether they
are acceptable in terms of today’s criteria.
The researchers have been investigating and researching the production of biodegradable
fibres and their properties. This research focuses on the mechanical properties of yarns
made prom biodegradable fibres and first of all, on the mechanical properties of woven
fabrics made from biodegradable yarns in weft and cotton yarns in warp. The latter is the
most common way of producing woven fabrics, since the warp threads do not need to be
changed.
2. Properties of bamboo, PLA and SPF fibres
New trends are being sought for naturally renewable resources in order to protect the
nature. With the help of chemical processes, new biodegradable materials can be produced.
Such materials can successfully replace or improve the existing artificial or natural
materials. Many different sources can be used to produce biodegradable materials. Fibres
from naturally renewable resources are made chemically as fibres from polylactic acid (PLA
fibres) or as a secondary product of other technologies. Such products are soybean fibres,
which are made from soy proteins after the extraction of oil from soybean. New, natural
resources are also used for fibre-making purposes, e.g. bamboo tree for bamboo fibres.
These are by far not the only existing fibres from renewable resources; nevertheless, in our
research, these three types of yarns are used. All presented fibres have compatible
properties with classical natural fibres and some additional properties with a good influence
on the comfort of clothing to the human body.
2.1 Bamboo fibres
Bamboo is considered by many to be the ultimate green material (Netravali, 2005). Since it is
a fast growing plant, it can be harvested in as little as six weeks, although more typically in
three to five years. Bamboo reproduces through its extensive system of rhizomes. As such,
there is a continuous supply of bamboo, which meets the definition of a renewable resource.
And, of course, it is also a sustainable material, capable of sustaining itself with minimal
impact to the environment.
Bamboo can thrive naturally without using any pesticide. It is seldom eaten by pests or
infected by pathogen.
The bamboo fibre is a kind of regenerated cellulose fibre, which is produced from raw
materials of bamboo pulp refined from bamboo through the process of hydrolysis-alkalization
and multi-phase bleaching, then processed and pulp is turned into bamboo fibres.
The properties of bamboo fibre are:
• strong durability, stability and tenacity,
• thinness and whiteness degree similar to the classically bleached viscose,
• antibacterial and deodorizing in nature (even after being washed fifty times),
• incredibly hydroscopic (absorbing more water than other conventional fibres, e.g. cotton),
Mechanical Properties of Fabrics from Cotton and
Biodegradable Yarns Bamboo, SPF, PLA in Weft
27
• fabric garments make people feel extremely cool and comfortable in hot conditions,
• fabric is exceptionally soft and light, almost silky in feel, and
• fabric has a high level of breathability, for the cross-section of bamboo fibres is filled
with various micro-gaps and -holes (Das, 2010 ).
2.2 Polylactide fibres (PLA)
Polylactic acid is a natural, biodegradable organic substance, which is harboured in the
bodies of animals, plants and microbes. The polylactic acid as such cannot be found in the
nature but needs to be industrially prepared with the lactic acid polymerisation.
The lactic acid used for the synthesis of polylactic acid is derived from genetically altered
corn grains (Rijavec, Bukošek, 2009).
Unlike other synthetic fibre materials with vegetable resources (e.g. cellulose), PLA is well
suited for melt spinning into fibres. Compared to the solvent-spinning process required for
the synthetic cellulose fibres, melt spinning allows PLA fibres to be made with both lower
financial and environmental cost, and enables the production of fibres with a wider range of
properties (Dugan, 2000). The polymerisation occurs with the condensation of acid with
alcohol, forming polyester. The misguidance in this observation is to assume that since PLA
is polyester, it will behave in many ways similarly to PES or PA 6 fibres (Rekha et al., 2004).
The fundamental polymer chemistry of PLA allows control of certain fibre properties and
makes the fibre suitable for a wide range of technical textile applications and special apparel
(Farrington et al, 2005).
The properties of PLA fibre are:
• low moisture absorption,
• good natural regulation of the body temperature through moister absorption,
• low flammability,
• high resistance to UV and a low index of refraction, and
• excellent mechanical properties and module of elasticity (Lou et al., 2008).
2.3 Soybean fibres
Soy protein fibre (SPF) is the only plant protein fibre (Rijavec, Bukošek, 2009). It is a
liquefied soy protein that is extruded from soybean after the extraction of oil, and processed
mechanically to produce fibres by using new bioengineering technology. Fibres are
produced by wet spinning, stabilized by acetylating, and finally cut into short staples after
curling and thermoforming.
A soybean protein fibre has not only the superiorities of natural fibres but also the physical
properties of synthetic ones.
The properties of SPF fibres are:
• noble appearance and similar look as silk fibres, however, they are considerably
cheaper (Yi-you, 2004),
• very comfortable to wear, soft, smooth, with soft handle,
• fabric has the same moisture absorption as cotton fibres (Brooks, 2005),
• better moisture transmission than a cotton fabric, which makes it comfortable and
sanitary,
• higher tensile strength than wool, cotton, and silk, however, lower than polyester fibres,
• does not shrink when washed in boiling water,
• outstanding anti-crease, easy-wash and fast-dry properties,
Woven Fabric Engineering
28
• antibacterial properties, and
• high UV resistance.
In the table below, the physical and mechanical properties of fibres, e.g. length, fineness, dry
tenacity, wet tenacity, dry breaking extension and physical density are shown.
Properties Bamboo Cotton Viscose PLA PES PA SPF Silk Wool
Length (mm)
38–76 25–45 30–180
32–150 38–76
3.5⋅10
6
–
9⋅10
6
50–200
Fineness (dtex) 1.3–5.6 1.2–2.8 1.3–25 1.3–22 0.9–3 1–3.5 4–20
Dry tenacity
(cN/dtex)
2.33 1.9–3.1 1.5–3.0 3.2–5.5 3–7 3–6.8 3.8–4.0 2.4–5.1 1.1–1.4
Wet tenacity
(cN/dtex)
1.37 2.2–3.1 0.7–1.11
2.4–7 2.5–6.1 2.5–3.0 1.9–2.5 1.0
Dry breaking
extension (%)
23.8 7–10 8–24 20–35 20–50 26–40 18–21 10–25 20–40
Moisture regan (%) 13.3 8.5 12.5–13.5 0.4–0.6 0.4 4.5 8.6 11.0 14.5
Density (g/cm
3
)
0.8–1.32 1.5–1.54 1.46–1.54
1.25–
1.27
1.36–
1.41
1.15–
1.20
1.29–
1.31
1.34–
1.38
1.32
Table 1. Comparison of physical and mechanical properties of bamboo fibres, PLA, SPF,
cotton, viscose, wool and PES
3. Mechanical properties of woven fabrics
With mechanical properties, the phenomenon on textile material is described which is a
result of the material resistance on the activity of external forces causing the change of
shape. The response of the textile material depends on the material properties, the way of
load and its tension. With regard to the direction of the applied force, deformations at
stretch and compression are known. To the mechanical properties of fabrics uniaxial or
biaxial tensile properties, compression, shearing properties, bending rigidity, bursting and
tear resistance can be listed.
Numerous parameters influence the mechanical properties of woven fabrics. Firstly, there
are fibre properties, and their molecular properties and structure. The mechanical properties
of fibres depend on their molecular structure, where macromolecules can be arranged in
crystalline (unique arrangements of molecules) or amorphous (coincidental arrangements of
molecules) structure. The macromolecules are orientated mostly along the fibre axis and are
connected to each other with intermolecular bonds. When a force is applied, the
supramolecular structure starts changing (Geršak, 2006).
The fibre properties and the type of spinning influence the yarn properties, while the fabric
properties are also influenced by warp and weft density of the woven fabrics, and weave.
The mechanical properties are also influenced by the weaving conditions, e.g. speed of
weaving, warp insertion rate, weft beat-up force, the way of shed opening, warp
preparation for weaving, warp and weft tension, number of threads in reed dent etc.
The properties of raw fabrics consequently depend on the construction and technological
parameters. For the final use, raw fabrics have to be post-treated to add different functional
properties. In most cases, these post-treatments worsen some mechanical properties, while
again some other mechanical properties improve. In Figure 1, the procedure from fibres to
the end of woven-fabric production is presented.
Mechanical Properties of Fabrics from Cotton and
Biodegradable Yarns Bamboo, SPF, PLA in Weft
29
Molecular and fibre
structure
FIBRE PROPERTIES
YARN PROPERTIES
WEAVE
WARP AND WEFT
DENSITY
RAW FABRICS
PROPERTIES
FINAL FABRICS
PROPERTIES
spinning
proces
weaving
process
post
treatment
Fig. 1. Interrelation of fibre, yarn and fabric structure and properties
A lot of researches have been investigating the mechanical and tensile properties of fabrics.
The approaches to the problem have included geometric, mechanical, energy and statistical
models (Realff et al, 1997). The first geometric model of fabrics was presented by Pierce
(Pierce, 1937), who presumed that yarn has an ideal circular cross section, which is rigid and
inextensible. His work was continued by Womersley (Womersley, 1937), who presented a
mathematical model of deformation of fabrics if exposed to a load. Similarly, other
researchers have taken Pierce's work as a fundament. Kemp (Kemp, 1958) improved Pierce's
model with the introduction of ecliptic shape of yarn. With the help of Pierce's and Kemp's
geometry, Olofsson (Olofsson, 1965) presented a mechanical model of fabrics under uniaxial
loading. His work was continued by Grosberg with co-authors (Grosberg et al, 1966), who
were investigating tensile, bending, bulking and shearing properties, and fabrics and forces
acting at counted properties on a fabric and yarn in the fabric. Kawabata approached the
geometry of the interlacing point. He set the interlacing point in space, presented it as a
space curve, and researched how the fabric behaves when forces act upon it and what
deformations occur (Kawabata, 1989). Apart from the geometric and mechanical models, the
researchers have also developed energy, statistical and numerical models of woven fabrics.
In more recently, many researches are still based on the already known models, trying to
improve or reform the already existed models. A lot of researchers have performed work
based on real woven fabrics, studying their physical and mechanical properties. They have
been investigating the influence of differently used yarn (material or different technique of
spinning), the influence of different density of warp and weft threads, and weave.
Woven Fabric Engineering
30
Our research is also based on the investigation of the physical and mechanical properties of
woven fabrics with different yarns used in weft.
3.1 Tensile properties of fabrics
For designing apparel as well as for other uses, the knowledge about the tensile properties
of woven fabrics is important. Strength and elongation are the most important performance
properties of fabrics governing the fabric performance in use. Their study involves many
difficulties due to a great degree of bulkiness in the fabric structure and strain variation
during deformation. Each woven fabric consists of a large amount of constituent fibres and
yarns and hence, any slight deformation of the fabric will subsequently give rise to a chain
of complex movements of the latter. This is very complicated, since both fibres and yarns
behave in a non-Hooken way during deformation (Hu, 2004)
At the beginning of loading, extension occurs in amorphous parts, where primary and
secondary bonds are extending and are shear loaded. If in this stage, an external force stops
acting, most of the achieved extension will recover and the material shows elastic properties.
If the loading continuous, a plastic deformation of the material occurs. Long chains of
molecules are reciprocally re-arranged as a consequence of the disconnection of secondary
bonds. The re-arrangements of the reciprocal position of molecules give material better
possibility to resist additional loading. If the loading continuous, a final break will occur
(Saville, 2002).
The stress-strain curve has three parts as it is shown in Figure 2. A higher initial module at a
tensile test occurs, due to the resistance against friction and bending of fabrics. In the tested
direction, in the direction of force, crimp yarns are straightened. When the yarns are
straightened, the force in the fabrics increases quickly and fibres and yarns begin to extend,
as it is shown in Figure 2b. The tensile properties of fabrics mostly depend on the tensile
properties of yarns (Grosberg, 1969)
In the region of elasticity, where Hook's law exists, tenacity (σ) is given with Equation 1.
σ = E · ε (1)
Where:
σ – tenacity (N/mm
2
),
E – elastic or Young's module (N/mm
2
),
ε – extension – deformation (%).
A major difference between the shapes of the curves above occurs in the first part of the
curve, i.e. in the Hook’s zone (I – zone). This is influenced by a crimp of warp or weft yarns,
when they begin to straighten. The elongation of the fabric is already increasing under a low
force (still before the zone in which Young’s modulus is calculated). Here, the crimp is
interchanged between the threads of the two systems. The crimp decreases in the direction
investigated, however, it increases in the perpendicular direction. Consequently, the tension
of the threads of the system, which is perpendicular to the direction investigated, increases.
When a tensile force acts on the threads of one system, the threads of both systems undergo
extension. Due to the crimp interchange, the maximum possible elongation of perpendicular
threads depends on the fabric geometry (Saville, 2002, Gabrijelčič et al, 2008).
The elastic or Young's module provides resistance against the deformation of the material
(fabric). Lower the value of Young's module, the more deformable (extensible) is material.
The Young's module in the diagram stress-strain represents the tangents of the inclination
angle α. The more resistant the material, the higher the angle of inclination α.
Mechanical Properties of Fabrics from Cotton and
Biodegradable Yarns Bamboo, SPF, PLA in Weft
31
Etg
σ
α
ε
=
= (2)
Fig. 2. Stress-strain curve of yarn and fabrics
As it can be seen in Figure 2, the load-extension curve is divided into three zones:
• the zone of elastic deformation or Hook’s zone (zone I) of both yarn and fabric: If the
extension occurs inside the Hook’s zone, the material recovers to its initial length after
the relaxation. This zone is also called the zone of linear proportionality or linear
elasticity.
• the zone of viscoelastic deformation (zone II): After the loading, the material recovers to
its initial length after a certain time of relaxation. The relationship between the stress
and deformation is not linear. The limit between the elastic and plastic deformation is
the yield point, on the stress-strain curve seen as a turn of curve.
• the zone of permanent deformations (zone III): The material does not recover after the
relaxation (Geršak, 2006, Reallf et al, 1991)
3.2 Mechanical properties measured with KES evaluation system
Measuring other physical and mechanical properties and not only tensile properties is of
great help in controlling and in the quality processes during the manufacture and post-
treatment of textiles. Many researchers have been trying to develop a system for measuring
the mechanical properties of textiles. The Kawabata Evaluation System (KES) is the first
system for testing fabric mechanical properties. And it is also the system which evaluates
fabric handle. This system has four different machines, and 16 parameters in warp and weft
direction can be obtained, covering almost all aspects of physical properties of fabrics
measured at small load. Tensile, bending, shearing, compressional and surface properties
can be measured. From these measurements, properties such as stiffness, softness,
extensibility, flexibility, smoothness and roughness can be inferred.
Tensile property
The tensile behavior of fabrics is closely related to the inter-fiber friction effect, the ease of
crimp removal and load-extension properties of the yarn themselves as it was discussed
before. Four tensile parameters can be determined through the KES instruments LT, WT, RT
and EMT. LT represents the linearity of the stress-strain curve. A higher value of LT is
supposed to be better. EMT reflects fabric extensibility, a measure of fabric ability to be
Woven Fabric Engineering
32
stretched under a tensile load. The larger the EMT, the more extensible is the fabric (Chan et
al, 2006). A proper amount of extensibility is desirable, while both excessive and insufficient
extensibility will cause problems for the production. LT represents the linearity of the
stress–strain curve. A higher value of LT is supposed to be better. WT denotes the tensile
energy per unit area, taking care of the effect of both EM and LT. Thus, the conclusion about
WT can be deduced from the comparison of EM and LT. RT (tensile resiliency) measures the
recovery from tensile deformation. A tight fabric structure contributes to a better recovery.
Property Symbol Parameter measured Unit
Tensile LT Linearity of load extension curve /
WT Tensile energy cN cm/cm
2
RT Tensile resilience %
EMT Extensibility, strain at 500 cN/cm %
Shear G Shear rigidity cN/cm degree
2HG Hysteresis of shear force at 0.5° cN/cm
2HG5 Hysteresis of shear force at 5° cN/cm
Bending B Bending rigidity cN cm
2
/cm
2HB Bending hysteresis cN cm/cm
Compression LC Linearity of compression thickness curve /
WC Compressional energy cN cm/cm
2
RC Compressional resilience %
Surface MIU Coefficient of fabric surface friction /
MMD Mean deviation of MIU /
SMD Geometric roughness µm
Thickness T Fabric thickness at 50 N/m
2
mm
Weight W Fabric weight per unit area mg/cm
2
Table 2. Parameters measured on KES system
Shear property
Whenever bending occurs in more than one direction, so that the fabric is subjected to
double curvature, shear deformations of the fabric are involved. As revealed by its
definition, shear property is highly related to the fabric bending property. The shear
property in conjunction with the bending property is thus a good indicator of the ability of a
fabric to drape. A shear deformation is very common during the wearing process, since the
fabric needs to be stretched or sheared to conform to the new gesture of a body movement.
During the making-up of a garment, the shear deformation is also indispensable for an
intended garment shape. Shear rigidity G provides a measure of the resistance to the
rotational movement of the warp and weft threads within a fabric when subjected to low
levels of shear deformation. The lower the value of G, the more readily the fabric will
conform to three-dimensional curvatures. If the shear rigidity is not enough, a fabric
distortion will easily occur. So does the skewing or bowing during handling, laying up, and
sewing. On the other hand, too high shear rigidity might also present a problem to form,
mould, or shape, especially at the sleeve head. 2HG and 2HG5, the hysteresis of shear force
at 0.5◦ and 5◦, are two other measures of the shear property of a fabric. Like 2HB, the lower
the 2HG and 2HG5, the better the recovery from shear deformation.
Mechanical Properties of Fabrics from Cotton and
Biodegradable Yarns Bamboo, SPF, PLA in Weft
33
Bending property
The fabric bending property is apparently a function of the bending property of its constituent
yarns. Two parameters can be used to measure this property, i.e. B and 2HB. B is bending
rigidity, a measure of a fabric ability to resist to a bending deformation. In other words, it
reflects the difficulty with which a fabric can be deformed by bending. This parameter is
particularly critical in the tailoring of lightweight fabrics. The higher the bending rigidity, the
higher the fabric ability to resist when it is bent by an external force, i.e. during fabric
manipulation in spreading and sewing. Apart from for the bending rigidity of the constituent
yarns and fibers, the mobility of the warp/weft within the fabric also comes into play in this
aspect. In addition, the effect of density and fabric thickness are also very profound for this
property. 2HB represents the hysteresis of the bending moment. It is a measure of recovery
from bending deformations. A lower value of 2HB is supposed to be better.
Compression
Fabric compression is one of the most important factors when assessing fabric mechanical
properties, since it is highly related to the fabric handle, i.e. fabric softness and fullness, and
fabric surface smoothness. Especially, this property might even influence the thermal
property of a fabric. For example, when a fabric is compressed, a subsequent drop in its
thermal insulation will be found as well due to the loss of still air entrapped in the fabric.
The compressional property can be influenced in many ways. Generally speaking, this
property can reflect the integrated effect of a fabric structure like yarn crimp level and
thickness, the constituent fiber and/or yarn surface property, and lateral compressional
property. LC, the linearity of compression–thickness curve, WC, the compressional energy
per unit area, and the last one RC, the compressional resilience, reflect the ability of a fabric
to recover from a compressional deformation.
Surface property
Apparently, the fabric handle bears a close relationship with the surface property of a fabric.
Three parameters are used as indices of fabric surface property, i.e. MIU, the coefficient of
friction, MMD, a measure of the variation of the MIU, and SMD, a measure of geometric
roughness. MIU is mainly governed by the contact area and type of weave. The greater the
contact area, the higher the MIU value. Generally, a plain weave exhibits a higher geometric
roughness in comparison with twill weave due to its shorter floats. [5, 6]
4. Experimental
The research was focused on the mechanical properties of fabrics with cotton warp and
biodegradable yarns (bamboo, PLA and SPF) as well as cotton in weft. Pure cotton fabrics
were made for the comparison with other fabrics with biodegradable yarns in weft.
Fabrics were made in four most commonly used weaves (i.e. plain weave, basket weave,
twill 1/3 and twill 2/2). All fabrics were made on the same loom with the same density for
all fabrics, 30 threads/cm in warp and 28 threads/cm in weft. Fabrics were washed after
desizing.
For all fabrics, the physical characteristic warp and weft crimp, mass per square meter,
thickness of fabrics, as well as tensile properties of used yarns and tensile properties of
fabrics in warp and weft direction were measured in compliance with the SIST EN ISO
13934 standard. For a better comparison between the fabrics with different materials in weft,
Woven Fabric Engineering
34
breaking tenacity was calculated as well and presents how much force can yarn hold per
linear density.
Moreover, other mechanical properties were measured on the KES system, e.g. bending,
tensile properties at small load, shearing and compression. The measurements were
statistically estimated and analyzed with multivariate statistical methods.
Weave Warp Weft
Warp
crimp
Weft crimp Mass Thickness
Tt
1
(tex) Tt
2
(tex) C
1
(%) C
2
(%) (g/m
2
) (mm)
1 Plain 9.24 13.32 170.83 0.163
2 Basket 2.94 5.44 164.30 0.241
3 1/3 Twill 2.72 15.08 168.21 0.266
4 2/2 Twill
Bamboo
21 tex
3.28 13.06 167.44 0.247
5 Plain 8.86 17.74 174.42 0.203
6 Basket 3.58 19.44 168.66 0.264
7 1/3 Twill 4.16 20.06 169.09 0.279
8 2/2 Twill
PLA
20 tex
3.94 21.52 169.35 0.269
9 Plain 8.04 23.32 156.93 0.162
10 Basket 2.54 21.80 153.97 0.234
11 1/3 Twill 2.84 25.62 159.32 0.247
12 2/2 Twill
SPF
15 tex
3.16 22.98 152.35 0.244
13 Plain 11.06 14.86 164.40 0.201
14 Basket 2.34 13.46 158.58 0.281
15 1/3 Twill 3.36 14.70 161.61 0.283
16 2/2 Twill
Cotton
28 tex
Cotton
19 tex
3.76 15.86 161.80 0.278
Table 3. Construction parameters of fabrics and measured physical parameters of fabrics
Plain weave (PL) Basket weave (BW) Twill 1/3 (T 1/3) Twill 2/2 (T 2/2)
Fig. 3. Used weaves in fabrics
5. Results
5.1 Tensile properties of yarns
As said before, the strength of a fabric depends not only on the strength of the constituent
yarn, but also on the yarn structure, yarn bending behaviour, fabric geometry, thus tensile
properties (i.e. tensile force and tensile elongation) of all used yarns were measured and for
a better comparison, breaking tenacity of yarns was calculated. It was established that SPF
yarn is the strongest and can withstand the most stress per linear density. Warp and weft
cotton yarns have almost the same breaking tenacity (i.e. around 16 cN/tex). The breaking
tenacity of PLA yarn is around 12.5 cN/tex and the lowest is for bamboo yarns.
Furthermore, the tenacity-extension curves were elaborated for each yarn, where the stress-
strain behaviour of the used materials can be observed. In Figure 2, it can be seen that
Mechanical Properties of Fabrics from Cotton and
Biodegradable Yarns Bamboo, SPF, PLA in Weft
35
biodegradable yarns differ from cotton yarns especially at tensile elongation, which is
approximately two times (bamboo yarn), three times (SPF) and five times (PLA) higher than
at cotton weft yarns. On the other hand, the tensile strength of weft cotton yarns is
comparable with the tensile strength of bamboo and PLA, while the SPF yarn has a
considerably higher tenacity.
COTTON –
WARP
BAMBOO PLA SPF
COTTON –
WEFT
F (cN)
444.38 218.84 249.77 287.22 258.49
CV 8.44 12.32 8.03 8.39 9.21
E (%)
4.18 8.52 27.52 13.72 4.45
CV 9.39 12.34 8.27 6.41 11.24
σ (cN/tex) 16.35 10.42 12.49 19.17 16.88
Table 4. Tensile properties (breaking force, breaking elongation and breaking tenacity) of
yarns used in fabrics
0
5
10
15
20
0 5 10 15 20 25 30
E (%)
σ
(cN/tex)
BAM
PLA
SPF
CO- w ef t
CO- w ar p
Fig. 4. Tenacity-extension curve for bamboo, PLA, SPF and cotton yarns
5.2 Tensile properties of fabrics
Tensile properties of all 16 fabrics were measured. The results of all measurements (breaking
force and breaking elongation) are shown in Table 4. Moreover, the breaking tenacity of one
yarn in weft direction of the fabric was calculated for a better comparison of yarns with
different linear densities.
Firstly, it was established that the type of weave has a greater influence on the breaking
force of fabrics in warp direction than different types of yarns. With a multivariate statistical
analysis, it was proved that weave is a 5-time more important factor than different material
Woven Fabric Engineering
36
in weft. The highest tensile force is, as it was expected, in plain weave, due to the maximum
number of interlacing points resulting in higher friction between yarns and consequently
also higher tensile strength in warp direction. Twill 2/2, twill 1/3 and basket weaves follow
with lower values, which are presented in Figure 5. The differences in the same weave
depend considerably on the material used in weft. It was found out that the extensibility of
yarns in weft direction influences the breaking force in warp direction. The highest breaking
force in warp direction is shown at fabrics with PLA and SPF yarn in weft and the lowest
tensile force at pure cotton fabrics, since cotton yarn has the lowest elongation.
WARP WEFT
No
F (N) CV
E
(%)
CV F (N) CV
σ
(cN/tex)
E (%) CV
1 PL 903.75 1.24 13.95 2.06 322.13 3.3 54.78 19.58 4.26
2 BW 779.27 2.39 7.48 2.53 334.68 4.31 55.34 19.18 4.4
3 T1/3 815.44 3.18 7.98 3.44 326.05 3.63 54.29 21.69 3.12
4 T2/2
Bamboo
812.6 4.43 7.83 2.68 350.98 2.42 59.69 21.99 2.74
5 PL 907.77 3.44 15.82 2.51 376.91 3.91 63.67 44.14 4.36
6 BW 796.93 3.13 7.58 2.79 370.18 1.44 65.17 44.29 2.92
7 T1/3 806.68 2.92 7.93 1.7 360.12 1.46 64.31 46.6 2.04
8 T2/2
PLA
845.43 4.97 8.08 2.62 352.82 4.02 61.68 48.75 2.53
9 PL 965.67 3.99 14.06 3.99 351.04 2.68 82.11 32.34 2.53
10 BW 779.76 1.74 6.22 3.43 347.26 7.24 80.38 30.87 6.1
11 T1/3 788.65 3.53 7.23 2.91 332.87 2.74 78.14 30.53 1.24
12 T2/2
SPF
817.92 1.8 6.98 2.97 340.38 4.88 78.79 33.19 4.93
13 PL 857.76 5.39 15.16 2.52 474.14 2.64 85.76 16.16 1.77
14 BW 766.48 4.11 7.13 4.04 424.42 5.75 79.49 16.82 16.86
15 T1/3 730.2 2.86 7.93 3.64 433.9 1.42 81.56 15.62 3.5
16 T2/2
Cotton
771.94 4.8 7.58 2.77 451.16 2.1 84.20 19.18 12.73
Table 5. Tensile properties (breaking force, breaking elongation in warp direction and
breaking force, breaking elongation and breaking tenacity in weft direction) of fabrics
Among the fabrics woven in plain weave, the fabric with SPF yarn in weft is distinguished
with the highest breaking force (965.67 N), followed by the fabrics with PLA (907.77) and
bamboo (903.75) yarn in weft. The lowest tensile strength belongs to the fabric with cotton
yarn also in weft (857.76 N). In the case of basket weave, the difference between the highest
value (fabric with PLA yarn in weft – 796.93 N) and the lowest value (fabric with cotton yarn
in weft – 766.48 N) is small. Among the fabrics woven in twill 1/3, the highest breaking force is
observed in the fabric with bamboo yarn in weft (815.44 N), and the lowest tensile strength
again in the fabric with cotton also in warp (730.2 N). Among the fabrics woven in 2/2 twill,
the fabric with PLA yarn in weft has the highest value of tensile strength (845.43 N); the lowest
tensile strength is observed, as in previous weaves, in the fabric with cotton weft (771.94 N).
The tensile force in weft direction influences mostly the material used in weft, while the
weave has practically no influence. For a better comparison and understanding how
different weft yarns influence tensile properties, esp. breaking force, the breaking tenacity of
fabrics in weft direction was calculated and is presented in Figure 7.
From Figure 6, it can be seen that the highest breaking force characterises pure cotton
fabrics, since weft cotton yarn has also high breaking tenacity of yarns, however, not the
Mechanical Properties of Fabrics from Cotton and
Biodegradable Yarns Bamboo, SPF, PLA in Weft
37
highest one. SPF yarns have the highest breaking tenacity (19.17 cN/tex); nevertheless, the
fabrics have lower breaking force and also lower breaking tenacity calculated on one thread
than pure cotton fabrics (83 cN/tex). The breaking tenacity of SPF yarns in fabrics is
approximately 80 cN/tex. The reason could be that SPF yarns are much smoother than
cotton yarns and less friction occurs between warp and weft yarns. The second highest
breaking force in weft direction is typical of fabrics with PLA yarn in weft, although the
breaking tenacity of PLA yarn (12.49 cN/tex) and the breaking tenacity calculated on one
thread in fabrics are lower than for cotton and SPF. The average breaking tenacity of all
fabrics with PLA in weft is approximately 64 cN/tex. It can be expected that the SPF fabrics
with the same linear density of weft yarn will have higher tensile strength than the fabrics
with PLA yarn in weft. The lowest breaking force in weft direction characterises the fabrics
with bamboo yarn in weft. Bamboo yarn has the lowest tenacity (10.42 cN/tex) and in
fabrics, the breaking tenacity is approximately 56 cN/tex.
700
750
800
850
900
950
1000
PL BW T 1/3 T 2/2
WAEVE
BREAKING FORCE (N)
BAMBOO
PLA
SPF
COTTON
Fig. 5. Breaking force of fabrics in warp direction
300
320
340
360
380
400
420
440
460
480
500
PL BW T 1/3 T 2/2
WAEVE
BREAKING FORCE (N)
BAMBOO
PLA
SPF
COTTON
Fig. 6. Breaking force of fabrics in weft direction
Woven Fabric Engineering
38
50
55
60
65
70
75
80
85
90
PL BW T 1/3 T 2/2
WAEVE
BREAKING TENECITY (cN/tex)
BAMBOO
PLA
SPF
COTTON
Fig. 7. Breaking tenacity of fabrics in weft direction
It was also found out that different properties of yarns have almost no influence on the
tensile elongation of fabrics in warp direction, while mostly the weave type influences the
tensile elongation in warp direction. The weave type is statistically 50 times more important
than different materials used in weft. Figure 8 shows that fabrics in plain weave have the
highest tensile elongation, which is approximately 15%, whereas the tensile elongation of all
other fabrics, as can be seen in the diagram, is about 7%. Plain weave has the maximum
number of interlacing points, which is twice as high as that of other weaves and, as a result,
tensile elongation is higher. Also, warp crimp is the highest in plain weave, which
influences tensile elongation as it was said before. The lowest tensile elongation is typical of
the fabrics woven in basket weave.
Both the weave type and the material in weft influence the tensile elongation in weft direction,
but the material used in weft is statistically 90 times more important. The highest tensile
elongation is at fabrics with PLA yarns in weft, which are also the most extensible yarns. Then
there are fabrics with SPF yarn, followed by fabrics with bamboo yarn and the lowest tensile
elongation is at pure cotton fabrics, since cotton yarns have the lowest extensibility.
6
8
10
12
14
16
PL BW T 1/3 T 2/2
WAEVE
BREAKING ELONGATION (%
)
BAMBOO
PLA
SOYBEAN
COTTON
Fig. 8. Breaking elongation of fabrics in warp direction
Mechanical Properties of Fabrics from Cotton and
Biodegradable Yarns Bamboo, SPF, PLA in Weft
39
10
15
20
25
30
35
40
45
50
PL BW T 1/3 T 2/2
WAEVE
BREAKING ELONGATION (%
)
BAMBOO
PLA
SOYBEAN
COTTON
Fig. 9. Breaking elongation of fabrics in weft direction
0
2
4
6
8
10
12
14
16
18
20
22
0 2 4 6 8 1012141618
E (%)
σ
(cN/tex)
1-PL
2-BW
3-T1/3
4-T2/2
5-PL
6-BW
7-T1/3
8-T2/2
9-PL
10-BW
11-T1/3
12-T2/2
13-PL
14-BW
15-T1/3
16-T2/2
Fig. 10. Tenacity – extension curves for fabrics in warp direction
The fabrics with PLA yarn have the highest tensile elongation, for PLA yarn itself already
has the highest tensile elongation (27.52%) and is the most extensible yarn. All these fabrics
have tensile elongation about 45%. It is evident in Figure 9 that the fabrics in twill 1/3 and
twill 2/2 have higher tensile elongation than plain and basket weave. The fabrics with SPF
yarn in weft come in the second place. The tensile elongation of SPF yarn (13.72%) is ranked
second. Figure 8 also shows that tensile elongation of these fabrics is ca 32%. The highest
tensile elongation belongs to plain weave and twill 2/2 weave. Next to them, there are the
fabrics with bamboo yarn with mean tensile elongation at about 20%. The tensile elongation
of bamboo yarn is 8.52%. It is noticed again that twill 1/3 and twill 2/2 weaves have higher
Woven Fabric Engineering
40
tensile elongation than the plain and basket weave. Cotton fabrics have the lowest tensile
elongation, since the cotton yarn itself also has the lowest tensile elongation of only 4.45%.
The tensile elongation of cotton fabrics is 16%. The highest elongation is observed in the
fabric in twill 2/2 weave.
For all fabrics in warp and weft direction, tenacity-extension curves were made to compare
different behaviour at the tensile test.
The tenacity-extension curves in Figure 10 show that it is the weave, which has the highest
influence on the shape of curves in warp direction. The curves of plain weave have almost
the same shape, whereas the shapes of other weaves have very similar shapes. All curves for
each group of materials are arranged in a defined order, i.e. twill 1/3, twill 2/2 and basket.
Plain weave has a completely different shape of the curve due to a more frequent interlacing
of threads in the weave, which results in a higher shrinkage of the fabric and, consequently,
higher elongation.
The shapes of the curves for weft show that it is solely the material, which influences the
shape of the curve. The weave has practically no influence, which has already been proved
by previous results. Each group of materials has its own specific shape of the curve. The
fabrics with cotton weft have the most vertical shape of the curve, for they have the lowest
tensile elongation. The fabrics with PLA yarn in weft have a very specific shape of the curve.
If the tenacity-extension of yarns (cf. Figure 5) is compared with the tenacity-extension curve
of fabrics, some similarities can be detected. However, if the curves are compared with the
shapes of the curves of standard materials, i.e. cotton, cellulose, PES or PA, and silk, it can
be stated that the curve with bamboo yarn in weft has the same shape of the curve as
cellulose fibres. The shape of the curve with SPF yarn in weft is similar to the shape of the
curve of silk. Cotton fabrics have the same shape of the curves as cotton fibres.
0
2
4
6
8
10
12
14
16
18
0 1020304050
E (%)
σ
(cN/tex)
1-PL
2-BW
3-T1/3
4-T2/2
5-PL
6-BW
7-T1/3
8-T2/2
9-PL
10-BW
11-T1/3
12-T2/2
13-PL
14-BW
15-T1/3
16-T2/2
Fig. 11. Tenacity – extension curves for fabrics in weft direction
Mechanical Properties of Fabrics from Cotton and
Biodegradable Yarns Bamboo, SPF, PLA in Weft
41
5.3 Other mechanical properties measured with KES evaluation system
The measurements on the KES system show which of the investigated fabrics is the most
suitable for the clothing industry and what kind of behaviour can be expected. From the
results, it can be seen that fabrics with SPF yarn in weft are very extensible and flexible.
Cotton fabrics are the softest and fabrics with bamboo weft have very similar properties as
cotton fabrics.
As it was discussed above, the measurements of tensile properties on the KES system
confirmed as well that the tensile behavior of fabrics is closely related to the inter-fiber
friction effect, the ease of crimp removal and load-extension properties of the yarn
themselves. The measurements of extensibility (EMT) of fabrics and tensile work (WT) show
that as at tensile test, the weave mostly influences the tensile properties in warp, and the
material used in weft the tensile properties in weft. At EMT, it can be seen that the highest
extensibility characterizes the fabric with the SPF yarn in weft direction; however, the SPF
yarn is not the most extensible material (13.72%) but the fabric with the highest weft crimp,
which has the highest influence on EMT. The fabrics in plain weave usually demonstrate a
higher tensile work (WT), as it is also seen at our fabrics. It is also demonstrated that the
fabrics wit SPF yarn in weft have the highest WT.
Shear rigidity G provides a measure for the resistance to the rotational movement of warp
and weft threads within a fabric when subjected to low levels of shear deformation. The
lower the value of G, the more readily the fabric will conform to three-dimensional
curvatures. If the shear rigidity is not enough, a fabric distortion will easily occur. Shear
properties are most commonly influenced by weave, while the material used in weft has
practically no influence.
The KES system tensile properties influence both the type of weave and the material used in
weft. It was also established that some properties measured on the KES system have very
good correlation with each other (e.g. thickness, and compressional properties, bending and
shearing properties) and some properties inversely proportional (e.g. tensile energy and
tensile resilience, bending and shearing properties, and compressional properties). If it is
known which properties correlate with each other, it is easier to predict what kind of
properties the fabric will fabrics.
LT
W
T RT EMT G 2HG 2HG5 B 2HB LC
W
C RC TO TM THIC
LT
1
W
T
0.588 1
RT
–0.696
–0.819
1
EMT
0.202
0.906
–0.623 1
G 0.745
0.223 –0.449 –0.147 1
2HG 0.702
0.159 –0.367 –0.201
0.992
1
2HG5 0.770
0.181 –0.411 –0.204
0.983 0.974
1
B
0.600 0.315 –0.298 0.060 0.648 0.631 0.691 1
2HB
0.652 0.114 –0.213 –0.211
0.842 0.855 0.868 0.893
1
LC
0.302 0.018 –0.084 –0.146 0.527 0.531 0.528 0.069 0.207 1
W
C
–0.128 –0.287 0.314 –0.311 0.272 0.325 0.199 –0.247 0.027 0.422 1
RC
–0.180 0.003 0.136 0.127 –0.363 –0.368 –0.299 –0.167 –0.301 –0.064 –0.402 1
TO
–0.683 –0.312 0.543 0.007
–0.820 –0.794 –0.821
–0.684
–0.742
–0.476 0.189 0.266 1
TM
–0.670 –0.268 0.572 0.072
–0.799 –0.753 –0.784
–0.541 –0.658 –0.232 –0.019 0.582
0.801
1
THIC –0.794
–0.415 0.640 –0.057
–0.805 –0.756 –0.811 –0.701 –0.729
–0.238 0.132 0.470
0.840 0.942
1
Table 6. Correlation table of measured data on KES system
The principal components analysis (PCA) enables the visualization of linear correlations
between the measured data on the KES system. PCA transforms multivariate data into a