báo cáo hóa học:" Usefulness of five-item and three-item Mental Health Inventories to screen for depressive symptoms in the general population of Japan" ppt
Bạn đang xem bản rút gọn của tài liệu. Xem và tải ngay bản đầy đủ của tài liệu tại đây (240.75 KB, 7 trang )
BioMed Central
Page 1 of 7
(page number not for citation purposes)
Health and Quality of Life Outcomes
Open Access
Research
Usefulness of five-item and three-item Mental Health Inventories to
screen for depressive symptoms in the general population of Japan
Shin Yamazaki*
1
, Shunichi Fukuhara
†2
and Joseph Green
†3
Address:
1
Epidemiology and Exposure Assessment Section, National Institute for Environmental Studies, Tsukuba, Japan,
2
Department of
Epidemiology and Healthcare Research, Graduate School of Medicine and Public Health, Kyoto University, Kyoto, Japan and
3
Office of
International Academic Affairs, Graduate School of Medicine, University of Tokyo, Japan
Email: Shin Yamazaki* - ; Shunichi Fukuhara - ; Joseph Green -
tokyo.ac.jp
* Corresponding author †Equal contributors
Abstract
Background: The five-question Mental Health Inventory (MHI-5) is a brief questionnaire that can
be used to screen for depressive symptoms. Removing the 2 anxiety-related items from the MHI-
5 yields the MHI-3. We assessed the performance of the Japanese versions of the MHI-5 and MHI-
3 in detecting depressive symptoms in the general population of Japan.
Methods: From the population of Japan, 4500 people 16 years old or older were selected by
stratified-random sampling. The Medical Outcomes Study 36-Item Short Form Health Survey (SF-
36, which includes the MHI-5) and the Zung Self-rating Depression Scale (ZSDS) were included in
a self-administered questionnaire. ZSDS scores of 48 and above were taken to indicate the
presence of moderate or severe depressive symptoms, and scores of 56 and above were taken to
indicate the presence of severe depressive symptoms. We computed the correlation coefficient
between the ZSDS score and the scores on the MHI-5 and MHI-3. We also computed the
sensitivity, specificity, and area under the receiver operating characteristic (ROC) curve.
Results: Of the 3107 subjects (69% of the 4500 initially selected), 14.0% had moderate or severe
depressive symptoms, and 2.0% had severe depressive symptoms as measured with the ZSDS. The
correlations of ZSDS scores with MHI-5 scores and with MHI-3 scores were similar: -0.63 and -
0.61, respectively. These correlation coefficients were almost the same whether or not the data
were stratified by age and sex. For detecting severe depressive symptoms with the MHI-5, the area
under the ROC curve was 0.942 (95%CI: 0.919 – 0.965); for the MHI-3, it was 0.933 (95%CI: 0.904
– 0.962).
Conclusion: The MHI-5 and MHI-3 scores were correlated with the ZSDS score, and can be used
to identify people with depressive symptoms in the general population of Japan.
Background
Depression disorders are a major health problem in
Japan. Depressive mood is associated with suicide in mid-
dle-aged workers [1], and the number of suicides has
increased as economic conditions have worsened since
1998 [2]. Nonetheless, there are few studies of the
Published: 08 August 2005
Health and Quality of Life Outcomes 2005, 3:48 doi:10.1186/1477-7525-3-
48
Received: 02 June 2005
Accepted: 08 August 2005
This article is available from: />© 2005 Yamazaki et al; licensee BioMed Central Ltd.
This is an Open Access article distributed under the terms of the Creative Commons Attribution License ( />),
which permits unrestricted use, distribution, and reproduction in any medium, provided the original work is properly cited.
Health and Quality of Life Outcomes 2005, 3:48 />Page 2 of 7
(page number not for citation purposes)
prevalence of depression or of depressive symptoms in
communities in Japan [3,4].
To assist in detecting depression or depressive symptoms,
many screening questionnaires have been developed.
Some of these have 20 to 30 items, take only a few min-
utes to complete, use the number of symptoms as the
score, and have good performance to detect depressive
state. Instruments that are even shorter but nonetheless
have good performance to detect depressive state have
also been developed [5-7]. One such questionnaire is the
five-item version of the Mental Health Inventory (MHI-5)
[6,7]. The MHI-5 is used as the "Mental Health" domain
of the Medical Outcomes Study 36-Item Short Form
Health Survey (SF-36). The SF-36 has been translated into
Japanese [8], and the Japanese version has been validated
for use in the general population of Japan [9], but the per-
formance of the MHI-5 has not been evaluated in detail.
In addition, two of the items in the MHI-5 are almost
identical to two items in a scale developed to measure
anxiety [10]. We hypothesized that removing those two
anxiety-related items would result in a scale (the MHI-3)
that performs as well as the MHI-5 in detecting symptoms
of depression.
In this study, we compared the Japanese version of the
MHI-5 and MHI-3 to the 20-item Zung Self-rating Depres-
sion Scale (ZSDS) [11], and assessed the performance of
the Japanese versions of the MHI-5 and MHI-3 in detect-
ing depressive symptoms among the general population.
Methods
Setting and participants
We used data that had been collected previously for a
study of the validity of the Japanese version of the SF-36,
and calculated national norm scores of all subscales of the
SF-36 [8,9]. Details of the nationwide survey have been
described previously [9]. Briefly, a total of 4500 people 16
years old or older were selected from the entire popula-
tion of Japan by stratified-random sampling in 1995. A
self-administered questionnaire was mailed, and the sub-
jects were visited to collect the questionnaires. The SF-36,
the ZSDS [11] (described below), and questions about
demographic characteristics were included in the
questionnaire.
The ZSDS consists of 10 positively worded items and 10
negatively worded items asking about symptoms of
depression. Several studies have established the ZSDS as a
reliable and valid instrument for measuring depressive
symptoms [12-14]. The ZSDS scores were used to define
four categories of the severity of depression: within nor-
mal range or no significant psychopathology (below 40
points); presence of minimal to mild depression (40–47
points); moderate to marked depression (48–55 points);
presence of severe to extreme depression (56 points and
above). These score ranges result from the studies of Zung
[15] and Barrett et al [16]. The ZSDS has been translated
into Japanese and studies of the validity of the Japanese
version have been published [17]. Because the ZSDS is not
a clinical diagnostic tool, subjects with high scores are said
to have depressive symptoms rather than "depression."
Like the rest of the SF-36, the MHI-5 was administered as
a paper-and-pencil questionnaire. The instrument con-
tains the following questions: 'How much of the time dur-
ing the last month have you: (i) been a very nervous
person?; (ii) felt downhearted and blue?; (iii) felt calm
and peaceful?; (iv) felt so down in the dumps that nothing
could cheer you up?; and (v) been a happy person?' For
each question the subjects were asked to choose one of the
following responses: all of the time (1 point), most of the
time (2 points), a good bit of the time (3 points), some of
the time (4 points), a little of the time (5 points), or none
of the time (6 points). Because items (iii) and (v) ask
about positive feelings, their scoring was reversed. The
score for the MHI-5 was computed by summing the scores
of each question item and then transforming the raw
scores to a 0–100-point scale [18].
Items (i) and (iii) are almost identical to 2 items in the
Zung Self-rating Anxiety Scale [10]. To make a scale that is
even shorter than the MHI-5 and is focused on depression
we removed those two anxiety-related items. Thus, the
MHI-3 comprised only (ii), (iv), and (v) above. Possible
scores on the MHI-3 ranged from 3 to 18 points.
Statistical methods
First, we computed the correlation coefficient (Pearson's)
between the ZSDS scores and the scores on the MHI-5 and
the MHI-3. We computed the sensitivity, specificity, and
area under the receiver operating characteristic (ROC)
curve. Analysis of ROC curves has been described in detail
and ROC analysis is used extensively in health-related
diagnostics [19,20]. ROC analysis can be used to study the
performance of diagnostic or screening tests across a wide
range of sensitivities and specificities. For example, it can
be used to compute the sensitivity (the true-positive rate)
and specificity (the true-negative rate) for any specified
test score. The area under the ROC curve (AUC) is an
index of the amount of information the test provides over
its entire scoring range [21,22]. In general, an AUC can
range from 0.5, which indicates a test with no informa-
tion, to 1.0, which indicates a perfect test. The "gold stand-
ard" criteria for diagnosing depression are considered to
be those of the Diagnostic and Statistical Manual of Men-
tal Disorders (DSM) [7]. In this study, because we could
not interview all subjects, we used, instead, scores on the
ZSDS. For each of the three categories of the severity of
depressive states (ZSDS scores of 40 or higher), we
Health and Quality of Life Outcomes 2005, 3:48 />Page 3 of 7
(page number not for citation purposes)
computed the AUC of each of the five items, the MHI-5,
and the MHI-3. To define the cut-off points, we first con-
sidered each of the actually measured MHI-5 scores as a
possible cut-off point. For each score, we took the sum of
the sensitivity and the specificity. The score with the high-
est sum was used as the cut-off point. One cut-off point
was determined for each of the three levels of severity
defined by ZSDS scores (mild, moderate, and severe).
Results
The nationwide survey targeted 4500 people, and 3395
(male: 1704; female: 1691) responded to the question-
naire (75% response rate). Of these 3395 individuals,
3107 (male: 1573; female: 1534) completed all of the
items on the ZSDS. The mean score on the MHI-5 was
72.8 (SD = 19.1). The mean scores on the MHI-5 for
respondents of different demographic categories are
shown in Table 1. These mean scores ranged from 68.5 to
76.6. Almost 23% of the respondents had ZSDS scores
indicating mild depressive symptoms, 12% had scores
indicating moderate depressive symptoms, and 2% had
scores indicating severe depressive symptoms.
The correlations of ZSDS scores with MHI-5 scores and
with MHI-3 scores were similar: -0.63 and -0.61,
respectively. These correlation coefficients were almost
Table 1: MHI-5 scores by demographic categories
N (%) Score of the MHI-5
3107 (100) Mean (SD)
Sex
Male 1573 (51) 73.31 (18.63)
Female 1534 (49) 72.32 (19.55)
Age (years)
<30 619 (20) 70.17 (18.47)
30 – 39 506 (16) 72.50 (17.47)
40 – 49 665 (21) 72.38 (20.28)
50 – 59 617 (20) 74.22 (18.60)
60 – 69 479 (15) 75.21 (19.11)
≥70 221 (7) 73.23 (21.09)
Annual household income (million yen)
<3 385 (12) 69.37 (20.83)
3 – 4.9 670 (22) 71.87 (19.08)
5 – 6.9 685 (22) 72.62 (19.38)
7 – 9.9 648 (21) 73.72 (18.27)
10 – 11.9 228 (7) 74.57 (18.78)
≥12 266 (9) 76.63 (16.72)
Missing values 225 (7) 73.30 (19.4)
Schooling
Junior high school 613 (20) 72.64 (19.88)
High school 1426 (46) 72.97 (18.88)
Junior college, college, or higher 1028 (33) 72.84 (18.85)
Missing values 40 (1) 69.95 (20.88)
Marital status
Single 622 (20) 70.04 (18.89)
Married 2227 (72) 73.74 (18.8)
Separated 28 (1) 75.43 (16.86)
Divorced 65 (2) 68.66 (20.91)
Widowed 152 (5) 72.18 (22.27)
Missing values 13 (0) 70.00 (19.71)
Occupational status
Full time worker 1610 (52) 73.05 (18.25)
Part time worker 299 (10) 74.27 (17.96)
Retired 164 (5) 72.51 (22.74)
Unemployed 171 (6) 69.34 (21.95)
Homemaker 533 (17) 73.06 (19.71)
Student 226 (7) 73.36 (18.77)
Other 83 (3) 68.48 (21.49)
Missing values 21 (1) 70.86 (16.64)
Health and Quality of Life Outcomes 2005, 3:48 />Page 4 of 7
(page number not for citation purposes)
the same whether or not the data were stratified by age
and sex (Table 2).
With ZSDS scores as the basis for classifying depressive
symptoms, ROC analysis allowed us to evaluate the per-
formance of the MHI-5 and the MHI-3. The AUC values
are shown in Table 3, and other performance characteris-
tics are shown in Table 4. We also evaluated the perform-
ance of each of the MHI-5 question items individually
(Table 3). For the individual items, the range of "cut-off
scores" was determined by the range of each question's
response options: from "none of the time" to "all of the
time." The best-performing item for detecting severe
depressive symptoms was the one asking about the fre-
quency of "feeling downhearted and blue". That item had
a sensitivity of 0.88 and a specificity of 0.77 (based on a
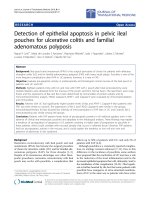
score of 4 points or less). The AUC of the MHI-3 was only
slightly lower than that of the MHI-5 (Figure 1).
Using the MHI-5, the prevalence of severe depressive
symptoms (cut-off: 52 points) was 17%, that of moderate
or severe depressive symptoms (cut-off: 60 points) was
28%, and that of mild, moderate, or severe depressive
symptoms (cut-off: 68 points) was 40%.
Table 2: Correlations of ZSDS scores with MHI-5 and MHI-3 scores, by demographic category
MHI-5 MHI-3
All -0.634 -0.614
Sex
Male -0.634 -0.610
Female -0.635 -0.618
Age (years)
<30 -0.653 -0.643
30 – 39 -0.686 -0.685
40 – 49 -0.619 -0.591
50 – 59 -0.576 -0.549
60 – 69 -0.635 -0.608
≥70 -0.698 -0.671
Annual household income (million yen)
<3 -0.666 -0.638
3 – 4.9 -0.612 -0.596
5 – 6.9 -0.642 -0.642
7 – 9.9 -0.637 -0.602
10 – 11.9 -0.654 -0.642
≥12 -0.562 -0.554
Missing values -0.613 -0.551
Schooling
Junior high school -0.612 -0.579
High school -0.637 -0.617
Junior college, college, or higher -0.651 -0.636
Missing values . .
Marital status
Single -0.661 -0.638
Married -0.624 -0.602
Separated . .
Divorced . .
Widowed -0.658 -0.642
Missing values . .
Occupational status
Full time worker -0.618 -0.601
Part time worker -0.533 -0.509
Retired -0.741 -0.711
Unemployed -0.714 -0.692
Homemaker -0.646 -0.636
Student -0.680 -0.646
Other . .
Missing values . .
Health and Quality of Life Outcomes 2005, 3:48 />Page 5 of 7
(page number not for citation purposes)
Discussion
These data show that the MHI-5 and MHI-3 scores were
each correlated with the ZSDS score and had good screen-
ing accordance with the ZSDS in the general population of
Japan. We also found that the MHI-3 performs almost as
well as the MHI-5. The best-performing single item was
the one asking about "feeling downhearted and blue,"
which was also the case in the US [6]. The usefulness of
the MHI-5 is consistent with results of a study done in the
US [6]. Each scale and each item performed best as a
detector of severe depressive symptoms, but each also
contributed some information even for detecting moder-
ate and mild depressive symptoms (Table 3). Both scales
performed better than did any item alone.
Because prevalence affects positive predictive value, the
latter was lowest for severe depressive symptoms and was
highest for mild, moderate, and severe depressive
symptoms (Table 4). For all levels of symptom severity,
the positive predictive values of the MHI-3 were similar to
those of the MHI-5, and for severe depressive symptoms
they were nearly identical (10.8% and 10.4%) (Table 4).
A previous study showed that the prevalence of mood dis-
orders (major depression, bipolar disorders, and
dysthymia) as measured using the DSM criteria in Japa-
nese people 20 years old and older was 3.1% [4]. On the
other hand, 37% of the sample in the present study had
mild, moderate, or severe depressive symptoms as meas-
ured using the ZSDS. People in whom depression is diag-
nosed using the DSM criteria are probably only a small
number of those who report at least some depressive
symptoms. In a previous study that also used the ZSDS,
the prevalence of mild depressive symptoms among Japa-
nese male workers was 45% [23], which is similar to that
in our study.
Table 3: ROC analysis of individual MHI-5 items, the whole MHI-5, and the MHI-3, by severity of depressive symptoms
Items and scales Severity of depressive symptom (range of ZSDS scores)
Mild, moderate, or severe
(40 through 80)
Either moderate or severe
(48 through 80)
Severe (
56 through 80)
AUC (95% CI) AUC (95% CI) AUC (95% CI)
(i) Nervous person 0.696 (0.677–0.716) 0.707 (0.680–0.734) 0.826 (0.774–0.879)
(ii) Down in the dumps 0.713 (0.694–0.733) 0.741 (0.714–0.769) 0.862 (0.813–0.910)
(iii) Calm and peaceful 0.745 (0.726–0.764) 0.755 (0.728–0.782) 0.845 (0.797–0.892)
(iv) Downhearted and blue 0.739 (0.720–0.758) 0.748 (0.721–0.776) 0.898 (0.855–0.941)
(v) Happy person 0.747 (0.729–0.765) 0.738 (0.711–0.765) 0.858 (0.811–0.905)
MHI-5* 0.810 (0.793–0.826) 0.819 (0.795–0.843) 0.942 (0.919–0.965)
MHI-3† 0.800 (0.783–0.817) 0.803 (0.779–0.828) 0.933 (0.904–0.962)
Values shown are areas under the ROC curves (AUC), and their 95% CIs, for three levels of depressive symptoms as measured by ZSDS scores.
*The MHI-5 includes all 5 items. †The MHI-3 includes only items ii, iv, and v.
Table 4: Performance of the MHI-5 and MHI-3 for detecting depressive symptoms
Mild, moderate, or severe depressive
symptoms
(ZSDS scores of 40 or higher)
Moderate or severe depressive
symptoms
(ZSDS scores of 48 or higher)
Severe depressive symptoms
(ZSDS scores of 56 or higher)
Prevalence 37% 14% 2%
Instrument MHI-5 MHI-3 MHI-5 MHI-3 MHI-5 MHI-3
(cut-off score) (68) (14) (60) (13) (52) (11)
Sensitivity 71.5% 76.4% 74.7% 77.1% 91.8% 90.0%
Specificity 79.1% 71.1% 80.0% 71.8% 84.6% 84.2%
Positive predictive value 66.7% 60.8% 37.1% 30.8% 10.8% 10.4%
Negative predictive value 82.5% 83.7% 95.1% 95.1% 99.8% 99.8%
Health and Quality of Life Outcomes 2005, 3:48 />Page 6 of 7
(page number not for citation purposes)
In addition to its performance as shown in the present
ROC analysis, an advantage of the MHI-5 may be the fact
that it is part of the SF-36. The reason is that the possibility
of a Hawthorne-type effect (i.e. an effect on study partici-
pants that results from their knowing that they are being
studied) can be an obstacle to screening for depressive
state. Specifically, the subjects' responses on a mental-
health screening instrument may be affected by their
knowledge that they are subjects in a study of mental
health. Embedding the mental-health screening instru-
ment in a more general survey, as the MHI-5 is embedded
in the SF-36, could help minimize any such effect.
While the results of this study may be useful for public-
health purposes, surveys done in primary-care settings
could provide information that is more directly applicable
to clinical work. Also, it should be kept in mind that ZSDS
scores alone cannot be used to diagnose clinical depres-
sion. Studies using psychiatrist-diagnosed depression in
addition to ZSDS scores would provide further informa-
tion about the utility of the Japanese version of the MHI-
5.
Another limitation is that the data set was obtained from
a 1995 survey. Further studies are needed to confirm the
performance of the MHI-5 and MHI-3 using data
obtained in recent years.
In conclusion, the MHI-5 and MHI-3 scores were corre-
lated with the ZSDS score, and can be used to identify peo-
ple with depressive symptoms in the general population
of Japan.
List of abbreviations
AUC: area under the ROC curve; MHI-5: the five-item ver-
sion of the Mental Health Inventory; MHI-3: those 3 of
the MHI-5 questions that were thought to be most directly
related to depression; ROC: receiver operating characteris-
tic; SF-36: the Medical Outcomes Study 36-Item Short
Form Health Survey; ZSDS: the Zung Self-rating Depres-
sion Scale.
Authors' contributions
SY: analysis of the data, interpretation of results, manu-
script writing; SF: initiation and study design, supervision,
collection of data; JG: supervision, interpretation of
results, manuscript writing.
References
1. Tamakoshi A, Ohno Y, Aoki K, Hamajima N, Wada M, Kawamura T,
Wakai K, Lin YS: Depressive mood and suicide among middle-
aged workers: findings from a prospective cohort study in
Nagoya, Japan. J Epidemiol 2000, 10:173-178.
2. Lamar J: Suicides in Japan reach a record high. BMJ 2000,
321:528.
3. Kawakami N, Shimizu H, Haratani T, Iwata N, Kitamura T: Lifetime
and 6-month prevalence of DSM-III-R psychiatric disorders
in an urban community in Japan. Psychiatry Res 2004,
121:293-301.
4. The WHO World Mental Health Survey Consortium: Prevalence,
severity, and unmet need for treatment of mental disorders
in the World Health Organization World Mental Health
Surveys. JAMA 2004, 291:2581-2590.
5. Whooley MA, Avins AL, Miranda J, Browner WS: Case-finding
instruments for depression. Two questions are as good as
many. J Gen Intern Med 1997, 12:439-445.
6. Berwick DM, Murphy JM, Goldman PA, Ware JE Jr, Barsky AJ, Wein-
stein MC: Performance of a five-item mental health screening
test. Med Care 1991, 29:169-176.
7. Rumpf HJ, Meyer C, Hapke U, John U: Screening for mental
health: validity of the MHI-5 using DSM-IV Axis I psychiatric
disorders as gold standard. Psychiatry Res 2001, 105:243-253.
8. Fukuhara S, Bito S, Green J, Hsiao A, Kurokawa K: Translation,
adaptation, and validation of the SF-36 Health Survey for use
in Japan. J Clin Epidemiol 1998, 51:1037-1044.
9. Fukuhara S, Ware JE Jr, Kosinski M, Wada S, Gandek B: Psychomet-
ric and clinical tests of validity of the Japanese SF-36 Health
Survey. J Clin Epidemiol 1998, 51:1045-1053.
10. Zung WW: A rating instrument for anxiety disorders. Psycho-
somatics 1971, 12:371-379.
11. Zung WWK: A Self-Rating Depression Scale. Arch Gen Psychiatry
1965, 12:63-70.
12. Biggs JT, Wylie LT, Ziegler VE: Validity of the Zung Self-rating
Depression Scale. Br J Psychiatry 1978, 32:381-385.
13. Gabrys JB, Peters K: Reliability, discriminant and predictive
validity of the Zung Self-rating Depression Scale. Psycholog
Reports 1985, 57:1091-1096.
14. Agrell B, Dehlin O: Comparison of six depressive rating scales
in geriatric stroke patients. Stroke 1989, 20:1990-1994.
15. Zung WWK: From art to science. Arch Gen Psychiatry 1973,
29:328-337.
16. Barrett J, Hurst MW, DiScala C, Rose RM: Prevalence of depres-
sion over a 12-month period in a nonpatient population. Arch
Gen Psychiatry 1978, 35:741-744.
17. Fukuda K, Kobayashi S: A study on a self-rating depression scale.
Seishin Shinkeigaku Zasshi 1973, 75:673-679. (in Japanese)
18. Ware JE, Snow KK, Kosinski M, Gandek B: SF-36 health survey manual
& interpretation guide Boston, New England Medical Center; 1993.
ROC curves of the MHI-5 and MHI-3 for detecting severe depressive symptoms (ZSDS above 55)Figure 1
ROC curves of the MHI-5 and MHI-3 for detecting severe
depressive symptoms (ZSDS above 55).
1 - Specificity
1.00.75.50.250.00
Sensitivity
1.00
.75
.50
.25
0.00
MHI5
MHI3
Publish with BioMed Central and every
scientist can read your work free of charge
"BioMed Central will be the most significant development for
disseminating the results of biomedical research in our lifetime."
Sir Paul Nurse, Cancer Research UK
Your research papers will be:
available free of charge to the entire biomedical community
peer reviewed and published immediately upon acceptance
cited in PubMed and archived on PubMed Central
yours — you keep the copyright
Submit your manuscript here:
/>BioMedcentral
Health and Quality of Life Outcomes 2005, 3:48 />Page 7 of 7
(page number not for citation purposes)
19. Metz CE: Basic principles of ROC analysis. Semin Nucl Med 1978,
8:283-298.
20. Swets JA, Pickett RM, Whitehead SF, Getty DJ, Schnur JA, Swets JB,
Freeman BA: Assessment of diagnostic technologies. Science
1979, 205:753-759.
21. Hanley JA, McNeil BJ: The meaning and use of the area under a
receiver operating characteristic (ROC) curve. Radiology
1982, 143:29-36.
22. Hanley JA, McNeil BJ: A method of comparing the areas under
receiver operating characteristic curves derived from the
same cases. Radiology 1983, 148:839-843.
23. Kawakami N, Takatsuka N, Shimizu H, Ishibashi H: Depressive
symptoms and occurrence of type 2 diabetes among Japa-
nese men. Diabetes Care 1999, 22:1071-6.