báo cáo hóa học: " The comparative burden of mild, moderate and severe Fibromyalgia: results from a cross-sectional survey in the United States" pdf
Bạn đang xem bản rút gọn của tài liệu. Xem và tải ngay bản đầy đủ của tài liệu tại đây (335.52 KB, 13 trang )
RESEARCH Open Access
The comparative burden of mild, moderate and
severe Fibromyalgia: results from a cross-sectional
survey in the United States
Caroline Schaefer
1*
, Arthi Chandran
2
, Meghan Hufstader
1
, Rebecca Baik
1
, Michael McNett
3
, Don Goldenberg
4
,
Robert Gerwin
5
and Gergana Zlateva
2
Abstract
Background: Fibromyalgia (FM) is characterized by chronic, widespread pain, fatigue, and other symptoms; yet few
studies have comprehensively assessed its humanistic burden. This observational study evaluates the impact of FM
severity on patients’ symptoms, health-related quality of life (HRQoL), and productivity in the United States.
Methods: 203 FM subjects were recruited from 20 physician offices. Subjects completed a questionnaire inclu ding
the EuroQol 5D (EQ-5D), Fibromyalgia Impact Questionnaire (FIQ), Multidimensional Assessment of Fatigue (MAF),
Medical Outcomes Study Sleep Scale (MOS-SS), and Hospital Anxiety and Depression Scale (HADS) and questions
about demographics, pain and other symptoms, HRQoL and productivity. FIQ total scores were used to define FM
severity, with 0- < 39, 39- < 59, and 59-100, representing mild, moderate, and severe FM, respectively. Sites
recorded subjects’ clinical characteristics and FM treatment on case report forms using medical records. Summary
statistics were calculated for continuous variables and frequency distributions for categorical variables. Differences
across FM severity groups were evaluate d using the Kruskal-Wallis or Chi-square tests. Statistical significance was
evaluated at the 0.05 level.
Results: Mean (SD) age was 47.9 (10.9); 95% were female. Most (92%) were prescribed medication for FM; 24% and
66% reported moderate and severe FM, respectively. Mean (SD) scores were: 6.3 (2.1) for pain intensity; 0.35 (0.35)
for EQ-5D; 30.7 (14.2) for MAF; 57.5 (18.4) for MOS-SS Sleep Problems Index; 10.2 (4.8) for HADS anxiety and 9.4 (4.4)
for HADS depression. Subjects with worse FM severity reported significantly increased pain severity, HRQoL, fatigue,
sleep disturbance, anxiety and depression (p < 0.001). Overall, 50% of subjects reporte d some disruption in their
employment due to FM; this differed across severity levels (p < 0.001). Employed subjects missed a mean (SD) of
1.8 (3.9) workdays during the past 4 weeks; this also differed across severity levels (p = 0.03).
Conclusions: FM imposes a substantial humanistic burden on patients in the United States, and leads to
substantial productivity loss, despite treatment. This burden is higher among subjects with worse FM severity.
Keywords: Fibromyalgia, Quality of Life, Patient Outcomes Assessment, Burden of Illness, Health Resources
Background
Fibromyalgia (FM) is characterized by chronic, wide-
spread, musculoskeleta l pain and is estimated to affect 2
to 6 percent of the g eneral population in the United
States (US), pri marily women [1,2]. FM patien ts often
also experience a number of other symptoms, such as
fatigue, sleep disturbance, headache, irritable bowel syn-
drome, cognitive dysfunction, and mo od disorders [1-4].
Consequently, FM patients frequently report limitations
in physical function, and activities of daily living (ADL),
as well as decrements in other physical and mental
domains of health-related quality of life (HRQoL) [5-7].
In addition, recent studies also established an associa-
tion between pain in FM and mental symptoms that
could not be found in p atients with neuropathic pain
[4,8]. Another study found pain intensity reduction to
* Correspondence:
1
Health Economics and Outcomes Research, Covance Market Access Services
Inc., Gaithersburg, MD USA
Full list of author information is available at the end of the article
Schaefer et al. Health and Quality of Life Outcomes 2011, 9:71
/>© 2011 Schaefer et al; licensee BioMed Central Ltd. This is an Open Access article distributed under the terms of the Creative
Commons Attribution License ( which permits unrestricted use, distribution , and
reproduction in any medium, provided the original work is properly cited.
be associated with im provements in other FM outcomes
[9]. Lastly, a negative impact of FM on work productiv-
ity also has been reported in the literature [5,7,10,11].
The Outcome Measures in Rheumatology Clinical
Trials (OMERACT) workgroup on FM has identified
domains that should be captured in clinical trials for
FM therapies and aspects of domains and outcome mea-
sures that should be part of a concerted research agenda
for FM researchers [12]. The identified domains
included pain, patient global health, fatigue, HRQoL,
multidimensional function, sleep, depression, physical
function, tenderness, dyscognition, and anxiety.
Recent studies in Europe have e xplored the impact of
FM on HRQoL and other OMERACT domains more
comprehensively; [13] however, few cross-sectional stu-
dies have been conducted that include a comprehensive
assessment of the burden of illness associated with FM
in the US. Previous US studies have examined the
impact of FM on patients’ HRQoL [14] or focused on
one aspect of disease burden, such as limitations in
functioning [3] or sleep problems [15,16]. In particular,
there is a gap in the literature that examines the disease
burden by FM severity levels.
The objective of this study was to better understand
FM patients in the US by conducting a comprehensive
evaluation of their clinical and comorbid profile, and the
impact of FM severity on HRQoL, symptom domains
(such as, pain, sleep, depression), and pro ductivity loss
for patients and caregivers.
Methods
Study Design
This cross-sectional, observationa l study included 203
FM subjects recruited from 20 community-based physi-
cian offices (8 primary care physicians, 6 rheumatolo-
gists, 3 neurologists, and 3 psychiatrists) in the US.
Subjects were required to have the following: a prior
FM diagnosis by a rheumatologist or pain specialist,
experienced widespread pain (above and below the waist
and on both sides of the body) for 3 months or more,
experienced pain in the past 24 hours, and been in
treatment at the enrolling physician’ s practice for at
least 3 months. Additionally, all subjects had to be
between 18 and 65 years of age and were excluded if
they had participated in an invest igational drug st udy
within 30 days prior to the survey or had a concomitant
illness unrelated to FM that was likely to confound the
assessment of FM, such as osteoarthritis, lupus, or rheu-
matoid arthritis.
The protocol was approved by a central institutional
review board and all subject s provided written informed
consent. No medical interventions were required by the
study protocol. Site study staff identified potential sub-
jects during routine visits. Once consent was obtained,
subjects were asked to complete a questionnaire that
assessed FM’ s impact on the core OMERACT domains,
as well as productivity (subject questionnaire). Site staff
completed a case report form (CRF) based on review of
the subject’s medical records and assessed FM using the
ManualTenderPointSurvey(MTPS)exam[17].Data
captured on the CRF included subject’sdemographics,
clinical characteristics, current and previous medications
for FM, and frequency of the following: FM-related
office visits, diagnostic tests, emergency room visits, and
hospitalizations. The subject questionnaire and CRF
were labeled with a study-specific subject identifier that
was assigned at enrollment to allow linking of the sub-
jects’ clinical and HRQoL data for analysis.
Subject Questionnaire
The subject questionnaire included 5 validated HRQoL
questionnaires: the EuroQol (EQ-5D) [18], the Fibro-
myalgia Impact Questionnaire (FIQ) [19,20], the Multi-
dimensional Assessment of Fatigue (MAF) [21], the
Medical Outcomes Study Sleep Scale (MOS-SS) [22],
and the Hospita l Anxiety and Depressi on Scale (HAD S)
[23].
The EQ-5D describes HRQoL across 5 dimensions:
mobility, self-care, performance of usual activities, pain
or discomfort, and anxiety or depression [18]. Subjects
indicate their health state by selecting the most ap pro-
priate response (i.e., no problems, some problems, or
extreme problems) for each statement within each
dimension. Health state valuation scores range from
-0.594 to 1.00 with a higher score indicating better
HRQoL [18].
The FIQ measures FM subject’s status, pro gress, and
outcomes in 10 areas: physical impairment, feeling good,
work missed, doing work, pain, fatigue/tired, rested,
stiffness, anxiety, and depression [19]. The impact of
FM on activities of daily living (ADLs) (i.e., preparing
meals, doing laundry, climbing stairs, shopping, yard
work, driving a car, visiting friends, washing dishes,
vacuuming, making beds, and walking several blocks)
was evaluated using the FIQ Physical Impairment Score
which ranges from 0 to 10. The FIQ total score reflects
all ten areas and ranges from 0 to 100. Higher scale
scores indicate a greater impact of the disease.
The MAF measures 4 dimensions of fatigue: severity,
distress, timing, and degree of interference in ADLs
[21]. The scores from the 4 dimensions are summed to
calculate the Global Fatigue Index (GFI), which ranges
from 1 (indicating no fatigue) to 50 (indicating severe
fatigue).
The MOS-SS includes the 9-item Sleep Problems
Index score and 6 subscales: sleep disturbances, snoring,
awakening short of breath or with a headache, sleep
adequacy, somnolence, and sleep quantity [22]. With the
exception of sleep quantity, the subscales and the 9-item
Schaefer et al. Health and Quality of Life Outcomes 2011, 9:71
/>Page 2 of 13
Sleep Problems Index scores range from 0 to 100. The
sleep quantity scale is the mean number of hours of
sleep per night reported over the past week. Higher
scores represent more of the concept being measured.
The HADS is designed to detect the presence and
severity of mood disorders and has been used exten-
sively in a variety of populations [23]. The HADS Anxi-
ety and Depression subscale scores range from 0 to 21,
with higher scores representing more symptoms and
poorer emotional well-being. Scores of 0 to 7 on either
subscale are considered normal, 8 to 10 are considered
mild, 11 to 14 are considered moderate, and 15 to 21
are considered severe.
To assess pain intensity, subjects were asked to rate
their average pain due to FM over the past 24 hours
with an 11-point numeric rating scale ranging from 0
(indic ating no pain) to 10 (indicating pain as bad as you
can imagine). Higher scores indicate greater pain sever-
ity. Based on previous analyses, scores of 0 to 3 are con-
sidered mild, 4 to 6 are considered moderate, and 7 to
10 are considered severe [24].
Study-specifi c questions also were developed to assess
the following: average pain over the past 24 hours,
impact of FM on daily life, overall health status, cogni-
tive function, and subject and caregiver productivity
over the past four weeks (e.g., subject-reported time
missed f rom work, reduced productivity at work, hours
of unpaid help from caregiver).
Statistical Analysis
Means, standard deviations (SD), medians, and ranges
were calculated for continuous variables and frequency
counts and percentages were calculated for categorical
variables. To evaluate the impact of FM severity, out-
comes reported on the subject questionnai res and CRFs
were compared across 3 FM severity level classificati ons
(i.e., mild, moderate, and severe) using the Kruskal-
Wallis test. Categorical outcomes were compared across
FM severity level using a Chi-square test. FM severity
level was defined based on the subject’s FIQ to tal score
where 0 to < 39 was classified as mild, 39 to < 59 was
classified as moderate, and 59 to 100 was classified as
severe [20]. Statistica l significance was evaluated at the
0.05 level. The data were held and analyzed by Covance
Inc. All analyses were performed using SAS version 9.1
[25].
Results
Demographic Characteristics
The study enrolled 203 subjects. Subject demographics
are summarized in Table 1. The mean age was 47.9, and
almost all (95%) were female. Nearly half (41%) of the
subjects were employed either full-ti me or part-time for
pay and nearly another half (41%) were disabled, unem-
ployed, or retired. Age and gender did not differ signifi-
cantly across FM severity levels. Employment status
differed across severity levels (p < 0.001) with a higher
proportion of mild FM subjects (71.4%) being employed
for pay either full-time or part-time than moderate
(61.2%) or severe (28.5%) subjects. Additionally, a higher
proportion of severe FM subjects (52.6%) re ported being
disabled, unemployed, or retired than mild (9.6%) or
moderate (22.4%).
Table 1 Demographic Characteristics, Overall and by Fibromyalgia Severity Level
Severity Level
Characteristic Overall
(n = 203)
Mild
(n = 21)
Moderate
(n = 49)
Severe
(n = 133)
p-value
a
Age, years 0.148
mean (SD) 47.9 (10.9) 48.6 (11.9) 45.3 (11.0) 48.7 (10.6)
median 50.0 53.0 46.0 50.0
range 19.0 - 65.0 28.0 - 65.0 19.0 - 64.0 21.0 - 65.0
Gender, n (%) 0.621
Male 11 (5.4) 2 (9.5) 3 (6.1) 6 (4.5)
Female 192 (94.6) 19 (90.5) 46 (93.9) 127 (95.5)
Employment status, n (%) < 0.001
Employed, full-time 57 (28.1) 13 (61.9) 18 (36.7) 26 (19.5)
Employed, part-time 26 (12.8) 2 (9.5) 12 (24.5) 12 (9.0)
Disabled 55 (27.1) 0 (0.0) 7 (14.3) 48 (36.1)
Full-time homemaker 25 (12.3) 4 (19.0) 5 (10.2) 16 (12.0)
Unemployed 16 (7.9) 1 (4.8) 1 (2.0) 14 (10.5)
Retired 12 (5.9) 1 (4.8) 3 (6.1) 8 (6.0)
Other 8 (3.9) 0 (0.0) 2 (4.1) 6 (4.5)
Student 4 (2.0) 0 (0.0) 1 (2.0) 3 (2.3)
a
Chi-square test or the Kruskal-Wallis test, as appropriate.
Source: Subject Questionnaire.
Schaefer et al. Health and Quality of Life Outcomes 2011, 9:71
/>Page 3 of 13
Clinical Characteristics
On average, subjects reported having FM symptoms for
longer (mean of 10.7 years) than having an FM diagno-
sis (mean of 6.9 years) or than having received prescrip-
tion medications for FM (mean of 6.3 years) (Table 2).
Severe FM subjects, on average, had more positive
MTPS points with mean of 15.2 compared to mild sub-
jects with a mean of 13.7 and moderate subjects with a
mean of 13.8 (p = 0.036). Additionally, over half (54%) of
the subjects reported severe average pain intensity with a
higher proportion of severe FM subjects (66%) reporting
severe average pain intensity compared to mild (14%)
and moderate (37%) FM subjects (p < 0.001) (Table 2).
Subjects were active ly seeking care at the time of the
study. Most (92%) were taking 1 or more prescription
medications for F M and approximately half (47%) were
taking 3 or more. In addition, subjects reported a mean
of 16.9 physician visits over the past year (Table 2).
Comorbid Conditions
Overall, subjects had a mean number of 4.2 comorbid
conditions. While not significa nt (p = 0.112), there was
a t rend toward an increasing number of comorbid con-
ditions as FM severity worsened from 2.9 for mild FM
subjects to 4.4 for severe FM subjects (Table 2).
Approximately half or more subjects had comorbid con-
ditions of sleep disturbance/insomnia (68%), depressive
symptoms (58%), headache/migraine (52%), or anxiety
(50%) as reported by the physicians on the CRF (Table
3). Depressive symptoms (p < 0.001), anxiety (p =
0.002), chronic fatigue syndrome (p = 0.003), and major
depressive disorder (p = 0.024) differed significantly
across FM severity levels. For these conditions, the pro-
portion of subjects with the condition increased as FM
severity increased, except for chronic fatigue syndrome,
which was most frequently reported among subjects
with moderate FM.
Table 2 Clinical Characteristics and Treatment Patterns, Overall and by Fibromyalgia Severity Level
Severity Level
Characteristic Overall
(n = 203)
Mild
(n = 21)
Moderate
(n = 49)
Severe
(n = 133)
p-value
a
Time since first experienced FM symptoms, years 0.684
mean (SD) 10.7 (8.1) 10.8 (6.3) 10.1 (8.1) 10.9 (8.3)
median (range) 9.0 (0.0 - 48.0) 10.0 (3.0 - 23.0) 9.0 (1.0 - 32.0) 9.0 (0.0 - 48.0)
Time since diagnosis, years
mean (SD) 6.9 (6.5) 7.4 (6.1) 6.2 (6.2) 7.0 (6.6) 0.604
median (range) 6.0 (0.0 - 48.0) 6.0 (0.0 - 22.0) 4.0 (0.0 - 30.0) 6.0 (0.0 - 48.0)
Time since first prescription for FM, years 0.670
mean (SD) 6.3 (6.2) 7.2 (6.6) 5.9 (6.6) 6.2 (6.0)
median (range) 4.5 (0.0 - 30.0) 5.0 (0.0 - 22.0) 3.0 (0.0 - 30.0) 5.0 (0.0 - 21.0)
Number of positive MTPS points 0.036
mean (SD) 14.7 (3.4) 13.7 (4.1) 13.8 (3.8) 15.2 (3.0)
median (range) 16.0 (4.0 - 18.0) 16.0 (5.0 - 18.0) 15.0 (4.0 -18.0) 16.0 (4.0 - 18.0)
Number of comorbid conditions
b
0.112
mean (SD) 4.2 (2.4) 2.9 (1.6) 4.1 (2.3) 4.4 (2.6)
median (range) 4.0 (1.0-10.0) 3.0 (1.0-7.0) 4 (1.0-10.0) 4.0 (1.0-10.0)
Average pain intensity, n (%) < 0.001
Mild (0-3) 20 (9.9) 12 (57.1) 7 (14.3) 1 (0.8)
Moderate (4-6) 74 (36.6) 6 (28.6) 24 (49.0) 44 (33.3)
Severe (7-10) 108 (53.5) 3 (14.3) 18 (36.7) 87 (65.9)
Number of physician visits (per year) < 0.001
mean (SD) 16.9 (17.9) 9.7 (11.3) 11.6 (11.2) 19.9 (19.9)
median (range) 12.0 (4.0 - 132.0) 4.0 (4.0 - 48.0) 8.0 (4.0 - 52.0) 16.0 (4.0 - 132.0)
Number of medications over the past 3 months, n (%)
≥ 1 medication 37 (91.6) 19 (90.5) 43 (87.8) 124 (93.2) 0.487
≥ 3 medications 48 (47.3) 3 (14.3) 22 (44.9) 71 (53.4) 0.004
a
Chi-square test or the Kruskal-Wallis test, as appropriate
b
Among subjects with at least one comorbid condition (n = 190 overall; n = 15 mild; n = 47 moderate; n = 128 severe)
Source: Clinical CRF.
Schaefer et al. Health and Quality of Life Outcomes 2011, 9:71
/>Page 4 of 13
Impact of FM on Health-Related Quality of Life and Core
FM Symptoms
When asked to rank areas of daily life af fected by FM,
most subjects reported pain ( 91%) and lack of energy/
fatigue (87%). Over half reported that FM impacted
their sleep (54%) and caused them difficulty walking,
moving, or exercising (51%) (Table 4).
The overall mean average pain intensity over the past
24 hours was 6.3. Average Pain Intensity differed across
FM severity levels (p < 0.001) with mean scores of 3 .4
for mild, 5.6 for moderate, and 7.0 for severe (Table 5).
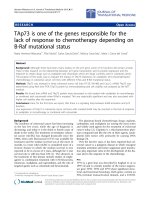
With respect to overall health, subjects reported a
mean EQ-5D score of 0.35 (Table 5; Figure 1). Subjects
had significantly different EQ-5D scores across FM
severity levels (p < 0.001; Table 5). Mild FM subjects
had a mean EQ-5D score of 0.76, moderate subjects
0.57, and severe subjects 0.20.
The mean current overall health rating was 5 4.9, and
subjects estimated that their overall health rating would
be 24.4 points higher (Pain-Free Overall health mean of
79.3), on average, if they had complete relief of FM-
related pain. The current Overall Health Score
decreasedasFMseverityworsened(p<0.001)asdid
subjects’ estimates of their pain-free overall health (p <
0.001) (Table 5). Mild, moderate, and severe FM sub-
jects e stimated that their overall health rating would be
13.6, 21.5, and 27.2 points higher (Pain-Free Overall
Health = 84.6, 84.2, and 76.6), respec tively, if they had
complete relief of FM-related pain.
Table 3 Comorbid Conditions, Overall and by Fibromyalgia Severity Level
Severity Level
Comorbid condition, n (%)
a
Total
(n = 203)
Mild
(n = 21)
Moderate
(n = 49)
Severe
(n = 133)
p-value
b
Sleep disturbance/Insomnia 138 (68.0) 11 (52.4) 35 (71.4) 92 (69.2) 0.259
Depressive Symptoms 117 (57.6) 5 (23.8) 20 (40.8) 92 (69.2) < 0.001
Headache/migraine 105 (51.7) 10 (47.6) 26 (53.1) 69 (51.9) 0.915
Anxiety 101 (49.8) 4 (19.0) 20 (40.8) 77 (57.9) 0.002
Chronic Fatigue Syndrome 86 (42.4) 2 (9.5) 26 (53.1) 58 (43.6) 0.003
Irritable Bowel Syndrome 74 (36.5) 5 (23.8) 17 (34.7) 52 (39.1) 0.384
Restless Leg Syndrome 58 (28.6) 3 (14.3) 16 (32.7) 39 (29.3) 0.281
Cognitive Dysfunction 55 (27.1) 2 (9.5) 15 (30.6) 38 (28.6) 0.154
Major Depressive Disorder 47 (23.2) 0 (0.0) 11 (22.4) 36 (27.1) 0.024
Raynaud’s Syndrome 15 (7.4) 2 (9.5) 5 (10.2) 8 (6.0) 0.584
a
Subjects may have more than one condit ion; thus, percents may sum to more than 100%.
b
Chi-square test.
Source: Clinical CRF.
Table 4 Impact of Fibromyalgia on Areas of Daily Life, Overall and by Fibromyalgia Severity Level
Areas of Daily Life
Impacted by FM
n (%)
Severity Level
Total
(n = 203)
Mild
(n = 21)
Moderate
(n = 49)
Severe
(n = 133)
p-value
a
Pain 183 (90.6) 19 (90.5) 43 (89.6) 121 (91.0) 0.960
Lack of energy/fatigue 175 (86.6) 5 (23.8) 23 (47.9) 75 (56.4) 0.019
Sleep disturbance 109 (54.0) 17 (81.0) 44 (91.7) 114 (85.7) 0.421
Difficulty moving, walking, or
exercising
103 (51.0) 13 (61.9) 24 (50.0) 72 (54.1) 0.658
Limited daily life and
household activities
92 (45.5) 9 (42.9) 14 (29.2) 32 (24.1) 0.187
Stiffness 85 (42.1) 13 (61.9) 31 (64.6) 41 (30.8) < 0.001
Depression 81 (40.1) 12 (57.1) 20 (41.7) 45 (33.8) 0.105
Tender at touch 77 (38.1) 4 (19.0) 16 (33.3) 61 (45.9) 0.036
Problems with attention 55 (27.2) 2 (9.5) 3 (6.3) 29 (21.8) 0.030
Anxiety 34 (16.8) 6 (28.6) 22 (45.8) 64 (48.1) 0.247
Other 9 (4.5) 1 (4.8) 0 (0.0) 8 (6.0) 0.223
a
Chi-square test.
Source: Subject Questionnaire.
Schaefer et al. Health and Quality of Life Outcomes 2011, 9:71
/>Page 5 of 13
Table 5 Health-Related Quality of Life Scores, Overall and by Fibromyalgia Severity Level
Severity Level
Scale Overall
(N = 203)
Mild
(N = 21)
Moderate
(N = 49)
Severe
(N = 133)
p-value
a
EQ-5D
Health State Valuation < 0.001
n 203 21 49 133
mean (SD) 0.35 (0.35) 0.76 (0.11) 0.57 (0.21) 0.20 (0.31)
median (range) 0.52 (0.2- 1.0) 0.76 (0.6 - 1.0) 0.62 (0.0 - 1.0) 0.09 (0.2 - 0.8)
Overall Health Status
Ratings
Current Overall Health < 0.001
n 203 21 49 133
mean (SD) 54.9 (21.0) 71.0 (21.5) 62.7 (16.9) 49.4 (20.1)
median (range) 50.0 (2.0- 100.0) 75.0 (10.0 - 95.0) 65.0 (10.0 - 90.0) 50.0 (2.0 - 100.0)
Pain-Free Overall Health 0.001
n 202 21 49 132
mean (SD) 79.3 (20.4) 84.6 (23.9) 84.2 (19.4) 76.6 (19.8)
median (range) 89.5 (0.0-100.0) 90.0 (10.0 - 100.0) 90.0 (0.0 - 100.0) 80.0 (15.0 - 100.0)
Average Pain Intensity < 0.001
n 202 21 49 132
mean (SD) 6.3 (2.1) 3.4 (2.0) 5.6 (1.8) 7.0 (1.6)
median (range) 7.0 (1.0-100.0) 3.0 (1.0 - 7.0) 6.0 (2.0 - 8.0) 7.0 (3.0 - 10.0)
FIQ n/a
b
Total Score
n 203 21 49 133
mean (SD) 63.2 (19.0) 23.9 (9.5) 49.3 (5.1) 74.5 (9.1)
median (range) 67.4 (6.0-99.0) 25.9 (6.0 - 38.1) 48.6 (39.9 - 58.9) 73.4 (59.1 - 99.0)
Physical Impairment n/a
b
n 203 21 49 133
mean (SD) 5.1 (2.4) 2.4 (2.6) 3.8 (2.1) 6.0 (1.8)
median (range) 5.0 (0.0-10.0) 1.0 (0.0 - 10.0) 4.0 (0.0 - 10.0) 6.0 (0.0 - 10.0)
Feel Good n/a
b
n 203 21 49 133
mean (SD) 7.1 (2.8) 3.1 (2.9) 6.0 (2.3) 8.2 (2.1)
median (range) 7.1 (0.0-10.0) 2.9 (0.0 - 10.0) 5.7 (0.0 - 10.0) 8.6 (0.0 - 10.0)
Work Missed n/a
b
n 202 21 49 132
mean (SD) 4.5 (3.5) 0.9 (2.3) 2.2 (2.3) 5.9 (3.2)
median (range) 4.3 (0.0-10.0) 0.0 (0.0 - 10.0) 1.4 (0.0 - 10.0) 6.4 (0.0 - 10.0)
Do Work n/a
b
n 201 21 49 131
mean (SD) 6.4 (2.7) 1.8 (1.6) 4.7 (1.8) 7.8 (1.6)
median (range) 7.0 (0.0-10.0) 2.0 (0.0 - 5.0) 5.0 (0.0 - 7.0) 8.0 (4.0 - 10.0)
Pain n/a
b
n 203 21 49 133
mean (SD) 7.0 (2.3) 3.0 (1.6) 6.0 (1.8) 7.9 (1.6)
median (range) 7.0 (1.0-10.0) 3.0 (1.0 - 7.0) 6.0 (2.0 - 9.0) 8.0 (3.0 - 10.0)
Fatigue/Tired n/a
b
n 203 21 49 133
mean (SD) 7.9 (2.3) 3.5 (2.0) 6.8 (1.9) 8.9 (1.2)
median (range) 8.0 (0.0-10.0) 4.0 (0.0 - 7.0) 7.0 (3.0 - 10.0) 9.0 (4.0 - 10.0)
Rested n/a
b
n 203 21 49 133
Schaefer et al. Health and Quality of Life Outcomes 2011, 9:71
/>Page 6 of 13
Table 5 Health-Related Quality of Life Scores, Overall and by Fibromyalgia Severity Level (Continued)
mean (SD) 7.9 (2.3) 4.1 (2.3) 7.1 (1.8) 8.8 (1.6)
median (range) 8.0 (0.0-10.0) 5.0 (0.0 - 8.0) 7.0 (3.0 - 10.0) 9.0 (2.0 - 10.0)
Stiffness n/a
b
n 203 21 49 133
mean (SD) 7.2 (2.4) 3.6 (2.3) 6.4 (1.7) 8.1 (1.9)
median (range) 8.0 (0.0-10.0) 3.0 (0.0 - 9.0) 6.0 (2.0 - 10.0) 9.0 (2.0 - 10.0)
Anxiety n/a
b
n 203 21 49 133
mean (SD) 5.1 (3.2) 1.1 (1.7) 3.2 (2.2) 6.4 (2.8)
median (range) 5.0 (0.0-10.0) 0.0 (0.0 - 6.0) 3.0 (0.0 - 7.0) 7.0 (0.0 - 10.0)
Depression n/a
b
n 203 21 49 133
mean (SD) 5.1 (3.2) 0.6 (0.8) 3.2 (2.4) 6.5 (2.6)
median (range) 6.0 (0.0-10.0) 0.0 (0.0 - 2.0) 3.0 (0.0 - 9.0) 7.0 (0.0 - 10.0)
MOS Sleep
Sleep Problems Index < 0.001
n 203 21 49 133
mean (SD) 57.5 (18.4) 34.4 (13.6) 50.7 (16.9) 63.7 (15.6)
median (range) 58.3 (13.3-95.6) 33.9 (13.3 - 65.6) 47.8 (20.6 - 88.9) 65.0 (24.4 - 95.6)
Sleep Disturbance < 0.001
n 203 21 49 133
mean (SD) 56.4 (25.3) 31.6 (22.5) 49.0 (22.0) 63.1 (23.8)
median (range) 56.3 (5.0-100.0) 26.3 (5.0 - 78.8) 42.5 (10.0 - 100.0) 66.3 (5.0 - 100.0)
Sleep Adequacy < 0.001
n 203 21 49 133
mean (SD) 27.9 (23.6) 46.2 (21.8) 34.9 (24.4) 22.5 (21.6)
median (range) 30.0 (0.0-90.0) 50.0 (0.0 - 80.0) 40.0 (0.0 - 90.0) 20.0 (0.0 - 70.0)
Sleep Somnolence < 0.001
n 203 21 49 133
mean (SD) 52.3 (26.0) 27.6 (17.4) 45.0 (24.0) 58.8 (24.9)
median (range) 53.3 (0.0-100.0) 20.0 (6.7 - 80.0) 40.0 (0.0 - 100.0) 60.0 (0.0 - 100.0)
Snoring 0.026
n 201 21 49 131
mean (SD) 43.3 (36.0) 22.9 (26.3) 46.1 (35.2) 45.5 (36.8)
median (range) 40.0 (0.0-100.0) 20.0 (0.0 - 100.0) 40.0 (0.0 - 100.0) 40.0 (0.0 - 100.0)
Shortness of Breath or Headache 0.001
n 202 21 49 132
mean (SD) 34.3 (30.8) 14.3 (20.1) 29.4 (30.3) 39.2 (30.9)
median (range) 40.0 (0.0-100.0) 0.0 (0.0 - 60.0) 20.0 (0.0 - 100.0) 40.0 (0.0 - 100.0)
Sleep Quantity 0.002
n 194 21 49 124
mean (SD) 6.3 (1.9) 6.8 (1.1) 6.8 (2.0) 6.0 (1.9)
median (range) 6.0 (1.0-12.0) 7.0 (4.0 - 9.0) 7.0 (1.0 - 11.0) 6.0 (2.0 - 12.0)
MAF
Global Fatigue Index < 0.001
n 203 21 49 133
mean (SD) 30.7 (14.2) 16.5 (7.1) 26.3 (12.6) 34.6 (13.8)
median (range) 35.8 (2.5-50.0) 17.5 (2.5 - 27.2) 29.6 (7.5 - 49.5) 39.4 (7.5 - 50.0)
HADS
Anxiety < 0.001
n 203 21 49 133
mean (SD) 10.2 (4.8) 5.5 (3.6) 7.3 (4.2) 12.0 (4.1)
Schaefer et al. Health and Quality of Life Outcomes 2011, 9:71
/>Page 7 of 13
The overall mean FIQ Total Score was 63.2 (Table 5),
with 10 percent, 24 percent and 66 percent of subjects
reportin g mild, moderate, and severe scores, respectively.
The highest mean FIQ subscale scores were observed in
the following areas: rested 7.9, fatigue/tired 7.9, and stiff-
ness 7.2 (Table 5). The mean Physical Impairment FIQ
score was 5.1. Mild FM subjects reported a mean of 2.4,
moderate subjects 3.8, and severe subjects 6.0, respectively.
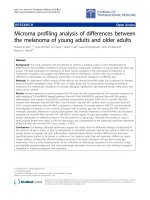
Subjects reported a mean MOS-SS Sleep Problems
Index score of 57.5 and Sleep Quantity of 6.3 hours
(Table 5; Figure 2). The most affected area was Sleep
Adequacy, with a mean score of 27.9. Subjects reported
mean MOS Sleep Problems Index scores of 34.4, 50.7,
and 63.7 for the respective FM severity groups, indicat-
ing increasing sleep problems with more severe FM (p <
0.001). Severe FM subjects also reported fewer hours of
sleep (mean: 6.0 compared to mild 6.8 and moderate
FM subjects 6.8; p = 0.002).
ThemeanHADSAnxietyscorewas10.2(Table5),
with 19 percent, 33 percent, and 19 percent of the sub-
jects reporting mild, moderate and severe levels of anxi-
ety, respectively. The mean HADS Depression score was
9.4, with 25 percent, 26 percent, and 13 percent of t he
subjects reporting mild, moderate, a nd severe levels of
depression, respectively. Subjects indicated increased
anxiety with more severe FM with mean HADS Anxiety
scores of 5.5, 7.3, and 12.0 for mild, mode rate, and
severe FM, respectively (p < 0.001). Similarly the HA DS
Depression scores indicated increased depression with
more severe FM with mean depression scores of 3.2,
7.2, and 11.3 for mild, moderate, and severe FM, respec-
tively (p < 0.001).
Physicians reported cognitive dysfunction to be a
comorbid condition for 27 perce nt of the study sample
(Table 3) and 27 p ercent of subjects stated FM caused
them to have problems with attention (Table 4). A
majority of subjects reported that FM “moderately” ,
“ very much” or “ totally” impacted their ability to
remember (76%), concentrate (75%), think (64%), and
make decisions (61%). Additionally, as severity level
worsened, the impact of FM on these areas of cognitive
function significantly increased (p < 0.001; Table 6).
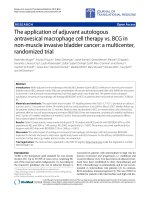
Impact of FM on Productivity
Overall, half (50%) of the subjects reported some disrup-
tion in their work status due to FM, including reduced
work schedule (10%), disabled (21%), unemployed or
retired early (19%) (Figure 3). A dditionally, 15 percent
of mild subjects reported some disruption in their work
status due to FM compared to 45 percent of moderate
subjects and approximately 60 percent of severe subjects
(p < 0.001).
Employed subjects reported missing a mean of 1.8
days of work due to FM over the last 4 weeks (Table 7).
Extrapolating, this represents a mean of 23.2 days of
work missed per year due to FM. On average, employed
subjects reported working with symptoms 15.6 days
over the last 4 weeks and being 75 percent effective in
their work-related activities when working wi th
symptoms.
The mean n umber of days missed from work during
the past 4 weeks also increased with FM severity with
mild subjects reporting missing 0.4 days, moderate
reporting 1.0 day, and severe reporting 3.0 days (p =
0.030); corresponding to an annual average of 5, 13, and
39 days of worked missed per year for mild, moderate,
and severe FM subjects, respectively (Table 7). Addition-
ally, mild subjects reporting working with symptoms
Table 5 Health-Related Quality of Life Scores, Overall and by Fibromyalgia Severity Level (Continued)
median (range) 11.0 (0.0-12.0) 4.0 (1.0 - 12.0) 7.0 (0.0 - 16.0) 12.0 (2.0 - 21.0)
Depression < 0.001
n 203 21 49 133
mean (SD) 9.4 (4.4) 3.2 (2.7) 7.2 (2.6) 11.3 (3.8)
median (range) 9.0 (0.0-21.0) 2.0 (0.0 - 9.0) 7.0 (1.0 - 12.0) 11.0 (2.0 - 21.0)
a
Kruskal-Wallis test.
b
P-value not noted due to the association between severity level and FIQ score.
* Source: Subject Questionnaire.
0.87
0.35
0.76
0.57
0.20
0.0
0.1
0.2
0.3
0.4
0.5
0.6
0.7
0.8
0.9
1.0
US Norms Overall Sample
(
n=203
)
Mild
(
n=21
)
Moderate
(
n=49
)
Severe
(
n=133
)
EQ-5D Score
Figure 1 Impact of Fibromyalgia on HRQoL: Mean Study
Sample EQ-5D Scores Compared to US General Population.
Source: Subject Questionnaire and Fryback et al, 2007 (US Norm for
age range 45-54) [28]. Note: Higher scores indicate better HRQoL.
Schaefer et al. Health and Quality of Life Outcomes 2011, 9:71
/>Page 8 of 13
over the past 4 weeks a mean of 6.9 days, moderate
reporting 15.3 days, and s ever e repo rting 19.4 days (p <
0.001) This corresponds to an average of 89, 199, and
252 days worked with sym ptoms annually, for mild,
mod erate, and severe subjects , respectively. On average,
mild, moderate, and severe subjects reported being 90
percent, 78 percent, and 68 percent effective while
working with FM symptoms, respectively (p = 0.002).
FM caregivers provided mild, moderate, and severe
FM subjects unpaid help for ADLs a mean of 3.6, 22.8,
and 35.4 hours over the past 4 weeks, respectively (p =
0.003). This c orresponds to a n average of 47, 296, and
460 hours a year of unpaid caregiver help for ADLs for
mild, moderate, and severe FM subjects, respectively.
Discussion
This is one of the few studies in the US to c omprehen-
sively assess the core FM symptom dimensions identi-
fied by OMERACT and to explore the disease burden of
FM by disease severity levels. Although the majority of
patients in this study were receiving prescription medi-
cations to treat FM, they reported high levels of pain,
anxiety, depression, sleep disturbance, cognitive dysfunc-
tion, and functional limitations. These findings were
consistent with some previous study results:
• Pain,anxiety,anddepression-Over half of all
patients reported being in s evere pain due to FM, and a
majority reported some level of anxiety (70%) or
depression (65%), which is consistent with other
research [4,7,8].
• Sleep, shortness of breath and headache - Over-
all, patients experienc ed substantially more sleep pro-
blems than the general US population, as indicated by
a higher MOS-SS Problem Index score of 57.5, versus
the US norm of 25.8 (Figure 2) [26]. There was a dif-
ference of 32.6 between the US norm (60.5) and our
study (27.9) for the sleep adequacy subscale; indicat-
ing that FM patients had less adequate sleep. FM
patients in our study also reported higher scores for
shortness of breath or headache, sleep disturbance,
daytime somnole nce, and snoring as compared to the
US norms (Figure 2). Our findings are consistent with
recent literature reporting that over 90 percent of FM
patients suffer from troubled and non-restorative
sleep [27].
• Cognitive dysfunction - A majority of our study
sample reported cognitive dysfunction with over 88 per-
cent of p atients reporting at least so me limitations in
concentration, making decisions, thinking, and memory
due to FM. This is consistent with a case-control study
which showed that FM patients performed significantly
worse on several measures of cognitive function (work-
ing memory capacity, free recall, recognition memory
and verbal knowledge) than age-matched controls and
that patients’ performance on these measures were simi-
lar or worse than adults 20 years older [6].
57.5
56.4
27.9
52.3
43.3
34.3
25.8
24.5
60.5
21.9
28.3
9.5
0.0
10.0
20.0
30.0
40.0
50.0
60.0
70.0
80.0
90.0
100.0
Sleep
Problem
Index
Sleep
Disturbance
Sleep
Adequacy
Sleep
Somnolence
Snoring Shortness of Breath
or Headache
MOS-SS Score
Study Sample US Norm
Figure 2 Impact of Fibromyalgia on Sleep: Mean Study Sample MOS-S S Scores Compared to US General Population. Source: Subject
Questionnaire and Hays et al, 2005 (US Norms for age range 18-94) [26]. Note: Higher scores indicate more of the concept being measured.
Higher scores represent worse outcomes on all scales except for sleep adequacy, where higher scores represent better outcomes.
Schaefer et al. Health and Quality of Life Outcomes 2011, 9:71
/>Page 9 of 13
• Functional limitations - Our findings also are con-
sistent with published studies showing FM patients
report much higher functional limitations compared to
the general population. In our study, the mean FIQ
score was 63.2. A Canadian study that compared FM
patients with general population controls found a mean
FIQ score of 61.2 among FM patients versus 21.9
among the controls [5]. A national survey of women in
the US with FM and a mean age of 47 years, found that
the mean level of physical functioning in their overall
sample was lower than that for an average 80 to 89 year
old [3].
Patients also demonstrated diminished global health
and HRQoL. Mean EQ-5D scores for subjects in our
study, overall (0.35) and at all FM severity l evels (0.76
mild; 0.57 moderate; 0.20 severe), were substantially
lower than the mean EQ-5D score for the US popula-
tion age 45 to 54 (0.87) [28]. These results are c onsis-
tent with other studies reporting substantial health
status limitations among FM patients [29,30] and that
FM patients have worse SF-36 scor es on the subscales
of physical functioning, role functioning (emot iona l and
physical), body pain, general health, vitality, social func-
tioning, and mental health compared with the general
population [7,30].
Perhaps due to the large pain burden and detrimental
impact on various domains of health, the overall
HRQoL found in FM patients, especially in those with
severe form of disease, was not only worse than that of
the general population but also in comparison with
many other chronic conditions reported in the utility
and generi c HRQoL literature [7]. This finding also was
in line with studies comparing FM with similar condi-
tions. In particular, FM patients were s hown to have
worse HRQoL than patients with rheumatoid arthritis,
and patients with non-inflammatory rheumatic disorders
and systemic lupus erythematosus [14,31].
Our study showed that FM has a substantial negative
impact on productivity, with the overall sample report-
ing an average of more than 23 days missed from work
per year. A meta-analysis of FM burden reviewed stu-
dies that reported that FM patients missed between 11
and 31 days of work per year [7]. Of those who were
unemployed in our study, 38 percent reported they were
Table 6 Subject-reported Impact of Fibromyalgia on Cognitive Function, Overall and by Fibromyalgia Severity Level
Cognitive Area Overall
(n = 203)
Mild
(n = 21)
Moderate
(n = 49)
Severe
(n = 133)
p-value
a
Concentrate,
n (%)
< 0.001
Not at all 9 (4.4) 4 (19.0) 4 (8.2) 1 (0.8)
A little 41 (20.2) 11 (52.4) 15 (30.6) 15 (11.3)
Moderately 49 (24.1) 4 (19.0) 14 (28.6) 31 (23.3)
Very much 82 (40.4) 2 (9.5) 15 (30.6) 65 (48.9)
Totally 22 (10.8) 0 (0.0) 1 (2.0) 21 (15.8)
Remember,
n (%)
< 0.001
Not at all 11 (5.4) 5 (23.8) 4 (8.2) 2 (1.5)
A little 38 (18.7) 10 (47.6) 14 (28.6) 14 (10.5)
Moderately 43 (21.2) 4 (19.0) 9 (18.4) 30 (22.6)
Very much 89 (43.8) 2 (9.5) 21 (42.9) 66 (49.6)
Totally 22 (10.8) 0 (0.0) 1 (2.0) 21 (15.8)
Make Decisions, n (%) < 0.001
Not at all 24 (11.8) 9 (42.9) 4 (8.2) 11 (8.3)
A little 56 (27.6) 9 (42.9) 24 (49.0) 23 (17.3)
Moderately 51 (25.1) 2 (9.5) 13 (26.5) 36 (27.1)
Very much 63 (31.0) 1 (4.8) 8 (16.3) 54 (40.6)
Totally 9 (4.4) 0 (0.0) 0 (0.0) 9 (6.8)
Think, n (%) < 0.001
Not at all 19 (9.4) 8 (38.1) 7 (14.3) 4 (3.0)
A little 54 (26.6) 9 (42.9) 16 (32.7) 29 (21.8)
Moderately 53 (26.1) 3 (14.3) 14 (28.6) 36 (27.1)
Very much 64 (31.5) 1 (4.8) 12 (24.5) 51 (38.3)
Totally 13 (6.4) 0 (0.0) 0 (0.0) 13 (9.8)
a
Chi-square test.
Source: Subject Questionnaire.
Schaefer et al. Health and Quality of Life Outcomes 2011, 9:71
/>Page 10 of 13
disabled due to FM. This is consistent with literature
reporting 31 percent of FM patients in a sample were
disabled due to FM [5].
This is the first US study to explore the impact of FM
on caregiver productivity. The study found that, on
average, caregivers spent the equivalent of almost 10
work weeks ( 378 hours) providing unpaid help to
patients with FM per year. This finding highlights the
importance of incorporating caregivers’ time when
assessing the full economic impact of FM on society.
50%
85%
55%
40%
16%
5%
27%
29%
21%
10%
16%
10%
19%
13%
5%
0%
10%
20%
30%
40%
50%
60%
70%
80%
90%
100
%
Overall
(n=188)
Mild
(n=21)
Moderate
(n=44)
Severe
(n=123)
Percent of Subjects
None Disabled due to FM
Reduced work schedule due to FM Unemployed or retired early due to FM
Figure 3 Impact of Fibromyalgia on Employment: Overall and by Severity Level. Source: Subject Questionnaire. * P-value < 0.001 ( Chi-
square test; mild vs. moderate vs. severe by impact of FM on employment status).
Table 7 Impact of Fibromyalgia on Productivity over the Past 4 Weeks, Overall and by Fibromyalgia Severity Level
Severity Level
Overall Mild Moderate Severe p-value
a
Days missed from work due to FM
b
0.030
n 78142935
mean (SD) 1.8 (3.9) 0.4 (0.9) 1.0 (1.4) 3.0 (5.4)
median (range) 0.0 (0.0-28.0) 0.0 (0.0-3.0) 0.0 (0.0-4.0) 1.0 (0.0-28.0)
Days worked with symptoms related to FM
b
< 0.001
n 81153036
mean (SD) 15.6 (9.0) 6.9 (7.4) 15.3 (7.7) 19.4 (8.2)
median (range) 17.0 (0.0-28.0) 5.0 (0.0-28.0) 17.0 (0.0-28.0) 20.0 (0.0-28.0)
Average effectiveness at work on days with FM symptoms
b
0.002
n 70112831
mean (SD) 75.3 (18.3) 89.8 (11.0) 77.7 (15.1) 67.9 (19.7)
median (range) 80.0 (20.0-100.0) 90.0 (70.0-100.0) 80.0 (30.0-100.0) 75.0 (20.0-100.0)
Hours of unpaid caregiver help for FM in activities of daily living 0.003
n 203 21 49 133
mean (SD) 29.1 (88.5) 3.6 (7.0) 22.8 (100.3) 35.4 (90.4)
median (range) 5.0 (0.0-720.0) 0.0 (0.0 - 30.0) 0.0 (0.0 - 700.0) 8.0 (0.0 - 720.0)
a
Kruskal-Wallis test.
b
Among subjects employed for pay (full-time or part-time).
Source: Subject Questionnaire.
Schaefer et al. Health and Quality of Life Outcomes 2011, 9:71
/>Page 11 of 13
This study is also the first in the US to comprehen-
sively report the burden of FM by disease severity levels.
FM severity was negatively and significantly associated
with most patient-reported outcomes, such as pain
intens ity, anxiety and depression, sleep problems, cogni-
tive dysfunction, as well as overall HRQoL and utility
scores. Severe FM also was more likely to be accompa-
nied by comorbid depression, anxiety, or chronic fatigue
syndrome than mild or moderate FM.
This new understanding of FM by severity level is very
important for the evaluation of FM treatments and
priority setting in health care, for example by providing
input data for the evaluation of medical reso urce utiliza-
tion, costs and quality of life adjustments in the health
economic evaluation of alternative FM treatments.
Although this study w as comprehensive, it had some
possible limitations. Only practices that volunteered to
participate were included in the study. Although there is
no specific reason to assume that these sites may differ
from other practices that treat F M, there may be
unknown underlying variations. Additionally, data were
collected from pati ents who we re actively seeking care;
we do not have similar objective data for patients who
did not enroll. Therefore, our results may not be gener-
alizable to the overall FM population. Our study’s inclu-
sion criteria required that patients have experienced
pain in the past 24 hours; perhaps biasing our overall
sample towards more severe FM. Therefore, results for
the overall FM population should be taken with some
caution, and where appropriate, results reported by
severity groups should be used as comparative or input
data in future research. Finally, this study was cross-sec-
tional, and therefore we cannot establish causality, only
the association between FM and outcomes.
Conclusion
This study represents one of the first attempts to char-
acterize the full patient experience of FM patients’ dis-
ease, function, HRQoL, and productivity losses in the
US. Although the majority of patients were receiving
medical attention and prescription medications for FM,
they reported high levels of pain, anxiety, depression,
sleep disturbance, cognitive dysfunction, and diminished
HRQoL, as well as substantial losses in productivity for
them and their caregivers. P atients’ health status and
other key symptom domains worsened as FM severity
increased. These results highlight the disease burden
and limitations of treatment options currently available
in the US.
List of Abbreviations
ADLs: Activities of Daily Living; CRF: Case Report Form; EQ-5D: EuroQol 5
Dimensions; FIQ: Fibromyalgia Impact Questionnaire; FM: Fibromyalgia; GFI:
Global Fatigue Index; HADS: Hospital Anxiety and Depression Scale; HRQoL:
Health Related Quality of Life; MAF: Multidimensional Assessment of Fatigue;
MOS-SS: Medical Outcomes Study - Sleep Scale; MTPS: Manual Tender Point
Survey; OMERACT: Outcome Measures in Rheumatology Clinical Trials; SD:
Standard Deviation; US: United States.
Acknowledgements
This study was funded by Pfizer, Inc. The authors would like to thank
Kathryn Anastassopoulos and Agota Szende, employees of Covance Market
Access Services, for their assistance with the manuscript.
Author details
1
Health Economics and Outcomes Research, Covance Market Access Services
Inc., Gaithersburg, MD USA.
2
Primary Care Health Economics and Outcomes
Research, Pfizer Global Health Economics, New York, NY USA.
3
APAC Centers
for Pain Management, Chicago, IL USA.
4
Division of Rheumatology, Newton-
Wellesley Hospital, Newton, MA USA; Division of Rheumatology, Tufts
Medical Center, Tufts University School of Medicine, Boston, MA USA.
5
Pain
& Rehabilitation Medicine, Bethesda, MD USA.
Authors’ contributions
CS, MH, RB, AC and GZ were integral to this study and to the development
of this manuscript MM, DG, and RG served as clinical reviewers and
contributors to the analysis and discussion sections. All authors have read
and approved the final manuscript.
Competing interests
This study was funded by Pfizer, Inc. Arthi Chandran and Gergana Zlateva
are employees of Pfizer Inc. Caroline Schaefer, Meghan Hufstader, and
Rebecca Baik are employees of Covance Market Access Services Inc, and
served as paid consultants to Pfizer during the conduct of this study and
the development of this manuscript.
Received: 19 April 2011 Accepted: 22 August 2011
Published: 22 August 2011
References
1. Wolfe F, Ross K, Anderson J, Russell IJ, Hebert L: The prevalence and
characteristics of fibromyalgia in the general population. Arthritis Rheum
1995, 38:19-28.
2. Weir PT, Harlan GA, Nkoy FL, Jones SS, Hegmann KT, Gren LH, Lyon JL:
Incidence of Fibromyalgia and Its Associated Comorbidities. Journal of
Clinical Rheumatology 2006, 12(3):124-128.
3. Jones J, Rutledge DN, Jones KD, Matallana L, Rooks DS: Self-Assessed
Physical Function Levels of Women with Fibromyalgia: A National Study.
Women’s Health Issues 2008, 18:406-412.
4. Arnold LM, Hudson JI, Keck PE Jr, Auchenback MB, Javaras KN, Hess EV:
Comorbidity of fibromyalgia and psychiatric disorders. J Clin Psychiatry
2006, 67:1219-1225.
5. White KP, Speechley M, Harth M, Ostbye T: The London Fibromyalgia
Epidemiology Study: Comparing self-reported function and work
disability in 100 community cases of fibromyalgia syndrome versus
controls in London, Ontario. Arthritis and Rheumatism 1999, 42(1):76-83.
6. Park DC, Glass JM, Minear M, Crofford LJ: Cognitive Function in
Fibromyalgia Patients. Arthritis and Rheumatism 2001, 44(9):2125-2133.
7. Annemans L, Le Lay K, Taïeb C: Societal and patient burden of
fibromyalgia syndrome. Pharmacoeconomics 2009, 27(7):547-559.
8. Gormsen L, Rosenberg R, Bach FW, Jensen TS: Depression, anxiety, health-
related quality of life and pain in patients with chronic fibromyalgia and
neuropathic pain. Eur J Pain 2010, 14(2):127, e1-8.
9. Moore RA, Straube S, Paine J, Phillips CJ, Derry S, McQuay HJ: Fibromyalgia:
Moderate and substantial pain intensity reduction predicts improvement
in other outcomes and substantial quality of life gain. Pain 2010,
149(2):360-364.
10. Robinson RL, Birnbaum HG, Morley MA, Sisitsky T, Greenberg PE, Claxton AJ:
Economic cost and epidemiological characteristics of patients with
fibromyalgia claims. J Rheumatol 2003, 30(6):1318-1325.
11. White LA, Birnbaum HG, Kaltenboeck A, Tang J, Mallett D, Robinson RL:
Employees with fibromyalgia: medical comorbidity, healthcare costs,
and work loss. J Occup Environ Med 2008, 50:13-24.
12. Mease PJ, Clauw DJ, Arnold LM, et al: Fibromyalgia syndrome. J Rheumatol
2005, 32:2270-2277.
Schaefer et al. Health and Quality of Life Outcomes 2011, 9:71
/>Page 12 of 13
13. Perrot S, Winkelmann A, Dukes E, Xu X, Schaefer C, Ryan K, Chandran A,
Sadosky A, Zlateva G: Characteristics of patients with fibromyalgia in
France and Germany. Int J Clin Pract 2010, 64(8):1100-1108.
14. Wolfe F, Michaud K, Li T, Katz RS: EQ-5D and SF-36 quality of life
measures in systemic lupus erythematosus: comparisons with
rheumatoid arthritis, noninflammatory rheumatic disorders, and
fibromyalgia. J Rheumatol 2010, 37(2):296-304.
15. Bigatti SM, Hernandez AM, Cronan TA, Rand KL: Sleep disturbances in
fibromyalgia syndrome: relationship to pain and depression. Arthritis
Rheum 2008, 59(7):961-967.
16. Cappelleri JC, Bushmakin AG, McDermott AM, Dukes E, Sadosky A,
Petrie CD, Martin S: Measurement properties of the Medical Outcomes
Study Sleep Scale in patients with fibromyalgia. Sleep Med 2009,
10(7):766-770.
17. Sinclair JD, Starz TW, Turk DC: The Manual Tender Point Survey Pittsburgh,
PA: University of Pittsburgh Medical Center. Copyright 1997 by the
University of Pittsburgh Medical Center, Center for Continuing Education in
the Health Sciences. Instructions adapted from The Manual Tender Point
Survey, by JD Sinclair TW Starz and DC Turk; 1997 [ware.
org/News2eb58.html?page=NewsArticle&id=6263], Instructions adapted
from The Manual Tender Point Survey, by JD Sinclair TW Starz and DC Turk,
accessed on September 2, 2011. .
18. EuroQol Group: EuroQol: a new facility for the measurement of health
related quality of life. Health Policy 1990, 16(3):199-208.
19. Burckhardt CS, Clark SR, Bennett RM: The Fibromyalgia Impact
Questionnaire: Development and validation. J Rheumatol 1991,
18(5):728-734.
20. Bennett RM, Bushmakin AG, Cappelleri JC, Zlateva G, Sadosky A: Minimal
Clinically Important Difference in the Fibromyalgia Impact
Questionnaire. J Rheumatol 2009, 36(6):1304-1311.
21. Belza B, Henke C, Yelin E, Epstein W, Gilliss C: Correlates of fatigue in older
adults with rheumatoid arthritis. Nursing Research 1993, 42(2):93-99.
22. Hays RD, Stewart AL: Sleep measures. In Measuring Functioning and Well-
being: the Medical Outcomes Study Approach. Edited by: Stewart AL, Ware JE,
Durham, NC. Duke University Press; 1992:235-259.
23. Zigmond A, Snaith RP: The Hospital Anxiety and Depression Scale. Acta
Psychiatrica Scandinavica 1983, 67:361-370.
24. Zelman D, Dukes E, Brandenburg N, Bostrom A, Gore M: Identification of
cut-points for mild, moderate and severe pain due to diabetic
peripheral neuropathy. Pain 2005, 115(1-2):29-36.
25. SAS Institute, Cary, North Carolina. .
26. Hays RD, Martin SA, Sesti AM, Spritzer KL: Psychometric properties of the
Medical outcomes Study Sleep measure. Sleep Med 2005, 6(1):41-44.
27. Moldofsky H: The significance, assessment, and management of
nonrestorative sleep in fibromyalgia syndrome.
CNS Spectr 2008,
13(3):22-26.
28. Fryback DG, Dunham NC, Palta M, Hanmer J, Buechner J, Cherepanov D,
Herrington SA, Hays RD, Kaplan RM, Ganiats TG, Feeny D, Kind P: U.S.
Norms from six generic health-related quality-of-life indexes from the
National Health Measurement Study. Med Care 2007, 45(12):1162-70.
29. Wolfe F, Anderson J, Harkness D, Bennett RM, Caro XJ, Goldenberg DL,
Russell IJ, Yunus MB: Health status and disease severity in fibromyalgia.
Arth Rheum 1997, 40(9):1571-1579.
30. Salaffi F, Sarzi-Puttini P, Girolimetti R, Atzeni F, Gasparini S, Grassi W: Health-
related quality of life in fibromyalgia patients: a comparison with
rheumatoid arthritis patients and the general population using the SF-
36 health survey. Clin Exp Rheumatol 2009, 27(5 Suppl 56):S67-74.
31. Hoffman DL, Dukes EM: The health status burden of people with
fibromyalgia: a review of studies that assessed health status with the
SF-36 or the SF-12. International Journal of Clinical Practice 2008,
62(1):115-126.
doi:10.1186/1477-7525-9-71
Cite this article as: Schaefer et al.: The comparative burden of mild,
moderate and severe Fibromyalgia: results from a cross-sectional survey
in the United States. Health and Quality of Life Outcomes 2011 9:71.
Submit your next manuscript to BioMed Central
and take full advantage of:
• Convenient online submission
• Thorough peer review
• No space constraints or color figure charges
• Immediate publication on acceptance
• Inclusion in PubMed, CAS, Scopus and Google Scholar
• Research which is freely available for redistribution
Submit your manuscript at
www.biomedcentral.com/submit
Schaefer et al. Health and Quality of Life Outcomes 2011, 9:71
/>Page 13 of 13