Barfield Raiborn Kinney Cost Accounting_4 potx
Bạn đang xem bản rút gọn của tài liệu. Xem và tải ngay bản đầy đủ của tài liệu tại đây (572.18 KB, 50 trang )
Managers in many manufacturing companies are concerned about the product
costing information being provided by the traditional cost accounting systems. The
general consensus is that product costs currently being developed are useful in
preparing financial statements, but are often of limited use for management deci-
sion making. Activity-based costing, on the other hand, is useful in companies hav-
ing the following characteristics:
1. the production or performance of a wide variety of products or services;
2. high overhead costs that are not proportional to the unit volume of individual
products;
3. significant automation that has made it increasingly more difficult to assign
overhead to products using the traditional direct labor or machine-hour bases;
4. profit margins that are difficult to explain; and
5. hard-to-make products that show big profits and easy-to-make products that
show losses.
6
Companies having the above characteristics may want to reevaluate their cost sys-
tems and implement activity-based costing.
Two-Step Allocation
After being recorded in the general ledger and subledger accounts, costs are ac-
cumulated in activity center cost pools. An activity center is a segment of the
production or service process for which management wants a separate report of
Part 2 Systems and Methods of Product Costing
142
Paying the Postman
NEWS NOTE GENERAL BUSINESS
The U.S. Postal Service (USPS) is a unique federal entity
in several respects. First, the USPS, in essence, oper-
ates in a manner similar to many private sector compa-
nies. The USPS provides a variety of services, generates
revenue from these services, and incurs costs and ex-
penses as a result of its operations. Second, the USPS
is unique in that it is open to private sector competition.
Competition includes companies such as Federal Ex-
press, United Parcel Service, Mail Boxes, Etc., and a host
of other similar companies. Few other governmental
agencies or departments operate in a similar business
environment.
Retailers as well as USPS competitors have long ac-
cepted credit cards as payments for goods and services.
Moreover, new technologies are beginning to lead to a
“cashless” world. Customers are seeking convenience
and value, while businesses are striving for increased
sales and guaranteed payment. Given the competitive
forces facing the USPS and the rapid pace at which new
technologies are becoming available, USPS manage-
ment realized that it had to use innovative business meth-
ods to maintain and increase its market share against the
competition and provide increased value to its customers
while ensuring cost effectiveness.
Based on this evaluation of its position in the market-
place, the USPS engaged Coopers and Lybrand (C&L)*
to conduct activity-based cost studies of its key revenue
collection processes for a national credit card and debit
card program. To obtain an understanding of the cash,
check, and credit/debit card activities, C&L reviewed
USPS data and procedure manuals, interviewed USPS
headquarters staff, and conducted telephone surveys of
front window supervisors and district office accounting
personnel. Using an activity-based cost modeling ap-
proach, C&L defined the cash and check process in
terms of the activities that link together to make the
processes.
In summarizing its findings, C&L reported that, “Credit
and debit card processing costs are relatively high at the
moment due to the normal impact of process start-up,
low initial volume and high initial implementation costs.
However, as volumes continue to grow, projected credit
and debit card costs can become competitive with cur-
rent cash and check processing costs.
*now PricewaterhouseCoopers
SOURCE
: Terrell L. Carter, Ali M. Sedaghat, and Thomas D. Williams, “How ABC
Costs Changed the Post Office,”
Strategic Finance
(February 1998), pp. 20–36.
6
Robin Cooper, “You Need a New Cost System When . . . ,” Harvard Business Review (January–February 1989), pp. 77–82.
How does the installation of an
activity-based costing system
affect behavior?
activity center
5
Chapter 4 Activity-Based Cost Systems for Management
143
the costs of activities performed. In defining these centers, management should
consider the following issues: geographical proximity of equipment, defined cen-
ters of managerial responsibility, magnitude of product costs, and a need to keep
the number of activity centers manageable. Costs having the same driver are ac-
cumulated in pools reflecting the appropriate level of cost incurrence (unit, batch,
or product/process). The fact that a relationship exists between a cost pool and a
cost driver indicates that, if the cost driver can be reduced or eliminated, the re-
lated cost should also be reduced or eliminated.
Gathering costs in pools reflecting the same cost drivers allows managers to
recognize cross-functional activities in an organization. In the past, some compa-
nies may have accumulated overhead in smaller-than-plantwide pools, but this ac-
cumulation was typically performed on a department-by-department basis. Thus,
the process reflected a vertical-function approach to cost accumulation. But pro-
duction and service activities are horizontal by nature. A product or service flows
through an organization, affecting numerous departments as it goes. Using a cost
driver approach to develop cost pools allows managers to more clearly focus on
the various cost impacts created in making a product or performing a service than
was possible traditionally.
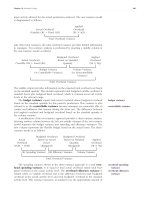
After accumulation, costs are allocated out of the activity center cost pools and
assigned to products and services by use of a second driver. These drivers are often
referred to as activity drivers. An activity driver measures the demands placed on
activities and, thus, the resources consumed by products and services. An activity
driver selected often indicates an activity’s output. The process of cost assignment
is the same as the overhead application process illustrated in Chapter 3. Exhibit
4–7 illustrates this two-step process of tracing costs to products and services in an
ABC system.
activity driver
EXHIBIT 4–7
Tracing Costs in an Activity-
Based Costing System
Setup Cost
$
Overhead
Dollars
Consumed
Machine
Power Cost
Warehouse
Cost
Number of setups
Number of
machine hours
Square footage of
occupied space
Number of setup
hours
Processing time
per unit
Storage time per
square foot occupied
COSTS INITIALLY
RECORDED
(By department and
general ledger accounts)
COST
DRIVER
(Used to assign
costs to cost pools)
ACTIVITY
CENTER
COST POOL
ACTIVITY
DRIVER
(Used to assign
costs to cost objects)
COST
OBJECTS
resulting
from
Value-
Added
Activities
Non-Value-
Added
Activities
Work to eliminate
or reduce
Individual products
As noted in Exhibit 4–7, the cost drivers for the collection stage may differ
from the activity drivers used for the allocation stage because some activity center
costs are not traceable to lower levels of activity. Costs at the lowest (unit) level
of activity should be allocated to products by use of volume- or unit-based dri-
vers. Costs incurred at higher (batch and product/process) levels may also be al-
located to products by use of volume-related drivers, but the volume measure
should include only those units associated with the batch or the product/process—
not total production or service volume. Exhibit 4–8 provides some common drivers
for various activity centers.
Activity-Based Costing Illustrated
An ABC example is shown in Exhibit 4–9. Information is gathered about the ac-
tivities and costs for a factory maintenance department. Costs are then assigned to
specific products based on activities. This department allocates its total personnel
cost among the three activities performed in that department based on the num-
ber of employees in those areas. This allocation reflects the fact that occurrences
of a specific activity, rather than volume of production or service, are indicative of
work performed in the department.
This company manufactures Product Z, which is a rather complex unit with
relatively low demand. The cost allocated to Product Z with the activity-based cost-
ing system is 132 percent higher than the cost allocated with the traditional allo-
cation system ($1.564 versus $0.675)!
Discrepancies in costs between traditional and activity-based costing methods
are not uncommon. Activity-based costing systems indicate that significant resources
are consumed by low-volume products and complex production operations. Stud-
ies have shown that, after the implementation of activity-based costing, the costs
of high-volume, standard products have often been too high and, using ABC, have
declined anywhere from 10 to 30 percent. Low-volume, complex specialty prod-
uct costs tend to increase from 100 to 500 percent, although in some cases these
costs have risen by 1,000 to 5,000 percent!
7
Thus, activity-based costing typically
Part 2 Systems and Methods of Product Costing
144
Activity Center Activity Drivers
Accounting Reports requested; dollars expended
Personnel Job change actions; hiring actions; training hours; counseling
hours
Data processing Reports requested; transactions processed; programming
hours; program change requests
Production engineering Hours spent in each shop; job specification changes requested;
product change notices processed
Quality control Hours spent in each shop; defects discovered; samples
analyzed
Plant services Preventive maintenance cycles; hours spent in each
shop; repair and maintenance actions
Material services Dollar value of requisitions; number of transactions processed;
number of personnel in direct support
Utilities Direct usage (metered to shop); space occupied
Production shops Fixed per-job charge; setups made; direct labor; machine
hours; number of moves; material applied
SOURCE
: Michael D. Woods, “Completing the Picture: Economic Choices with ABC,”
Management Accounting
(De-
cember 1992), p. 54. Reprinted from
Management Accounting.
Copyright by Institute of Management Accountants,
Montvale, N.J.
EXHIBIT 4–8
Activity Drivers
7
Peter B. B. Turney, An Introduction to Activity-Based Costing (ABC Technologies, Inc., 1990), video.
shifts a substantial amount of overhead cost from standard, high-volume products
to premium special-order, low-volume products, as shown in Exhibit 4–10. The
ABC costs of moderate products and services (those that are neither extremely sim-
ple nor complex, nor produced in extremely low or high volumes) tend to remain
approximately the same as the costs calculated using traditional costing methods.
Although the preceding discussion addresses costs normally considered prod-
uct costs, activity-based costing is just as applicable to service department costs.
Many companies use an activity-based costing system to allocate corporate over-
head costs to their revenue-producing units based on the number of reports, doc-
uments, customers, or other reasonable measures of activity.
Short-Term and Long-Term Variable Costs
Short-term variable costs increase or decrease corresponding with changes in the
volume of activity. Costs that do not move in relation to volume have conven-
tionally been accepted as fixed. “Generally [however], as a business expands, costs
tend to be far more variable than they should be, and when it contracts, they are
far more fixed than they should be.”
8
Professor Robert Kaplan of Harvard Univer-
sity considers the ability of “fixed” costs to change under the “Rule of One,” which
means that possessing or using more than one unit of a resource is evidence that
Chapter 4 Activity-Based Cost Systems for Management
145
Factory Maintenance Department: The company’s conventional system assigns the personnel costs of this department to products
using direct labor hours (DLHs); the department has 9 employees and incurred $450,000 of personnel costs in the current year or
$50,000 per employee. Expected DLHs are 200,000.
ABC ALLOCATION
Stage 1
Trace costs from general ledger and subsidiary ledger accounts to activity center pools according to number of employees:
■
Regular maintenance—uses 5 employees; $250,000 is allocated to this activity; second-stage allocation to be based on machine
hours (MHs)
■
Preventive maintenance—uses 2 employees; $100,000 is allocated to this activity; second-stage allocation to be based on number
of setups
■
Repairs—uses 2 employees; $100,000 is allocated to this activity; second-stage allocation is based on number of machine starts
Stage 2
Allocate activity center cost pools to products using cost drivers chosen for each cost pool.
2001 activity of second-stage drivers: 500,000 MHs; 5,000 setups; 100,000 machine starts
Step 1: Allocate costs per unit of activity of second-stage cost drivers.
■
Regular maintenance—$250,000 Ϭ 500,000 MHs ϭ $0.50 per MH
■
Preventive maintenance—$100,000 Ϭ 5,000 setups ϭ $20 per setup
■
Repairs—$100,000 Ϭ 100,000 machine starts ϭ $1 per machine start
Step 2: Allocate costs to products using quantity of second-stage cost drivers consumed in making these products. The following
quantities of activity are relevant to Product Z: 30,000 MHs; 30 setups; 40 machine starts; and 3,000 DLHs out of a total
of 200,000 DLHs in 2001. Ten thousand units of Product Z were manufactured during 2001.
ABC Allocation to Product Z ϭ (30,000 ϫ $0.50) ϩ (30 ϫ $20) ϩ (40 ϫ $1) ϭ $15,640 for 10,000 units or $1.564 per unit
Traditional Allocation to Product Z ϭ $450,000 Ϭ 200,000 DLHs ϭ $2.25 per DLH; (3,000 ϫ $2.25) ϭ $6,750 for 10,000 units or
$0.675 per unit
EXHIBIT 4–9
Illustration of Activity-Based
Costing Allocation
8
B. Charles Ames and James D. Hlavacek, “Vital Truths About Managing Your Costs,” Harvard Business Review (January–
February 1990), p. 145.
the resource is variable.
9
Because of this logic, many people have come to view
fixed costs as long-term variable costs, for which suitable (usually non-volume-
related) cost drivers simply need to be identified.
Two significant cost drivers that cause long-term variable costs to change, but
which traditionally have been disregarded, are product variety and product com-
plexity. Product variety refers to the number of different types of products made;
product complexity refers to the number of components included in a product;
process complexity refers to the number of processes through which a product
flows. These items create additional overhead (such as warehousing, purchasing,
setups, and inspections), so long-term variable costs tend to increase as the number
and types of products increase. Therefore, managers should use these cost drivers
in applying ABC.
Attribute-Based Costing
Attribute-based costing (ABC II), an extension of activity-based costing, employs
detailed cost–benefit analyses relating to information on customer needs (in terms of
performance attributes of a product such as reliability, durability, responsiveness,
and so forth) and the costs of the incremental improvements necessary to obtain
these attributes. ABC II employs planned costs rather than past costs because, as
discussed earlier, such a high percentage of a product’s life-cycle costs are locked
in during the product’s development stage. The approach focuses on satisfying cus-
tomer needs by searching for the optimum enhancement of customer utility through
comparisons of alternatives for attribute enhancements relative to the costs of pro-
ducing those enhancements.
10
Part 2 Systems and Methods of Product Costing
146
EXHIBIT 4–10
Traditional versus ABC
Overhead Allocations
$300,000
$150,000
$50,000
$325,000
$125,000
$50,000
Traditional
Overhead
Allocation
(amounts
assumed)
Total overhead of $500,000 allocated alternatively:
Activity-
Based
Costing
Overhead
Allocation
(amounts
assumed)
Standard
Product
Moderate
Product
Premium
Product
Standard
Product
Moderate
Product
Premium
Product
long-term variable cost
product variety
product complexity
process complexity
9
Patrick L. Romano, “Activity Accounting: An Update—Part 2,” Management Accounting (June 1989), p. 63.
10
For additional information, see Mike Walker, “Attribute Based Costing,” Australian Accountant (March 1992), pp. 42–45.
What is attribute-based costing
and how does it extend activity-
based costing?
attribute-based costing
(ABC II)
6
Chapter 4 Activity-Based Cost Systems for Management
147
11
T. L. Estrin, Jeffrey Kantor, and David Albers, “Is ABC Suitable for Your Company?” Management Accounting (April 1994),
p. 40.
12
Harold P. Roth and A. Faye Borthick, “Are You Distorting Costs by Violating ABC Assumptions?” Management Accounting
(November 1991), pp. 39–40.
13
B. Joseph Pine, “Customers Don’t Want Choices,” The Wall Street Journal (April 18, 1994), p. A12.
DETERMINING WHETHER ABC IS APPROPRIATE
A vital loss of information may occur in an accounting system that ignores activ-
ity and cost relationships. Not every accounting system using direct labor or ma-
chine hours as the cost driver is providing inadequate or inaccurate cost informa-
tion. However, some general clues may alert managers to the need to review the
cost data being provided by a conventional accounting system. Some of these clues
are more relevant to manufacturing entities, but others are equally appropriate for
both manufacturing and service businesses. Consider the following:
For a given organization, is it likely that ABC will produce costs that are
significantly different from those that are generated with conventional ac-
counting, and does it seem likely that those costs will be “better”? The factors in-
volved here include:
•
the number and diversity of products or services produced,
•
the diversity and differential degree of support services used for different
products,
•
the extent to which common processes are used,
•
the effectiveness of current cost allocation methods,
•
and the rate of growth of period costs.
If information that is considered “better” is generated by ABC, will the new
information change the dependent decisions made by the management? The
factors involved here are:
•
management’s freedom to set prices,
•
the ratio of period costs to total costs,
•
strategic considerations,
•
the climate and culture of cost reduction in the company,
•
and the frequency of analysis that is desirable or necessary.
11
Two primary underlying assumptions that companies must consider before adopt-
ing ABC are that the costs in each cost pool are (1) driven by homogeneous ac-
tivities and (2) strictly proportional to the activity.
12
If these assumptions are met,
the following circumstances may indicate a need to consider using activity-based
costing.
With Product Variety and Product Complexity
Product variety is commonly associated with a need to consider activity-based cost-
ing. Products may be variations of the same product line (such as Hallmark’s dif-
ferent types of greeting cards), or they may be in numerous product families (such
as Procter & Gamble’s detergents, diapers, fabric softeners, and shampoos). In either
case, product additions cause numerous overhead costs to increase.
In the quest for product variety, many companies are striving for mass cus-
tomization of products through the use of flexible manufacturing systems. Such
personalized production can often be conducted at a relatively low cost. Although
such customization may please some customers, it does have some drawbacks. First,
there may simply be too many choices. For instance, at GE Fanuc (a Charlottesville,
Virginia, manufacturer), customers had to look through several 4-inch-thick binders
of components to design a custom-made product—an extremely time-consuming
project.
13
Nissan reportedly had 87 different varieties of steering wheels, but cus-
tomers did not want many of them and disliked having to choose from so many
mass customization
When is activity-based costing
appropriate in an organization?
7
sanmotors
.com
options.
14
Second, mass customization creates a tremendous opportunity for errors.
And third, most companies have found that customers, given the wide variety of
choices, typically make selections from a rather small percentage of the total. At
Toyota, investigation of purchases revealed that 20 percent of the product varieties
accounted for 80 percent of the sales.
15
This 20:80 ratio is a fairly common one
and is referred to as the Pareto principle, after the Italian economist Vilfredo
Pareto.
16
Companies with complex products, services, or processes may want to inves-
tigate ways to reduce that complexity. Management may want to review the de-
sign of the company’s products and processes to standardize them and reduce the
number of different components, tools, and processes required. Products should
be designed to consider the Pareto principle and take advantage of commonality
of parts. An analysis of components will generally reveal that 20 percent of the
components are used in 80 percent of the products. If this is the case, then com-
panies need to consider two other factors. First, are the remaining components
used in key products? If so, could equal quality be achieved by using the more
common parts? If not, can the products be sold for a premium price to cover the
costs associated with the use of low-volume components? Second, are the parts
specified for use in products purchased by important customers who are willing
to pay a premium price for the products? If so, the benefits from the complexity
may be worth the cost. However, would customers be equally satisfied if more
common parts were used and the product price were reduced? Complexity is ac-
ceptable only if it is value-added from the customer’s point of view.
Process complexity may develop over time, or it may exist because of a lack
of sufficient planning in product development. Processes are complex when they
create difficulties for the people attempting to perform production operations (phys-
ical straining, awkwardness of motions, or wasted motions) or for the people us-
ing manufacturing machinery (multiple and/or detailed setups, lengthy transfer time
between machine processes, recalibration of instruments, and so on). Process com-
plexity reflects numerous non-value-added activities and thus causes time delays
and cost increases.
A company can employ simultaneous engineering to reduce both product and
process complexity. Simultaneous (or concurrent) engineering refers to the
continuous involvement of all primary functions and personnel contributing to a
product’s origination and production from the beginning of a project. Multifunc-
tional teams design the product by considering customer expectations, vendor ca-
pabilities, parts commonality, and production process compatibility. Such an inte-
grated design effort is referred to as a design-for-manufacturability approach.
Simultaneous engineering helps companies to shorten the time-to-market for new
products and minimize complexity and cost.
Many traditional cost systems are not designed to account for information such
as how many different parts are used in a product, so management cannot iden-
tify products made with low-volume or unique components. Activity-based costing
systems are flexible and can gather such details so that persons involved in reengi-
neering efforts have information about relationships among activities and cost
drivers. Armed with these data, reengineering efforts can be focused on the pri-
mary causes of process complexity and on the causes that create the highest levels
of waste.
Part 2 Systems and Methods of Product Costing
148
Pareto principle
14
B. Joseph Pine II, Bart Victor, and Andrew C. Boynton, “Making Mass Customization Work,” Harvard Business Review (Sep-
tember–October 1993), p. 110.
15
Ibid, p. 108.
16
Pareto found that about 85 percent of Milan’s wealth was held by about 15 percent of the people. The term Pareto prin-
ciple was coined by Joseph Juran in relationship to quality problems. Juran found that a high proportion of such problems
were caused by a small number of process characteristics (the vital few), whereas the majority of process characteristics (the
trivial many) accounted for only a small proportion of quality problems.
simultaneous (concurrent)
engineering
With Lack of Commonality in Overhead Costs
Certain products and services create substantially more overhead costs than others.
Although some of these additional overhead costs may be caused by product va-
riety or product/process complexity, others may be related to support services. For
example, some products require significant levels of advertising; some use high cost
distribution channels; and some necessitate the use of high-technology machinery.
“A software distribution company, for example, discovered that a supposedly prof-
itable high-margin product was generating so many calls to its help line that it was
actually a money loser. Dropping that one product improved company profitability
by nearly 10%.”
17
If only one or two overhead pools are used, overhead related
to specific products will be spread over all products. The result will be increased
costs for products that are not responsible for the increased overhead.
With Problems in Current Cost Allocations
If a company has undergone one or more significant changes in its products or
processes (such as increased product variety or business process reengineering),
managers and accountants need to investigate whether the existing cost system still
provides a reasonable estimate of product or service cost. Many companies that
have automated their production processes have experienced large reductions in
labor and large increases in overhead costs. In such companies, using direct labor
as an overhead allocation base produces extraordinarily high application rates. Prior
to the introduction of ABC at Harris Semiconductor Sector, the overhead applica-
tion rate per area ranged from 800 to 1,800 percent of the direct labor costs. This
process resulted in 90 to 95 percent of all costs being allocated on a “mere 5–10
percent (i.e., direct labor costs) of the cost base.”
18
Products made using automated
equipment tend to be charged an insufficient amount of overhead, whereas prod-
ucts made using high proportions of direct labor tend to be overcharged.
Traditional cost allocations also generally emphasize the assignment of product
costs to products at the same time the majority of period costs are expensed as
incurred. Activity-based costing recognizes that some period costs (such as R&D
and distribution) may be distinctly and reasonably associated with specific prod-
ucts and thus should be traced and allocated to those products. This recognition
changes the traditional view of product versus period cost. And, as indicated in
the News Note on page 150, ABC information can be used, with diplomacy, to
evaluate customer profitability.
With Changes in Business Environment
A change in a company’s competitive environment may also require better cost in-
formation. Increased competition may occur for several reasons: (1) other compa-
nies have recognized the profit potential of a particular product or service, (2) the
product or service has become cost-feasible to make or perform, or (3) an indus-
try has been deregulated. If many new companies are competing for old business,
the best estimate of product or service cost must be available to management so
that profit margins and prices can be reasonably set.
Changes in management strategy can also signal a need for a new cost system.
For example, if management wants to begin new operations, the cost system must
be capable of providing information on how costs will change. Confirming manage-
ment’s view of costs to the traditional variable versus fixed classifications may not
allow such information to be effectively developed. Viewing costs as short-term
Chapter 4 Activity-Based Cost Systems for Management
149
17
Srikumar S. Rao, “True Cost,” Financial World (September 25, 1995), pp. 62–63.
18
Christopher R. Dedera, “Harris Semiconductor ABC: Worldwide Implementation and Total Integration,” Journal of Cost Man-
agement (Spring 1996), p. 44.
variable versus long-term variable focuses on cost drivers and on the changes the
planned operations will have on activities and costs.
Continuous improvement recognizes the concepts of eliminating non-value-
added activities to reduce cycle time, making products (or performing services)
with zero defects, reducing product costs on an ongoing basis, and simplifying
products and processes. Activity-based costing, by promoting an understanding of
cost drivers, allows the non-value-added activities to be identified and their causes
eliminated or reduced.
Part 2 Systems and Methods of Product Costing
150
Measuring Customers to Manage Profits
NEWS NOTE GENERAL BUSINESS
Activity-based costing differs from conventional costing
in that it uses cost drivers to assign costs. By under-
standing the overhead that a particular customer or prod-
uct really uses, ABC pinpoints customer profitability in a
way that conventional accounting cannot.
The first shock comes when customers or products
previously believed to be profitable are shown to consume
more resources than the revenue that they generate.
Take for example the owner of a chain of pharma-
ceutical companies who wanted to reprice his products.
He focused on assigning the transaction and holding
costs associated with each product and used ABC to
put in place a quick but fairly accurate system. Not sur-
prisingly many small items generated costs well out of
line with the accounting system and the Christmas break
was used to reprice the items in the warehouse and on
his shelves. Unfortunately, the new pricing was not well
received; the business underwent a shock and his man-
agement team spent the next four months back-peddling
with their customers.
Big changes, whether they are performed inside or
across the boundaries of the organization, require care-
ful diplomacy. Knowing the costs of your products sets
a target. Implementing that target requires careful steps.
In big companies this usually requires the input of var-
ious players, of multifunctional teams that negotiate joint
solutions with suppliers and customers. Often this leads
to dramatic solutions that no one party would have
reached on its own—standard packaging, availability of
forecasts, more frequent deliveries, cheaper materials for
noncritical parts.
ABC provides the tools to negotiate these solutions.
By negotiating what the customer is prepared to pay for,
we are able to minimize total costs across the entire value
chain and add value for the final user.
SOURCE
: Michael Gering, “Activity-Based Costing and the Customer,”
Manage-
ment Accounting
(London) (April 1999), pp. 26–27.
continuous improvement
CRITICISMS OF ACTIVITY-BASED COSTING
Realistically assessing new models and accounting approaches for what they can
help managers accomplish is always important. However, no currently existing ac-
counting technique or system will provide management with exact cost informa-
tion for every product or with the information needed to make consistently perfect
decisions. Activity-based costing, although it typically provides better information
than was generated under the traditional overhead allocation process, is not a panacea
for all managerial concerns. The following are some of this method’s shortcomings.
First, ABC requires a significant amount of time and, thus, cost to implement.
If implementation is to be successful, substantial support is needed throughout the
firm. An environment for change must be created that requires overcoming a va-
riety of individual, organizational, and environmental barriers. Individual barriers
are typically related to (1) fear of the unknown or shift in status quo, (2) poten-
tial loss of status, or (3) a necessity to learn new skills. Organizational barriers are
often related to “territorial,” hierarchical, or corporate culture issues. Environmental
barriers are often built by employee groups (including unions), regulatory agencies,
or other stakeholders of interest.
To overcome these barriers, a firm must first recognize that these barriers ex-
ist; second, investigate their causes; and, third, communicate information about the
“what,” “why,” and “how” of ABC to all concerned parties. Top management must
be involved with and support the implementation process. Lack of commitment or
involvement by top management will make any meaningful progress slow and dif-
ficult. Additionally, employees and managers must be educated in some nontradi-
tional techniques that include new terminology, concepts, and performance mea-
surements. Assuming that top management supports the changes in the internal
accounting system and that employees are educated about the system, additional
time will be required to analyze the activities taking place in the activity centers,
trace costs to those activities, and determine the cost drivers.
Another problem with ABC is that it does not conform specifically with gen-
erally accepted accounting principles (GAAP). ABC would suggest that some non-
product costs (such as those in research and development) be allocated to prod-
ucts, whereas certain other traditionally designated product costs (such as factory
building depreciation) not be allocated to products. Therefore, most companies
have used ABC for internal reporting, while continuing to maintain their general
and subsidiary ledger accounts and prepare their external financial statements on
the basis of a more “traditional” system—requiring two product costing systems
and causing even more costs to be incurred. As ABC systems become more widely
accepted, more companies may choose to refine how ABC and GAAP determine
product cost to make those definitions more compatible and, thereby, eliminate
the need for two costing systems.
One final criticism that has been leveled at activity-based costing is that it does
not promote total quality management (TQM) and continuous improvement. Dr.
H. Thomas Johnson (the Retzlaff Professor of Quality Management at Portland State
University) has issued the following cautions:
The decade of the 1970s ushered in a new competitive environment—call
it the global economy—in which accounting information is not capable of guid-
ing companies toward competitiveness and long-term profitability.
Activity-based prescriptions for improved competitiveness usually entail steps
that lead to selling more or doing less of what should not be sold or done in the
first place. Indeed, activity-based cost information does nothing to change old
remote-control, top-down management behavior. Simply because improved cost
information becomes available, a company does not change its commitment to
mass-produce output at high speed, to control costs by encouraging people to
manipulate processes, and to persuade customers to buy output the company
has produced to cover its costs. American businesses will not become long-term
global competitors until they change the way managers think. No cost infor-
mation, not even activity-based cost management information, will do that.
19
Companies attempting to implement ABC as a cure-all for product failures, vol-
ume declines, or financial losses will quickly recognize that Professor Johnson is
correct. However, companies can implement ABC and its related management tech-
niques in support of and in conjunction with TQM, JIT, or any of the other world-
class methodologies. Companies doing so will provide the customer with the best
variety, price, quality, service, and lead time of which they are capable. Not coin-
cidentally, they should find their businesses booming. Activity-based costing and
activity-based management are effective in supporting continuous improvement,
short lead times, and flexible manufacturing by helping managers to
• identify and monitor significant technology costs;
• trace many technology costs directly to products;
• promote increase in market share;
Chapter 4 Activity-Based Cost Systems for Management
151
19
H. Thomas Johnson, “It’s Time to Stop Overselling Activity-Based Concepts,” Management Accounting (September 1992),
pp. 31, 33.
• identify the cost drivers that create or influence cost;
• identify activities that do not contribute to perceived customer value (i.e., non-
value-added activities or waste);
• understand the impact of new technologies on all elements of performance;
• translate company goals into activity goals;
• analyze the performance of activities across business functions;
• analyze performance problems; and
• promote standards of excellence.
In summary, ABC is an improved cost accounting tool that helps managers know
how the score is kept so that they can play the game more competitively.
Part 2 Systems and Methods of Product Costing
152
Carrier
Corporation
REVISITING
he American Productivity and Quality Center (APQC)
and the Consortium for Advanced Manufacturing
International (CAM-I) recently sponsored a study to bench-
mark best practices in the installation and use of activity-
based cost management systems. Seven hundred and
fifty manufacturing and service organizations were invited
to participate in the study, and 166 responded by complet-
ing a 20-page survey instrument.
The survey results and telephone interviews were then
used to select 15 “best practice” companies. The best
practice companies were selected based on their ABCM
system’s maturity, the breadth of their ABCM applications,
the extent of their system’s integration, and their level of
success with ABCM.
Carrier Corporation participated in the survey and was
selected as one of the best practice companies. Carrier
currently has more than a dozen manufacturing sites located
throughout the world, and it was Carrier’s McMinville, Tenn.,
manufacturing plant that was identified as the best practice
site.
Carrier’s complexity reduction program along with its
other improvement initiatives have combined to produce
tangible results. For example, the firm has eliminated
some product lines, moved subassemblies to point of use,
outsourced some conversion operations, outsourced prod-
uct lines, and created a greater understanding of how
complexity affects costs. But more work needs to be done
for Carrier to maintain its competitive edge. In the current
competitive environment, Carrier is striving to better under-
stand cost behavior and the steps the company can take
to maintain its position as the world’s largest manufacturer
of air conditioning and heating products. Even though
Carrier’s management believes that product and process
complexity hurts profitability, it needs hard financial data.
ABCM provides Carrier managers the information they
need to make difficult decisions.
SOURCE
: Dan W. Swenson, “Managing Costs through Complexity Reduction at Carrier Corporation,”
Strategic Finance
(April 1998), pp. 20–28.
T
Significant changes have taken place in the business environment. These changes
have caused concern about the reliability of cost information generated by a system
primarily intended to provide product costs for external financial statements.
To make profits given the present competitive environment and consumer
focus on product price and quality, businesses must find ways to minimize costs.
Costs can be reduced without reducing quality by decreasing the number of non-
value-added organizational activities. Process mapping can be performed to see all
CHAPTER SUMMARY
the VA and NVA activities that take place in the production of a product or the
performance of a service. Value is added to products only during the times when
processing (manufacturing company), performance (service company), or display
(retail company) is actually taking place. Inspection time, transfer time, and idle
time all add to cycle time and cost, but not to value. The proportion of total
cycle time spent in value-added processing is referred to as manufacturing cycle
efficiency.
A third category of activities, known as business-value-added activities, also
exists. Although not wanting to pay for these activities, customers know the ac-
tivities are necessary expenses incurred by a business to conduct operations.
In addition to activity analysis, activity-based management is also concerned
with finding and selecting activity cost pools and identifying the set of cost drivers
that best represents the firm’s activities and are the underlying causes of costs.
Management should first investigate activities that reflect the major and most sig-
nificant processes conducted by the company. These activities normally overlap
several functional areas and occur horizontally across the firm’s departmental lines.
A new method of cost assignment, more compatible with the increased high-
technology environment in which business operates, is activity-based costing (ABC).
ABC assigns costs to products on the basis of the types and quantities of activities
that must be performed to create those products. This costing system accumulates
costs for activity centers in multiple cost pools at a variety of levels (unit, batch,
product, and organizational) and then allocates these costs using multiple cost dri-
vers (both volume- and non-volume-related). Thus, costs are assigned more accu-
rately, and managers can focus on controlling activities that cause costs rather than
trying to control the costs that result from the activities. The use of activity-based
costing should provide a more realistic picture of actual production cost than has
traditionally been available.
Product variety and process complexity often cause a business’s costs to increase
because of increases in non-value-added activities. Simultaneous engineering (using
multifunctional teams) can help firms to accelerate the time-to-market of new prod-
ucts and reduce the complexity and costs of these new products and the processes
by which they are made.
Chapter 4 Activity-Based Cost Systems for Management
153
KEY TERMS
activity (p. 132)
activity analysis (p. 132)
activity center (p. 142)
activity driver (p. 143)
attribute-based costing (ABC II) (p. 146)
batch-level cost (p. 138)
business-value-added activity (p. 133)
continuous improvement (p. 150)
cost driver analysis (p. 136)
cycle (lead) time (p. 134)
idle time (p. 134)
inspection time (p. 134)
long-term variable cost (p. 146)
manufacturing cycle efficiency (MCE)
(p. 135)
mass customization (p. 147)
organizational-level cost (p. 139)
Pareto principle (p. 148)
process complexity (p. 146)
process map (p. 133)
processing (service) time (p. 134)
product complexity (p. 146)
product-level (process-level) cost
(p. 138)
product variety (p. 146)
simultaneous (concurrent) engineering
(p. 148)
transfer time (p. 134)
unit-level cost (p. 136)
value chart (p. 134)
Part 2 Systems and Methods of Product Costing
154
Manufacturing Cycle Efficiency
Cycle Time ϭ Processing Time ϩ Inspection Time ϩ Transfer Time ϩ Idle Time
MCE ϭ Value-Added Processing Time Ϭ Total Cycle Time
Activity-Based Costing
1. Determine the activity centers of the organization.
2. Determine departmental activities and efforts needed to conduct those activities,
that is, the cost drivers.
3. Determine departmental resources consumed in conducting activities and allo-
cate costs of these resources to activity centers based on the cost drivers.
4. Determine activities needed to manufacture products or provide revenue-
producing services, that is, the activity drivers.
5. Allocate costs to products and services based on activities and cost drivers
involved.
SOLUTION STRATEGIES
Pierre Press prepares two versions of gourmet cookbooks: One is paperback and
the other is hand-sewn and leather bound. Management is considering publishing
only the higher quality book. The firm assigns its $500,000 of overhead to the two
types of books. The overhead is composed of $200,000 of utilities and $300,000
of quality control inspectors’ salaries. Some additional data follow:
Paperback Leather Bound
Revenues $1,600,000 $1,400,000
Direct costs $1,250,000 $600,000
Production (units) 500,000 350,000
Machine hours 42,500 7,500
Inspections 2,500 12,500
Required:
a. Compute the overhead cost that should be allocated to each type of cookbook
using cost drivers appropriate for each type of overhead cost.
b. The firm has used machine hours to allocate overhead in the past. Should
Pierre Press stop producing the paperback cookbooks? Explain why manage-
ment was considering this action and what its decision should be.
Solution to Demonstration Problem
a.
Paperback Leather Bound Total
Machine hours 42,500 7,500 50,000
Rate per MH ($200,000 Ϭ 50,000) ϫ $4 ϫ $4 ϫ $4
Utility cost $170,000 $ 30,000 $200,000
Number of inspections 2,500 12,500 15,000
Rate per inspection ($300,000 Ϭ 15,000) ϫ $20 ϫ $20 ϫ $20
Quality inspection cost $ 50,000 $250,000 $300,000
Total traceable overhead costs $220,000 $280,000 $500,000
b. Income calculation using machine hours to allocate utilities and inspection
hours to allocate inspectors’ salaries to products:
DEMONSTRATION PROBLEM
Using the traditional cost driver (machine hours), the following results had
been achieved, given a $10 charge ($500,000 Ϭ 50,000) per MH:
Paperback Leather Bound
Revenue $1,600,000 $1,400,000
Direct costs $1,250,000 $ 600,000
Overhead 425,000 75,000
Total costs $1,675,000 $ 675,000
Margin $ (75,000) $ 725,000
The reason paperbacks were erroneously thought to be unprofitable was caused
by the method of allocating overhead. The firm should continue producing
paperbacks as shown in the following calculations.
Paperback Leather Bound
Revenue $1,600,000 $1,400,000
Direct costs $1,250,000 $ 600,000
Overhead 220,000 280,000
Total costs $1,470,000 $ 880,000
Margin $ 130,000 $ 520,000
Chapter 4 Activity-Based Cost Systems for Management
155
1. What is activity-based management (ABM) and what are the specific manage-
ment tools that fall beneath the ABM umbrella?
2. Define value-added activities and non-value-added activities. Compare and give
three examples of each type.
3. Why are value-added activities defined from a customer viewpoint?
4. What management opportunity is associated with identifying the non-value-
added activities in a production process?
5. In a televised football game, what activities are value added? What activities are
non-value-added? Would everyone agree with your choices? Why or why not?
6. How is a process map used to identify opportunities for cost savings?
7. What is manufacturing cycle efficiency? What would its value be in an opti-
mized manufacturing environment and why?
8. What is a cost driver and how is it used? Give four examples of cost drivers.
9. Do cost drivers exist in a traditional accounting system? Are they designated
as such? How, if at all, does the use of cost drivers differ between a traditional
accounting system and an activity-based costing system?
10. What is activity analysis and how is it used in concert with cost driver analy-
sis to manage costs?
11. What is activity-based costing? How does it differ from traditional product cost-
ing approaches?
12. Why do the more traditional methods of overhead assignment “overload” stan-
dard, high-volume products with overhead costs, and how does ABC improve
overhead assignments?
13. What characteristics of a company would generally indicate that activity-based
costing might improve product costing?
14. Why does activity-based costing require that costs be aggregated at different
levels?
15. List the benefits of activity-based costing. How could these reduce costs?
16. Traditional costing systems often differentiate between fixed and variable costs.
How does the ABC philosophy address fixed and variable costs?
QUESTIONS
17. How does attribute-based costing extend the concept of activity-based costing?
18. Are all companies likely to benefit to an equal extent from adopting ABC?
Discuss.
19. Significant hurdles are often encountered in adopting ABC including a large
time commitment. What specific activities associated with ABC adoption re-
quire large investments of time?
Part 2 Systems and Methods of Product Costing
156
20. (Terminology) Match the following lettered terms on the left with the appro-
priate numbered description on the right.
a. Activity driver 1. Non-value-added use of time
b. Cost driver analysis 2. Cost explained well by traditional
c. Cycle time cost drivers
d. Idle time 3. Driver of some costs
e. Long-term variable cost 4. Time from receipt of order to
f. Mass customization delivery of product
g. Product complexity 5. Cost not usually assigned to
h. Organizational-level cost products under ABC
i. Unit-level cost 6. Personalized production
j. Value chart 7. Establishing cost causality
8. Measure of activity demand
9. Indicator of activities and their time
10. Costs traditionally known as fixed
21. (Terminology) Match the following lettered terms on the left with the appro-
priate numbered description on the right.
a. Activity analysis 1. Setup cost
b. Activity-based costing 2. A costing system that uses multiple
c. Attribute-based costing cost drivers
d. Batch-level cost 3. A process of involving all affected
e. Manufacturing cycle efficiency personnel from the beginning of a
f. Non-value-added activity project
g. Process map 4. An approach to associate costs with
h. Research and development activities
i. Simultaneous engineering 5. A tool to find the cost of product
j. Value-added activity features
6. A flowchart indicating all steps in
producing a product or performing
a service
7. Idle time, transfer time, or storage
time
8. Actual production time divided by
total cycle time
9. Product/process level cost
10. Something that increases worth of a
product or service
22. (Activity analysis) Conveyance Systems is investigating the costs of schedule
changes in its factory. Following is a list of the activities, estimated times, and
average costs required for a single schedule change.
EXERCISES
Activity Estimated Time Average Cost
Review impact of orders 30 min–2 hrs $ 300
Reschedule orders 15 min–24 hrs 800
Lost sales
Unreliable customer service
Reschedule production orders 15 min–1 hr 75
Contact production supervisor 5 min 5
Stop production and change over
Generate paperwork to return materials
Return and locate material (excess inventory) 20 min–6 hrs 1,500
Generate new production paperwork 15 min–4 hrs 500
Change routings
Change bill of materials
Change procurement schedule 10 min–8 hrs 2,100
Purchase orders
Inventory
Collect paperwork from the floor 15 min 75
Review new line schedule 15 min–30 min 100
Overtime premiums 3 hrs–10 hrs 1,000
Total $6,455
a. Which of the above, if any, are value-added activities?
b. What is the cost driver in this situation?
c. How can the cost driver be controlled and the activities eliminated?
23. (Cycle time and MCE) The following functions are performed in making salad
dressing at A-1 Toppings.
Function Time (Minutes)
Receiving ingredients 45
Moving ingredients to stockroom 15
Storing ingredients in stockroom 3,600
Moving ingredients from stockroom 15
Mixing ingredients 30
Cooking ingredients 90
Bottling ingredients 90
Moving bottled dressing to warehouse 20
Storing bottled dressing in warehouse 5,040
Moving bottled dressing from warehouse to trucks 30
a. Calculate the cycle time of this manufacturing process.
b. Calculate the manufacturing cycle efficiency of this process.
c. What could A-1 Toppings do to improve its MCE?
24. (Identifying cost drivers) The Fast Lane is a highly automated, fast-food restau-
rant that relies on sophisticated, computer-controlled equipment to prepare and
deliver food to customers. Operationally and organizationally, the restaurant
operates like other major franchise fast-food restaurants. Determine whether
each of the following costs are unit level (U), batch level (B), product/process
level (P), or organizational level (O).
a. Store manager’s salary
b. Frozen french fries
c. Napkins
d. Oil for the deep-fat fryer
e. Maintenance of the restaurant building
f. Wages of employees who clear and clean tables
g. Electricity expense for the pizza oven
h. Property taxes
i. Depreciation on kitchen equipment
j. Refrigeration of raw materials
Chapter 4 Activity-Based Cost Systems for Management
157
25. (Cost drivers) For each of the following important costs in manufacturing com-
panies, identify a cost driver and explain why it is appropriate.
a. Equipment maintenance
b. Building utilities
c. Computer operations
d. Quality control
e. Material handling
f. Material storage
g. Factory depreciation
h. Setup cost
i. Engineering changes
j. Advertising expense
k. Freight costs for materials
26. (Cost allocation using cost drivers) Peterson Wholesale has an in-house legal
department whose activities fall into one of three major categories. Recently,
operating costs in the department have risen dramatically. Management has de-
cided to implement an activity-based costing system to help control costs and
charge in-house users for the legal services provided. The principal expense
in the legal department is professional salaries, and the estimated cost of pro-
fessional salaries associated with each activity follow:
Reviewing supplier or customer contracts (Contracts) $400,000
Reviewing regulatory compliance issues (Regulation) 250,000
Court actions (Court) 350,000
Management has determined that the appropriate cost allocation base for Con-
tracts is the number of pages in the contract reviewed; for Regulation, the al-
location base is the number of reviews; and for Court, the allocation base is
professional hours. For 2001, the legal department reviewed 20,000 pages of
contracts, responded to 500 regulatory review requests, and logged 3,000 pro-
fessional hours in court.
a. Determine the allocation rate for each activity in the legal department.
b. What amount would be charged to a producing department that had 1,000
pages of contracts reviewed, made 15 regulatory review requests, and con-
sumed 250 professional hours in court services during the year?
c. How can the developed rates be used for evaluating output relative to cost
incurred in the legal department? What alternative does the firm have to
maintaining an internal legal department and how might this choice affect
costs?
27. (Activity-based costing) Management at Cooper Steel Co. has decided to insti-
tute a pilot activity-based costing project in its eight-person purchasing de-
partment. Annual departmental costs are $790,000. Because finding the best
supplier takes the majority of effort in the department, most of the costs are
allocated to this area.
Activity Allocation Measure Number of People Total Cost
Find best suppliers Number of telephone calls 5 $500,000
Issue purchase orders Number of purchase orders 2 200,000
Review receiving reports Number of receiving reports 1 90,000
During the year, the purchasing department made 250,000 telephone calls,
issued 25,000 purchase orders, and reviewed 15,000 receiving reports. Many
purchase orders are received in a single shipment.
One product manufactured by Cooper Steel required the following pur-
chasing department activities: 235 telephone calls, 70 purchase orders, and 22
receipts.
Part 2 Systems and Methods of Product Costing
158
a. What amount of purchasing department cost should be assigned to this
product?
b. If 300 units of the product are manufactured during the year, what is the
purchasing department cost per unit?
28. (Product profitability) Lawn Management Systems (LMS) manufactures two
products: lawnmowers and garden tractors. Lawnmowers are relatively simple
to produce and are made in large quantities. Garden tractors must be more
customized to individual wholesale customer specifications. LMS sells 50,000
lawnmowers and 10,000 garden tractors annually. Revenues and costs incurred
for each product are as follows:
Lawnmowers Garden Tractors
Revenue $8,000,000 $8,800,000
Direct material 2,000,000 1,800,000
Direct labor 1,200,000 4,000,000
Overhead ? ?
Labor is paid $20 per hour, manufacturing overhead totals $2,210,000, and ad-
ministrative expenses equal $1,612,000.
a. Calculate the profit (loss) on each product if overhead and administrative
expenses are assigned to the products using a direct labor hour base.
b. Calculate the profit (loss) on each product if overhead is assigned to prod-
ucts using a direct labor hour base but administrative expenses are deducted
from total company income rather than being allocated to products.
c. Does your answer in part (a) or part (b) provide the better representation
of the profit contributed by each product? Explain.
29. (Value chart) You are the new controller of a small shop that manufactures
special-order desk nameplate stands. As you review the records, you find that
all the orders are shipped late, the average process time for any order is three
weeks, and the time actually spent in production operations is two days. The
president of the company has called you in to discuss missed delivery dates.
Prepare an oral presentation for the executive officers in which you address
the following:
a. Possible causes of the problem.
b. How a value chart could be used to address the problem.
30. (Controlling overhead) Industrial Paints Inc. has engaged you to help the com-
pany analyze and update its costing and pricing practices. The company prod-
uct line has changed over time from general paints to specialized marine coat-
ings. Although some large orders are received, the majority of business is now
generated from products designed and produced in small lot sizes to meet
specifically detailed environmental and technical requirements.
The company has experienced tremendous overhead growth, including
costs in customer service, production scheduling, inventory control, and labo-
ratory work. Factory overhead has essentially doubled since the shift in prod-
uct lines. Management believes that large orders are being penalized and small
orders are receiving favorable cost (and therefore selling price) treatment.
a. Indicate why the shift in product lines would have caused such major in-
creases in overhead.
b. Is it possible that management is correct in its belief about the costs of
large and small orders? If so, why?
c. Write a memo to management suggesting how it might change the cost
accounting system to reflect the changes in the business.
31. (Traditional vs. ABC methods) Many companies now recognize that their cost
systems are inadequate in the context of today’s powerful global competition.
Managers in companies selling multiple products are making important product
Chapter 4 Activity-Based Cost Systems for Management
159
decisions based on distorted cost information, because most cost systems de-
signed in the past focused on inventory measurement. To elevate the level of
management information, current literature suggests that companies should
have as many as three cost systems for (1) inventory measurement, (2) oper-
ational control, and (3) activity-based costing.
a. Discuss why the traditional cost information system, originally developed
for valuing inventory, distorts product cost information.
b. Identify the purpose and characteristics of each of the following cost systems:
1. Inventory measurement
2. Activity-based costing
c. Describe the benefits that management can obtain from using activity-based
costing.
d. List the steps that a company using a traditional cost system would take
to implement activity-based costing. (CMA adapted)
Part 2 Systems and Methods of Product Costing
160
32. (Identifying non-value-added activities) Stacy Kroger is planning to build a
concrete walkway for her home during her annual vacation. She has prepared
the following schedule of how her time on the project will be allocated:
Purchase materials 4 hours
Obtain rental equipment 2 hours
Remove sod and level site 10 hours
Build forms for concrete 12 hours
Mix and pour concrete into forms 5 hours
Level concrete and smooth 2 hours
Let dry 24 hours
Remove forms from concrete 1 hour
Return rental tools 1 hour
Clean up 2 hours
a. Identify the value-added activities. How much total time is value-added?
b. Identify the non-value-added activities. How much total time is spent per-
forming non-value-added activities?
c. Calculate the manufacturing cycle efficiency.
33. (Activity analysis; MCE) Southern Living constructs log cabin vacation houses
in the Tennessee mountains for customers. As the company’s consultant, you
developed the following value chart:
Operations Average Number of Days
Receiving materials 2
Storing materials 4
Measuring and cutting materials 3
Handling materials 7
Setting up and moving scaffolding 6
Assembling materials 7
Building fireplace 9
Pegging logs 4
Cutting and framing doors and windows 3
Sealing joints 4
Inspecting property (county inspectors) 3
a. What are the value-added activities and their total time?
b. What are the non-value-added activities and their total time?
PROBLEMS
c. Calculate the manufacturing cycle efficiency of the process.
d. Prepare a one-minute presentation explaining the difference between value-
added and non-value-added activities.
34. (Activity-based costing) Patio Solutions makes umbrellas, gazebos, and lawn
chairs. The company uses a traditional overhead allocation scheme and assigns
overhead to products at the rate of $10 per direct labor hour. In 2000, the
company produced 100,000 umbrellas, 10,000 gazebos, and 30,000 lawn chairs
and incurred $2,000,000 of manufacturing overhead costs. The cost per unit
for each product group in 2000 was as follows:
Umbrellas Gazebos Lawn Chairs
Direct material $ 4.00 $ 40.00 $ 4.00
Direct labor 6.00 45.00 15.00
Overhead 8.00 60.00 20.00
Total $18.00 $145.00 $39.00
Because profitability has been lagging and competition has been getting more
keen, Patio Solutions is considering implementing an activity-based costing sys-
tem for 2001. In analyzing the 2000 data, management determined that all
$2,000,000 of factory overhead could be assigned to four basic activities: qual-
ity control, setups, material handling, and equipment operation. Data from 2000
on the costs associated with each of the four activities follows:
Quality Control Setups Material Handling Equipment Operation Total Costs
$100,000 $100,000 $300,000 $1,500,000 $2,000,000
Management determined that the following allocation bases and total 2000 vol-
umes for each allocation base could have been used for ABC:
Activity Base Volume
Quality control Number of units produced 140,000
Setups Number of setups 1,000
Material handling Pounds of material used 2,000,000
Equipment operation Number of machine hours 1,000,000
Volume measures for 2000 for each product and each allocation base were as
follows:
Umbrellas Gazebos Lawn Chairs
Number of units 100,000 10,000 30,000
Number of setups 200 400 400
Pounds of material 400,000 1,000,000 600,000
Number of machine hours 200,000 400,000 400,000
a. For 2000, determine the total overhead allocated to each product group
using the traditional allocation based on direct labor hours.
b. For 2000, determine the total overhead that would have been allocated to
each product group if activity-based costing were used. Compute the cost
per unit for each product group.
c. Patio Solutions has a policy of setting selling prices based on product costs.
How would the sales prices using activity-based costing differ from those
obtained using the traditional overhead allocation?
35. (Activity-based costing) Williams Components Company manufactures two
products. Following is a production and cost analysis for each product for the
year 2000.
Chapter 4 Activity-Based Cost Systems for Management
161
Both
Cost Component Product A Product B Products Cost
Units produced 10,000 10,000 20,000
Raw materials used (units)
X 50,000 50,000 100,000 $ 800,000
Y 100,000 100,000 $ 200,000
Labor hours used
Department 1: $ 681,000
Direct labor ($375,000) 20,000 5,000 25,000
Indirect labor
Inspection 2,500 2,500 5,000
Machine operations 5,000 10,000 15,000
Setups 200 200 400
Department 2: $ 462,000
Direct labor ($200,000) 5,000 5,000 10,000
Indirect labor
Inspection 2,500 5,000 7,500
Machine operations 1,000 4,000 5,000
Setups 200 400 600
Machine hours used
Department 1 5,000 10,000 15,000 $ 400,000
Department 2 5,000 20,000 25,000 $ 800,000
Power used (kw-hours) $ 400,000
Department 1 1,500,000
Department 2 8,500,000
Other activity data:
Building occupancy $1,000,000
Purchasing $ 100,000
Number of purchase orders
Material X 200
Material Y 300
Square feet occupied
Purchasing 10,000
Power 40,000
Department 1 200,000
Department 2 250,000
Roberto Lopez, the firm’s cost accountant, has just returned from a seminar on
activity-based costing. To apply the concepts he has learned, he decides to an-
alyze the costs incurred for Products A and B from an activity basis. In doing
so, he specifies the following first and second allocation processes:
FIRST STAGE: ALLOCATIONS TO DEPARTMENTS
Cost Pool Cost Object Activity Allocation Base
Power Departments Kilowatt-hours
Purchasing Materials Number of purchase orders
Building occupancy Departments Square feet occupied
SECOND STAGE: ALLOCATIONS TO PRODUCTS
Cost Pool Cost Object Activity Allocation Base
Departments:
Indirect labor Products Hours worked
Power Products Machine hours
Machinery-related Products Machine hours
Building occupancy Products Machine hours
Materials:
Purchasing Products Materials used
SOURCE
: From Harold P. Roth and A. Faye Borthick, “Getting Closer to Real Product Costs,”
Management Accounting
(May 1989), pp. 28–33. Reprinted from
Management Accounting
. Copyright by Institute of Management Accountants,
Montvale, N.J.
Part 2 Systems and Methods of Product Costing
162
a. Determine the total overhead for Williams Components Company.
b. Determine the plantwide overhead rate for the company, assuming the use
of direct labor hours.
c. Determine the cost per unit of Product A and Product B, using the over-
head application rate found in part (b).
d. Using the step-down approach, determine the cost allocations to depart-
ments (first-stage allocations). Allocate in the following order: building oc-
cupancy, purchasing, and power.
e. Using the allocations found in part (d), determine the cost allocations to
products (second-stage allocations).
f. Determine the cost per unit of Product A and Product B using the over-
head allocations found in part (e).
36. (Using ABC to set price) The budgeted manufacturing overhead costs of Garage
Door Company for 2001 are as follows:
Type of Cost Cost Amount
Electric power $ 500,000
Work cells 3,000,000
Material handling 1,000,000
Quality control inspections 1,000,000
Product runs (machine setups) 500,000
Total budgeted overhead costs $6,000,000
For the last five years, the cost accounting department has been charging over-
head production costs based on machine hours. The estimated budgeted ca-
pacity for 2001 is 1,000,000 machine hours.
Jason Tracy, president of Garage Door, recently attended a seminar on ac-
tivity-based costing. He now believes that ABC results in more reliable cost
data that, in turn, will give the company an edge in pricing over its competi-
tors. On the president’s request, the production manager provided the follow-
ing data regarding expected 2001 activity for the cost drivers of the preceding
budgeted overhead costs.
Type of Costs Activity Drivers
Electric power 100,000 kilowatt-hours
Work cells 600,000 square feet
Material handling 200,000 material moves
Quality control inspections 100,000 inspections
Product runs (machine setups) 50,000 product runs
Linda Ryan, the VP of marketing, received an offer to sell 5,000 doors to a lo-
cal construction company. Linda asks the head of cost accounting to prepare
cost estimates for producing the 5,000 doors. The head of cost accounting ac-
cumulated the following data concerning production of 5,000 doors:
Direct material cost $100,000
Direct labor cost $300,000
Machine hours 10,000
Direct labor hours 15,000
Electric power—kilowatt-hours 1,000
Work cells—square feet 8,000
Number of material handling moves 100
Number of quality control inspections 50
Number of product runs (setups) 25
SOURCE
: Adapted from Nabil Hassa, Herbert E. Brown, and Paul M. Saunders, “Management Accounting Case Study:
Beaver Window Inc.,”
Management Accounting Campus Report
(Fall 1990). Copyright Institute of Management Accoun-
tants, Montvale, N.J.
a. What is the predetermined overhead rate if the traditional measure of ma-
chine hours is used? (continued)
Chapter 4 Activity-Based Cost Systems for Management
163
b. What is the manufacturing cost per door as presently accounted for?
c. What is the manufacturing cost per door under the proposed ABC method?
d. If the two cost systems will result in different cost estimates, which cost
accounting system is preferable as a pricing base and why?
37. (Activity driver analysis and decision making) High Plains Manufacturing Prod-
ucts is concerned about its ability to control factory labor-related costs. The
company has recently finished an analysis of these costs for 2001. Following
is a summary of the major categories of labor costs identified by High Plain’s
accounting department:
Category Amount
Base wages $42,000,000
Health care benefits 7,000,000
Payroll taxes 3,360,000
Overtime 5,800,000
Training 1,250,000
Retirement benefits 4,600,000
Workers’ compensation 800,000
Listed below are some of the potential cost drivers identified by the company
for labor-related costs, along with their 2001 volume levels.
Potential Activity Driver 2001 Volume Level
Average number of factory employees 1,400
Number of new hires 200
Number of regular labor hours worked 2,100,000
Number of overtime hours worked 192,000
Total factory wages $47,800,000
Volume of production in units 8,000,000
Number of production process changes 400
Number of production schedule changes 250
a. For each cost pool, determine the cost per unit of the activity driver us-
ing the activity driver that you believe has the closest relationship to the
cost pool.
b. Based on your judgments and calculations in part (a), which activity dri-
ver should receive the most attention from company managers in their ef-
forts to control labor-related costs? How much of the total labor-related
cost is attributable to this activity driver?
c. In the contemporary environment, many firms are asking their employees
to work record levels of overtime. What activity driver does this practice
suggest is a major contributor to labor-related costs? Explain.
38. (Activity-based costing and pricing) Covington Community Hospital has found
itself under increasing pressure to be accountable for the charges it assesses
its patients. Its current pricing system is ad hoc, based on pricing norms for
the geographical area, and it only explicitly considers direct costs for surgery,
medication, and other treatments. Covington’s controller has suggested that the
hospital try to improve its pricing policies by seeking a tighter relationship be-
tween costs and pricing. This approach would make prices for services less
arbitrary. As a first step, the controller has determined that most costs can be
assigned to one of three cost pools. The three cost pools follow along with
the estimated amounts and activity drivers.
Activity Center Amount Activity Driver Quantity
Professional salaries $900,000 Professional hours 30,000 hours
Building costs 450,000 Square feet used 15,000 sq. ft.
Risk management 320,000 Patients served 1,000 patients
Part 2 Systems and Methods of Product Costing
164
The hospital provides service in three broad categories. The services are listed
below with their volume measures for the activity centers.
Service Professional Hours Square Feet Number of Patients
Surgery 6,000 1,200 200
Housing patients 20,000 12,000 500
Outpatient care 4,000 1,800 300
a. Determine the allocation rates for each activity center cost pool.
b. Allocate the activity center costs to the three services provided by the
hospital.
c. What bases might be used as cost drivers to allocate the service center
costs among the patients served by the hospital? Defend your selections.
39. (Determining product cost) Belton Furniture Corporation has identified activity
centers to which overhead costs are assigned. The cost pool amounts for these
centers and their selected activity drivers for 2000 are as follows.
Activity Centers Costs Activity Drivers
Utilities $300,000 60,000 machine hours
Scheduling and setup 273,000 780 setups
Material handling 640,000 1,600,000 pounds of material
The company’s products and other operating statistics follow:
PRODUCTS
ABC
Direct costs $80,000 $80,000 $90,000
Machine hours 30,000 10,000 20,000
Number of setups 130 380 270
Pounds of material 500,000 300,000 800,000
Number of units produced 40,000 20,000 60,000
Direct labor hours 32,000 18,000 50,000
a. Determine unit product cost using the appropriate cost drivers for each of
the products.
b. Before it installed an ABC system, the company used a conventional cost-
ing system and allocated factory overhead to products using direct labor
hours. The firm operates in a competitive market and product prices were
set at cost plus a 20 percent markup.
1. Calculate unit costs based on conventional costing.
2. Determine selling prices based on unit costs for conventional costing
and for ABC costs.
c. Discuss the problems related to setting prices based on conventional cost-
ing and explain how ABC improves the information.
Chapter 4 Activity-Based Cost Systems for Management
165
40. (Product complexity) Tektronix Inc. is a world leader in the production of elec-
tronic test and measurement instruments. The company experienced almost
uninterrupted growth through the 1980s, but in the 1990s, the low-priced end
of the Portables Division product line was challenged by an aggressive low-
price strategy of several Japanese competitors. These Japanese companies set
prices 25 percent below Tektronix’s prevailing prices. To compete, the division
CASES
needed to reduce costs and increase customer value by increasing operational
efficiency.
Steps were taken to implement just-in-time delivery and scheduling tech-
niques, a total quality control program, and people involvement techniques
that moved responsibility for problem solving down to the operating level of
the division. The results of these changes were impressive: substantial reduc-
tions in cycle time, direct labor hours per unit, and inventory levels as well as
increases in output dollars per person per day and operating income. The cost
accounting system was providing information, however, that did not seem to
support the changes.
Total overhead cost for the division was $10,000,000; of this, part (55%) seemed
to be related to materials and the remainder (45%) to conversion. Material-related
costs pertain to procurement, receiving, inspection, stockroom personnel, etc.
Conversion-related costs pertain to direct labor, supervision, and process-related
engineering. All overhead was applied on the basis of direct labor.
The division decided to concentrate efforts on revamping the application
system for material-related overhead. Managers believed the majority of ma-
terial overhead (MOH) costs were related to the maintenance and handling
of each different part number. Other types of MOH costs were costs due to
the value of parts, absolute number of parts, and each use of a different part
number.
At this time, the division used 8,000 different parts and in extremely differ-
ent quantities. For example, annual usage of one part was 35,000 units; usage
of another part was only 200 units. The division decided that MOH costs would
decrease if a smaller number of different parts were used in the products.
SOURCE
: Adapted from Michael A. Robinson, ed.,
Cases from Management Accounting Practice
, No. 5 (Montvale, N.J.:
National Association of Accountants, 1989), pp. 13–17. Copyright by Institute of Management Accountants (formerly
National Association of Accountants), Montvale, N.J.
a. Give some reasons that materials overhead (MOH) would decrease if parts
were standardized.
b. Using the numbers given above, develop a cost allocation method for MOH
to quantify and communicate the strategy of parts standardization.
c. Explain how the use of the method developed in part (b) would support
the strategy of parts standardization.
d. Is any method that applies the entire MOH cost pool on the basis of one
cost driver sufficiently accurate for complex products? Explain.
e. Are MOH product costing rates developed for management reporting ap-
propriate for inventory valuation for external reporting? Why or why not?
41. (Activity-based costing) Kendall Corporation manufactures several different
types of printed circuit boards; however, two of the boards account for the
majority of the company’s sales. The first of these boards, a television (TV) cir-
cuit board, has been a standard in the industry for several years. The market
for this type of board is competitive and, therefore, price sensitive. Kendall
plans to sell 65,000 of the TV circuit boards in 2000 at a price of $150 per
unit. The second high-volume product, a personal computer (PC) circuit board,
is a recent addition to Kendall’s product line. Because the PC board incorpo-
rates the latest technology, it can be sold at a premium price; the 2000 plans
include the sale of 40,000 PC boards at $300 per unit.
Kendall’s management group is meeting to discuss strategies for 2000, and
the current topic of conversation is how to spend the sales and promotion dol-
lars for next year. The sales manager believes that the market share for the TV
board could be expanded by concentrating Kendall’s promotional efforts in this
area. In response to this suggestion, the production manager said, “Why don’t
you go after a bigger market for the PC board? The cost sheets that I get show
that the contribution from the PC board is more than double the contribution
Part 2 Systems and Methods of Product Costing
166