Báo cáo toán học: " Measurement of beta amyloid peptides in specific cells using a photo thin-film transistor" pot
Bạn đang xem bản rút gọn của tài liệu. Xem và tải ngay bản đầy đủ của tài liệu tại đây (431.55 KB, 12 trang )
This Provisional PDF corresponds to the article as it appeared upon acceptance. Fully formatted
PDF and full text (HTML) versions will be made available soon.
Measurement of beta amyloid peptides in specific cells using a photo thin-film
transistor
Nanoscale Research Letters 2012, 7:72 doi:10.1186/1556-276X-7-72
Chang-Beom Kim ()
Cheol-Joo Chae ()
Hye-Rim Shin ()
Ki-Bong Song ()
ISSN 1556-276X
Article type Nano Express
Submission date 26 July 2011
Acceptance date 6 January 2012
Publication date 6 January 2012
Article URL />This peer-reviewed article was published immediately upon acceptance. It can be downloaded,
printed and distributed freely for any purposes (see copyright notice below).
Articles in Nanoscale Research Letters are listed in PubMed and archived at PubMed Central.
For information about publishing your research in Nanoscale Research Letters go to
/>For information about other SpringerOpen publications go to
Nanoscale Research Letters
© 2012 Kim et al. ; licensee Springer.
This is an open access article distributed under the terms of the Creative Commons Attribution License ( />which permits unrestricted use, distribution, and reproduction in any medium, provided the original work is properly cited.
- 1 -
Measurement of beta-amyloid peptides in specific cells using a photo
thin-film transistor
Chang-Beom Kim
†1
, Cheol-Joo Chae
†1
, Hye-Rim Shin
1
, and Ki-Bong Song*
1
1
IT Convergence Services Core Research Team, Electronics and Telecommunications
Research Institute, 218 Gajeong-ro, Yuseong-gu, Daejeon, 305-700, South Korea
*Corresponding author:
†
Contributed equally
Email addresses:
C-BK:
C-JC:
H-RS:
K-BS:
- 2 -
Abstract
The existence of beta-amyloid [Aβ] peptides in the brain has been regarded as the
most archetypal biomarker of Alzheimer's disease [AD]. Recently, an early clinical
diagnosis has been considered a great importance in identifying people who are at
high risk of AD. However, no microscale electronic sensing devices for the detection
of Aβ peptides have been developed yet. In this study, we propose an effective
method to evaluate a small quantity of Aβ peptides labeled with fluorescein
isothiocyanate [FITC] using a photosensitive field-effect transistor [p-FET] with an
on-chip single-layer optical filter. To accurately evaluate the quantity of Aβ peptides
within the cells cultured on the p-FET device, we measured the photocurrents which
resulted from the FITC-conjugated Aβ peptides expressed from the cells and
measured the number of photons of the fluorochrome in the cells using a
photomultiplier tube. Thus, we evaluated the correlation between the generated
photocurrents and the number of emitted photons. We also evaluated the correlation
between the number of emitted photons and the amount of FITC by measuring the
FITC volume using AFM. Finally, we estimated the quantity of Aβ peptides of the
cells placed on the p-FET sensing area on the basis of the binding ratio between FITC
molecules and Aβ peptides.
Keywords: Alzheimer's disease; beta-amyloid; photosensitive field-effect transistor;
arsenic trisulfide optical filter.
Introduction
Since the discovery of Alzheimer's disease [AD] in 1906, numerous AD
researches have grown intensively from many angles during the past several decades
[1-4]. Recently, the importance of early clinical diagnosis has been recognized to
diagnose people at high risk of AD. According to the established hypotheses on AD
during the past decade, the extracellular deposits of beta-amyloid [Aβ] peptides
forming plaques and the intracellular neurofibrillary tangles have been regarded as the
major histopathological hallmarks of AD [5-10]. Biologically, more evolved studies
examined that Aβ peptides which are incorporated into planar lipid bilayers of
neurons induce multimeric ion channels inducing excessive calcium influx into
neurons and subsequent neuritic degeneration and death [11]. Another hypothesis
suggested that soluble Aβ oligomers are the origin of neurotoxicity before Aβ
aggregation process proceeds further and forms plaques [12].
As an Aβ detection tool, highly sophisticated neuroimaging techniques have been
developed such as single photon emission computed tomography [13] and positron-
emission tomography [14]. However, the neuroimaging systems have rather
limitations in spatial resolution for the identification of nanoscale Aβ with a
molecular-level precision because their detection depends on the computed images of
Aβ plaque clumps. Recently, with rapid development of microtechnology, the
incorporation of microfabricated devices with biochemical analysis techniques has
been dramatically increased. Antibody-conjugated microbead arrays on a substrate
were used for a multiplexed detection of several types of proteins in a
microelectrophoretic device, which was, however, also on the basis of a fluorescence
imaging technique [15]. Surface-enhanced Raman scattering spectroscopy was
utilized to detect biomolecules in a label-free way when electrokinetically
preconcentrated to amplify the low concentrations, which is also difficult for accurate
quantification.
- 3 -
As a result of the recent AD researches, the in vivo physiological quantity of Aβ
peptides has been known to be a few nanomoles in concentration. Therefore, the
development of biosensors enabling the accurate quantification of a small amount of
Aβ peptides ranging from a few femtomoles to nanomoles is required. These
challenging biosensors with the capability of Aβ peptide quantification at a low
concentration have not been developed yet for early AD diagnosis. Thus, this study
suggests a new approach capable of evaluating a small quantity of Aβ peptide using a
simple, thin-film field-effect transistor and shows the results of the photocurrents
resulted from a fluorescence signal.
Methods
Photosensitive field-effect transistor
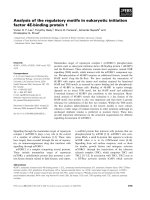
As shown in Figure 1, we propose an effective method to measure the quantity of
Aβ peptides labeled with fluorescein isothiocyanate [FITC] using a photosensitive
field-effect transistor [p-FET] with an on-chip single-layer optical filter. The in vitro
microsystem mainly consists of an upper biofluidic part where the cultured cells are
introduced on top of the optical filter through a polydimethylsiloxane [PDMS]
channel and an underlying thin film p-FET as the signal transducer part which was
fabricated with an optically high-efficient amorphous Si [α-Si] layer on a Si/SiO
2
substrate. A droplet including cells with intra/extracellular Aβ peptides is placed on
the laminin-coated sensing area of the p-FET device, which is, after overnight
incubation at 37°C, followed by the treatment of both the primary antibody for Aβ
peptides and secondary antibody conjugated with fluorochrome.
Mathematical approach
In Figure 1, the fluorochrome molecules bound to the Aβ peptides are excited by
blue laser irradiation (λ
ex
) at a high energy level and emit visible fluorescent light
(λ
em
) at a low energy level. Through this process, the filter surface unoccupied by the
cells reflects the unwanted range of blue laser irradiation and only transmits the
fluorescently emitted light through the filter. When the fluorescent light (dotted red
line) emitted by the excitation (dotted blue line) is transmitted through the optical
filter and approaches the p-FET sensing area (i.e., α-Si surface), excess charge
carriers are generated by the absorbed photons within the α-Si sensing layer to give
rise to a measurable photocurrent, which can be theoretically expressed as follows:
( )
( )
p FET FET FET
1 1
vd
e e
I R e P C P
hv hv
α
η
−
= − − =
, (1)
where I
p
is the photocurrent generated by p-FET, e is the electron charge, h is the
Planck constant, and ν is the photon frequency of fluorescence emission. The
remaining parts of Equation 1 represent the optical properties related to the p-FET
device which can be designated as a single constant, C
FET
, R is the reflectance, η is the
quantum efficiency, α is the absorption coefficient of the photon, and d is the p-FET
sensing layer thickness. Therefore, I
p
is directly proportionate to P
FET
which
represents the intensity of the incident fluorescent light transmitted through the filter.
Also, the intensity of the fluorescent transmittance onto the p-FET is linearly
proportional to the multiplication of the intensity of emitted fluorescence (P
em
) from
- 4 -
fluorochrome before transmission and the transmittance coefficient (T) of the optical
filter for the emitted wavelength:
FET em
T
P P
=
.
(2)
Meanwhile, P
em
definitely relies on the number of the emitted photons from the
fluorochrome excited by the blue laser. By the definition of the quantum yield as
follows:
# of emitted photons
# of absorbed photons
Φ ≡
, (3)
the number of emitted photons indicates the multiplication of the quantum yield and
the number of photons absorbed within the fluorochrome. Subsequently, P
em
can be
mathematically expressed as follows:
(
)
(
)
λ
em
Φ # of absorbed photons Φ 1
A
P e
−
= × = −
, (4)
where A
λ
is the absorbance of fluorochrome for the specified wavelength which is
defined as the logarithmic value of the ratio of the intensity of light passed through
fluorochrome to the intensity of incident light. Therefore, Equation 1 can be
completely rewritten as follows:
( ) ( )
λ λ
p FET
Φ 1 1
A A
T
e
I C e C e
h
ν
− −
= − = −
, (5)
where C represents an arbitrary constant. Since the absorbance, A
λ
, is proportionate to
the volume (or mass, or thickness) and the concentration of the absorbing species,
Equation 5 meaningfully indicates that high electrical current may be generated by the
p-FET device for a large amount of the Aβ-conjugated fluorochrome and vice versa.
Eventually, since the quantity of Aβ peptides is directly proportionate to that of the
tagged fluorochrome, the photocurrents generated by p-FET are a function of the
amount of Aβ peptides specifically conjugated with fluorochrome.
Even though the exact relationship would not be available in a form of an
equation in this study, the photocurrent generated by the p-FET device would be
expressed as a linear function of the amount of the Aβ-conjugated fluorochrome and
potentially provide the quantified Aβ concentration.
Results and discussion
Fluorochrome-conjugated Aβ expressed on a cell line
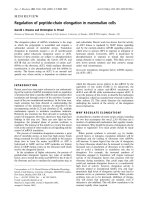
We prepared a circular PDMS well with a diameter of 200 µm to guide the
biological sample solution. It was aligned on the p-FET surface, so the sensing area
was placed in the middle of the well as shown in Figure 2a. After washing three times
with phosphate-buffered saline, laminin as an extracellular matrix was coated on the
channel, and the channel was kept overnight in an incubator at 37°C.
We prepared HeLa cells for the expression of Aβ peptides. The HeLa cells
(density 10
4
/µl) were brought to the p-FET surface and cultured overnight in the
incubator for stabilization as shown in Figure 2b. Thereafter, the HeLa cells were
fixed with 4% paraformaldehyde for 1 h at room temperature, and then, the blocking
with 4% bovine serum albumin was carried out for 1 h to protect nonspecific antibody
bindings in the next step. Then, the overnight incubation with a primary antibody
(Abcam, Cambridge, MA, USA) was performed for the specific binding to Aβ
peptides on the HeLa cells.
- 5 -
The subsequent treatment with a secondary antibody (Invitrogen, Carlsbad, CA,
USA) tagged with FITC was performed for 1 h (Figure 2c). The synthetic ratio of Aβ
to FITC is defined to be 1:4 by the manufacturer (USBiological, Swampscott, MA,
USA). After the fluorescence treatment with FITC, the nuclei of the HeLa cells were
stained using 4′,6-diamidino-2-phenylindole [DAPI] (Figure 2d), and the p-FET
sensor was imaged using a fluorescent microscope and was irradiated by a 405-nm
blue laser as an excitation source for FITC to measure the photocurrent. The reason
that we used the 405-nm blue laser was attributed to the intention of forming a thin,
single-layer filter on the p-FET surface, not using multilayer, commercial optical
filters. We developed a thermally evaporated thin arsenic trisulfide (As
2
S
3
) filter
which almost blocks the lights below 450 nm and transmits longer than approximately
500 nm. Figure 2e,f shows the typical morphologies of HeLa cells cultured on a flat
PDMS surface.
Quantification of Aβ peptides via detection of FITC
We investigated the applicability of our p-FET sensor to the actual detection of
Aβ peptides existing in the HeLa cells. In Figure 3a, approximately 13 HeLa cells
placed on the p-FET sensing area in the middle of a PDMS circular well were
visualized with FITC specifically bound to the Aβ peptides expressed on the cell
membranes. The peptides rather feebly fluoresced when stimulated by a blue
excitation laser at a 405-nm wavelength. The photocurrents generated by the
fluorescence emitted from the FITC-conjugated Aβ peptides were measured as shown
in Figure 3b. Only with the optical filter layer on the p-FET (without any cells),
approximately 5 nA of photocurrents (black line) were generated when the p-FET
device was irradiated by the blue laser during the shutter-on (5.5 to 10.5 s), indicating
that most of the excitation light was reflected by the filter layer. However, with the
FITC-labeled cells on the optical filter layer, the photocurrents measured
approximately 350 nA with 220-nA increments, assuming that the photocurrent
generated by a single cell roughly corresponds to approximately 18 nA. Therefore, it
is expected that our p-FET sensor can be used as a detector for low-level Aβ peptides
with weak fluorescence emission.
Figure 3c shows the FITC-stained HeLa cells with better cellular shapes on a flat
PDMS surface. To evaluate the correlation between the generated photocurrent and
the number of emitted photons from a single cell, we measured the number of photons
of the single cell in the yellow dotted circle using a photomultiplier tube [PMT]. As a
result of the PMT measurement, a single fluorescent cell emitted approximately 1.3 ×
10
6
photons in 1 s, which corresponds to 17 nA of photocurrent when compared to the
p-FET measurement.
To accurately evaluate the quantity of Aβ peptides within a single cell as the
ultimate purpose of this study, the information on how many FITC molecules exist
within a single cell is imperatively required. Therefore, as shown in Equation 4, the
quantum yield for FITC molecules experimentally measured 0.12, which was excited
at 405 nm and emitted at 510 nm. According to both the measured quantum yield for
our system and the PMT result for the photon number within a single cell
(approximately 1.3 × 10
6
photons), the concentration of FITC molecules existing
within a single cell was roughly evaluated to be approximately 10 fM. After all, the
photocurrent of 220 nA measured by p-FET for 13 HeLa cells represents
approximately 130 fM of FITC molecules, and the concentration of Aβ peptides is
evaluated to be 40 to 50 fM on the basis of the manufacturer synthesis ratio (4:1)
- 6 -
between FITC and Aβ. Figure 3d represents the calibration data of the photon
counting using PMT measurement, showing a linear function of the FITC volume.
Conclusions
We proposed an effective method to measure the quantity of Aβ peptides labeled
with FITC using a p-FET with an on-chip single-layer optical filter. To accurately
evaluate the quantity of Aβ peptides within the cells cultured on the p-FET device, we
measured the photocurrents which resulted from the FITC-conjugated Aβ peptides
expressed from the cells and measured the number of photons of the fluorochrome in
the cells using a PMT. Thus, we evaluated the correlation between the generated
photocurrents and the number of emitted photons. We also evaluated the correlation
between the number of emitted photons and the amount of FITC by measuring the
FITC volume using AFM. Finally, we estimated the quantity of Aβ peptides of the
cells placed on the p-FET sensing area on the basis of the binding ratio between FITC
molecules and Aβ peptides.
Competing interests
The authors declare that they have no competing interests.
Authors' contributions
C-BK and C-JC fabricated the p-FET devices, conducted the thermal coating of the
optical filter, carried out the experiments, and drafted the manuscript. H-RS carried
out the preparation of cells and the treatment of antibody and fluorescence. K-BS
conceived the basic idea of the whole experiment and supported the mathematical
approach and the organization of this article. All authors read and approved the final
manuscript.
Acknowledgements
This research was supported by the Converging Research Center Program funded by
the Ministry of Education, Science and Technology (2011K000677)of Korea.
References
1. Bertram L, Tanzi RE: Thirty years of Alzheimer’s disease genetics: the
implications of systematic meta-analyses. Nat Rev Neurosci 2008, 9:768-778.
2. Williamson J, Goldman J, Marder K: Genetic aspects of Alzheimer disease.
Neurologist 2009, 15:80-86.
3. Small DH, Mok SS, Bornstein JC: Alzheimer’s disease and Aβ toxicity: from top
to bottom. Nat Rev Neurosci 2001, 2:595-598.
4. Sturchler-Pierrat C, Abramowski D, Duke M, Wiederhold KH, Mistl C, Rothacher
S, Ledermann B, Burki K, Frey P, Paganetti PA, Waridel C, Calhoun ME, Jucker
M, Probst A, Staufenbiel M, Sommer B: Two amyloid precursor protein
transgenic mouse models with Alzheimer disease-like pathology. Proc Natl
Acad Sci USA 1997, 94:13287-13292.
5. Nussbaum RL, Ellis CE: Alzheimer’s disease and Parkinson’s disease. N Engl J
Med 2003, 348:1356-1364.
6. Hintersteiner M, Enz A, Frey P, Jaton AL, Kinzy W, Kneuer R, Neumann U, Rudin
M, Staufenbiel M, Stoeckli M, Wiederhold KH, Gremlich HU: In vivo detection
- 7 -
of amyloid-b deposits by near-infrared imaging using an oxazine-derivative
probe. Nat Biotechnol 2005, 23:577-583.
7. Hardy J, Selkoe DJ: The amyloid hypothesis of Alzheimer’s disease: progress
and problems on the road to therapeutics. Sci 2002, 297:353-356.
8. Meyer-Luehmann M, Stalder M, Herzig MC, Kaeser SA, Kohler E, Pfeifer M,
Boncristiano S, Mathews PM, Mercken M, Abramowski D, Staufenbiel M,
Jucker M: Extracellular amyloid formation and associated pathology in
neural grafts. Nat Neurosci 2003, 6:370-377.
9. Small DH, McLean CA: Alzheimer’s disease and the amyloid b protein: what is
the role of amyloid? J Neurochem 1999, 73:443-449.
10. Sisodia SS, Price DL: Role of the beta-amyloid protein in Alzheimer’s disease.
FASEB J 1995, 9:366-370.
11. Lin H, Bhatia R. Lal R: Amyloid β protein forms ion channels: implications
for Alzheimer’s disease pathophysiology. FASEB J 2001, 15:2433-2444.
12. Haass C, Selkoe DJ: Soluble protein oligomers in neurodegeneration: lessons
from the Alzheimer’s amyloid β-peptide. Nat Rev Mol Cell Biol 2007, 8:101-
112.
13. Bonte FJ, Harris TS, Hynan LS, Bigio EH, White CL: Tc-99m HMPAO SPECT
in the differential diagnosis of the dementias with histopathologic
confirmation. Clin Nucl Med 2006, 31:376-378.
14. Kuhl DE, Koeppe RA, Minoshima S, Snyder SE, Ficaro EP, Foster NL, Frey KA,
Kilbourn MR: In vivo mapping of cerebral acetylcholinesterase activity in
aging and Alzheimer’s disease. Neurol 1999, 52:691-699.
15. Barbee KD, Hsiao AP, Roller EE, Huang X: Multiplexed protein detection
using antibody-conjugated microbead arrays in a microfabricated
electrophoretic device. Lab Chip 2010, 10:3084-3093.
Figure 1. Conceptual illustration of a p-FET. The p-FET is integrated with an on-
chip optical filter composed of a selectively transmissible material at a particular
wavelength to evaluate a small quantity of Aβ peptides conjugated with FITC. The
unwanted range of excitation light (λ
ex
) is reflected, and only the fluorescent light
emitted at a proper wavelength (λ
em
) is transmitted through the filter and converted to
the electrical signal. The inset shows the actual p-FET device.
Figure 2. Cell culture and visualization on the p-FET device. (a) A microscopic
optical image of the p-FET sensing areas placed in the middle of the PDMS well. (b)
The HeLa cells were brought to the p-FET surface and cultured overnight in the
incubator for stabilization. (c) The HeLa cells were visualized with FITC specifically
bound to the Aβ peptides expressed on the cell surface. (d) The nuclei of the HeLa
cells stained using DAPI. (e, f) The HeLa cells cultured on a flat PDMS surface were
visualized with FITC and DAPI, respectively.
Figure 3. Quantitative analysis of FITC. (a) Thirteen HeLa cells placed on the p-
FET sensing area in the middle of the PDMS circular well were visualized with FITC
bound to the Aβ peptides expressed on the cell membranes. (b) The photocurrents
generated by the fluorescence emitted from the FITC-conjugated Aβ peptides were
measured. (c) The number of photons of the single cell in the yellow dotted circle was
- 8 -
measured using a PMT. (d) Calibration data of the photon counting as a linear
function of the FITC volume.
Figure 1
Figure 2
Figure 3