Báo cáo toán học: " Dilemmas in the reliable estimation of the in-vitro cell viability in magnetic nanoparticle engineering: which tests and what protocols?" doc
Bạn đang xem bản rút gọn của tài liệu. Xem và tải ngay bản đầy đủ của tài liệu tại đây (4.25 MB, 22 trang )
This Provisional PDF corresponds to the article as it appeared upon acceptance. Fully formatted
PDF and full text (HTML) versions will be made available soon.
Dilemmas in the reliable estimation of the in-vitro cell viability in magnetic
nanoparticle engineering: which tests and what protocols?
Nanoscale Research Letters 2012, 7:77 doi:10.1186/1556-276X-7-77
Clare Hoskins ()
Lijun Wang ()
Woei Ping Cheng ()
Alfred Cuschieri ()
ISSN 1556-276X
Article type Nano Express
Submission date 14 September 2011
Acceptance date 16 January 2012
Publication date 16 January 2012
Article URL />This peer-reviewed article was published immediately upon acceptance. It can be downloaded,
printed and distributed freely for any purposes (see copyright notice below).
Articles in Nanoscale Research Letters are listed in PubMed and archived at PubMed Central.
For information about publishing your research in Nanoscale Research Letters go to
/>For information about other SpringerOpen publications go to
Nanoscale Research Letters
© 2012 Hoskins et al. ; licensee Springer.
This is an open access article distributed under the terms of the Creative Commons Attribution License ( />which permits unrestricted use, distribution, and reproduction in any medium, provided the original work is properly cited.
Dilemmas in the reliable estimation of the in-vitro cell viability in magnetic
nanoparticle engineering: which tests and what protocols?
Clare Hoskins
1
, Lijun Wang*
1
, Woei Ping Cheng
2
and Alfred Cuschieri
1
1
Institute for Medical Science and Technology (IMSaT), Wilson House, 1 Wurzburg Loan, University of
Dundee, Dundee, DD2 1FD, UK
2
School of Pharmacy, University of Hertfordshire, College Lane, Hatfield, Hertfordshire, AL10 9AB, UK
*Corresponding author:
Email addresses:
CH:
LW:
WPC:
AC:
Abstract
Magnetic nanoparticles [MNPs] made from iron oxides have many applications in biomedicine. Full
understanding of the interactions between MNPs and mammalian cells is a critical issue for their
applications. In this study, MNPs were coated with poly(ethylenimine) [MNP-PEI] and poly(ethylene
glycol) [MNP-PEI-PEG] to provide a subtle difference in their surface charge and their cytotoxicity which
were analysed by three standard cell viability assays: 3-(4,5-dimethylthiazol-2-yl)-5-(3-
carboxymethoxyphenyl)-2-(4-sulfophenyl)-2H-tetrazolium [MTS], CellTiter-Blue and CellTiter-Glo
(Promega, Southampton, UK) in SH-SY5Y and RAW 264.7 cells The data were validated by traditional
trypan blue exclusion. In comparison to trypan blue manual counting, the MTS and Titer-Blue assays
appeared to have consistently overestimated the viability. The Titer-Glo also experienced a small
overestimation. We hypothesise that interactions were occurring between the assay systems and the
nanoparticles, resulting in incorrect cell viability evaluation. To further understand the cytotoxic effect of the
nanoparticles on these cells, reactive oxygen species production, lipid peroxidation and cell membrane
integrity were investigated. After pegylation, the MNP-PEI-PEG possessed a lower positive surface charge
and exhibited much improved biocompatibility compared to MNP-PEI, as demonstrated not only by a higher
cell viability, but also by a markedly reduced oxidative stress and cell membrane damage. These findings
highlight the importance of assay selection and of dissection of different cellular responses in in-vitro
characterisation of nanostructures.
Keywords: magnetic nanoparticle; cellular interaction; cytotoxicity; cell viability assay; zeta potential.
Background
Magnetic nanoparticles [MNPs] have assumed importance for the imaging of diseases such as cancer and
diabetes [1]. In the field of tissue engineering, magnetic nanoparticles have been previously reported for
many applications including cellular labelling, sorting and monitoring, targeted in-vivo therapeutic delivery,
stem cell replacement therapy and welding tissue surfaces [2, 3]. In 2007, Syková and Jenelová incorporated
superparamagnetic nanoparticles into mesenchymal stem cells for the regeneration of tissue damage in the
central nervous system [4]. They reported that the superparamagnetic nanoparticles enabled imaging and
control of cellular migration by external magnetic fields to the wound site, optimised the number of cells
needed and also helped monitor any possible side effects [4]. Some superparamagnetic nanoparticles were
previously approved for imaging and therapeutic applications in humans, e.g. Feridex IV
®
and Combidex
®
(Advanced Magnetics Inc., Lexington, MA, USA) [5, 6, 7] and several other superparamagnetic
nanoparticles are also undergoing phases I and II clinical trials [1, 5, 8, 9].
Despite increased applications of MNPs emerging, little is known of the adverse biological side
effects due to their nanoscale size. Recently, the importance of such biological characterisation and
cytotoxic profile has been recognised. The use of appropriate assessments is vital in evaluating the
biocompatibility of MNPs. At present, a range of assays are used which measure cell viability through non-
specific enzyme activity (3-(4,5-dimethylthiazol-2-yl)-2,5-diphenyltetrazolium bromide [MTT], 3-(4,5-
dimethylthiazol-2-yl)-5-(3-carboxymethoxyphenyl)-2-(4-sulfophenyl)-2H-tetrazolium [MTS], CellTiter-
Blue assay) or via ATP level (CellTiter-Glo assay). However, little has been documented about the possible
interactions between nanoparticles and the reagents used in these assays. The validation of these assays
therefore merits urgent investigation.
Recently, Häfeli et al. reported a modification in their MTT assay used to measure the cytotoxicity of
polyethylenoxide-coated magnetic nanoparticles [10]. Fisichella et al. reported that mesoporous silica
nanoparticles interfered with the intracellular trafficking of the MTT formazan vesicles in HeLa cells and
astrocytes, resulting in an overestimation of cytotoxicity when compared to flow cytometry [11]. In contrast,
vast literature has been published on the effect of carbon nanotubes [CNTs] on such assays [12-18]. It has
been documented that single-walled carbon nanotubes interfere with both absorbance and fluorescent
cytotoxicity assays [12-14]. Belyanskaya et al. reported that the extent of interference can be attributed to
three factors: (1) protocol of the assay, (2) surfactant coating and (3) chemical architecture of the CNT [12].
Belyanskaya reported that addition of one further centrifugation step at the end of the MTT assay in order to
lyse the cells and discard the cellular components and CNT particles could reduce interferences caused by
the CNTs. They concluded that extreme caution should be used when interpreting cell viability data without
appropriate controls in place [12].
Here, we determine the suitability of various standard cell viability assays for a MNP with a particle
size of 100 nm. As MNP surface properties especially surface charge is an important factor in determining
their biocompatibility [19, 20], the surface of commercial MNPs was modified with poly(ethylenimine)
[MNP-PEI] and further conjugated with poly(ethylene glycol) [MNP-PEI-PEG]. PEI polymers have been
reported to increase solution properties of nanoparticles and provide a platform for further modification,
such as targeting or solubilisation moieties [21-23]. PEG has been widely accepted for nanostructure
modification and drug delivery due to its biocompatibility and stealth properties in vivo [24-27]. Through
surface modification, we obtained two types of MNPs with controlled difference on their surface charges,
MNP-PEI having a higher positive charge than MNP-PEI-PEG, and used them as models to analyse the
ability of various assays in discriminating the subtle difference in the level of effect those nanoparticles
could impose to cells. Another consideration in assessing the sensitivity of the cell viability assays is MNP
concentration. Concentrations of MNPs closer to physiological conditions and much lower than that reported
in most studies were used in the present study. We validated the cell viability data obtained from commonly
used MTS, CellTiter-Blue and CellTiter-Glo assays by comparing them with that obtained with traditional
trypan blue exclusion to evaluate the suitability of those commercial cell viability assays for nanotoxicity
studies. The validated data were further complemented by measurement of a number of cellular events in
response to MNPs including cell membrane integrity, reactive oxygen species [ROS] production and lipid
peroxidation [LPO] to give a more comprehensive safety profile.
Methods
Coating and characterisation of magnetic nanoparticles
MNPs (Chemicell GmbH, Berlin, Germany) diluted with 9.5 mL deionised water [DI] were sonicated for 18
h. N-(3-dimethylaminopropyl)-N-ethylcarboimide hydrochloride (5.7 mg) and N-hydroxysuccinimide (11.4
mg) dissolved in 1.9 mL of 2-(N-Morpholino)ethanesulfonic acid hemisodium salt [MES] buffer (0.5 M)
were added to the solution and stirred for 1 h at room temperature [RT]. MES buffer (0.1 M) was added, and
the solution was centrifuged at 40,000×g at 4°C for 0.5 h. MNPs were resuspended in the MES buffer (0.1
M, 19 mL) containing 0.95 mg PEI (molecular weight [MW] 750,000) and stirred at RT for 3 h. Glycine (25
mM) in phosphate-buffered saline [PBS] (9.5 mL) was added, and the solution was stirred for a further 1 h
at RT. The nanoparticles were ‘washed’ with DI (three times), and the resultant MNP-PEI eluted from the
solution using a high-powered magnet. The nanoparticle pellet was resuspended in 10 mL of DI.
MNP-PEI (4 mL) was added to 0.08 M sodium tetraborate (12 mL) followed by
methoxypolyethylene glycol p-nitrophenyl carbonate (MW 5,000) (20 mg) with stirring for 3 h at RT in the
absence of light. The resultant solution was washed with DI, and the MNP-PLL-PEGs eluted from the
solution using a high-powered magnet. The nanoparticles were resuspended in 4 mL DI.
Nanoparticle concentration was determined using inductively coupled plasma [ICP] analysis and
dispersed in DI before sonication for 10 min before subsequent measurements. Hydrodynamic diameters,
polydispersity index and zeta potential measurements were carried out using a photon correlation
spectrometer (Zetasizer Nano-ZS, Malvern Instruments, Worcestershire, UK). All measurements were
conducted in triplicate at 25°C, and an average value was determined. Prior to zeta potential analysis,
standard control samples were run on the instrument.
Culture of cell lines
Two cell lines, SH-SY5Y (human neuroblastoma; ATCC, Manassas, VA, USA) and RAW 264.7 (mouse
macrophage), were used in our study. Neuroblastoma cells are being used to represent cells present at the
regenerative site during nerve regeneration, and macrophage cells are the body's first line of defence for the
immune system, phagocytosing foreign bodies and cleaning the blood of unknown particles; hence, any
particles administered to the site of nerve injury will encounter these cells. SH-SY5Y cells were cultured in
50:50 Dulbecco's minimum essential medium [DMEM]: Ham's F-12 media containing 10% heat inactivated
foetal bovine serum [FBS], 2 mM L-glutamine and 1% penicillin streptomycin [Penstrep] (all purchased
from Invitrogen Ltd., Renfrew, UK). RAW264.7 cells (kindly donated by Prof. Colin Watts and Dr Alan
Prescott, College of Life Sciences, University of Dundee, Dundee, UK) were cultured in DMEM containing
10% FBS, 2 mM L-glutamine and 1% Penstrep. Cells were grown under standard conditions (37 °C and 5%
CO
2
) to reach a confluency of 70% to 80 % before being subjected to any further experimentation.
Cellular uptake of nanoparticles measured by inductively coupled plasma
Cells seeded in 6-well plates and incubated with MNPs at final concentrations of 0, 1.56, 6.25 and 25 µg
mL
−1
(the concentration of MNPs used for all experiments indicates the concentration of Fe
3+
) for 24 h. The
medium was removed, and the cells were thoroughly washed with PBS for three times, trypsinised and
resuspended in medium. The cell number was counted using a haemocytometer, and cells were placed in
eppendorf tubes (1 × 10
6
cells/tube). The cell suspensions were centrifuged at 800 rpm for 5 min, and the
supernatant was discarded. Concentrated hydrochloric acid (100 µL) was added to the cells, and the tubes
were incubated at 90°C for 0.5 h. The samples were cooled to room temperature and centrifuged at 1,500
rpm for 10 min. The supernatant was diluted with deionised water and run on an ICP instrument (Optima
7000V DV, PerkinElmer, Wokingham, UK). A calibration was carried out using iron standard solutions of
0.5 to 5 µg mL
−1
(R = 0.9999). A control sample of deionised water was also run.
Observation of cellular uptake of nanoparticles by transmission electron microscopy
MNPs were added to cells cultured in 75-cm
2
flasks (6.25 µg mL
−1
) for 24 h. The cells were washed with
PBS (three times). A 10-mL fixative (4% paraformaldehdye, 2.5% gluteraldehyde in PIPES buffer, pH 7.2)
was added to the flasks and incubated for 0.5 h at room temperature. The cells were scraped off the flask and
centrifuged into a pellet. The pellet was set in resin, and micron-sized slices were cut. The specimens were
viewed using transmission electron microscopy [TEM] (JEM.1200ex, JEOL Ltd., Herts, England, UK), and
images were recorded in digital imaging plates and scanned in a Ditabis Micron scanner (Ditabis AG,
Pforzheim, Germany).
Cell viability determination by MTS, CellTiter-Blue and CellTiter-Glo assays
MTS and CellTiter-Blue are colorimetric and fluorescent assays (respectively) used to measure cell viability
via non-specific redox enzyme activity. CellTiter-Glo is a luminescent assay used to measure cell viability
by ATP level. Cells (100 µL, 1 × 10
5
cells/ml) were seeded into a 96-well flat-bottomed plate (white for
Titer-Glo) and incubated for 24 h at 37°C with 5% CO
2
. The medium was replaced with increasing MNP
concentrations (1.56 to 25 µg mL
−1
) (in triplicates). The cells were incubated for 24, 72, 120 and 168 h (for
120- and 168-hr incubations, the medium was replaced at 72 h with fresh medium containing appropriate
concentrations of MNPs). The cells were washed (with PBS, three times) and replaced with fresh medium
(100 µL). MTS (20 µL) or CellTiter-Blue (20 µL) reagents were added to the wells, and the plate was
incubated for 4 h protected from light. Absorbance (MTS) was recorded at 490 nm, and fluorescence
intensity (CellTiter-Blue) was recorded (excitation 560 nm, emission 590 nm). To eliminate possible
interference between MNPs and assay readings, cells treated with same concentrations of MNPs but without
addition of assay reagents were used as blank wells. Both assays were measured on a Tecan M200
multimode plate reader (Tecan Austria GmbH, Grödig, Austria). CellTiter-Glo reagent was added to the
wells (50 µL and 50-µL media) and incubated at room temperature for 10 min protected from light. The
luminescence was recorded using the same multimode plate reader. As per MTS and Titer-Blue assays,
blank wells (with no reagents) were measured for luminescence and deducted from the values in
experimental wells. Values of viability of treated cells were expressed as a percentage of that from
corresponding control cells. All experiments were repeated at least three times. All assay kits were
purchased from Promega, Southampton, UK.
Trypan blue exclusion assay
Cells were seeded into a 12-well plate and incubated for 24 h at 37°C with 5% CO
2
. The cells were treated
as previously described in MTS, Titer-Blue and Titer-Glo. The cells were washed with PBS three times and
trypsinised. Trypan blue was added to a 100-µL cell suspension in an equal volume and incubated at room
temperature for 5min. The viable cells were counted using a Countess
TM
automated cell counter (Invitrogen,
Ltd., Renfrew, UK). Values of viability of treated cells were expressed as a percentage of that from
corresponding control cells. All experiments were repeated at least three times.
Reactive oxygen species assay
Cells were seeded into a 96-well plate (10,000/well) and incubated for 24 h. Cells were incubated with
increasing MNP concentrations (1.56 to 25 µg mL
−1
) for 1, 4, 24 and 72 h. The cells were washed three
times with PBS and incubated for 1 h with 100-µM carboxy-H
2
DCFDA (Invitrogen Ltd., Renfrew, UK) in
PBS at 37°C protected from light. The cells were washed three times with PBS and incubated with a 100-µL
serum-free medium for a further 0.5 h. The medium was replaced with PBS. The fluorescence intensity of
the samples was measured at 560 nm (excitation) and 590 nm (emission) on a Tecan M200 microplate
reader (Tecan Austria). The percentage of dichlorofluorescin [DCF] fluorescence was calculated in respect
to control cells assumed to be 100%.
a
Lipid peroxidation measurement by thiobarbituric acid reactive substance assay
Cells in an exponential growth phase were seeded into a 6-well plate and incubated for 24 h. The medium
was replaced with increasing MNP concentrations (1.56 to 25 µg mL
−1
). After incubation, the medium was
removed, and the wells were washed three times with PBS. Cells were trypsinised and resuspended in 0.5
mL PBS containing 0.05% butylated hydroxytoluene on ice. The cell suspensions were sonicated for 5 s
three times at 40 V and were kept on ice. Malondialdehyde bis(dimethyl acetal) [MDA] standard solutions
(0 to 5 µM) were prepared, and 100 µL of samples or standards was added to the Eppendorf tubes. Sodium
dodecyl sulphate (100 µL, 2%) was added, and the tubes were incubated for 5 min at room temperature.
Thiobarbituric acid (250 µL) was added to the eppendorf tubes before incubation at 95°C for 1 h. The
samples were cooled on ice for 10 min and centrifuged at 3,000 rpm for 15 min at 4°C. The supernatant was
pipetted into the wells of a 96-well plate, and fluorescent measurements were taken at 530 nm (excitation)
and 550 nm (emission). The results were calculated as nanomoles of MDA per milligram of cellular protein.
Protein content was determined by the addition of a 100-µL sample to a 3-mL Bradford reagent. The
samples were mixed well at room temperature for 5 min, and absorbance was measured at 595 nm. The
absorbance values were compared to a calibration curve carried out using bovine serum albumin, and the
protein concentration was determined.
a
Cell membrane integrity analysis
Cells were seeded into a 96-well plate (15,000/well) and grown for 24 h. The medium was replaced with
increasing magnetic nanoparticle concentrations (1.56 to 25 µg mL
−1
). The plates were incubated for 1, 4, 24
and 48 h. After incubation 2 µL of lysis buffer was added to the positive control wells, and the plate was
centrifuged at 1,500 rpm for 10 min at 37°C. After centrifugation, 50 µL of the supernatant was removed
from each well and placed into a new plate, and 50 µL of a membrane integrity assay reagent was added to
the wells. The plates were incubated for 10 min at 37°C protected from light. Twenty-five microlitres of stop
reagent was then added to the wells, and the fluorescence of the samples was measured at 560 nm
(excitation) and 590 nm (emission) on the microplate reader. The percentage of cytotoxicity with respect to
the positive control wells was calculated, whereby the lysed cells were assumed to have 100% lactate
dehyrogenase [LDH] release.
a
Results
Coating and characterization of magnetic nanoparticles
The particles were successfully coated with PEI and further functionalised with PEG. ICP was used to
deduce the concentration of the MNPs after each reaction (based on the total iron content). The
concentration after the initial coating with PEI was 1.39 mg mL
−1
(74% yield) and 1 mg mL
−1
(72% yield)
after pegylation based on ICP analysis. After coating, the particles were noticeably more stable in the
solution, especially after pegylation. The size of the MNPs was determined using photon correlation
spectroscopy which measures the hydrodynamic radius of the particles in the solution [see Table S1 in
Additional file 1]. The particles were measured at 0.25 mg mL
−1
in deionised water. With polymer coating,
the size of the commercial Chemicell nanoparticles increased from 101 nm to 146 nm (MNP-PEI); the size
further increased upon pegylation to 361 nm.
The zeta potential of the ‘naked’ MNPs was negative (−38.2 mV), due to the -COOH groups on the
surface of the particles [see Table S1 in Additional file 1]. Addition of a cationic polymer such as PEI
increases the overall zeta potential, resulting in a positive value. This assumption can be made due to the
positive charge on the amine groups of the polymer backbone, binding to the -COOHs thus rendering them
neutral, plus and unbound amine groups which will still hold their positive charge. The PEI coating gave a
positive value (+17.7 mV) which indicated that the polymer had been successfully coated with the polymer,
which is in agreement with the size data [see Table S1 in Additional file 1]. The zeta potential measurement
for the pegylated particle was +12.1 mV. This value indicated that pegylation had occurred as the zeta
potential increased in negativity compared to that of the MNP-PEI due to the presence of -OH groups on the
particle surface which is due to the PEG coating (MNP-PEI-PEG) [see Table S1 in Additional file 1].
Cellular uptake of nanoparticles
Table S2 in Additional file 1 shows the intracellular content of MNPs in SH-SY5Y and RAW 264.7 cells
after 24 h incubation at different concentrations. In the SH-SY5Y cells, the cellular uptake was increased
ninefold from 2.867 pg to 26.763 pg per cell (at 25 µg mL
−1
) upon PEI coating of the nanoparticles. After
pegylation, an eightfold increase in cellular uptake was observed when compared to the uncoated MNPs at
the same concentration. The increase in cellular uptake, which is dependent on surface properties of MNPs,
further confirms the coating of the particles. Only a small increase in nanoparticle uptake was observed in
RAW 264.7 upon coating (maximum of 1.6-fold and 1.7-fold increase by PEI and PEG, respectively) [see
Table S2 in Additional file 1], thus indicating that the cellular uptake in RAW 264.7 cells is less affected by
the surface properties of the nanoparticles compared to that in SH-SY5Y cells. This is consistent with the
phagocytic nature of the RAW 264.7 cells. Compared to the SH-SY5Y cells, the RAW 264.7 cells achieved
a lower cellular uptake; we postulate that the smaller cellular volume of the RAW 264.7 cells was a limiting
factor compared with the much larger volume of SH-SY5Y cells.
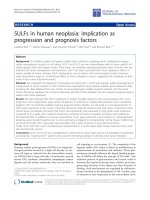
The TEM micrographs were consistent with the ICP data, for the SH-SY5Y cells increased numbers
of intracellular nanoparticles were evident upon coating the particles with PEI and PEG (Figure
1A1,B1,C1). The RAW 264.7 images (Figure 1A2,B2,C2) were also in good agreement with the ICP
measurement whereby PEI and PEG coating had less effect on the total cellular uptake of the nanoparticles.
Cell viability measured by MTS, CellTiter-Blue and CellTiter-Glo assays
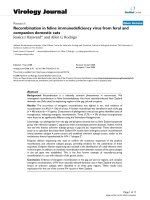
An interesting phenomenon was observed when measuring the cell viability of both the SH-SY5Y (Figure
2A1,B1) and RAW 264.7 (Figure 2A2,B2) cells after incubation with the MNPs using MTS, CellTiter-Blue
and CellTiter-Glo assays
. At increased concentrations, the MNPs became attached to either the cell
membrane or the bottom of the plate, appearing as a brown colour in the well (even after five washes with
fresh culture media) (data not shown). The presence of these MNPs resulted in greater absorption readings
in the MTS assay and thus significantly showed an overestimation of the cell viability (p < 0.05). This
phenomenon could be explained by the adherence of the sticky polymers to the well surface or the positive
amine groups being attracted to the negative charge of the cell membrane. After pegylation, the interference
appeared to have been reduced; however, the value of cell viability that appeared was still larger compared
to the visual inspection of viable cells under microscope (data not shown).
In CellTiter-Blue assay, viable cells reduce resazurin into fluorescent resorufin. Similar to the MTS
assay, the polymer-coated MNPs caused a significant increase in the fluorescent measurement (p < 0.05 with
exception to 1.56 µg mL
−1
MNP-PEI-PEG on SH-SY5Y cells), giving an overexpression with a similar
trend in time dependency (Figure 2). This indicated that the presence of the nanoparticle in cellular
environments increased the fluorescent intensity exhibited by the resorufin dye.
The results for the CellTiter-Glo assay (Figure 2) showed a similar trend to the MTS and CellTiter-
Blue assays. Overall, with increased time and concentration, no significant difference from the actual cell
viability was observed (based on trypan blue exclusion, see below) (p > 0.05). This was observed for both
cell lines.
This unique phenomenon could be due to a number of factors, either the presence of the MNPs both
intracellular and on the membrane of the cells or the nanoparticles themselves interfere with the reagents. In
our experiments, wells with nanoparticles (intracellular or on the cell membrane) and without assay reagents
were used as blanks and were deducted from experimental wells. Furthermore, nanoparticles with assay
reagents in the absence of cells were also analysed, and no significant effect on absorbance, fluorescence or
luminescent readout was observed (data not shown). Therefore, we hypothesise that the increased
absorbance and fluorescence (and to a lesser extent, luminescence) were only evident and elicited by the
combination of cells, nanoparticles and assay reagents.
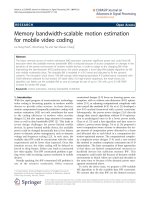
Validation of magnetic nanoparticle cytotoxicity with trypan blue exclusion
Based on the above observations, trypan blue exclusion was used as the gold standard method to validate the
cell viability data obtained by the above assays (Figure 3). This method involved direct counting of viable
cells and hence eliminated the possibility of interference from occurring. The results demonstrated a large
difference between the cell viability data from trypan blue counting and all other three enzyme activity-
based assays, especially those measured by MTS and CellTiter-Blue which involve a group of cellular redox
enzymes (Figure 2). These values correlated well with visual estimations when observed under microscope.
The trypan blue results clearly showed that the MNP-PEI-PEG possessed a significantly less cytotoxic effect
to the cells compared with the MNP-PEI, highlighting the significance of surface charge of the nanoparticles
in determining their biocompatibility (Figure 3).
Cellular reactive oxygen species production and lipid peroxidation upon magnetic nanoparticle
treatment
The above data indicated that commercially available, standard cell viability assay kits may not be suitable
for most nanotoxicity studies. To assess other cellular events that could contribute to the evaluation of
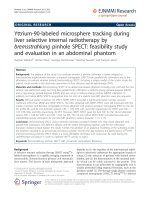
nanotoxicity, we analysed the oxidative stress induced by MNPs. All results were expressed as a percentage
of control cells which were assumed to be 100%. MNP-PEI induced ROS production in a dose-dependent
manner (Figure 4). The ROS level was increased to twofold by MNP-PEI (25 µg mL
−1
) in SH-SY5Y cells
after 72 h compared to that in the control cells. The maximum induction of ROS in RAW 264.7 cells was,
however, lower than that in SH-SY5Y cells (50% increase on control) (25 µg mL
−1
, 24 h), probably
reflecting the relatively higher basal level of intracellular free radicals in macrophages [28]. Strikingly,
pegylated nanoparticles did not appear to affect the ROS level in both the SH-SY5Y and RAW 264.7 cells at
lower concentrations. At 25 µg mL
−1
, a small increase of ROS by MNPs in SH-SY5Y cells was observed
compared to that in the control cells at a 4-h exposure point and remained consistent thereafter.
One of the major damage by the elevated level of ROS in cells is oxidation of polyunsatured fatty
acids in lipid (lipid peroxidation, [LPO]). The results from the thiobarbituric acid reactive substance assay
(Figure 5) showed a similar trend in the level of LPO to that of the ROS in response to MNP treatment
(Figure 4). In general, at higher concentrations and longer incubation times, both the SH-SY5Y and RAW
246.7 cells produced increased levels of LPO when treated with MNP-PEI. After pegylation, the
nanoparticle-induced membrane stress or degradation was again greatly reduced. These results suggested
that the primary amines on the PEI backbone which attribute to the positive charge on the MNP surface play
an important role in inducing cellular oxidative stress. The data also indicated that pegylation of
nanoparticles improves their intracellular stability [29], and hence, with comparable cellular iron content
[see Table S2 in Additional file 1], less free iron is released to the cytosol in MNP-PEI-PEG-treated cells so
that cellular oxidative stress was reduced [30].
Effect of magnetic nanoparticles on cell membrane integrity
Elevated levels of ROS and LPO could cause damage to the biological membrane. The membrane integrity
assay measures the amount of LDH leakage from the cell into the culture media. Figure 6A1,A2 suggests
that after 1 h incubation with MNP-PEI, 5% to 10% of the cell membrane had already experienced
disruption in both SH-SY5Y and RAW 264.7 cells, when taking into account that the basal level of LDH in
culture media was about 10% of the control (‘total’ LDH released to the media). The LDH leakage in SH-
SY5Y cells increased with the incubation time of the MNP-PEI to a maximum of 50% after 72 h; however,
no concentration dependency was exhibited at each time point (Figure 6A1). The cytotoxic effect of MNP-
PEI on the RAW 264.7 cells remained mostly below 10% at 1, 4 and 24 h; however, a large increase in LDH
leakage was observed at 72 h where approximately 70% cell membrane damage effect was observed
(sevenfold increase from the basal level). Again, the membrane disruption appeared to be independent of
nanoparticle concentration (Figure 6A2).
When both the SH-SY5H and RAW 264.7 cells were incubated with the MNP-PEI-PEG
nanoparticles (Figure 6B1,B2), a small but constant (and significant p > 0.05) membrane disruption was
evident. The amount of LDH leakage did not appear to be concentrated or time-dependent. The cytotoxic
effect was consistently less than 10%, indicating that the pegylation of the nanoparticles greatly reduced
their ability to damage the cell membrane.
Discussion
In this study, we successfully coated MNPs with PEI and further modified them with PEG. The zeta
potential measurements for surface charge correlated well with the polymer-coupled nanoparticles [see
Table S1 in Additional file 1]. Cellular uptake results [see Table S2 in Additional file 1] for both the SH-
SY5Y and RAW 264.7 cells further confirmed the polymer attachment as the particles coated with the PEI
and PEI-PEG had more favourable surface properties and resulted in a similar increase in cellular uptake
compared to the uncoated nanoparticles.
The cytotoxicity of the polymer-coated nanoparticles was determined using three commonly used
cytotoxicity assays: MTS, CellTiter-Blue and Cell-Titer-Glo (Figure 2). Our findings suggest that none of
these three assays were suitable for measuring the cytotoxicity of the nanoparticles studied. In contrast to
Häfeli's findings [10], MTS and Titer-Blue assays gave large overestimations of the cell viability in both
SH-SY5Y and RAW 264.7 cells when compared to trypan blue exclusion. However, the Titer-Glo assay
appeared to give the closest readings to those obtained with trypan blue exclusion (Figure 2). It is important
to note that a direct comparison is not appropriate between these assays as they are testing enzyme activities
in different cellular entities; however, from these results, general observations have been made.
In our experience, this phenomenon is neither unique to PEI nor to the MNPs as we obtained similar
observations with other polymers (poly(L-lysine), chitosan, PEG) with homemade nanoparticles (data not
shown). As apparent in our studies, the interference was reduced, but not eliminated with pegylation of the
cationic polymer-coated particle. In an effort to overcome this interference, we coated wells with 0.2% w/v
silica solution to prevent the polymer-coated nanoparticles from attaching to the plates [31]. The results
showed that using the 0.2 % w/v silica solution did decrease the adhesive effect of the nanoparticles on the
well surface; however, all three assays still overestimated the cell viability (data not shown). We
hypothesised that if the MNPs were sticking to the cell membrane, then lysing cells after incubation with
MTS reagents followed by centrifugation (removing cellular debris) could eliminate the interference in
reading from the nanostructure. With these additional steps, the interference was reduced, but not eliminated
(data not shown). We propose that for MTS and CellTiter-Blue assays, the false increase in viability might
be due not only from the physical interference by the nanoparticles (not supported by our data) but also from
changes in cellular activities involved in redox reactions in response to MNPs. This hypothesis merits
further study.
There are many unknown factors that may influence the determination of the cytotoxicity profile of
nanostructures [32]. Recently, the EU NanoSafety Cluster group has suggested that at least four methods of
determining cytotoxicity should be used in order to obtain a reliable safety profile for novel nanomaterials.
The present study has suggested that for our nanoparticles, using trypan blue exclusion is the only accurate
method for determining cell viability (Figure 3). Other methods which are not dependent on cellular redox
activities such as [
3
H]-thymidine incorporation and flow cytometry should be also considered when studying
nanotoxicity. We have shown a reduction in toxicity after pegylation of the MNPs, which could be due to a
number of factors including an increase in the coating diameter upon addition of the PEG moiety [33], thus
increasing the stability of the nanoparticles and further shielding the cells from the iron oxide core. The
cationic charge on the PEI is decreased upon pegylation due to a reduction in the primary amines on the
polymer backbone hence decreasing the cytotoxic effect on the cells [34]. Finally, the presence of the PEG
moiety may provide ‘stealth’ properties as has been widely reported [35-38].
In order to achieve a more in-depth understanding of the degree of cytotoxicity of the MNPs, we also
investigated the effect the polymer-coated nanoparticles had on the integrity of the cell membrane and
oxidative stress the MNPs elicited in cells. The ROS level increased significantly (p < 0.05) in both SH-
SY5Y and RAW264.7 cells when exposed to MNP-PEI, overall in a dose-dependent manner (Figure 4).
LPO in cells exhibited a similar pattern but slightly more fluctuating in SH-SY5Y cells (Figure 5). These
increased ROS and LPO levels were not apparent upon incubation with MNP-PEI-PEG. The LDH leaking
data showed membrane damage which was independent of nanoparticle concentrations for MNP-PEI. This
is contradictory to the cell viability (Figure 3) of MNPs which was clearly dose- and time-dependent. The
trypan blue and LDH assays work on the same principal, porous membranes allowing the passing of
molecules. However, the size cutoff for trypan blue uptake and LDH leakage is not known, and this could
account for the difference in data. We propose that a combination of oxidative stress, membrane disruption
and possibly other factors contributed to the decrease of cell viability by MNP-PEI. In contrast, for MNP-
PEI-PEG, the loss of cell viability over this time period could be attributed to cellular events other than
oxidative stress and cell membrane damage and requires further study. As both SH-SY5Y and RAW264.7
cells possess complex functions due to their origin, other factors in both intra- and extracellular
environments could be involved in the cellular responses. More studies to investigate these factors are
underway in our laboratory.
Conclusion
Our findings show that great caution should be exercised when interpreting cell viability data from common
commercial assays on novel nanoparticulates. Our data strongly suggested that nanotoxicity analysis
requires a different approach compared to conventional toxicity studies used for cytotoxic drugs and other
molecules which are usually much less complex and smaller than nanostructures. Our results also indicate
that cell viability measurement should be complemented with analysis of other cellular events when
interpreting the cytotoxicity and biocompatibility profile of nanoparticles.
Competing interests
The authors declare that they have no competing interests.
Authors' contributions
CH carried out the coating, characterisation and cell experiments and wrote the paper. LY supervised the
work. WPC carried out the photon correlation spectroscopy and zeta potential measurements, and AC was a
scientific advisor. All authors read and approved the final manuscript.
Acknowledgements
This work was funded by the NanoSci-E+ Consortium and EPSRC UK (EP/H007040/1) (to L. Wang). All
TEM images were carried out by Mr. John James in the College of Life Sciences, University of Dundee. ICP
studies were carried out in the School of Pharmacy and Life Sciences, Robert Gordon University, Aberdeen.
Photon correlation spectroscopy and zeta potential measurements were carried out by Mr Yousef Al-Ebini in
the School of Pharmacy, University of Hertfordshire.
Endnotes
a
ROS, LPO and LDH assays were previously checked for interferences and found to be unaffected by the
nanoparticle presence. All statistical significance was assessed using t test analysis via Microsoft
®
Excel
®
2010 (Microsoft Corporation, Redmond, WA, USA) to a 95% confidence interval.
References
1. McCarthy JR, Weissleder R: Multifunctional magnetic nanoparticles for
targeted imaging and therapy. Adv Drug Deliver Rev 2008, 60:1241-1251.
2. Shubayev VI, Pisanic TR, Jin S: Magnetic nanoparticles for theragnostics.
Adv Drug Deliver Rev 2009, 61:467-477.
3. Bulte JWM, Douglas T, Witwer B, Zhang S-C, Strable E, Lewis BK, Zywicke
H, Miller B, van Gelderen P, Moskowitz BM, Duncan ID, Frank JA:
Magnetodendrimers allow endosomal magnetic labelling and in vivo tracking
of stem cells. Nat Biotechnol 2001, 19:1141-1147.
4. Syková E, Jendelová P: Migration, fate and in vivo imaging of adult stem
cells in the CNS. Cell Death Differ 2007, 14:1336-1342.
5. Veiseh O, Gunn JW, Zhang M: Design and fabrication of magnetic
nanoparticles for targeted drug delivery and imaging. Adv Drug Deliver Rev
2010, 62:284-304.
6. Wang YXJ, Hussain SM, Krestin GP: Superparamagnetic iron oxide
contrast agents: physiochemical characteristics and applications in MR
imaging. Eur Radiol 2001, 11:2319-2684.
7. Bonnemain B: Superparamagnetic agents in magnetic resonance imaging:
Physiochemical characteristics and clinical applications – a Review. J Drug
Target 1998, 6:167-174.
8. Laurent S, Forge D, Port M, Roch A, Robic C, Vander Elst L, Muller RN:
Magnetic iron oxide nanoparticles: synthesis, stabilization, vectorization,
physiochemical characterizations and biological applications. Chem Rev 2008,
108:2064-2110.
9. Sun C, Lee JSH, Zhang MQ: Magnetic nanoparticles in MR imaging and
drug delivery. Adv Drug Deliver Rev 2008, 60:1252-1265.
10. Häfeli OU, Riffle JS, Harris-Shekhawat l, Carmichael-Baranauskas A, Mark
F, Dalley JP, Bardenstein D: Cell uptake and in vitro toxicity of magnetic
nanoparticles suitable for drug delivery. Mol Pharm 2009, 6:1417-1428.
11. Fisichella M, Dabboue H, Bhattacharyya S, Saboungi M-L, Salvetat J-P,
Hevor T, Guerin M: Mesoporous silica nanoparticles enhance MTT formazan
exocytosis in HeLa cells and astrocytes. Toxicol in Vitro 2009, 23:697-703.
12. Belyanskaya L, Manser P, Spohn P, Bruinink A, Wick P: The reliability and
limits of the MTT reduction assay for carbon nanotubes-cell interaction.
Carbon 2007, 45:2643-2648.
13. Casey A, Herzog E, Davoren M, Lyng FM, Byrne HJ, Chambers G:
Spectroscopic analysis confirms the interactions between single walled
carbon nanotubes and various dyes commonly used to assess cytotoxicity.
Carbon 2007, 45:1425-1432.
14. Wörle-Knirsch JM, Pulskamp K, Krug HF: Oops they did it again! Carbon
nanotubes hoax scientists in viability assays. NanoLett 2006, 6:1261-1268.
15. Shvedova AA, Kisin ER, Schute P, Kagan VE, Fadeel B, Castranova V:
Mechanisms of pulmonary toxicity and medical applications of carbon
nanotubes: two faces of Janus. Pharmacol Therapeut 2009, 121:192-204.
16. Cheng C, Müller KH, Koziol KKK, Skepper JN, Midgley PA, Welland ME,
Porter AE: Toxicity and imaging of multi-walled carbon nanotubes in human
macrophage cells. Biomaterials 2009, 30:4152-4160.
17. Monteiro-Piviere NA, Inman AO: Challenges for assessing carbon
nanomaterial toxicity to the skin. Carbon 2006, 44:1070-1078.
18. Davoren M, Herzog E, Casey A, Cottineau B, Chambers G, Byrne HJ, Lying
FM: In vitro toxicity evaluation of single walled carbon nanotubes on human
A549 lung cells. Toxicol in Vitro 2007, 21:438-448.
19. Gupta AK, Gupta M: Synthesis and surface engineering or iron oxide
nanoparticles for biomedical applications. Biomaterials 2005, 26:3995-4021.
20. Figuerola A, Di Corato R, Manna L, Pellegrino T: From iron oxide
nanoparticles towards advanced iron-based inorganic materials designed for
biomedical applications. Pharmacol Res 2010, 62:126-143.
21. Steitz B, Hofmann H, Kamau SW, Hassa PO, Hottiger MO, von Rechenberg
B, Hofmann-Amtenbrink M, Petri-Fink A: Characterization of PEI-coated
superparamagnetic iron oxide nanoparticles for transfection: size
distribution, colloidal properties and DNA interaction. J Magn Magn Mater
2007, 311:300-305.
22. Petri-Fink A, Steitz B, Finka A, Salaklang J, Hofmann H: Effect of cell media
on polymer coated superparamagnetic iron oxide nanoparticles (SPIONs):
colloidal stability, cytotoxicity and cellular uptake studies. Eur J Pharm
Biopharm 2008, 68:129-137.
23. Leng Y, Sato K, Li J-G, Ishigaki T, Iijima M, Kamiya H, Yoshida T: Iron
nanoparticles dispersible in both ethanol and water for direct silica coating.
Powder Technol 2009, 196:80-84.
24. Peng J, Zou F, Liu L, Tang L, Yu L, Chen W, Liu H, Tang J-b, Wu L-x:
Preparation and characterization of PEG-PEI/Fe3o4 nano-magnetic fluid by
co-precipitation method. Trans Nonferrous Met Soc China 2008, 18:393-398.
25. Vila A, Gill H, McCallion O, Alonso MJ: Transport of PLA-PEG particles
across the nasal mucosa: effect of particle size and PEG coating density. J
Control Release 2004, 98:231-244.
26. Jόzejczak A, Skumiel A: Ultrasonic investigation of magnetic nanoparticles
suspension with PEG biocompatible coating. J Magn Magn Mater 2011,
11:1509-1516.
27. Douziech-Eyrolles l, Marchais H, Hervé K, Munnier E, Soucé M, Linassier C,
Dubois P, Chourpa: Nanovectors for anticancer agents based on
superparamagnetic iron oxide nanoparticles. Int J Nanomedicine 2007, 2:541-
550.
28. Komuro I, Keicho N, Iwamoto A, Akagawa KS: Human alveolar
macrophages and granulocyte-macrophage colony-stimulating factor-
induced monocyte-derived macrophages are resistant to H
2
O
2
via their high
basal and inducible levels of catalase activity. J Biol Chem 2001, 276:24360-
24364.
29. Mishra S, Webster P, Davis ME: PEGylation significantly affects cellular
uptake and intracellular trafficking of non-viral gene delivery particles. Eur J
Cell Biol 2004, 83:97-111.
30. Auffan M, Rose J, Wiesner MR, Bottero J-Y: Chemical stability of metallic
nanoparticles: a paramtere controlling their potential cellular toxicity in
vitro. Environmental Pollution 2009, 157:1127-1133.
31. Zhang S, Kucharski C, Doschak MR, Sebald W, Iludag H: Polyethylenimine-
PEG coated albumin nanoparticles for BMP-2 delivery. Biomaterials 2010,
31:952-963.
32. Fadeel B, Garcia-Bennett AE: Better safe than sorry: understanding the
toxicological properties of inorganic nanoparticles manufactured for
biomedical applications. Adv Drug Deliver Rev 2010, 62:362-374.
33. Cole AJ, David AE, Wang J, Galbán CJ, Hill HL, Yang VC: Polyethylene
glycol modified, cross-lined starch-coated iron oxide nanoparticles for
enhanced magnetic tumour targeting. Biomaterials 2011, 32:2183-2193.
34. Aravindan L, Bicknell KA, Brooks G, Khutoryanskiy VV, Williams AC:
Effect of acyl chain length on transfection efficiency and toxicity of
polyethlyenimine. Int J Pharm 2009, 378:201-210.
35. Moffatt S, Cristiano RJ: Uptake characteristics of NGR-coupled stealth
PEI/pDNA nanoparticles loaded with PLGA-PEG-PLGA tri-block
copolymer for targeted delivery to human monocyte-derived dentritic cells.
Int J Pharm 2006, 321:143-154.
36. Photos PJ, Bacakova L, Discher B, Bates FS, Discher DE: Polymer vesicles
in vivo: correlations with PEG molecular weight. J Control Release 2003,
90:323-334.
37. Li S-D, Huang L: Stealth nanoparticles: high density but sheddable PEG is
a key for tumour targeting. J Control Release 2010, 145:178-181.
38. Feng B, Hong RY, Wang LS, Guo L, Li HZ, Ding J, Zheng Y, Wei DG:
Synthesis of Fe
3
o
4
/APTES/PEG diacid functionalised magnetic nanoparticles
for MR imaging. Colloid Surface A 2008, 328:52-59.
Figure 1. TEM images show cellular uptake of magnetic nanoparticles. A1 MNP
incubated with SH-SY5Y cells, A2 MNP incubated with RAW 264.7 cells, B1 MNP-
PEI incubated with SH-SY5Y cells, B2 MNP-PEI incubated with RAW 264.7 cells,
C1 MNP-PEI-PEG incubated with SH-SY5Y cells and C2 MNP-PEI-PEG incubated
with RAW 264.7 cells. Samples were incubated with cells at 6.25 µg mL
−1
for 24 h,
and internalisation of nanoparticles was analysed by TEM as described in the
‘Methods’ section.
Figure 2. Cell viability of SH-SY5Y and RAW 264.7 cells. A1 SH-SY5Y cells
incubated with MNP-PEI nanoparticles, A2 RAW 264.7 cells incubated with MNP-
PEI nanoparticles, B1 SH-SY5Y cells incubated with MNP-PEI-PEG nanoparticles
and B2 RAW 264.7 cells incubated with MNP-PEI-PEG nanoparticles. The cells were
incubated at different concentrations as indicated over a 72-h incubation. Cell
viability was determined using common assays including MTS assay (square),
CellTiter-Blue assay (triangle), CellTiter-Glo assay (circle) and trypan blue counting
(diamond). (n = 3 ± SE). Asterisk denotes significantly increased level of cell viability
compared with trypan blue measurement (p < 0.05).
Figure 3. Cell viability assessed by trypan blue exclusion. Nanoparticles MNP-PEI
and MNP-PEI-PEG at 1.56 (white bar), 3.125 (light grey bar), 6.25 (grey bar), 12.5
(dark grey bar) and 25 µg mL
−1
(black bar) were incubated with SH-SY5Y and RAW
264.7 cells over a period of 168 h. A1 MNP-PEI nanoparticles incubated with SH-
SY5Y cells, A2 MNP-PEI nanoparticles incubated with RAW 264.7 cells, B1 MNP-
PEI-PEG incubated with SH-SY5Y cells and B2 MNP-PEI-PEG incubated with RAW
264.7 cells. Experiments were performed three times, and data were expressed as
mean ± standard errors. Asterisk denotes significant decrease in viability compared
with control cells; square denotes significant increase in cell viability compared to
MNP-PEI samples at a similar concentration and incubation time (p < 0.05).
Figure 4. ROS production in SH-SY5Y and RAW 246.7 cells. The cells were
incubated with MNP-PEI and MNP-PEI-PEG at 1.56 (white bar), 3.125 (light grey
bar), 6.25 (grey bar), 12.5 (dark grey bar) and 25 µg mL
−
1 (black bar) over a period of
72 h. A1 SH-SY5Y cells incubated with MNP-PEI, A2 RAW 246.7 cells incubated
with MNP-PEI, B1 SH-SY5Y cells incubated with MNP-PEI-PEG, B2 RAW 246.7
cells incubated with MNP-PEI-PEG. Data were expressed as a percentage of control
cells. (n = 3 ± SE). Asterisk denotes significant increase in the percentage of DCF
fluorescence compared with control cells (p, 0.05).
Figure 5. Lipid peroxidation of SH-SY5Y and RAW 246.7 cells. LPO of the cells
in response to MNP-PEI and MNP-PEI-PEG at 1.56 (white bar), 3.125 (light grey
bar), 6.25 (grey bar), 12.5 (dark grey bar) and 25 µg mL
−1
(black bar) over a period of
72 h. A1 LPO of SH-SY5Y cells in response to MNP-PEI, A2 LPO of RAW 246.7
cells in response to MNP-PEI, B1 LPO of SH-SY5Y cells in response to MNP-PEI-
PEG and B2 LPO of RAW 246.7 cells in response to MNP-PEI-PEG. LPO values
were calculated and expressed as nanomoles of MDA per milligram of cellular
protein. (n = 3 ± SE.). Asterisk denotes significant increase compared to control cells
(p, 0.05).
Figure 6. Cell membrane integrity analysis via LDH leakage from cells. Assay
carried out in SH-SY5Y and RAW 264.7 cells incubated with MNP-PEI and MNP-
PEI-PEG at 0 (white bar), 1.56 (light grey bar), 3.125 (grey bar), 6.25 (dark grey bar),
12.5 (very dark grey bar) and 25 µg mL
−1
(black bar) over a period of 72 h (n = 3 ±
SE). A1 SH-SY5 cells incubated with MNP-PEI, A2 RAW 264.7 cells incubated with
MNP-PEI, B1 SH-SY5 cells incubated MNP-PEI-PEG and B2 RAW 264.7 cells
incubated with MNP-PEI-PEG. Results were calculated and compared to the positive
control, whereby cells were lysed and 100% LDH release was assumed. Asterisk
denotes significant increase compared with basal levels of LDH (p, 0.05).
Additional Files
Additional file 1
Title: Supplementary tables
Description: Two tables showing the physiochemical properties of MNP and polymer-
coated MNP carried out by ICP analysis and photon correlation spectroscopy and the
cellular uptake of MNP and polymer-coated MNP in SH-SY5Y and RAW 264.7 cells
at 0, 1.56, 6.25, 25 µg mL
−1
over 24 h (n = 3).
B1
C1
A2
C2
B2
A1
500 nm
500 nm
500 nm
500 nm
500 nm
500 nm
Figure 1
Figure 2
Figure 3
Figure 4
Figure 5
Figure 6
Additional files provided with this submission:
Additional file 1: Tables.doc, 44K
/>