Biomedical Engineering Trends Research and Technologies Part 5 ppt
Bạn đang xem bản rút gọn của tài liệu. Xem và tải ngay bản đầy đủ của tài liệu tại đây (2.69 MB, 40 trang )
7
Clinical Application of Automatic Gene Chip
Analyzer (WEnCA-Chipball) for Mutant KRAS
Detection in Peripheral Circulating Tumor Cells
of Cancer Patients
Suz-Kai Hsiung
1,2
, Shiu-Ru Lin
1,2
, Hui-Jen Chang
1,2
,
Yi-Fang Chen
3,
and Ming-Yii Huang
4,5
1
Department of Medical Research, Fooyin University Hospital, Pingtung,
2
School of Medical and Health Science, Fooyin University, Koahsiung,
3
Gene Target Technology Co.Ltd, Koahsiung,
4
Department of Radiation Oncology, Kaohsiung Medical University Hospital,Kaohsiung,
5
Department of Radiation Oncology, Faculty of Medicine, College of Medicine,
Kaohsiung Medical University, Kaohsiung
Taiwan, ROC
1. Introduction
KRAS is an important oncogene that participates in the mitogen-activated protein kinase
(MAPK) pathway. The MAPK pathway is involved in various cellular functions, including
cell proliferation, differentiation and migration. Mutations in KRAS are found in many
types of malignancies including lung cancer (Fong et al., 1998; Slebos & Rodenhuis, 1989;
Chen et al., 2003; Siegfried et al., 1997), colorectal cancer (Calistri et al., 2006; Weijenberg et
al., 2008; Wang et al., 2007), and pancreatic cancer (Smit et al., 1988; Gocke et al., 1997). As
early as 1989, Slebos et al. have identified that the KRAS mutation status can be used for
lung cancer detection or prognosis prediction (Slebos & Rodenhuis, 1989). In 1995,
Yakubovskaya et al. detected 12 different KRAS mutations in nearly 60% of tissue specimens
of non-small cell lung cancer (NSCLC) patients (Yakubovskaya et al., 1995). As for
pancreatic, stomach and breast cancers, there have been a number of studies reporting
KRAS mutations (Smit et al., 1988; Gocke et al., 1997; Deramaudt & Rustgi, 2005; Carstens et
al., 1988; Lee et al., 2003; Shen et al., 2008). The predictive value of KRAS mutation in
metastatic colorectal cancer patients treated with cetuximab plus chemotherapy has recently
been shown in that patients with tumor KRAS mutation were resistant to cetuximab and
had shorter progression survival and overall survival times compared with patients without
mutation (Lievre et al., 2006; Lievre et al., 2008). Additionally, NCCNClinical Practice
Guidelines in Oncology Version 3, 2008, strongly recommends KRAS genotyping of tumor
tissue (either primary tumor or metastasis) in all patients with metastatic colorectal cancer
before treatment with epidermal growth factor receptor (EGFR) inhibitors. KRAS mutational
analysis has advantages over attempts to predict responsiveness to anti-EGFR antibodies.
Biomedical Engineering, Trends, Research and Technologies
152
To date, detection of KRAS mutations are limited to traditional techniques. The traditional
techniques such as direct sequencing, polymerase chain reaction and restriction fragment
length polymorphism are complicated and can easily be used only in tissue samples, which
limits KRAS mutation detection in clinical applications. In order to improve the mutant
KRAS detection efficiency, we successfully developed an Activating KRAS Detection Chip
and colorimetric membrane array (CLMA) technique capable of detecting KRAS mutation
status by screening circulating carcinoma cells in the surrounding bloodstream (Chen et al.,
2005; Wang et al., 2006; Chong et al., 2007; Yang et al., 2009; Yen et al., 2009; Yang et al.,
2010). However, the sensitivity still needs further improvement. In addition, the digoxigenin
enzyme used on the colorimetric gene chip platform is too costly for routine laboratory
diagnosis, and the high criteria of the operation techniques have prevented its widespread
availability for clinical applications. Therefore, we have developed the next generation gene
chip operation platform named the weighted enzymatic chip array (WEnCA), as shown in
figure 1. The technical difference between the WEnCA and CLMA system includes the
different weighted value for each gene target on the gene chip of the WEnCA system,
dependent on the importance of each gene during the cancer development process.
Furthermore, the conventional digoxigenin system was replaced by the biotin-avidin
enzyme system to lower the cost. The manual operation process of the WEnCA system has
been successful established and published (Tsao et al., 2010; Yen et al., 2010). The proposed
platform may benefit post-operative patients or facilitate patient follow-ups, and also bring
breakthrough improvements in the prediction and evaluation of the therapeutic effects of
anti-EFGR drugs. However, as the technical threshold of chip array remained relatively
high, human errors during clinical examinations were commonly seen, and the propagation
of associating operations somehow became restricted.
The analysis of gene overexpression has led to fundamental progress and clinical advances
in the diagnosis of disease
(Chen et al., 2005; Wang et al., 2006). The techniques that are
commonly used to study gene overexpression include Northern blot, reverse transcriptase
polymerase chain reaction (RT-PCR), and real-time PCR (Chong et al., 2007; Yen et al., 2009;
Yanget al., 2009). Since Northern blot involves complex steps and a large numbers of
samples, its application is limited to research instead of clinical diagnosis. On the other
hand, since RT-PCR and real-time PCR are performed through a series of simple steps, they
are applied extensively for the detection of a single gene, as with the hepatitis virus and
infectious pathogens
(Yang et al., 2010; Tsao et al., 2010). Although the invention of PCR
ranks as one of the greatest discoveries of all time, most PCR techniques have a few
common problems: (1) contamination, i.e., false positive results from oversensitive detection
of, say, aerosolized DNA or previous sample carry-over; (2) RT-PCR is regarded as only
semi-quantitative, since it is difficult to control the efficiency of sequence amplification
when comparing different samples; and (3) interference is caused by annealing between the
primers. RT-PCR or real-time PCR is used extensively in the detection of a single-gene target
(Yen et al., 2010; Harder et al., 2009; Sheu et al., 2006). For the detection of multiple targets or
gene clusters, PCR-related techniques tend to have the disadvantages of being time-
consuming, cumbersome and costly.
The rapid development of biotechnology in recent years has made gene chips an important
tool in clinical diagnosis or drug efficacy evaluation
(Popovtzer et al., 2008). Our previous
study has developed and evaluated a membrane array-based method for simultaneously
detecting the expression levels of multiple mRNA markers from circulating cancer cells in
the peripheral blood for cancer diagnosis (Chen et al., 2006). In those studies, the expression
Clinical Application of Automatic Gene Chip Analyzer (WEnCA-Chipball)
for Mutant KRAS Detection in Peripheral Circulating Tumor Cells of Cancer Patients
153
levels of molecular markers were simultaneously evaluated by RT-PCR and membrane
array. Data obtained from RT-PCR and membrane array were subjected to linear regression
analysis, revealing a high degree of correlation between the results of these two methods
(r=0.979, P<0.0001)
(Chen et al., 2006). However, even though the array-based chip
technology has proven to be a powerful platform for gene overexpression analysis, some
drawbacks still exists and may hinder its practical applications. Two of the critical issues are
its tedious sample pretreatment and time-consuming hybridization process. Sample
pretreatment process including cell lysis, DNA/RNA extraction and several tedious
washing process requiring well-trained personnel and specific instruments, which indicate
that the array methods can be only operated in a central lab or medical center, and also
limited its applicability for clinical diagnosis. Besides, the manual operation may cause the
fragile RNA samples to be degraded by the surrounding RNases (Chirgwin et al., 1979;
Chomczynski, 1993). Recently, magnetic bead-based extraction has been widely employed
for high-quality RNA extraction. When compared with the conventional methods, the high-
quality RNA samples can be stably extracted by simply applying an external magnetic field.
Regarding to the hybridization process, it is another time-consuming process due to slow
diffusion between target and immobilized probes for conventional array technology. It has
been reported that proper mixing is important to achieve an efficient hybridization
(Southern et al., 1999). The rotation of the array was reported to be effective in reduction of
hybridization time (Chee et al., 1996). Regarding to the above-mentioned issues, there is a
great need to develop a rapid and automatic sample pretreatment platform to isolate
specific RNA samples from cells and efficient hybridization for array-based methods.
With the rapid advancements in the field of fluid manipulation technology, and especially
biomedicine development in recent years, automated and rapid biomedical analysis is now
considered to offer the greatest potential and market value
(Chen et al., 2003; Siegfried et al.,
1997). In terms of biomedical applications, the automatic biomedical analysis system that
integrated of several fluid manipulation device including transportation, mixing and
heating, which based on the “Lab-on-a-chip” concept, has the advantages of high detection
sensitivity, portability, low sample/test sample consumption, low power consumption,
compact size, and low cost. Compared to the conventional analysis techniques, it represents
a significant breakthrough. With a variety of innovative techniques, a wide range of
precision fluid manipulation devices have been integrated to control biological fluids such
as whole blood, reagents and buffers, to reduce the size of the biochemical analytical
instruments, and integrate the processes into a one-step automated system that facilitates
the rapid conducting of biomedical analysis from samples to results
(Calistri et al., 2006). In
this research, the integrated fluid manipulation technology is adopted to operate the
WEnCA platform (figure 1), significantly reduce detection time and errors arising from
human operation. Thus, the bottleneck that was preventing the commercialization of the
chip detection technique has been overcome. In the current study, we developed an
automatic gene chip analyzer which named Chipball (as shown in Fig. 3b), and we have
introduced an automatic WEnCA operating platform to improve the manual operations.
The system is designated the ‘WEnCA-Chipball system’, as shown in figure 2. In order to
understand the difference between test results obtained by operating the WEnCA-Chipball
and WEnCA-manual systems, and to assess the clinical applications of the WEnCA-Chipball
system a number of screenings were evaluated. The WEnCA-Chipball platform can be
automatically operated to effectively reduce the manual errors and limitations due to
current technical criteria.
Biomedical Engineering, Trends, Research and Technologies
154
Fig. 1. The manual operation platform of Weighted Enzymatic Chip array (WEnCA)
(Hsiung, et al., 2009).
Fig. 2. The automatic WEnCA-Chipball operation platform (Hsiung, et al., 2009).
Clinical Application of Automatic Gene Chip Analyzer (WEnCA-Chipball)
for Mutant KRAS Detection in Peripheral Circulating Tumor Cells of Cancer Patients
155
In addition, the activated KRAS expression in blood samples of 209 lung cancer patients was
determined according to the experimental procedure shown in Figure 3 and then analyzed
by both WEnCA-manual and WEnCA-Chipball; the results were compared and the clinical
applicability of WEnCA-Chipball was defined. Further comparisons were performed on the
sensitivity, the specificity and the accuracy of the WEnCA-manual and WEnCA-Chipball;
the application, the operation time, and the cost of the two platforms were investigated to
evaluate the clinical applicability potential of WEnCA-Chipball.
(a)
(b)
Fig. 3. (a) The research flow chart of current study (Hsiung, et al., 2009). (b) Photograph of
the proposed automatic gene chip analyzer.
Biomedical Engineering, Trends, Research and Technologies
156
2. Materials and methods
2.1 Specimens collection
Initially, cancer tissues from two hundreds selected cancer patients including 85 patients
with breast cancer, 64 patients with colorectal cancer (CRC), and 51 patients with non-small
cell lung cancer (NSCLC) cancer who had undergone surgical resection or biopsy between
January 2007 and December 2008 were enrolled into this study. The data from the 200
cancerous patients were used for the analysis of sensitivity, specificity and diagnostic
accuracy of WEnCA-Chipball. Tissue samples from various cancer patients were divided into
two groups, one group of 100 cancer tissues with KRAS mutation including 32 CRCs, 51
breast cancers and 17 NSCLCs and the other group of 100 cancer tissues without KRAS
mutation including 32 CRCs, 34 breast cancers and 34 NSCLCs were used to determine the
cut-off-value of weighted enzymatic chip array method for further circulating tumor cells
(CTCs) analysis of 209 lung cancer patients. In order to clinically evaluate and compare both
two systems, CLMA and WEnCA-Chipball; blood specimens were collected within test
tubes containing anticoagulant sodium citrate from 209 lung cancer patients. To avoid
contamination of skin cells, the blood sample was taken via an intravenous catheter, plus the
first few milliliters of blood were discarded. Total RNA was immediately extracted from the
peripheral whole blood, and then served as a template for cDNA synthesis. Sample
acquisition and subsequent usage were approved by the Institutional Review Boards of
three hospitals. Written informed consent was obtained from all participants.
2.2 Total RNA isolation and cDNA synthesis
Total RNA was isolated from the collected cancer tissue specimens using the acid –
quanidium-phenol-chloroform (AGPC) method according to the standard protocol. The
RNA concentration was determined spectrophotometrically based on the absorbance at 260
nm. First-strand cDNA was synthesized from total RNA using the Advantage RT-PCR kit
(Promega, Madison, WI) and then reverse transcription was performed in a reaction mixture
consisting of Transcription Optimized Buffer, 25 mg=mL Oligo (dT)15, Primer, 100mM=L
PCR Nucleotide Mix, 200 mM=L MLV Reverse Transcriptase, and 25 mL Recombinant
RNasin Ribonuclease Inhibitor. The reaction mixtures were incubated at 42ºC for 2 h, heated
to 95ºC for 5 min, and then stored at 48ºC until the analysis.
2.3 Establishment of membrane array-based method
The rapid development of biotechnology in recent years has made gene chips an important
tool in clinical diagnosis or drug efficacy assessment (Popovtzer et al., 2008). Visual OMP3
(Oligonucleotide Modeling Platform, DNA Software, Ann Arbor, MN) was used to design
probes for each target gene and β-actin, the latter of which was used as an internal control.
The probe selection criteria included strong mismatch discrimination, minimal or no
secondary structure, signal strength at the assay temperature, and lack of cross-
hybridization. The oligonucleotide probes were then synthesized according to the designed
sequences, purified, and controlled before being grafted onto the substracts. The newly
synthesized oligonucleotide fragments were dissolved in distilled water to a concentration
of 20 mM, applied to a BioJet Plus 3000 nL dispensing system (BioDot, Irvine, CA), which
blotted the selected target oligonucleotides and TB (Mycobacterium tuberculosis) and the β-
actin control sequentially (0.05 µL per spot and 1.5 mm between spots) on SuPerCharge
nylon membrane (Schleicher and Schuell, Dassel, Germany) in triplicate. Dimethyl sulfoxide
Clinical Application of Automatic Gene Chip Analyzer (WEnCA-Chipball)
for Mutant KRAS Detection in Peripheral Circulating Tumor Cells of Cancer Patients
157
(DMSO) was also dispensed onto the membrane as a blank control. In addition, the
housekeeping gene was β-actin while the bacterial gene was derived from Mycobacterium
tuberculosis. Both served as positive and negative controls, respectively, and blotted on the
membrane. After rapid drying and cross-linking procedures, the preparation of membrane
array for target genes expression was accomplished. Our previous study developed and
evaluated a membrane array-based method simultaneously detecting the expression levels
of multiple mRNA markers from circulating cancer cells in peripheral blood for cancer
diagnosis (Wang et al., 2006; Yen et al., 2009; Tsao et al., 2010). We have carried out
membrane array analysis using normal human adrenal cortical cells with KRAS mutation,
and obtained 22 upregulated genes most closely related to the KRAS oncogene through
bioinformatic analysis. The Activating KRAS Detection Chip for detecting the activated
KRAS from peripheral blood was successfully constructed. Although this method is a
convenient way of directly using peripheral blood for detecting KRAS activation, and has
achieved major breakthroughs in clinical applications, the sensitivity of this technique is
only about 84% (Chen et al., 2005).
The colorimetric membrane array (CLMA) was reported in clinical applications for
diagnosis of cancer (Harder et al., 2009; Sheu et al., 2006). By the CLMA method, the
interpretation importance of each gene is equally included in the diagnosis and each gene is
calculated by the same value; this does not evaluate or differentiate the importance of each
gene for specific disease diagnosis. That is a major limitation of this technique in clinical
application (Tsao et al., 2010). In addition, the cost of the digoxigenin enzyme used on the
CLMA platform was too high for routine laboratory diagnosis, and the high criteria of the
operation techniques prevented its widespread availability for clinical applications.
Therefore, as mentioned above, our team developed a new generation gene chip operation
platform designated as WEnCA. The technical difference between the WEnCA system and
the conventional membrane array includes the different weighted value for each gene target
on the gene chip, dependent on the importance of each gene during the carcinogenesis of
cancer. Furthermore, the conventional digoxigenin system was replaced by the biotin-avidin
enzyme system to lower costs.
2.4 Configuration of integrated automatic gene chip analyzer
In order to realize the concept of automatic performing the gene chip operation procedure
from samples to images, an integration system composed of several modules including fluid
manipulation, temperature controlling, magnetic controlling, actuation, image acquiring
and operation platform was investigated, which can perform the critical procedure of array-
based gene chip operation such as sample pretreatment, DNA/mRNA purification, reverse
transcription, probe labeling and hybridization process, and the image of the gene chip can
be acquired automatically after the hybridization as well. The framework of the proposed
automatic gene chip analyzer was shown in Fig. 4. Regarding to the Lab-on-chip concept,
we have designed an operation platform to provide the interaction fields of the fluid such as
samples and reagents, and gene chip operation. The operation platform also was considered
as an interface between the sample/reagents and instrument, so that the fluid can be
manipulated by utilizing the external devices. In addition, a vessel device contains
corresponding reagents to specific process was included in the system. Briefly, the major
functions of the proposed system were samples/reagents manipulation, cell lysis, mRNA
collection/purification, reverse transcription, probe labeling, and gene chip hybridization.
Biomedical Engineering, Trends, Research and Technologies
158
The images of gene expression can be acquired accordingly. As mentioned above, several
modules were designed to achieve these functions. For sample/reagents transporting,
samples and reagents can be manipulated and transported through the micro piezoelectric
pump device, the volume can be controlled precisely and the operation process can be
performed in sequence. By utilizing the fluid manipulation device, the reagents can be
sucked and transported from the vessel to the operation platform in specific area, and the
reactants can be manipulated between the reaction chambers, the wasted fluid also can be
excluded from the operation platform accordingly. Since the temperature control is the
critical issue for the gene chip operation, the temperature of each operation process such as
cell lysis and hybridization can also be controlled by embedded heaters and thermal
sensors, the temperatures, heating/cooling rates and thermal distribution can be well
controlled. Compare to the time-consuming and instrument-intensive conventional method
of mRNA purification, the commercial magnetic beads were utilized to realize the automatic
mRNA purification in this system, and a magnetic controlling device was designed for the
magnetic beads manipulation, so that the mRNA can be collected accordingly. Furthermore,
for the purpose of interaction enhancing, an active mixing device for shaking mechanism
was added into the system. By utilizing the simplified design, the operation platform can be
rotated to generate the mixing effect of the samples and reagents inside the operation
platform. Finally, the images of the gene chip representing the gene expression can be
obtained after all the operation process, and the images can be recorded by the image
acquiring device, which including the CCD (Charged-couple device) and image analysis
software. The image data can be stored and transmitted to the central laboratory via
internet.
Fig. 4. The framework of the proposed automatic gene chip analyzer.
2.5 Design of the operation platform
In this study, for the purpose to provide the interface between sample/reagents and
modules which can control the critical parameters of each process, an operation platform
has been designed to perform the sample manipulation and gene analysis. For easy
Clinical Application of Automatic Gene Chip Analyzer (WEnCA-Chipball)
for Mutant KRAS Detection in Peripheral Circulating Tumor Cells of Cancer Patients
159
fabrication and low cost, the material utilized for the operation platform was
Polymethylmethacrylate (PMMA), the width and length of the substrate was 10 cm each,
and the thickness was 1 cm. As shown in Fig. 5, we have divided the platform into four
chambers for specific operation process, including sample pretreatment area, sample
purification area, transcription and probe labeling area, and hybridization area. The four
areas were fabricated by a micro-milling machine, the diameter and depth of each chamber
has been calculated precisely to ensure the volume was sufficient for each process. Initially,
a membrane array device with specific gene probes was first integrated into the
hybridization area, and then the operation platform was placed onto a telescopic loading
tray structure, which was designed in this system for the orientation and operation of the
platform with external controlling device. Each area on the platform was corresponding to
an external module for its specific operation process. For instance, a temperature controlling
device embedded onto the tray structure including a set of heater and thermal sensor was
placed underneath the sample pretreatment area for cell lysis application. We have set up
three temperature controlling device corresponding to area I, III and IV for the adjustment
of operation temperature, and a simple design of magnet lift-up mechanism to control the
magnetic force and collect the magnetic beads in area II for mRNA purifying application. In
order to transport the reagents into the operation chamber and manipulate the
sample/reagents between the chambers, several commercial piezoelectric pumps were
utilized. Sets of sucking needles were inserted into the reagent vessels and operation
chamber before the piezoelectric pumps were activated, and corresponding
samples/reagents can be transported to the specific chamber by activating specific pump.
After the samples/reagents transportation in each chamber, a mixing mechanism was
required for the sample interactions. The tray structure and operation platform can be
clockwise rotated simultaneously by utilizing a cam and electric motor device. The rotation
speed can be adjusted within a dynamic range from 50 to 200 rpm. As shown in fig. 5, the
Fig. 5. Illustration of the fluidic operation platform, which divided into four areas, the
blood/specimen can be operated sequentially through the four operation process. The
membrane array device was firstly integrated into the hybridization area, and then the
operation platform was placed onto the telescopic loading tray for further external control.
Biomedical Engineering, Trends, Research and Technologies
160
image of the gene expression on the gene chip can be obtained after finished all operation
process. The darkness of each probe can reveal the interaction between pretreated
DNA/RNA sample and probe with specific sequence on gene chip. The image can be
recorded by a CCD, and then the recorded image can be sent to the commercial image
analysis software for further analysis. The darkness of each probe can reveal the expression
of specific sequence for the gene information analysis.
2.6 Operating procedure of automatic gene chip analyzer
Firstly, a sample pretreatment process from whole blood to mRNA was required, as shown
in Fig. 6. In order to breakdown the sample cells and isolate mRNA from the specimen, the
fluid manipulation device delivers the whole blood and lysis buffer to the first reaction
chamber (sample pretreatment area), as shown in Fig. 6(a). The fluid manipulation device
also delivered the magnetic beads, binding buffer, and washing buffer from reagent vessel
to the first reaction chamber (Fig. 6b). The samples were then mixed by the active mixing
device to ensure that the samples react effectively and to enhance the mRNA conjugation
with the magnetic beads. As shown in Fig. 6(c), biotin poly dT and streptavidin magnetic
beads were used to isolate the mRNA. The reacted samples and the beads that have
conjugated mRNA onto the surface can then be delivered to the second reaction chamber
(sample purification area) by the fluid manipulation device. In this area, magnetic
controlling device was utilized to manipulate magnetic beads and to separate the target
mRNA samples from the surroundings (Fig. 6d). The mRNA-conjugated magnetic beads can
be collected by the external magnet and then washing buffer can be transported into the
area by the fluid manipulation device for further washing process (as Fig. 6e). The
remaining waste fluid excluding the mRNA-conjugated beads can be transported by the
fluid manipulation device to the waste collection area. The elution buffer was then delivered
through the fluid manipulation device to the reaction chamber for the further mixing
reaction. The mRNA-conjugated magnetic beads were demagnetized and suspended in the
elution buffer after the external magnet descended. As shown in Fig. 6(f), after the mixing
and elution process, the magnet activated again to separate the beads and target mRNA
samples. Hence the buffer contained the purified mRNA samples that have been extracted
and released were then delivered through the fluid manipulation device to the third
reaction chamber (transcription and probe labeling area). The required temperature for the
transcription can be regulated by the temperature controlling device allowing the mRNA to
be converted into stable cDNA for chromogen labeling for the bio-molecular test target. The
reacted samples and buffer solution were then delivered by the fluid manipulation device to
the hybridization area for the hybridization process. Meanwhile, prior to deliver the
samples to the hybridization area, the gene chip was placed in the hybridization area for the
pre-hybridization procedure. The labeled cDNA samples then entered the reaction chamber
contained the Express Hyb hybridization solution where the required temperature for the
hybridization reaction was regulated by the temperature controlling device. Subsequently,
samples and reagents including biotin-labeling mixture, washing buffer, blocking buffer,
strepavidin conjugation, detection buffer, DAB, and ddH
2
O were delivered into the chamber
through the fluid manipulation device. Finally, after all processes of the hybridization
reaction were completed, the image of gene chip can be obtained and acquired by the image
acquiring device and image/information processing system for the further gene expression
information analysis. A detailed operation process can be seen in Table 1. As the result, the
overall operation time can be decreased less than 8 hours, which was shorten by 70%
Clinical Application of Automatic Gene Chip Analyzer (WEnCA-Chipball)
for Mutant KRAS Detection in Peripheral Circulating Tumor Cells of Cancer Patients
161
Fig. 6. Illustration of the purifying and separation process from whole blood to mRNA samples.
Areas Reagents Volume (ml) Time (min) Temperature (
o
C)
Lysis Solution 1.02
Whole Blood 4
15
60
Magnetic Beads 0.25 1
Sample
Pretreatment
Area
Binding Solution 0.25 4
Washing Buffer I 0.25 3
Washing Buffer II 0.25 3
Sample
Purification
Area
Elution Solution 0.25 5
Room
Temperature
RT Reagents 0.25 40/5 42/75 Transcription
and Probe
Labeling Area
DIG-Labeling
solution
0.25 60
37
Hybridization
solution
3 30
Washing Buffer I 2 10
42
Washing Buffer II 2 10
Washing Buffer III 2 10
Blocking Buffer 2 10
Anti-DIG AP
Buffer
5 10
Detection Buffer 2 10
Hybridization
Area
NBT/BCIP 1 3
Room
Temperature
Table 1. Detailed operation process of the automatic gene chip analyzer.
Biomedical Engineering, Trends, Research and Technologies
162
when compared to the conventional manual method, and also represented the great
potentials and advantages of the proposed automatic gene chip analyzer for gene diagnosis
applications.
3. Results
3.1 Comparison between colorimetric membrane array and weighted enzymatic chip
array method
In order to verify the sensitivity, specificity and accuracy of the activating KRAS detection
chip, we enrolled 209 NSCLC patients (pathologically proved) to detect the activating KRAS
from their peripheral blood specimens. All specimens were tested by both the CLMA and
WEnCA methods. We also analyzed tissue samples of 209 cases of patients with KRAS
mutations by a traditional PCR-combing direct sequencing method to be a standard
reference. Experimental results indicated that there were 71 cases with KRAS mutations by
sequencing analysis, and a total of 59 patients tested positive by the CLMA, while the
WEnCA tested positive in a total of 66 cases. Moreover, in 138 NSCLC cases without KRAS
mutation, CLMA detected 133 cases as negative, and WEnCA detected 130 cases as negative.
After statistical analysis, the CLMA sensitivity was 83%, specificity 96%; and WEnCA
sensitivity could be raised to be 93%, while the specificity still is maintained at around 94%.
The examinational comparison results also compared the ability of peripheral blood
detection results of two technology platforms where 3 cancer cells /cc blood were detected
by the WEnCA, and 5 cancer cells /cc blood by the CLMA. These findings suggest that the
WEnCA platform has a higher detection rate for activated KRAS oncogene, and great
potential for further investigation and clinical application.
To determine the cutoff value of the Activating KRAS Detection Chip by the WEnCA
method, we analyzed 200 cancer tissues of which 100 had the KRAS mutation and the others
had wild-type KRAS. The 200 tissues collected underwent mRNA extraction and first cDNA
labeling before reacting to the Activating KRAS Detection Chip by the WEnCA-manual
method. After signal development, each gene spot density was normalized using the density
of β-actin on the same chip. Next, the result obtained from the cancer tissue with KRAS
mutation was divided by the normalized value obtained from the sample spot of the tissue
without mutant KRAS to obtain the ratio. A ratio higher than 2 was defined as being
positive for gene overexpression. In terms of analysis using WEnCA, to determine the
weighted value of each gene spot, we divided the percentage of each gene overexpression in
the 100 cancer tissues with the activating KRAS mutation to provide four classes. The gene
spot that showed overexpression in over 80 cancer tissues had a weighted value of 4 (3 in
70−80 cancer tissues, 2 in 60−70 cancer tissues, and 1 in 50−60 cancer tissues). After the
reaction through WEnCA, the positive gene spots were multiplied by their respective
weighted values to obtain the total score of the chip. Then underwent analysis using the
receiver operating characteristic curve can be obtained with a positive reaction cutoff value
of 20. Results showed that the sensitivity reached 96% and the specificity reached 97%.
3.2 Detection limitation of the WEnCA-manual and WEnCA-Chipball assay
Evaluating the detection limitation of WEnCA-manual and WEnCA-Chipball system, with
the addition of 100, 25 and 12 cancer cells that possessed the activated mutant KRAS into 5cc
of blood, which obtained total scores higher than the cutoff value 20 in both systems. In
addition, when only 6 cells were added, in which case the total score equaled 8 in WEnCA-
Clinical Application of Automatic Gene Chip Analyzer (WEnCA-Chipball)
for Mutant KRAS Detection in Peripheral Circulating Tumor Cells of Cancer Patients
163
manual and 5 in WEnCA-Chipball system, which are both lower than 20. Therefore, no
significant difference was found between the detection limitations of the two systems.
3.3 Clinical assessment of the accuracy of WEnCA-manual and WEnCA-chipball
system
To further understand the practical clinical detection of the WEnCA-Chipball system, we
obtained blood samples of 209 pathology-proven lung cancer patients and analyzed the
KRAS pathway-related genes overexpression in those blood specimens by previously
constructed Activated KRAS Detection Chip using both the WEnCA-manual and WEnCA-
Chipball systems. The paired cancer tissue with KRAS mutational status then served as the
reference standard. As shown in Table 2, the results are as follows: 74 cases of the 209
clinical samples were identified with activated KRAS by the WEnCA-manual method, and
the WEnCA-Chipball system test results showed in a total of 71 cases. Among them, 66 were
positive through WEnCA-manual and 63 through WEnCA-Chipball. Moreover, among the
138 paired cancer tissues with wild type KRAS, 130 were negative through both WEnCA-
manual and WEnCA-Chipball system. According to the results, we can obtain the
sensitivity, specificity and accuracy of WEnCA-manual were 93%, 94% and 94%; the
sensitivity, specificity and accuracy of WEnCA-Chipball were 89%, 94%, and 92%,
respectively.
As the results in Table 3, using WEnCA-Chipball, the average total score of the
positive sample was 6.1 lower and the average total score of the negative sample was 3.9
lower while the overall average total score was 4.7 lower than the WEnCA-manual.
Regarding to the operation time, the WEnCA-Chipball system takes 7.5 h to complete all
tasks, while the operation time of the WEnCA-manual system is around 72 h, which was
approximately 9 folds than the time required for the automatic system. The operating cost of
the WEnCA-manual system was approximately 5 times more expensive than that incurred
for the WEnCA-Chipball system. There was no difference in the detection limitation
between the two systems. We believe that the WEnCA-Chipball operating system has
considerable potential in clinical medicine applications.
WEnCA-Chipball
( WEnCA-manual )
Negative Positive Total
Wild Type 130 (130) 8(8) 138
KRAS
Mutation 8 (5) 63(66) 71
Total 138 (135) 71(74) 209
Table 2. The sensitivity, specificity and accuracy of WEnCA-Chipball and WEnCA-manual
system
Method
Mean score
WEnCA-manual WEnCA-Chipball
Difference
(Chipball- Manual)
Positive specimens 46.1 40 -6.1
Negative specimens 13.8 9.9 -3.9
Total specimens 25.2 20.6 -4.7
Table 3. Comparing the total score of Activating KRAS Detection Chip analyzed by
WEnCA-manual and WEnCA-Chipball system
Biomedical Engineering, Trends, Research and Technologies
164
4. Discussion
In recent years, target therapy has rapidly developed. Research and development for the
targeted therapy drugs, such as Iressa and Cetuximab, have been proven efficient in
advanced NSCLC (Thatcher, 2007; Chang, 2008). Many studies report that KRAS mutations
are highly-specific independent predictors of response to single-agent EGFR tyrosine kinase
inhibitors (Iressa) in advanced NSCLC; and, similarity to anti-EGFR monoclonal antibodies
(Cetuximab) alone (Rossi et al., 2009; Tiseo et al., 2010). However, at the present time,
therapeutic targets such as HER2/neu, EGFR, KRAS, Raf, etc., are analyzed using RT-PCR
combining direct sequencing, fluorescence in situ hybridization (FISH), real-time PCR, and
other methods (Hilbe et al., 2003; Cappuzzo et al., 2007; Akkiprik et al., 2008). The above
methods have disadvantages such as inadequate sensitivity, and the need to collect patients’
cancer tissues as specimens, which make medicinal effect evaluations prior to clinical
treatment cumbersome. RT-PCR and real-time PCR are applied for the detection of single
genes, and most PCR techniques have a few common problems: (1) contamination, such as
false-positive results from oversensitive detection of aerosolized DNA or previous sample
carry-over; (2) RT-PCR is regarded as only semi-quantitative, since it is difficult to control
the efficiency of sequence amplification when comparing different samples; and, (3)
interference is caused by annealing between the primers. RT-PCR or real-time PCR is used
extensively in the detection of a single-gene target. For the detection of multiple targets or
gene clusters, PCR-related techniques tend to be time-consuming, labor-intensive, and
costly. Therefore, the current study successfully developed the WEnCA-Chipball to
effectively address and solve those problems.
In the WEnCA-Chipball system, the total operation time from input of samples to
completion of the image analysis was about 7.5 h, which is a substantial decrease in time
when compared to the three days required for the original manually operated membrane
array, and significantly minimizes the occurrence of human errors. The WEnCA-Chipball
system not only provides an innovative automatic system for clinical target therapy efficacy
evaluation, but also improves the clinical usability and accuracy compared to the manual
method. Thus, it has been proven to be a practical means to assess the drug efficacy of
clinical target treatment.
The WEnCA-Chipball system developed by this research team not only retains the
advantages of the Lab-on-a-chip, but also overcomes the problem of the microfluidic chip’s
unsuitability for continuous operation and linkage to an interpretation system. As the
world’s first automatic chip analyzer, it will be useful in the future for the molecular
diagnosis of infectious diseases, the detection of CTC through chip replacements, or the
assessment of drug efficacy.
5. Future trends
Medical automation technology is the future trend that can reduce labor, operation errors,
and time-consumption. WEnCA-Chipball is suited for clinical application to detect mutant
KRAS in CTCs before target therapy. The specialized automatic gene chip detecting system
would be designed for the fast and accurate detection of KRAS in CTCs in each human
cancer specimen. This is the challenge to meet for the years ahead.
The WEnCA-Chipball system, through a built-in computer system, will not only instantly
produce the results of the chip analysis but also connect to a global network. The detection
Clinical Application of Automatic Gene Chip Analyzer (WEnCA-Chipball)
for Mutant KRAS Detection in Peripheral Circulating Tumor Cells of Cancer Patients
165
results can be transmitted locally in any operation area and stations around the world
through common software used in data transmission and interpretation. The station
networks around the world can be completed through the prevalent WEnCA-Chipball
system. The WEnCA-Chipball system is believed to be capable for extensive applications in
clinical medicine, and holds great potential for future development.
6. References
Akkiprik, M.; Celikel, C.A.; Dusunceli, F.; Sonmez, O.; Gulluoglu, B.M.; Sav, A. & Ozer, A.
(2008). Relationship between overexpression of ras p21 oncoprotein and K-ras
codon 12 and 13 mutations in Turkish colorectal cancer patients. Turk J
Gastroenterol., Vol. 19, No. 1, 22-27.
Calistri, D.; Rengucci, C.; Seymour, I.; Leonardi, E.; Truini, M.; Malacarne, D.; Castagnola, P.
& Giaretti, W. (2006). KRAS, p53 and BRAF gene mutations and aneuploidy in
sporadic colorectal cancer progression. Cell Oncol., Vol. 28, No. 4 ,161-166.
Carstens, C.; Messe, E.; Zang K.D. & Blin, N. (1988). Human KRAS oncogene expression in
meningioma. Cancer Lett., Vol. 43, No. 1-2, 37-41.
Cappuzzo, F.; Ligorio, C.; Janne, P.A.; Toschi, L.; Rossi, E.; Trisolini, R.; Paioli, D.; Holmes,
A.J.; Magrini, E. & Finocchiaro, G. (2007). Prospective study of gefitinib in
epidermal growth factor receptor fluorescence in situ hybridization-
positive/phospho-Akt-positive or never smoker patients with advanced non-small-
cell lung cancer: the ONCOBELL trial. J. Clin. Oncol.,, Vol. 25, No. 16, 2248-2255.
Chang, A.Y. (2008). The role of gefitinib in the management of Asian patients with non-
small cell lung cancer. Expert Opin. Investig. Drugs, Vol. 17, No. 3, 401-411.
Chen, C.C.; Hou, M.F.; Wang, J.Y.; Chang, T.W.; Lai, D.Y.; Chen, Y.F.; Hung, S.Y. & Lin, S.R.
(2006). Simultaneous detection of multiple mRNA markers CK19, CEA, c-Met,
Her2/neu and hMAM with membrane array, an innovative technique with a great
potential for breast cancer diagnosis. Cancer Lett., Vol. 240, No. 2, 279-288.
Chen, C.C.; Chang, T.W.; Chen, F.M.; Hou, M.F.; Hung, S.Y.; Chong, I.W.; Lee, S.C.; Zhou,
T.H. & Lin, S.R. (2006). Combination of multiple mRNA markers (PTTG1, Survivin,
UbcH10 and TK1) in the diagnosis of Taiwanese patients with breast cancer by
membrane array. Oncology, Vol. 70, No. 6, 438-446.
Chen, Y.F.; Chiu, H.H.; Wu, C.H.; Wang, J.Y.; Chen, F.M.; Tzou, W.H.; Shin, S.J. & Lin, S.R.
(2003). Retinoblastoma protein (pRB) was significantly phosphorylated through a
Ras-to-MAPK pathway in mutant K-ras stably transfected human adrenocortical
cells. DNA Cell Biol., Vol. 22, No. 10, 657-664.
Chen, Y.F.; Wang, J.Y.; Wu, C.H.; Chen, F.M.; Cheng, T.L. & Lin, S.R. (2005). Detection of
circulating cancer cells with K-ras oncogene using membrane array. Cancer Lett.,
Vol. 229, No. 1, 115-122.
Chee, M.; Yang, R.; Hubbell, E.; Berno, A.; Huang, X.C.; Stern, D.; Winkler, J.; Lockhart, D.J.;
Morris, M.S. & Fodor, S.P. (1996). Accessing genetic information with high-density
DNA arrays. Science, Vol. 274, No. 5287, 610-614.
Chirgwin, J.M.; Przybyla, A.E.; MacDonald, R.J. & Rutter, W.J. (1979). Isolation of
biologically active ribonucleic acid from sources enriched in ribonuclease.
Biochemistry, Vol. 18, No. 24, 5294-5299.
Biomedical Engineering, Trends, Research and Technologies
166
Chong, I.W.; Chang, M.Y.; Sheu, C.C.; Wang, C.Y.; Hwang, J.J.; Huang, M.S. & Lin, S.R.
(2007). Detection of activated K-ras in non-small cell lung cancer by membrane
array: a comparison with direct sequencing. Oncol. Rep., Vol. 18, No. 1, 17-24.
Chomczynski, P. (1993). A reagent for the single-step simultaneous isolation of RNA, DNA
and proteins from cell and tissue samples. Biotechniques, Vol. 15, No. 3, 532-534.
Deramaudt, T. & Rustgi, A.K. (2005). Mutant KRAS in the initiation of pancreatic cancer.
Biochim. Biophys. Acta, Vol. 1756, No. 2, 97-101.
Fong, K.M.; Zimmerman, P.V. & Smith, P.J. (1998). KRAS codon 12 mutations in Australian
non-small cell lung cancer. Aust. N. Z. J. Med., Vol. 28, No. 2, (184-189).
Gocke, C.D.; Dabbs, D.J.; Benko, F.A. & Silverman, J.F. (1997). KRAS oncogene mutations
suggest a common histogenetic origin for pleomorphic giant cell tumor of the
pancreas, osteoclastoma of the pancreas, and pancreatic duct adenocarcinoma.
Hum. Pathol., Vol. 28, No. 1, 80-83.
Harder, N.; Mora-Bermudez, F.; Godinez, W.J.; Wunsche, A.; Eils, R.; Ellenberg, J. & Rohr, K.
(2009). Automatic analysis of dividing cells in live cell movies to detect mitotic
delays and correlate phenotypes in time. Genome Res., Vol. 19, No. 11, 2113-2124.
Hilbe, W.; Dlaska, M.; Duba, H.C.; Dirnhofer, S.; Eisterer, W.; Oberwasserlechner, F.;
Mildner, A.; Schmid, T.; Kuhr, T. & Woll, E. (2003). Automated real-time PCR to
determine K-ras codon 12 mutations in non-small cell lung cancer: comparison with
immunohistochemistry and clinico-pathological features. Int. J. Oncol., Vol. 23, No.
4, 1121-1126.
Hsiung, S.K.; Chang, H.J.; Yang, M.J.; Chang, M.S.; Tsao, D.A.; Chiu, H.H.; Chen, Y.F.;
Cheng, T.L. & Lin, S.R. (2009). A novel technique for detecting the therapeutic
target, KRAS mutant, from peripheral blood using the automatic chipball device
with weighted enzymatic chip array. Fooyin J. Health Sci., Vol. 1, No. 2, 72-80.
Lee, S.H.; Lee, J.W.; Soung, Y.H.; Kim, H.S.; Park, W.S.; Kim, S.Y.; Lee, J.H.; Park, J.Y.; Cho,
Y.G. & Kim, C.J. (2003). BRAF and KRAS mutations in stomach cancer. Oncogene,
Vol. 22, No. 44, 6942-6945.
Lievre, A.; Bachet, J.B.; Le Corre, D.; Boige, V.; Landi, B.; Emile, J.F.; Cote, J.F.; Tomasic, G.;
Penna, C. & Ducreux, M. (2006). KRAS mutation status is predictive of response to
cetuximab therapy in colorectal cancer. Cancer Res., Vol. 66, No. 8, 3992-3995.
Lievre, A.; Bachet, J.B.; Boige, V.; Cayre, A.; Le Corre, D.; Buc, E.; Ychou, M.; Bouche, O.;
Landi, B. & Louvet, C. (2008). KRAS mutations as an independent prognostic factor
in patients with advanced colorectal cancer treated with cetuximab. J. Clin. Oncol.,
Vol. 26, No. 3, 374-379.
Popovtzer, R.; Neufeld, T.; Popovtzer, A.; Rivkin, I.; Margalit, R.; Engel, D.; Nudelman, A.;
Rephaeli, A.; Rishpon, J. & Shacham-Diamand, Y. (2008). Electrochemical lab on a
chip for high-throughput analysis of anticancer drugs efficiency. Nanomedicine, Vol.
4, No. 2, 121-126.
Rossi, A.; Galetta, D. & Gridelli, C. (2009). Biological prognostic and predictive factors in
lung cancer. Oncology, Vol. 77, No. 1, 90-96.
Sheu, C.C.; Yu, Y.P.; Tsai, J.R.; Chang, M.Y.; Lin, S.R.; Hwang, J.J. & Chong, I.W. (2006).
Development of a membrane array-based multimarker assay for detection of
circulating cancer cells in patients with non-small cell lung cancer. Int. J. Cancer,
Vol. 119, No. 6, 1419-1426.
Clinical Application of Automatic Gene Chip Analyzer (WEnCA-Chipball)
for Mutant KRAS Detection in Peripheral Circulating Tumor Cells of Cancer Patients
167
Shen, C.H.; Chen, H.Y.; Lin, M.S.; Li, F.Y.; Chang, C.C.; Kuo, M.L.; Settleman, J. & Chen,
R.H. (2008). Breast tumor kinase phosphorylates p190RhoGAP to regulate rho and
ras and promote breast carcinoma growth, migration, and invasion. Cancer Res.,
Vol. 68, No. 19, 7779-7787.
Slebos, R.J. & Rodenhuis, S. (1989). The molecular genetics of human lung cancer. Eur.
Respir. J., Vol. 2, No. 5, 461-469.
Southern, E.; Mir, K. & Shchepinov, M. (1999). Molecular interactions on microarrays. Nat.
Genet., Vol. 21, 5-9.
Siegfried, J.M.; Gillespie, A.T.; Mera, R.; Casey, T.J.; Keohavong, P.; Testa, J.R. & Hunt, J.D.
(1997). Prognostic value of specific KRAS mutations in lung adenocarcinomas.
Cancer Epidemiol. Biomarkers Prev., Vol. 6, No. 10, 841-847.
Smit, V.T.; Boot, A.J.; Smits, A.M.; Fleuren, G.J.; Cornelisse, C.J. & Bos, J.L. (1988). KRAS
codon 12 mutations occur very frequently in pancreatic adenocarcinomas. Nucleic
Acids Res., Vol. 16, No. 16, 7773-7782.
Thatcher, N. (2007). The place of targeted therapy in the patient management of non-small
cell lung cancer. Lung Cancer, Vol. 57, No.2, S18-23.
Tiseo, M.; Rossi, G.; Capelletti, M.; Sartori, G.; Spiritelli, E.; Marchioni, A.; Bozzetti, C.; De
Palma, G.; Lagrasta, C. & Campanini, N. (2010). Predictors of gefitinib outcomes in
advanced non-small cell lung cancer (NSCLC): study of a comprehensive panel of
molecular markers. Lung Cancer, Vol. 67, No. 3, 355-360.
Tsao, D.A.; Yang, M.J.; Chang, H.J.; Yen, L.C.; Chiu, H.H.; Hsueh, E.J.; Chen, Y.F. & Lin, S.R.
(2010). A fast and convenient new technique to detect the therapeutic target, K-ras
mutant, from peripheral blood in non-small cell lung cancer patients. Lung Cancer,
Vol. 68, No. 1, 51-57.
Weijenberg, M.P.; Aardening, P.W.; de Kok, T.M.; de Goeij, A.F. & van den Brandt, P.A.
(2008). Cigarette smoking and KRAS oncogene mutations in sporadic colorectal
cancer: results from the Netherlands Cohort Study. Mutat. Res., Vol. 652, No. 1, 54-
64.
Wang, J.Y.; Hsieh, J.S.; Lu, C.Y.; Yu, F.J.; Wu, J.Y.; Chen, F.M.; Huang, C.J. & Lin, S.R. (2007).
The differentially mutational spectra of the APC, K-ras, and p53 genes in sporadic
colorectal cancers from Taiwanese patients. Hepatogastroenterology, Vol. 54, No. 80,
2259-2265.
Wang, J.Y.; Yeh, C.S.; Chen, Y.F.; Wu, C.H.; Hsieh, J.S.; Huang, T.J.; Huang, S.Y. & Lin, S.R.
(2006). Development and evaluation of a colorimetric membrane-array method for
the detection of circulating tumor cells in the peripheral blood of Taiwanese
patients with colorectal cancer. Int. J. Mol. Med., Vol. 17, No. 5, 737-747.
Yakubovskaya, M.S.; Spiegelman, V.; Luo, F.C.; Malaev, S.; Salnev, A.; Zborovskaya, I.;
Gasparyan, A.; Polotsky, B. & Machaladze, Z. & Trachtenberg, A.C. (1995). High
frequency of K-ras mutations in normal appearing lung tissues and sputum of
patients with lung cancer. Int. J. Cancer, Vol. 63, No. 6, 810-814.
Yang, M.J.; Hsu, C.K.; Chang, H.J.; Yen, L.C.; Tsao, D.A.; Chiu, H.H.; Huang, Y.T.; Chen,
Y.F.; Wang, J.Y. & Lin, S.R. (2009). The KRAS mutation is highly correlated with
EGFR alterations in patients with non-small cell lung cancer. Fooyin J. Health Sci.,
Vol. 1, No. 2, 65-71.
Yen, L.C.; Yeh, Y.S.; Chen, C.W.; Wang, H.M.; Tsai, H.L.; Lu, C.Y.; Chang, Y.T.; Chu, K.S.;
Lin, S.R. & Wang, J.Y. (2009). Detection of KRAS oncogene in peripheral blood as a
Biomedical Engineering, Trends, Research and Technologies
168
predictor of the response to cetuximab plus chemotherapy in patients with
metastatic colorectal cancer. Clin. Cancer Res., Vol. 15, No. 13, 4508-4513.
Yen, L.C.; Uen, Y.H.; Wu, D.C.; Lu, C.Y.; Yu, F.J.; Wu, I.C.; Lin, S.R. & Wang, J.Y. (2010).
Activating KRAS mutations and overexpression of epidermal growth factor
receptor as independent predictors in metastatic colorectal cancer patients treated
with cetuximab. Ann. Surg., Vol. 251, No. 2, 254-260.
Yang, M.J.; Hsu, C.K.; Chang, H.J.; Yen, L.C.; Tsao, D.A.; Chiu, H.H.; Huang, Y.T.; Chen,
Y.F.; Wang, C.Y. & Lin, S.R. (2009). TheKRAS mutation is highly correlated with
EGFR alterations in patients with non-small cell lung cancer. Fooyin J. Health Sci.,
Vol. 1, No. 2, 65-71.
Yang, M.J.; Chiu, H.H.; Wang, H.M.; Yen, L.C.; Tsao, D.A.; Hsiao, C.P.; Chen, Y.F.; Wang,
J.Y. & Lin, S.R. (2010). Enhancing detection of circulating tumor cells with
activating KRAS oncogene in patients with colorectal cancer by weighted
chemiluminescent membrane array method. Ann. Surg. Oncol., Vol. 17, No. 2, 624-
633.
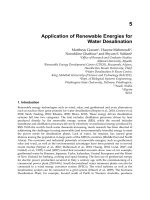
8
Statistical Analysis for Recovery of Structure
and Function from Brain Images
Michelle Yongmei Wang, Chunxiao Zhou and Jing Xia
University of Illinois at Urbana-Champaign
U.S.A.
1. Introduction
Brain imaging has the potential to advance our understanding of human health and to
improve diagnosis and treatment of neurological diseases. Inspired by key questions in
neuroscience and medicine, it becomes extremely important to develop statistical methods
that can accurately and efficiently recover useful quantitative information from large
amounts of brain images. The underlying computational issues are challenging and often
hampered by uncertainties in imaging acquisition parameters, the variability of human
anatomy and physiology, as well as the nature of the imaging data to be handled such as the
presence of noise and correlation, and the sample and data sizes, and so on.
Structural and Functional MRI (sMRI and fMRI) Among the varieties of brain imaging
modalities, magnetic resonance imaging (MRI) is primarily a noninvasive imaging
technique used in radiology to visualize the brain’s structure and function. Two main forms
of MRI include: Structural MRI (sMRI) images the anatomy and strucure of the brain
(Symms et al., 2004) and provides detailed pictures of the brain’s size and shape; functional
MRI (fMRI) identifies active regions, patterns of functional connectivities during either tasks
specifically designed to study various aspects of brain fundtion or during the resting state
(Martijn et al., 2010). The MRI machine is, in essence, a big magnet. As the subject lies in its
magnetic field, invisible radio waves are released around the subject. This will result in
harmless radio waves bouncing off the different substances that make up the brain. The
radio waves are then detected by a computer, which transforms the data into images of the
brain’s structure and activity. In fMRI, as the subject lies in the MRI machine, simple tasks
are given; the MRI then maps what parts of the brain are most active during those tasks
compared with activity while the brain is at rest. This allows researchers to understand how
the brain functions. This information is used together with the data from the sMRI data to
reveal a comprehensive picture of brain structure and function that fit in the overall studies
or to allow us to understand how the healthy brain works. The informaiton and fusion of
structural and functional MRI can also improve our understanding and the treatment of
neurodegenerative diseases and mental disorders such as Alzheimer’s disease and
schizophrenia.
Brain Morphometry Analysis with Hypothesis Testing from Structural MRI Structural
MRI (sMRI), or simply called MRI, scans are usually stored in the format of three-
dimensional (3D) voxels. There are several procedures for MRI post-processing, and the two
Biomedical Engineering, Trends, Research and Technologies
170
important ones are registration and segmentation. The registration maps an MRI scan to a
pre-defined template (i.e. matches anatomical landmarks from different MRI images); this
makes the exploration of group differences achievable. The segmentation classifies the
voxels of an MRI scan as gray matter, white matter, cerebrospinal fluid, background, or
region of interest (ROI); it serves as a foundation form for many analytical tools, including
voxel-based morphometry, shape-based morphometry, and cortical thickness measuring,
etc.
Volumetry analysis of the whole brain (Buckner et al., 2004) and ROIs (Jack et al., 1997;
Wang et al., 2003) have been traditionally used to obtain the measurements of anatomical
volumes and to investigate normal or abnormal tissue structure. However, pure volume
measures of the brain or ROIs do not reveal the localized regional morphometry of brain
structures. In addition, it is based on the definition of regions according to some a prior
hypothesis, which, in practice, is not always available. Thus, in general, it limits the ability
of a study to identify new and previously unexplored relationships between structural
changes. The localization limitation of volumetry analysis can be overcome by methods
generally referred to as high-dimensional morphologic analysis, such as voxel-based
morphometry (VBM) (Ashburner and Friston, 2000; Chung et al., 2001; Davatzikos, et al.,
2001), or surface-based (i.e. shape-based) morphometry (SBM) that examines the
corresponding surface vertex locations or shape differences (Shen et al., 2005; Styner et al.,
2005; Thompson et al., 2004). The outputs from these methods are statistical parametric
maps of the 3D brain volume or the 3D surface of the ROIs, showing differences at each
voxel (in VBM) or vertex (in SBM) between the comparison groups. Thus, the subsequent
inference of differences among the groups is usually performed through hypothesis testing
at each voxel or at each vertex.
The standard parametric test, such as t-test or F-test, could be used in brain morphometry
analysis for simplicity with the assumption that the data to be tested are independent,
identically, and normally distributed, for small or medium size samples. When the sample
size is large enough, this assumption is not that strict any more. However, in practical
neuroimage analysis, the distribution of the data is typically unknown and sample size is
quite small, in which case, the nonparametric randomization or permutation tests can be
applied for improved accuracy. Permutation tests obtain p-values from permutation
distributions of a test statistic, rather than from parametric distributions. They belong to the
nonparametric “distribution-free” category of hypothesis testing and are thus flexible, and
have been used successfully in biomedical image analysis (Nichols & Holmes, 2001;
Pantazis, et al., 2004; Zhou et al., 2009). One way to construct the permutation distribution is
through exact permutation which enumerates all possible arrangements. Another way is to
construct an approximate permutation distribution based on random sampling from all
possible permutations (i.e. random permutation). The computational cost is the main
disadvantage of exact permutation. Random permutation has the problem of replication and
causes more Type I errors. When a large number of repeated tests are needed, it is also
computationally expensive to achieve satisfactory p-value accuracy. In Section 2, we present
our novel moments-based permutation methods, which take advantage of the parametric
and nonparametric features for both efficiency and accuracy.
Brain Connectivity Analysis from Functional MRI fMRI is a powerful technique that
noninvasively measures and characterizes brain functions in humans under various
cognitive and behavioral tasks. One of the most common forms of fMRI is the Blood Oxygen
Level-Dependent (BOLD) imaging (Ogawa et al., 1990), measuring the magnetic resonance
Statistical Analysis for Recovery of Structure and Function from Brain Images
171
properties of the blood. As neurons do not have direct energy sources but only get energy
from blood, more active neurons will need to be supplied with energy from the blood at a
higher rate. Therefore, this BOLD contrast, is able to show which parts of the brain are more
active. At a number of different time points over the course of an expeirment, fMRI provides
a set of scans (at different depths through the brain) constituting a volume. fMRI data is a
time-course of the BOLD intensity for each voxel in the brain.
During fMRI data acquisition, even a light move of a subject’s head can cause severe
irregularities within the acquired data. To account for these potential movements, a
realignment or motion correction procedure needs to be performed on the data (Lindquist,
2008). This usually entails looking for six parameters - three rotations and three translations,
that lead the volumes maximally aligned. The next pre-processing step is normalization:
each complete set of volumes is normalized to a canonical brain, or the same stereo-tactic
space. This is especially useful in multiple subjects studies to account for differences in brain
size. Moreover, in order to improve the data signal to noise ratio, a spatial smoothing is
often carried out by comvolving a Gaussin kernel with the fMRI data.
A number of analytic methods have been developed for detecting brain activity patterns and
how these patterns change in patients with cognitive disorders (Calhoun et al., 2001;
McIntosh & Lobaugh, 2004; Worsley & Friston, 1995). A thorough understanding of the
neural mechanisms not only requires the accurate delineation of activation regions
(“functional segregation or specification”) but demands precise description of function in
terms of the information flow across networks of areas (“functional integration”). That is,
our brain is a newtork: it consistes of spatially distributed, but functionally linked regions
that continuously share information with each other. Various approaches have been
proposed to extract association information from fMRI datasets, most of which rely on either
functional or effective connectivity (Horwitz, 2003). Functional connectivity has been
identified as “temporal correlations between spatially remote neurophysiological events”
(Friston et al., 1993). In Section 3, we present a novel and general statistical framework for
robust and more complete estimation of functional connectivity or brain networks.
Overview In this chapter, we will present the statistical methods we have developed for the
problems in the realms of brain morphometry and connectivity from analyzing structural
and functional MRI data. The integration of the recovered structure and function from these
imaging data may be able to provide complementary information and thus enhance our
understanding of how the brain works and how its diseases occur. We will provide an
explaination of the problem areas, a description of the statistical techniques involved and a
demonstration of results on simulated and real imaging data using these statistical methods.
2. Brain shape morphometry analysis using novel permutation methods
There is increasing evidence that surface shape analysis of brain structures provides new
information which is not available by conventional analysis. A critical issue in surface
morphometry is the shape description and representation. Various strategies have been
investigated recently in the literature, such as (Brechbühler et al., 1995; Thompson et al.,
2004; Wang & Staib, 2000). The spherical harmonics (SPHARM) approach using spherical
harmonics as basis functions for a parametric surface description was proposed in
(Brechbühler et al., 1995). The correspondence across different surfaces is established by
aligning the parameterizations via the first order ellipsoid. The present work employs the
SPHARM-PDM shape description (Styner et al., 2006), which leads to corresponding
Biomedical Engineering, Trends, Research and Technologies
172
location vectors across all surfaces for our subsequent statistical analysis of surface shape. At
each corresponding position on the surfaces, we test whether there is a significant mean
vector difference between location vectors of two groups. If a hypothesis test leads to a
p-value smaller than the pre-chosen α-level, we reject the null hypothesis and conclude that
a significant shape difference exists at this surface location. In this chapter, we focus on the
surface shape analysis for two groups, though our method can be extended to the multi-
group case.
Since the distribution of the location vectors is unknown, only a limited number of subject
samples are available, and the same tests are repeated on thousands of locations, we
propose to use our hybrid or moments-based permutation approach to the brain shape
analysis. This approach takes advantage of nonparametric permutation tests and parametric
Pearson distribution approximation for both efficiency and accuracy/flexibility. Specifically,
we employ a general theoretical method to derive moments of permutation distribution for
any linear test statistics. Here, the term “linear test statistic” refers to a linear function of test
statistic coefficients, instead of that of data. An extension of the method to the general
weighted v-statistics has also been developed recently in (Zhou et al., 2009). The key idea is
to separate the moments of permutation distribution into two parts, permutation of test
statistic coefficients and function of the data. We can then obtain the moments without any
permutation since the permutation of test statistic coefficients can be derived theoretically.
Given the first four moments, the permutation distribution can be well fitted by Pearson
distribution series. The p-values are then estimated without any real permutation. For
multiple comparison of two-group difference, given the sample size n
1
= 21 and n
2
= 21, the
number of tests is m = 2000. m×(n
1
+n
2
)!/ n
1
!/ n
2
! ≈ 1.1×10
15
permutations are needed for an
exact permutation test. Even for 20,000 random permutations per test, 4×10
7
permutations
are still required. Alternatively, our hybrid or moments-based permutation method using
Pearson distribution approximation only involves the calculation of analytically derived
first four moments of exact permutation distributions while achieve high accuracy. Instead
of calculating the test statistics in factorial scale with exact permutation, our permutation
using mean difference test statistic only require O(n) computation cost, where n = n
1
+n
2
.
2.1 Hypothesis
Classical Hypothesis Given registered location vectors across all subjects, surface shape
morphometry analysis becomes a two-sample test for equality of means at each surface
location. The hypothesis is typically constructed as:
0
:
A
B
H
μ
μ
=
vs. :
aAB
H
μ
μ
≠
(1)
where
()
() ()
[]
y
xz
T
A
AAA
μμμμ
=
and
()
() ()
[]
y
xz
T
B
BBB
μμμμ
=
are three dimensional mean vectors of
group A and B.
Bioequivalence Hypothesis In many applications, statistical significance is not equivalent to
practical significance since smaller differences of two group location vectors can be more
statistically significant than the larger ones. Statistical significance means that the observed
difference is not a consequence of sampling error. Practical significance indicates whether
the difference is large enough to be of value in a practical sense. Statistical significance does
not necessarily indicate practical significance because extremely small and non-notable
differences can be statistically significant. For example, there are two pairs of observed mean
Statistical Analysis for Recovery of Structure and Function from Brain Images
173
location vectors
11
(,)
AB
μ
μ
at location 1 and
22
(,)
AB
μ
μ
at location 2, with
1
[1,1,1]
T
A
μ
=
,
1
[0.999,0.999,0.999]
T
B
μ
=
,
2
[1,1,1]
T
A
μ
=
, and
2
[0.7,0.7,0.7]
T
B
μ
=
. We assume that the
variance of location vectors at location 2 is much larger than that at location 1, and their
p-values of the observed mean differences are p
1
= 0.001 and p
2
= 0.01 respectively. The mean
difference at location 1 is physically very small, although it is more statistical significant
than the one at location 2. In this case, it is more reasonable to identify practical or physical
shape difference at location 2 rather than at location 1. In order to achieve this, we propose
to use the multivariate bioequivalence hypothesis test for our surface morphometry
analysis:
() ()
0
() ()
: max{ } , { , , } bioequivalence
: max{ } , { , , } bioinequivalence
ss
B
A
ss
a
B
A
Hsxyz
Hsxyz
μμ
μμ
−≤Δ∈
−>Δ∈
(2)
where ∆ is the desired threshold. That is, the shape difference is detected as significant if the
mean vector difference is large enough in either x, y or z direction. Bioequivalence tests were
originally introduced in the pharmaceutical industry to determine the bioequivalence
(Brown et al., 1997). Here, we employ bioequivalence concept though for detecting
bioinequivalence as in Eq. (2) we constructed, instead of bioequivalence as in the standard
pharmaceutical studies.
A permutation test is valid if the observations are exchangeable under the null hypothesis.
However, the condition of exchangeability under null hypothesis is not satisfied in
hypothesis Eq. (2). We thus propose to utilize a two-step permutation test.
Step 1:
(1) ( ) ( )
0
:,{,,}
ss
B
A
Hsxyz
μμ
=+Δ∈
() ()
() () () ()
(1)
:
yy
xx zz
a
BBB
AAA
Horor
μμ μμ μμ
>+Δ >+Δ >+Δ (3)
Step 2:
(2) ( ) ( )
0
:,{,,}
ss
B
A
Hsxyz
μμ
=−Δ∈
() ()
() () () ()
(2)
:
yy
xx zz
a
BBB
AAA
Horor
μμ μμ μμ
<
−Δ < −Δ < −Δ (4)
If a hypothesis test of significance in step 1 (Eq. (3)) or in step 2 (Eq. (4)) gives a p-value
lower than the α/2-level, we reject the null hypothesis and significant shape difference
exists. The total significance level in this case is still α due to the involved two steps in Eq.
(3) and Eq. (4). Note that the classical hypothesis is a special case of the bioequivalence
hypothesis when ∆ = 0. Classical hypothesis is used in applications where statistical and
practical significances are consistent. Otherwise, bioequivalence test is preferred if there is
any non-negligible difference between practical significance and statistical significance.
2.2 New Permutation Approach
Pearson Distribution Series
The Pearson distribution series (Pearson I ~ VII) are a family of
probability distributions that are more general than the normal distribution (Hubert, 1987).
As shown in Fig. 1 (Hahn & Shapiro, 1967), it covers all distributions in the (β1, β2) plane
including normal, beta, gamma, log-normal and etc., where distribution shape parameters