Advances in Gas Turbine Technology Part 18 doc
Bạn đang xem bản rút gọn của tài liệu. Xem và tải ngay bản đầy đủ của tài liệu tại đây (9.36 MB, 28 trang )
Advances in Gas Turbine Technology
500
substrate. As the process continues, particles continue to impact the substrate and form
bonds with the deposited particles, resulting in a uniform coating with very less pores and
high bond strength. The term “cold spray” has been used to describe this process due to the
relatively low temperatures of the expanded gas stream that exits the nozzle. Cold spray as
a coating technique was initially developed in the mid-1980s at the Institute for Theoretical
and Applied Mechanics of the Siberian Division of the Russian Academy of Science in
Novosibirsk. The Russian scientists successfully deposited a wide range of pure metals,
metallic alloys, and composites onto a variety of substrate materials, and they demonstrated
that very high coating deposition rates are attainable using the cold spray process.
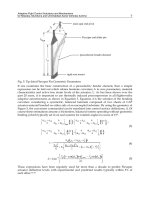
Fig. 1. Schematic illustration of cold spray apparatus
The temperature of the gas stream is always below the melting point of the particulate
material during cold spray, and the resultant coating and/or freestanding structure is
formed in the solid state. Since adhesion of the metal powder to the substrate, as well as the
cohesion of the deposited material, is accomplished in the solid state, the characteristics of
the cold spray deposit are quite unique. Because particle oxidation is avoided, cold spray
produces coatings that are more durable with better bonding. One of the most deleterious
effects of depositing coatings at high temperatures is the residual stress that develops,
especially at the substrate-coating interface. These stresses often cause debonding. This
problem is compounded when the substrate material is different from the coating material.
This problem is minimized when cold spray is used. In addition, interfacial instability due
to differing viscosities and the resulting roll-ups and vortices promote interfacial bonding
by increasing the interfacial area, giving rise to material mixing at the interface and
providing mechanical interlocking between the two materials.
A key concept in cold spray operation is that of critical velocity. The critical velocity for a
given powder is the velocity that an individual particle must attain in order to deposit after
impact with the substrate. Small particles achieve higher velocities than do larger particles,
and since powders contain a mixture of particles of various diameters, some fraction of the
powder is deposited while the remainder bounces off. The weight fraction of powder that is
deposited divided by total powder used is called the deposition efficiency, and several
parameters including gas conditions, particle characteristics, and nozzle geometry, affect
particle velocity. And the quality of the cold sprayed coating is affected by not only particle
velocity, but also the particle size and size distribution. What seem to be lacking, however,
are investigation of influence of particle size distribution. In next section, the influence of the
particle size distribution is explained.
Repair of Turbine Blades Using Cold Spray Technique
501
2.1 Materials used and spray conditions
A nickel-based superalloy Inconel 738LC (IN738LC) was used in this study. This alloy was
solution treated and then subjected to a typical aging treatment. Chemical composition is
shown in Table 1 and heat treatment (HT) was applied as following step; first aging at
843°C/24h with air cooling and the second solution treatment at 1121°C/2h with air. Then,
the alloy was to form 5.0 mm-thick sheets and vertically sprayed on with a high pressure
cold-spray apparatus (PCS-203, Plasma Giken Co., Japan). The thickness of the deposited
layer was approximately 800 μm. The powder particles used for cold spraying were
prepared from IN738LC (same solution number, gas atomized). The sprayed particles had
diameters of less than 25 μm, under 45 μm, and in the range of 25-45 μm. The effect of
particle size variation on the strength of the sprayed layer was evaluated. The particle size
distribution is shown in Fig. 2. And the spray conditions are displayed in Table 2.
Co Cr Mo W Al Ti Nb Ta C Ni
8.25 15.95 1.7 2.6 3.43 3.42 0.95 1.74 0.11 61.85
Table 1. Chemical compositions of IN738LC (wt.%)
Fig. 2. Particle size distribution using different kinds of powder
Particle size (μm) Gas type Temperature (°C) Pressure (MPa)
d<25 He 600/750/800 2.5/3.5
d<45 He 600/750/800 2.5/3.5
N
2
650 3.5
25<d<45 He 600 2.5
Table 2. Cold spray conditions
2.2 Microstructures of cold sprayed Ni superalloy coatings
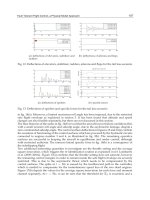
Typical scanning electron microscopy (SEM) images are shown in Fig.3. As shown in these
images, it can be made it possible to form thick and dense deposition by cold spray
technique. And it is clear that denseness of the cold spray coatings depend on spray
conditions. In the case of using 25<d<45 μm powder, in spite of lower gas temperature
compared to the others, coating density was high.
Normally, it has been widely accepted that particle velocity prior to impact is one of the
most important parameters in cold spraying. It determines whether deposition of a particle
or erosion of a substrate occurs on the impact of a spray particle. Generally, there exists
critical velocity for materials such that a transition from erosion of the substrate to
d<45
d<25 25<d<45
Advances in Gas Turbine Technology
502
deposition of the particle occurs, as previously explained. Only those particles achieving a
velocity higher than the critical one can be deposited to produce a coating. The critical
velocity (ref. Fig. 4) is associated with properties of the feedstock (Alkimov et al., 1990; Van
Steenkiste et al., 1999) and the substrate (Stoltenhoff et al., 2002; Van Steenkiste et al., 1999;
Zhang et al., 2003). On the other hand, the particle velocity is related to the physical
properties of the driving gas, its pressure and temperature, as well as the nozzle design in
the spray gun (Dykhuizen & Smith, 1998; Gilmore et al., 1999; Li & Li, 2004; Van Steenkiste
et al., 2002). Ordinarily, higher gas pressure and temperature cause higher particle velocity
on cold spraying. Accordingly, by using higher temperature, it can be easy to deposit the
particles on the substrate and already deposited particles, and to form dense coatings.
However, from the Fig. 3, cold spraying at 600°C has better quality rather than that at 750°C.
This means particle size and size distribution are also important for cold sprayed deposition.
In the next section, it is described that influence of particle size distribution of used powder
focusing on kinetic energy and rebound energy of cold sprayed particles.
Substrate
d<45 750
o
C2.5 MPa
25<d<45 600
o
C 2.5 MPa
d<25 750
o
C 2.5 MPa
Coating
Substrate
Coating
Substrate
Coating
Fig. 3. Examples of typical SEM images of cold sprayed Ni base superalloy coatings
Fig. 4. Critical velocity of cold sprayed depositions
3. Kinetic energy and rebound energy
The cold spraying conditions were optimized by taking into account the particle kinetic
energy and the rebound energy for application in repairing gas turbine blades. A high
quality cold-sprayed layer is that which has lowest porosity; thus the spraying parameters
were optimized to achieve low-porosity layer, which was verified by SEM.
The details on the coating formation mechanism and properties of the cold sprayed layers
have not been elucidated thus far. Fukumoto et al. reported that by this technique, high
Repair of Turbine Blades Using Cold Spray Technique
503
deposition efficiency was achieved under the conditions of high velocity and high
temperature of spraying particles (Fukumoto, 2006; Fukumoto et al., 2007). High velocity
particles which have high kinetic energies tend to be more oblate and facilitate deposition.
Moreover, erosion behavior can be observed when the particle velocity is low, like grit
blasting. Plastic deformation of particles occurs at high kinetic energies of the particles
having a high velocity; this plastic deformation induces the formation of a deposited layer.
This critical velocity at which deposition begins depends on the mechanical properties of the
substrate and the particles, the presence of an oxide layer, and the diameter of the particles.
Vlcek et al. have conducted studies on cold spraying of aluminum, copper, and stainless
steel on mirror-polished iron and steel to investigate in detail the critical velocities of each
metal (Vlcek et al., 2001). In this section, it was suggested that particle impulse (particle
mass × velocity) strongly affects deposition efficiency. From the results of the above studies,
it can be concluded that the factors that influence the deposition efficiency in cold spraying
are: 1) gas temperature, 2) particle mass, and 3) particle velocity. All of these factors depend
on the kinetic energy of particles. Therefore, kinetic energy of particles can influence
deposition efficiency and influence the strength of the deposited layer.
3.1 Rebound energy during deposition
During cold spraying, all the particles are accelerated by the working gas such as helium
and nitrogen. The kinetic energy generated by the working gas induces the deposition.
However, part of this kinetic energy is not utilized for the deposition of particles but gets
converted to rebound energy. This rebound energy of the particles is calculated by Eq. 1 as
follows (Johnson, 1985; Papyrin et al., 2003),
2
1
2
r
pp
RemV
(1)
Here, e
r
is the coefficient of rebound, and for spherical particles, its value is expressed as,
1
2
4
*
11.47
pp
Y
r
Y
V
e
E
(2)
Here,
Y
and
*
E
are the yield stress of the particle and the elastic modulus of the substrate,
respectively; in this study, the parameters of the alloy IN738LC were determined by
conducting proof strength (950 MPa) and indentation tests (201 GPa).
ρ
p
, V
p
, and m
p
are the
particle density, particle velocity, and particle mass, respectively. In this study, both the
particle diameter and mass are sufficiently small.
V
p
is considered to have the same value as
the working-gas flow rate
U
g
. The U
g
is evaluated by the following equation (Eq. 3);
1
2
21
1
e
g
i
g
i
i
P
URT U
p
(3)
Here,
U
g
and U
gi
denote the nozzle outlet and inlet rates, respectively; λ and R denote the
specific heat ratio and the gas constant, respectively; and
P
e
and P
i
denote the nozzle outlet
Advances in Gas Turbine Technology
504
and inlet pressures, respectively. The U
g
values calculated at different U
gi
values are
summarized in Table 3; during the calculations,
P
i
was set as atmospheric pressure.
Obtained gas flow rates by Eq. 3 are listed in Table 3. From the table, the gas flow rate
depends on gas temperature and gas pressure, but is affected by kind of gases in particular.
Gas Spraying conditions Gas flow rate at nozzle
inlet,
U
g
i
(m/s)
Gas flow rate at nozzle
outlet, U
g
(m/s)
He 800°C, 3.5 MPa 33.04 2910.54
750°C, 2.5 MPa 23.77 2775.23
650°C, 3.5 MPa 33.04 2699.48
600°C, 3.5 MPa 33.04 2625.35
600°C, 2.5 MPa 23.77 2563.72
N
2
650°C, 3.5 MPa 32.53 1105.50
Table 3. Gas flow rate at nozzle inlet and outlet under different conditions
3.2 Threshold diameter of adhered particle and rebound particle
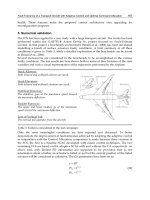
Fig. 5 shows a schematic illustration of the effect of rebound energy of particles on collision
with the substrate. During cold spraying, high velocity particles of various diameters
impinge on the substrate. Consequently, the rebound energy of one particle is transferred to
the other on collision. Let us that all the kinetic energy of the small particles is converted to
adherent energy; Then, if the rebound energy of the coarse particle exceeds the kinetic
energy of the small particles, then the rebound energy of coarse particles cause the coarse
particles to delaminate into smaller particles, as illustrated Fig. 6. Here, the well-adhered
particles are considered to be particles of average diameter. Under this consideration, Eq. 4
was obtained, and the threshold diameter of adherent particle is deduced from Eq. 5, where
ρ, σ, and E are parameters characteristic to the particles. Therefore, D
th
has
a unique value.
Fig. 5. Schematic illustration of effect of particle rebound energies on substrate
Fig. 6. Schematic illustration of rebound energy to surfaces’ particle
Repair of Turbine Blades Using Cold Spray Technique
505
22
11
22
raveave thth
em V m V
(4)
where,
3
4
3
ave ave ave
mr
,
3
4
3
th th th
mr
, and ρ is particle density.
1
1
3
2
4
*
2 2 11.47
pp
Y
th th ave
Y
V
Drr
E
(5)
If the rebound energy of a coarse particle exceeds the kinetic energy of well adhered
particles, then the average-diameter particles can also be delaminated by coarse particle. The
diameter of the resultant negative coarse particle can be calculated from Eq. 6.
1
1
3
2
4
*
2 2 11.47
pp
Y
coa coa ave
Y
V
Drr
E
(6)
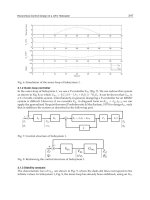
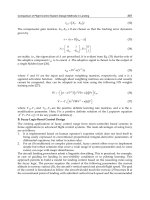
3.3 Equation for optimization of cold spray deposition
The current theoretical principles for cold spray deposition are in Fig. 7. In this figure, it was
considered that d<45. The particle distribution result was obtained on the basis of
fundamental assumptions. In this result, the kinetic energy used to achieve deposition is
that between D
th
and D
coa
. Let α represent the number of particle of each diameter; then, the
kinetic energy of the deposited particles can be evaluated by Eq. 7. Here, the rebound
energy of the coarse particle has a negative effect on the kinetic energy. Therefore, the
rebound energy of coarse particle is subtracted from Eq. 7 to give Eq. 8. Thus, E
deposit
in Eq. 8
represents the effective kinetic energy utilized to achieve deposition. A high E
deposit
value
may imply high deposition efficiency and an improvement in the strength of the adhered
layer. Fig. 8 shows the adhesion strength at different spray conditions, as calculated by Eq.
8. The porosity ratios are determined by carrying out SEM observations. The particle
diameter and spray conditions are found to affect the quality of the deposited layer. In
particular, small particle size can result in the formation of high quality deposited layer.
2
23
:
2
14
*
23
coa
th
i
D
area M i i
D
r
Evr
(7)
2
23 3
22
14
*
23
coa
th coa
ii
D
deposit i i i i
DD
rr
Evrr
(8)
Optimal particle ranges of each spray condition are listed in Table 4. From the result of
Table 4, in the case of condition of d<25, 600°C, He, 2.5 MPa, optimal particle size can be
Advances in Gas Turbine Technology
506
4.50 to 57.3 μm. The d<25 particle includes less than 4.50 μm particles. These smaller
particles can induce formation of porosity or the other defects.
0<d<45
D
coa
Deposit area : M
Blasting area : B
D
th
Fig. 7. Particle size distribution and range of particle deposition
0.00001
0.0001
0.001
Used energy f rom ce rtain number particles ( J)
Porosity (%)
d<25 600℃ 2.5MPa
d<25 600℃ 3.5MPa
d<25 750℃ 2.5MPa
d<25 800℃ 3.5MPa
d<45 600℃ 2.5MPa
d<45 600℃ 3.5MPa
d<45 750℃ 2.5MPa
d<45 800℃ 3.5MPa
25<d<45 600℃ 2.5MPa
N2 <45 650℃ 3.5MPa
d<45(N2)
d<25(He)
d<45(He)
25<d<45(He)
0.38 %
0.5~0.7 %
0.7~1.4 %
Over
5 %
Fig. 8. Evaluation of adhesion strength from Eq. 8
Powder size (μm) Gas Temp. (
o
C) Pressure (MPa) D
th
(μm) D
coa
(μm)
d<25 He 600 2.5 4.50 57.3
3.5 4.47 61.5
750 2.5 4.51 63.2
800 3.5 4.47 63.7
d<45 He 600 2.5 6.56 91.0
3.5 6.49 90.1
750 2.5 6.58 92.2
800 3.5 6.74 93.0
N
2
650 3.5 11.97 123.6
25<d<45 He 600 2.5 10.20 142.7
Table 4. Optimal particle ranges of each spray condition
Assumptions;
Initial particles are spherical.
All kinetic energy is converted to adhesion energy.
A lots of particles inpinge at the same time.
All particle velocities are same with gas velocities.
Fragmentation does not occur.
Repair of Turbine Blades Using Cold Spray Technique
507
4. Microstructure and mechanical properties of as-sprayed coatings
Small punch tests were carried out for as-sprayed cold spray coatings as evaluation test of
mechanical property. Spraying conditions were particle size of d<25 μm, gas temperature of
650°C, He and N
2
gas with 3.5 MPa. And cross-sectional SEM images of both samples are
shown in Fig. 9. The nitrogen gas used coating had many pores, due to lower impinge
velocity (ref. Table 3).
Schematic of small punch (SP) test is illustrated in Fig. 10. The samples for SP tests were
taken from the cold sprayed deposition. The geometry of the SP specimen was Ø8 mm × 250
μm. The SP specimen was received compressive load by Ø1.0 mm alumina ball. The
displacement was measured by Linear Variable Differential Transducer (LVDT). From the
SP tests, maximum load and SP energy were evaluated. The schematic of the SP energy is
illustrated in Fig. 11. The SP energy was estimated from the area of load-displacement
curve. Relationship between applied load and displacement is shown in Fig. 12. And, SP
energy is shown in Fig. 13. From Fig. 12, the He gas used specimens are 3 times higher
maximum load than that of the N
2
gas used ones. And also, the SP energy of the He gas used
specimens was 5 times higher than that of N
2
gas used ones. From these results, mechanical
property of the cold sprayed Ni base superalloy coatings depends on coating quality, such
as porosity ratio, cohesive force etc.
SEM images of the SP specimens after SP tests are shown in Fig. 14. In the case of the He gas
used specimen (see Fig. 14b), radially-propagated cracks were observed. On the other hand,
in the case of the N
2
gas used specimen, brittle fracture at the corner of the die was
generated. The He gas used specimens, which has higher partcile velocity during spraying,
have higher mechnical property than that of N
2
gas used one. However, the maximun load
of bulk Ni base superalloys was approximately 1.0 kN in SP tests. This means that the
mechnical property of the as-aprayed Ni base superalloy coatings are not enough. It is
thought that HT for as-sprayed coatings can be effective for improvement of the mechanical
property. And also, it is expected that the HT can control microstructures of cold sprayed
coatings. In next section, effects of HT is introduced.
(a) N
2
gas used (b) He gas used
Fig. 9. Typical cross-sectional SEM images of cold sprayed Ni base superalloy coatings
Advances in Gas Turbine Technology
508
SP specimen
Alumina ball
Puncher
Loading direction
Linear Variable
Differential Transformer
Magnified
Disk
specimen
Substrate
CS deposition
SP specimens are taken
from CS deposition.
Fig. 10. Schematic illustration of small punch test
Fig. 11. SP energy
Fig. 12. Results of SP test
Repair of Turbine Blades Using Cold Spray Technique
509
24.60±0.11
5.36±1.41
0
5
10
15
20
25
30
S
P
e
n
e
r
g
i
e
s
:
E
s
p
(
m
J
)
650
℃
3.5MP a
He
650
℃
3.5MPa
N2
He
N
2
Fig. 13. SP energy of as-sprayed cold spray coatings
(a) N
2
gas used (b) He gas used
Fig. 14. SEM images of the SP specimens after SP tests
5. Post spray heat treatment (PSHT)
For the repair of gas turbine blades, polycrystalline Ni-based superalloy, IN738LC has been
studied on the optimization of cold spray process, strength evaluation, and so on. But the
mechanical properties of as-sprayed coatings are low compared with bulk materials. In
contrast, their properties can be improved by applying standard HT (solution treatment and
aging treatment) (Niki, 2009). It was also reported that the mechanical strength, ductility,
and adhesion between coating/coating and coating/substrate can be improved by post
treatment which causes atomic diffusion between the coating and substrate and the
generation of intermetallic compounds (Li et al., 2006; Li et al., 2009; Spencer & Zhang,
2009). Thus many researches relating the post HT are necessary for the cold sprayed
coatings. Therefore the following chapter focuses on the metallic structure of the coatings
after post HT including the change of γ’-phase before and after HT, precipitation, grain, and
so on.
5.1 Microstructure after HT
Fig. 15 shows the sectional micrographs of a) the as-sprayed CS coating and b) one after a
standard HT. The existence of pores was confirmed at both samples. From comparing the
two micrographs, the improved adhesive interfaces were observed at some location which
Advances in Gas Turbine Technology
510
revealed that adhesion can be improved by the post HT. Both porosities are shown in Fig. 16
calculated by image processing of cross sectional images. Decrease in porosity is confirmed
from the results after HT. Decrease in porosity of yttria-stabilized zirconia coatings after
post treatment also was reported (Renteria & Saruhan, 2006; Zhao et al., 2006). It might be
resulted from the powder sintering effect by HT over 1000°C. Figs. 17 and 18 show the cross
sectional micrographs of the as-sprayed coating and the heat treated coating respectively. In
case of as-sprayed coatings, the distorted splats are observed but the grain boundary and
intermetallic precipitation of γ’ phases are not observed as shown in Fig. 17b. In case of the
coatings applied the post HT, on the other hand, two different grains which have diameter
of about 800 nm and 250 nm was observed. It reveals the existence of γ and γ’ phase
precipitation. They are irregular in shape, but in case of substrate, two phases are
homogeneous in shape as shown in Fig. 19. High temperature strength of Ni-based
superalloys such as IN738LC is highly dependent on containing the γ’ phase precipitating.
Caron reported that the creep rupture strength of CMSX-2 having the regularly aligned γ’
phase is more higher than one having the irregularly shaped γ’ array (Caron & Khan, 1983)
and it was also reported that Alloy143 having the smaller γ’ phase showed higher creep
rupture strength at 982°C. From above reasons the appropriate post HT are essential for the
cold sprayed coatings including IN738LC to improve their properties.
Fig. 15. Cross-sectional micrographs of the CS coatings, a) as-sprayed and b) applied the
post HT
Fig. 16. Porosity measurement before and after HT
Repair of Turbine Blades Using Cold Spray Technique
511
Fig. 17. Cross-sectional micrographs of the as-sprayed CS coatings showing a) the
coating/substrate interface and b) near the interface
Fig. 18. Cross-sectional micrographs of the CS coating applied the post HT, showing a) the
coating/substrate interface and b) the closed view of coating
Fig. 19. Micrograph of IN738LC substrate after HT
Advances in Gas Turbine Technology
512
5.2 Grain structure study via electron back scattering diffraction (EBSD)
From SEM observations, the grains in the as-sprayed coating were not clearly observed.
Therefore, in order to observe the detailed structures of the as-sprayed CS coatings before
and after HT, the EBSD analysis was carried out which is one of the useful crystallography
methods. The EBSD patterns (Kikuchi) were produced when an electron beam incident on
the sample surface which represent the crystal orientation. Fig. 20 shows a schematic
diagram of the EBSD technique showing the principle of Kikuchi pattern generation and
electron beam irradiation. The Kikuchi lines are appeared when the electron beam is
reflected via the Bragg reflection angles by the inelastic dispersion of electron within a depth
of 50 nm from the sample surface. It is possible to analyze the crystal structure and crystal
orientation at the exact point of sample surfaces by electron irradiation. Strain is expected to
be introduced inside the coatings during the deposition process. The dislocations might be
caused by plastic strain in the coatings. The Kernel Average Misorientation (KAM) can be
effective to analyze these dislocation and plastic strain comparing before and after HT.
Image Quality (IQ) map and Inverse Pole Figure (IPF) map representing the distribution of
plastic strain were also used together with KAM map. The IQ is displayed in the map as the
gray shade which quantified in the sharpness of the diffraction pattern generated from the
sample. High value of IQ represents on the map by bright color close to white, and does
more clearly where the diffraction pattern is strongly obtained. In general, if the grain
boundaries and the distortion are large, or the superposition of patterns from several
adjacent crystals, IQ values are decreased and it appears as black lines on the map. IPF is
classified by color according to the crystal orientation for each grain. In addition, KAM map
is classified by five colors showing the magnitude of plastic strain via the difference in the
orientation of each pixel. Blue color indicates the smallest plastic strain and the red color
indicates the biggest.
Figs. 21 and 22 shows the IQ map and KAM of the coating and substrate interfaces of the as-
sprayed coating and the coating after applied the standard HT. Upper region of each image
is the coating and the lower is the substrate. Dark parts on the IQ and IQ + IPF map, reveal
that the crystal diffraction corresponding a FCC structure was not detected. In addition,
from the EBSD results shown in Fig. 21, most of the diffraction pattern of crystal orientation
cannot be seen in case of the as-sprayed coatings. Region that the crystal orientation is not
observed is reached over dozens of micrometer from the interface. From the result after HT
shown in Fig. 22, the fine grains of 1-20 um in diameter are observed on the coating region.
Fig. 23 shows the EBSD analysis of the IN738LC powder prior to the deposition. The grains
are clearly observed from the feedstock powder, indicating that the crystal change was
occurred after deposition.
The cold sprayed coatings are deposited by large plastic deformation which resulted from
the acceleration and collision with the supersonic feedstock powder. In this case, the grain
refinement is occurred. Zou et al. reported that the submicron grains were observed after
the cold spray deposition with Ni powders via the EBSD analysis (Zou et al., 2009). And
Borchers et al. reported that the deformed grains, sub-grains and fine grains are observed
in the cold sprayed Ni coating by transmission electron microscopy (TEM) analysis
(Borchers et al., 2004). In this study, the amorphous or nano-crystallized grains at the
substrate and coating side near the interface are observed which caused from the plastic
deformation of feedstock and substrates, and then they recrystallized and grew up to
micron size by HT.
Repair of Turbine Blades Using Cold Spray Technique
513
Fig. 20. Schematics presenting a) principle of Kikuchi pattern and b) EBSD technique
Fig. 21. EBSD analysis of as-sprayed samples; a) IQ map, b) IQ + IPF, and c) KAM map
Fig. 22. EBSD analysis of the standard HT sample; a) IQ, b) IQ + IPF, and c) KAM map
Advances in Gas Turbine Technology
514
Fig. 23. EBSD analysis of the feedstock powder before spraying; a) IQ and b) IQ + IPF map
5.3 Nanostructure via transmission electron microscopy (TEM) analysis
XRD analysis results described in the preceding paragraph, CS in the deposition of CS m
depth near the interface and the film was supposed to be because of nano crystals over the
substrate, TEM observation was carried out because the nano-sized crystals were observed
by XRD analysis. Sampling was made by the focused ion beam (FIB) apparatus, which
possesses the coating/substrate interface shown in Fig. 24. The as-sprayed and heat treated
samples were prepared for analysis.
Fig. 25 shows the TEM micrographs of the coating/substrate interface of the as-sprayed CS
sample. The upper part is the coating area and the lower is substrate, and the white arrows
indicate the coating/substrate interface. From this image, the as-sprayed sample is
composed of fine crystals from several tens to hundreds of nm order. Fig. 26 shows the
crystal orientation analysis in the as-sprayed sample. It was confirmed that the crystal
orientation of the six places up to 500 nm in diameter was mixed in disorder at many
regions. Especially near the interface, the points of c, d, and e are remarkable. The curved
grain boundary was observed from Fig. 25. When the feedstock is attached to the substrate
during the deposition by high speed, the severe plastic deformation is occurred in a large
scale, and then the curved interfaces are formed from spherical shape of powder as shown
in Fig. 27. From the expanded view of the splat boundary shown in Fig. 27, the columnar
grain boundaries were observed following a line. Meanwhile, a number of small grains, tens
of nm level, have become a gathering at the bottom of the splats. This difference of grain
shape may come from the different magnitude and direction of plastic strain during the
particle collision. From these results, the schematic diagram of changes in grains of the
powder particles and the substrate during deposition can be inferred as Fig. 28. Nano-sized
isotropic crystalline was formed at near the bottom surface of the particles as compression
direction by the applied strain. In case of side region of coating, the shear strain in the
direction parallel to the substrate surface was occurred and the columnar grains deformed
along the direction of the strain. From the repeat of particle collision, the deposited coating
is composed of columnar crystals and the isotropic nanoscale crystals.
Fig. 29 shows the TEM images at the coating/substrate interface after standard HT.
Comparing with the as-sprayed sample in Fig. 25, the growth of large grains can be
observed. The coating/substrate interfaces are indicated by white dotted lines and white
arrows. As can be seen from this result, the grain was recrystallized and grew in grain size
up to micro order, caused by HT. As shown in red and blue lines in the figure, in
particularly, the interface to grow to the consolidated form. It can improve the adhesion
Repair of Turbine Blades Using Cold Spray Technique
515
strength of the coating/substrate interface by post HT, and such a partial recrystallization at
the interface is considered likely to contribute to improve the adhesion of the coating (Zou et
al., 2009). In addition, Fig. 30 shows the crystal orientation of four points, a, b, c, and d,
around interface in the heat-treated sample. It was confirmed that the grain size of nano-
order still remained at point b which close to the surface, even though the points of a, c, and
d are single grains. Such nano-grain could be a starting point of coating delamination from
the substrate. The post HT with optimal condition are necessary to cover such flaw and then
to improve the interface adhesive.
Fig. 24. TEM sampling position
Fig. 25. TEM image at coating/substrate interface of the as-sprayed CS sample
Advances in Gas Turbine Technology
516
Fig. 26. TEM analysis of crystal orientation at coating/substrate interface of as-sprayed CS
sample
Fig. 27. Magnified image at the coating/substrate interface
Fig. 28. Schematic of the powder grain changes by cold spraying
Repair of Turbine Blades Using Cold Spray Technique
517
Fig. 29. TEM image at coating/substrate interface after post HT
Fig. 30. TEM analysis of crystal orientation at coating/substrate interface after post HT
5.4 High temperature oxidation resistance after post heat treatments
Ni-base superalloys which used as gas turbine blade materials are commonly exposed to
high temperature corrosive environment during operation. Among the turbine blade arrays,
TBC on the first stage blades is designed to prevent oxidation and corrosion of blade
materials from high temperature environment. After long-term use, however, it is
frequently reported that the delamination at the interface of TBC system or the weakening
of grain boundaries caused by oxidation proceeds from intergranular corrosion in materials,
and the cause of crack initiation (Ejaz & Tauqir, 2006; Viswanathan, 2001). As previously
mentioned, the grain size in the CS coating is smaller compared to the substrate material
(substrate: several hundred microns, CS coating: several microns), and there are also
boundaries between the splats. Therefore, it can be considered that oxygen and corrosive
Advances in Gas Turbine Technology
518
components are easily penetrated to grain boundary compared to the substrate. Therefore In
this section, the oxidation resistance of IN738LC CS coatings under high temperature
conditions was evaluated together with the effect of post HT on the oxidation resistance
property. To evaluate the effect of HT on oxidation properties and to compare, the standard
HT (NHT; treated at 1121°C/2h + 843°C/24h) and the high temperature HT (HHT; treated
at 1171°C/2h + 843°C/24h) were applied. And the four condition of the exposure time such
as 100h, 200h, 500h, and 1000h at temperature of 900°C was applied.
As shown in the Fig. 31, it consisted of double internal oxide layer, i.e., Cr
2
O
3
oxide on the
coating surface was mainly observed on Ni-base superalloy IN738LC at 900°C, and the
scattered γ’ phase of Al
2
O
3
also can be categorized into. Thus the evaluation of oxidation
characteristics was performed by measurement of the external and inner oxide layer
thickness and the average value of them. Figs. 32 and 33 show the thickness of external
oxide and inner oxide layer according to the exposure time respectively. And Fig. 34 shows
the cross-section images showing the oxide layer of each sample. The surface oxidation was
progressed significantly at all samples even though they were exposed to only 500h. It could
be resulted from the pore defects in the coatings. For each exposure time and condition, both
of the external and internal oxide layers of as-sprayed state were thickest being followed by
that of most thick, and following the post HT of NHT and HHT. As a result, each CS sample
is considered to be related to grain size in the coating. In case of the external oxide layer, the
substrate had the thickest layer than others, but in case of the internal oxide layer, the
substrate and the NHT sample show a similar level of thickness.
To investigate what caused these differences, the cross-sectional specimen of each oxide by
EDX elemental analysis was performed. From Figs. 35 to 38, they show the EDX analysis for
each sample. From the element mapping of each, as noted in previous, the oxide layer on the
surface is mainly Cr
2
O
3
, but the inner consisted of Al
2
O
3
and TiO
2
. Several elements
presented a significant difference was also observed. Comparing the mapping images, Ti
element was observed only at the substrate sample. In case of the substrate, Cr
2
O
3
, TiO
2
, and
Al
2
O
3
were observed as the main oxides. In case of the cold sprayed coating, in contrast, Ti
penetrated up to below Al layers. Because the coatings consist of smaller grains compared to
the substrate and also the grain boundaries, the oxygen can penetrate and spread easily into
the layer, and finally from the oxides.
Fig. 31. Oxidation of Ni-based superalloy IN738LC; a) schematic of the double oxide layers
and b) SEM image
Repair of Turbine Blades Using Cold Spray Technique
519
Fig. 32. External oxide thickness of each sample according to exposure time
Fig. 33. Inner oxide thickness of each sample according to exposure time
Fig. 34. Cross-sectional images of oxide layer formed at 900°C for 500h; a) substrate, b) as-
sprayed, c) NHT, and d) HHT
Advances in Gas Turbine Technology
520
Fig. 35. EDX mapping of the substrate exposed at 900°C for 200h
Fig. 36. EDX mapping of the as-sprayed coating exposed at 900°C for 200h
Fig. 37. EDX mapping of the NHT sample exposed at 900°C for 200h
Fig. 38. EDX mapping of the HHT sample exposed at 900°C for 200h
5.5 Small punch tests after post heat treatments
Changes in mechanical properties after HT were evaluated by the maximum load and the
absorption energy via the small punch test. Fig. 39 shows the p-
curves and the SP
absorbing impact energy E
sp
before and after HT respectively. It is clear that the maximum
load increased about four times and SP energy also increased about 34 times more after HT.
It reveals that the interface adhesion between the coating and the substrate can be
significantly improved by applying HT after cold spray deposition of IN738LC. The HT
sample in Fig. 39 shows the discontinuous fracture phenomenon with segregation. It may
come from the non-homogeneous adhesion between the deposited splats, i.e., some
interfaces are improved their adhesive strength via the chemical bonding by the post HT but
some part of them cannot bond together due to the gaps between deformed splats. When
the cracks progress at the weak region consisted of more gaps, the mechanical load may be
released temporarily and result in the segregated load flow.
Figs. 40, 41 and 42 show the SP p-
curve, SP dp/d
curve and SP impact absorbing energy
Esp respectively. From Fig. 40, the optimal condition for adhesion layer was to withstand
Repair of Turbine Blades Using Cold Spray Technique
521
Fig. 39. Comparison of a) p-δ curves and b) SP energy with and without PSHT
about 1.5 times of maximum load after the standard HT. Also refer to Fig. 41, the dp/d
value
increased about 2-3 times at same condition. From this, even for good adhesion layer, it was
found that post spray HT (PSHT) could improve the resistance to deformation or fracture.
For a long time thermal aging material which intended for actual use, the maximum load
was slightly less compared to the substrate, but SP absorbed energy value of the E
sp
show
about three times of the value of the substrate. Then it became clear that the ductile behavior
of the strain to failure increases. Fig. 43 shows the cross-section of SP sample after etching.
When the ball was in contact with the substrate/coating interface, it stopped after crack
Advances in Gas Turbine Technology
522
propagation of about 300 μm. It was found that the crack stopped after propagating into
layer shown in figure. It revealed that the interfacial bonding strength among the splats is
considered to be sufficiently high after HT. Thus, for repair of the gas turbine blades by cold
spray deposition, the PSHT could be admitted the possibility of applying this technique
layer from the viewpoint of the better mechanical properties of IN738LC.
Fig. 40. Comparison of p-
curves with short and long heat treatment
Fig. 41. Derivation of SP p-
curve for each point
Repair of Turbine Blades Using Cold Spray Technique
523
239.2±51.7
504.8
615.8
0
100
200
300
400
500
600
700
SP energies : E
sp
(mJ)
Substrate 1121℃-843h
600℃ 2.5MPa He 1121℃-843h
600℃ 2.5MPa He 1121℃-843h 900℃-500h aging
Fig. 42. Comparison of SP energies with short and long heat treatment
Fig. 43. Cross sectional SEM images of SP specimen
6. Summary
The optimization of cold spraying conditions based on the kinetic energy and rebound
energy of the particles was carried out. The particle diameter and spray conditions were
found to affect the quality of the diameter deposited layer. In particular, small particle size
can effectively improve the quality of the deposited layer. In small punch tests, the He gas
used specimens showed are higher maximum load and SP energy than that of the N
2
gas