Optical Fiber Communications and Devicesan incorrectly Part 3 potx
Bạn đang xem bản rút gọn của tài liệu. Xem và tải ngay bản đầy đủ của tài liệu tại đây (1.11 MB, 25 trang )
Multimode Passive Optical Network for LAN Application
39
0
20
40
60
80
100
120
140
160
180
200
0 10203040506070
n - nodes
S - couplers
Tree/Directional star Transmissive star Reflective star
Fig. 5. Number of couplers in the network C
0
2
4
6
8
10
12
14
16
0 4 8 1216202428323640444852566064
n - nodes
C - couplers
Directional star Reflectional star Transmissive star Tree
Fig. 6. Number of couplers in the optical path S
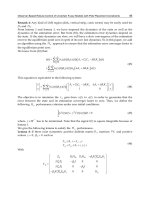
the total cost of the network. On the other hand in this structure there is the lowest number
of couplers in the optical path S, which makes it possible to improve the signal quality
between nodes and to increase the overall network size.
Apart from the number of network nodes, parameters limiting a network size are the
dynamic range of the transceivers and the length of the used patchcords. It seems that the
number of couplers used has little influence on transmission speed but GI couplers bring
losses around 3,5 dB (splitting 50% = 3dB and their intrinsic losses of about 0.5 dB). It can be
Optical Fiber Communications and Devices
40
assumed that losses introduced by inserting less than 7 couplers do not depend on the signal
frequency. However, fiber losses depend on the signal frequency. Probably connector losses
increase with frequency but that fact is yet to be investigated. It can be proven that the
optical power budget changes with the frequency.
3. Medium access methods in PONs
3.1 Introduction
Ethernet networks based on the CSMA/CD (Carrier Sense Multiple Access with Collision
Detection) protocol have gained widespread popularity thanks to their easy expandability
and the simplicity of their node arrangements. Unfortunately, the introduction of the
CSMA/CD method into optical networks is complicated because of the peculiar nature of
optical signals. Collision detection in conventional copper cabling networks takes place in
the electric domain: the voltage level elevated above a certain threshold is measured.
Collision detection in the case of optical signals carried in networks is much more difficult.
Since fibre optic circuits have different signal attenuation coefficients, bouncing occurs at
circuit junctions whereby the power of the carried signals changes. As a result, such simple
collision detection methods as the ones used for electric circuits cannot be employed here.
Below, the collision detection methods used in the passive optical networks, their
advantages and limitations and the potential for implementing them in proposed specific
passive structures are discussed. We show several possible uses for different medium access
mechanisms: CSMA/CD, CSMA/CA (Carrier Sense Multiple Access with Collision Avoidance),
TDMA (Time Division Multiple Access) and WDMA (Wavelength Division Multiple Access).
3.2 Methods of detecting collisions in CSMA/CD networks
We assume that the network structure is based exclusively on optical fibre circuits and
optical fibre couplers (Reedy J.W., 1985). The collision detection methods can be classified
as:
operating exclusively in the optical domain – the solutions presented in sections 3.2.1
and 3.2.2,
ones in which collision detection is performed after the optical signal has been
converted into an electric signal in a network node – the solutions presented in sections
3.2.3 and 3.2.4.
3.2.1 Measurement of average optical power
In the average optical power measurement method a collision occurs when the optical
power received in a receiver is higher than the power transmitted by a single network node.
The threshold power above which a collision is detectable is higher than the power required
to receive data in normal transmission conditions. In order to increase the method’s
effectiveness the optical transmitter must be switched off when no transmission occurs. This
increases the transmitting system’s complexity and has an adverse effect on the laser
sources. The time needed for switching on the laser reduces the effective speed of
transmission in the network. In order to minimize this drawback, one can use power supply
systems with two working points. In the idle state the laser current is low but sufficient for
Multimode Passive Optical Network for LAN Application
41
lasing to occur. A working point for collision detection requires a much higher laser feed
current to emit the higher optical power needed for the proper transmission of data in a
network. One should also take into account the laser sources’ power level tolerance, the
effectiveness of the laser source/optical fibre coupling and the quality of the fibre optic
connections. Hence one must determine the allowable optical power level in the network for
both transmission and no transmission (Fig. 7).
Fig. 7. Power levels at transmission and at no transmission.
3.2.2 Directional coupling
This method makes use of special optical fibre coupling techniques whereby one can create
such a system in which a given station can hear all the stations, but not itself. Collisions in
this case are detected directly: if a given station transmitting data detects a signal in its
receiver, this means that a collision has occurred.
How can such a directional system of connections be built to meet the requirements? An
example here is the construction of a duplex bus based on two optical fibres, as shown in
Fig.8. In such a system each node transmits data through the lower fibre to the neighbouring
nodes on its left and via the upper fibre to its neighbours on the right. As a result, all the
stations, except for the transmitting station, receive the data signal.
Since this bus topology is now outdated, efforts are made to build more effective networks
using the star topology. A directional star coupler in which optical power from each of the
LOWER FIBER
R T
STATION 1
T R
R T
STATION 2
T R
R T
STATION N-1
T R
R T
STATION N
T R
UPPER FIBER
Fig. 8. Duplex fibre optic bus.
Optical Fiber Communications and Devices
42
inputs is equally distributed among all the outputs except for one is used for this purpose.
Such a network can be constructed by connecting 22(X) and 21(Y) couplers. An MM star
coupler can be obtained by connecting 2*M couplers with M – 1 inputs/outputs. The
function of the inputs/outputs is to split or combine optical powers. An exemplary four-
port star with sending-receiving systems is shown in Fig. 9.
STATION 1
STATION 3
STATION 3STATION 4
SPLITTER
COMBINER
COUPLING
Fig. 9. Directional four-port star.
3.2.3 Pulse width disturbance
The pulse width disturbance measurement method exploits the fact that in the primary
Ethernet system a data stream is encoded using the Manchester code so that the information
bit is always encoded as transition “01” or “10”. Consequently, one can exactly define the
data stream pulse width free of any collisions. Modulation at a rate of 20 Mbaud was
employed in a system with a throughput of 10 Mbps whereby a single pulse should be
nominally below 100 ns. The collision detection system’s function is to detect signals
exceeding the nominal pulse width (Fig. 10).
Fig. 10. Manchester coding scheme.
Multimode Passive Optical Network for LAN Application
43
Similarly to other amplitude measurement techniques, this method is limited by situations
in which a weaker signal is masked by another stronger signal. Hence, it is essential to build
junctions between network nodes having the same attenuation for each optical circuit.
Optical attenuators or asymmetric couplers are used for this purpose. Another way of
solving this problem is to employ a centralized collision detection unit. If a collision is
detected by the central mechanism, the latter sends a strong jam signal to all the sending-
receiving devices in the network whereby a change in the pulse width is easily detectable.
This represents, however, a departure from the fully passive network concept. The jam
signal can be used to amplify collisions in systems with collision detection, in which at least
one station informs another transmitting station in the network that a collision has occurred.
The method’s drawback is the necessity of using Manchester encoding, i.e. modulation
twice as fast as the transmission speed. For this reason, the above method is limited to
speeds below 10 Mbps, becoming highly ineffective at higher speeds.
3.2.4 Direct comparison of streams
This method consists in comparing the sent binary stream with the received stream in the
electrical signal domain within a given sending-receiving device. If the received bit stream
does not tally with the sent one (allowing for propagation delay), the system determines that
a collision has occurred. This complicates a little the system since it is necessary to install
memories buffering the card’s outgoing traffic. One should also include a system analysing
incoming signal delays relative to the sent signal. The system ought to be able to negotiate
the connection parameters by sending test packets when a new card is installed in the
system. Obviously, one should also specify the attachment of a sending-receiving device to
the network in such a way that the detector of one device could receive the signal from its
own transmitter (Fig. 11).
Fig. 11. Device-to-passive-star attachment diagram.
The method’s apparent advantage is the system’s transparency with regard to coding since
the detection of collisions takes place at the level of analysis of individual binary pulses.
Moreover, the method does not introduce significant transmission rate limitations and is
suitable for transmission rates of 100 Mbps.
Optical Fiber Communications and Devices
44
3.3 Medium access in CSMA/CA networks
A need of all-optical networks has prompted the design of protocols that could detect the
presence or absence of optical signal on a specific channel without regard to the high-bit rate
data being transmitted. One of these kinds of protocols is protocol CSMA/CA, whereby nodes
using optical carrier-sense capability prevent transmitting a packet at times when it would
collide with other packets which are already in transit. Unlike the CSMA/ protocol where
collisions are tolerated and the retransmission is required, here the collisions cannot happen.
Below there is a presented exemplary scheme of arbitrary node in a ring network that
enables collision detection. Each node receives packets on a single unique wavelength but
can transmit packets on any wavelength (Wong E., 2004).
Fig. 12. Architecture of an arbitrary node in a CSMA/CA network.
To prevent collisions at the out ports between the transmitted packets and those that are
already in transit, a part of the optical power of all packets arriving at the node is tapped.
The tapped signals are demultiplexed into individual wavelengths, which are then detected
by BCSCs (Baseband Carrier-Sense Circuits) that perform packet detection. Each BCSC
generates a control signal that informs if the channel is occupied or not. Based on this, the
transmitter unit evaluates the duration of the transmission gap between adjacent arriving
packets and if it is suitably long to send its own packet.
Presented scheme concerns the module based on the single-mode optical fibres. According
to our knowledge there are no presented similar solutions for multimode optical fibres so
far, but we predict it is potentially possible.
The proposed protocol requires complicated and expensive electronic processing so it can
not be used in the planned commercial applications.
The main advantage is a simple management layer (L2) and the main disadvantage is a
complicated physical layer (L1).
Multimode Passive Optical Network for LAN Application
45
3.4 Medium access in TDMA networks
TDM (Time Division Multiplexing) is a technology that is used mainly in access networks, but
it may also be useful in local networks. This technique relies on the assignment of suitable
time cells for the input streams. TDMA technique is usually used in tree type structures
(Pesavento G., 2003).
Fig. 13. Architecture of TDMA network.
The main advantages of TDMA protocol are:
a. possible larger network span at higher efficiency than in CSMA/CD
b. management algorithms adaptable from EPON (Ethernet Passive Optical Network)
networks
c. centralised management
d. very easy to prioritise traffic
e. QoS support
The main disadvantages of TDMA protocol are:
a. required complicated algorithms for traffic management
b. efficiency dependent on network size and network load
c. central node much more complicated than other ones
3.5 Medium access in WDMA networks
Although PON's provide higher bandwidth than traditional cooper-based access networks,
there exists the need for further increasing the band of the PON's by employing WDM
(Wavelength Division Multiplexing) so that multiple wavelengths may be supported in either
or both upstream and downstream directions. Such a PON is known as a WDM-PON. Fiber
optical networks, working on the basis of WDMA technique, are natural evolution of optical
fiber links working in point-to-point topology using WDM. WDMA network development
can also be considered as abilities to increase the effect of one wavelength-based passive
optical networks (Banarjee A., 2005).
Optical Fiber Communications and Devices
46
The ability of data sharing between users, when a common transmission medium is being
used, is an important feature of these kinds of networks.
Data streams are transmitted, using different wavelength multiplied optical transmitters, to
all network nodes. When the detector receives information, it selects a desirable signal from
all transmitted signals in one fiber using selective optical filter. In order to meet the above-
mentioned requirements co-shared medium currently requires the star topology network
architecture.
Standard PON operates in the “single wavelength mode” where one wavelength is used for
upstream transmission and a separate one is used for downstream transmission.
Different sets of wavelength may be used to support different independent PON
subnetworks, all operating over the same fiber infrastructure.
Even though they provide the highest capacity, optical WDMA networks are usually too
expensive. Also, their reliability is usually low due to the use of active systems (e.g.
multiplexers or switches). Access networks still require inexpensive solutions in which the
costs of the network will be shared between all users.
In the world literature there are no interesting solutions concerning the use of WDM
technique in multimode networks based on wavelengths 850 or 1300 nm. We propose
installation of several sources with various wavelengths (1310, 1330, 1350, 1370 nm) and
passive filters in nodes, which would increase the transmission speed but decrease the
number of users. We must use supplementary couplers for connecting several sources and
detectors with CWDM (Coarse Wavelength Division Multiplexing) multimode couplers.
As far as we know, an interesting solution can be achieved for wavelengths 1300 –1550nm in
multimode optical fiber (there can be used the fiber elements which are commercially
available).
Based on the preliminary measurement of the passive structures, one can assess parameters
of the network built presented above and working with 1Gbps transmission speed.
Parameters presented in Table 1 were determined for optical path with 100m fiber optical
patchcords connecting nodes with the structure. In the table, based on the date from our
measurement, we present projects of structures and parameters possible to achieve. There
are also proposals of suitable protocols for the chosen structures.
The number of nodes in the networks depends significantly on the dynamics of available
electro-optical converters. For the 850nm bandwidth the normal off-the-shelf transceivers
usually offer dynamics only slightly better than 15dB, while in 1300nm windows the
dynamics can reach beyond 25dB.
The main advantages of WDMA protocol are:
possibility of building a few “logical networks” on top of only one physical structure
“logical networks” can be invisible to each other (depends on the central node)
efficiency depends on the access mechanism used in “logical networks” (usually
TDMA)
more wavelengths = better utilised fibre
ease of adding a special channel for network management
Multimode Passive Optical Network for LAN Application
47
most elastic with tunable receivers and transmitters
The main disadvantages of WDMA protocol are:
complicated and expensive in most configurations
efficiency depends on the access mechanism used in “logical networks” (usually TDMA)
most flexible with tunable receivers and transmitters
4. Measurements of base transmission parameters
4.1 BER measurement
Special systems were designed in order to measure BER (Bit Error Rate) in multimode
passive optical networks based on a FPGA programmable logic combined with electro-
optical transceivers for 850nm and 1300nm wavelengths. The transmitters used in the 850nm
transceivers were VCSEL lasers whereas in the 1300nm transceivers there were DFB lasers.
The spectra of both are presented in Fig.14. The dynamic of the AFBR-53D5Z was 13dB and
HCDTR-24 was 22dB. The built system allows for the selection of a number of transmitted
bits in the range between 10
6
– 10
12
as well as the transmission speed. Communications with
the FPGA setup was carried out using standard LVPECL differential signals. The
measurements were performed in two speed ranges: 100Mbps and 1Gbps.
Fig. 14. Spectra of used VCSEL (850 nm) and DFB (1300 nm) lasers.
The network configuration the measurements were carried out in are presented in Fig. 15.
1
2
N
Multimode couplers
100m MMF
50/125 um
100m MMF
50/125 um
Xilinx Spartan 3
FPGA
HFBR-53D5
Transceiver
Tx
Rx
BER Meter
Fig. 15. The tested optical path.
Optical Fiber Communications and Devices
48
The tested optical path included a cascade of GI optical couplers and two 100m GI patch-
cords at the start and the end of the cascade of couplers. The obtained measurement results
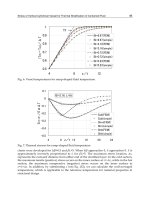
for two different wavelength BER in 100Mbps range are presented in Fig.16.
Fig. 16. BER measurements for two different wavelengths 850 nm (a) and 1300 nm (b) for
speed transmission 100 Mbps as a function of attenuation obtained by including following
couplers in optical path.
In order to construct the electro-optical transceiver working in 1GHz range we chose the
byte method. The block diagram of the E/O transceiver working in the byte mode was
shown in the Figure 17.
PHYceiver
1 Gb
Ethernet card
Optical
transceiver
M I I
FPGA
Decision
PHYceiver
SERDES
Fig. 17. E/O transceiver working in the byte mode.
In the byte mode, the Ethernet frame is decoded only into small pieces, i.e. nibbles for 100
Mbps and bytes in 1Gbps network speed. The bytes are sent in parallel to the SERDES
(serializer/deserializer circuit). Although this makes frame end detection more troublesome (5
bit or 10 bit long words have to be analyzed), it offers faster collision detection, higher
network throughput and a possibility of using the XC3S200 chip in 1Gbps networks.
Fig.18 shows WER (Word Error Rate) as a function number of coupler. Multimode GI coupler
cascade measurements show that the tested off-the-shelf transceivers make it possible to
build 1Gb optical networks with up to three coupler levels in optical path (Fig.18).
Multimode Passive Optical Network for LAN Application
49
4.2 Bandwidth measurement
We've designed media converters for bandwidth measurement purposes. Transceivers AFBR-
53D5Z, HCDTR-24 and PIN diodes have been used to build media converters. The bandwidth
measurements were performed for different network configurations, including the GI
patchcord cascade, GI coupler cascade and a complete optical path. The measurements were
performed in the measurement setup shown in Fig.19 (for patchcord cascade).
1,0E-12
1,0E-11
1,0E-10
1,0E-09
1,0E-08
1,0E-07
1,0E-06
1,0E-05
1,0E-04
1,0E-03
1,0E-02
1,0E-01
1,0E+00
WER
12345
Number of couplers in cascade
Fig. 18. WER of transmission through cascade of couplers at 1,25GHz.
Signal
Generator
Mediaconverter
with HFBR-53D5
Spectrum Analyzer
100m GI-MMF
50/125um
100m GI-MMF
50/125um
200m GI-MMF
50/125um
500m GI-MMF
50/125um
- FC connector
100m GI-MMF
50/125um
APD
Fig. 19. Bandwidth measurement setup – a patchcord cascade.
Measurements were performed at various frequencies within the 10 MHz -1 GHz range.
Similar to the setup where BER measurements were taken the network elements (GI patch-
cords and GI couplers) in this setup were also joined using FC connectors. Fig.20 presents
the transmission spectrum for a patchcord cascade and Fig.21 - for the complete optical
path. One can notice that if the path attenuation does not exceed the dynamics of the
transceivers, then the attenuation does not depend on the transmitted signal's frequency. On
the other hand, if the optical path attenuation exceeds the system's dynamics, then the
transmission bandwidth becomes significantly reduced.
Optical Fiber Communications and Devices
50
-26
-24
-22
-20
-18
-16
-14
-12
-10
-8
-6
-4
-2
0
10 100 1000
f [MHz]
A [dB]
100 m 200 m
300 m 400 m
500 m 600 m
700 m 800 m
900 m
Fig. 20. Frequency response of the fiber optic patchcord cascade (850 nm).
-30
-25
-20
-15
-10
-5
0
10 100 1000
f [M Hz]
A [dB]
1 coupler 2 couplers
3 couplers 4 couplers
5 couplers 6 couplers
7 couplers
Fig. 21. Frequency response of the optical path (850 nm).
Multimode Passive Optical Network for LAN Application
51
5. Network’s size estimation
Parameters for a 1Gbps PON network can be assessed based on the passive structures
measurements. The parameters presented in Table 1 were determined for an optical path
with 100m fiber optic patchcords connecting nodes with the structure. In the table, we
present projects of structures and parameters possible to achieve based on the data from
our measurements. There are also proposals of suitable protocols for the chosen
structures.
The number of nodes in a network depends significantly on the dynamics of available
electro-optical converters. For the 850nm bandwidth the normal off-the-shelf transceivers
usually offer dynamics only slightly above 15dB, while the dynamics in 1300nm and
1550nm windows can exceed 25dB.
Dynamic
15 dB 25 dB
Type of structure Transmissive star Directional star Transmissive star Directional star
Number of
nodes
16 6 64 12
Number of
couplers in the
network
32 9 192 21
Bandwidth
1 Gbps 1 Gbps 1 Gbps 1 Gbps
Method of
collision
detection
Comparison of
streams
Directional
coupling
Comparison of
streams
Directional
coupling
Necessary
Hardware
Ethernet card
with MII
interface
+ FPGA
programmed
structure
Standard
Ethernet card
+ converter
NRZI <=>
MLT-3
Ethernet card
with MII
interface
+ FPGA
programmed
structure
Standard
Ethernet card
+ converter
NRZI <=>
MLT-3
Table 1. Parameters of the network topologies
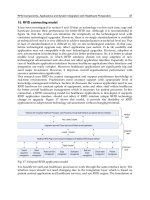
6. The possibilities of applying CWDM method in a multimode structure
Transmission of different wavelengths in the optical passive structure allows obtaining
more effective and quicker communication between nodes. We propose installation of a few
different wavelength transmitters (T1-1310 nm, T2-1330, T3-1350 and T4-1370 nm) and
receivers with CWDM multimode couplers in receiving stations, working as optical filters.
Such installation allows the given structure to simultaneously transmit different
wavelengths while giving transmission speeds proportional to the number of introduced
wavelengths.
Optical Fiber Communications and Devices
52
Fig. 22. Proposal of various CWDM PON structures
7. Conclusions
In this chapter we've proven feasibility of constructing Ethernet type local area networks
based on multimode fibers working in either 850nm or 1300nm windows. Bandwidth, BER
and WER analyses demonstrated possibility of building efficient networks with many GI
50/50 couplers in the optical path. Within the analyzed network types, the most promising
for implementation at this point seems to be the transmissive star structure. Although the
electrical part is complicated, much higher network capacity at relatively low cost per unit is
well worth the tradeoff.
The available network structure size also greatly depends on the structure type. Out of the
structures chosen for analysis, the transmissive star seems to offer much larger network size
than the directional star structure. The advantage of transmissive star is its simpler collision
detection method. Implementing directional coupling can be faster than the other streams
because it's easier. Nodes based on directional coupling will be slightly cheaper, also there is
no need for additional, complicated logic.
8. References
Aronson L., Lemoff B., Buckman L., Dolfi D. Low-Cost Multimode WDM for Local Area
Networks Up to 10 Gb/s” IEEE Photonics Technology Letters, Vol. 10, No 10, 1998, pp.
1489-1491
Multimode Passive Optical Network for LAN Application
53
Banarjee A. et al. Wavelength division – multiplexed passive optical network (WDM-PON)
technologies for broadband access: a review [invited] 2005 Optical Society of America,
November 2005, /vol. 4, No.11/ Journal of Optical Networking
Beres-Pawlik E., Budzyn G., Lis G., Napierala M., Nawrot K., Multimode fiber passive optical
network, Progress Report France-Telecom, February 2007.
Beres-Pawlik E., Budzyn G., Lis G., Duchiewicz T., Multimode fiber passive optical network-
practical realization of designed network, Finish Report France-Telecom, November 2007.
Beres-Pawlik Elżbieta, Budzyń Grzegorz, Lis Grzegorz, Napierała Marek: Passive multimode
fibre optic structures. 8th ICTON, Vol. 4. Conference proceedings IEEE, 2006 pp. 72-75.
Beres-Pawlik E., Budzyń G., Lis G., Duchiewicz T., Estimation of Multimode Optical Fiber
Network Size ICTON 2008 Mediterranean Winter, Marrakech, December FR3A.5
Budzyn G., Lis G., Głąb J., Bereś-Pawlik E., An analysis of transmission of signals above 150MHz
in passive optical multimode networks Proceedings of Conference ICTON 2005,
Barcelona 3–7 July 2005,
Budzyn Grzegorz, Lis Grzegorz, Bereś-Pawlik Elżbieta.: Methods of Building Ethernet – type
Passive Optical Networks, 8
th
ICTON, Conference proceedings IEEE, 2007. Vol. 4,
pp.35- 38.
Budzyn G., Lis G., Duchiewicz T., Beres-Pawlik E., Realization of the stream comparison
mechanism in a CSMA/CD type multimode passive optical network node-algorithm ICTON
2008, Conference Proceedings vol.4, pp 332-334.
Chae C., Wong E.,. Tucker R, Optical CSMA/CD Media Access Scheme for Ethernet Over Passive
Optical Network, IEEE Photonics Technology Letters, Vol. 14, No. 5, May 2002. pp.
711-713.
Chae C., Multi-wavelength Ethernet Passive Optical Network with Efficient Utilization of
Wavelength Channels, ECOC 2005 Proceedings – Vol. 3 Paper We4.P.067. pp 635-636.
Gilmore M.C., Multimode fibre bandwidth – its true value for high bit rate networks within plug-
and-play data centre infrastructures, The Fibreoptic Industry Association (FIA), 16
April 2006.
Hakamada Y., Oguchi, K. 32-Mbit/s Star Configured Optical Local Area Network Design and
Performance, Journal of Lightwave Technology, Vol. LT-3(3), ©1985 IEEE, pp. 511-
524.
Hu S., Jack Ko J., Hegblom E., Coldren L. Multimode WDM Optical Data Links with
Monolithically Integrated Multiple-Channel VCSEL and Photodetector arrays, IEEE
Journal of Quantum Electronics, Vol.34, No 8 1998, pp.1403-1413.
Huang X., Ma M., Efficient scheduling with reduced message delay for passive star coupled WDM
optical networks, IEEE Proc Commun., Vol. 152, No. 6, December 2005. pp. 765-770.
Kramer G., Pesavento G., Ethernet Passive Optical Network (EPON): Building a Next-Generation
Optical Access Network, IEEE Communications Magazine, February 2002
Lee S.E., Boulton P., The Principles and Performance of Hubnet: A 50 Mbit/s Glass Fiber Local
Area Network, Journal on Selected Areas in Communications, Vol. SAC-1(5), ©1983
IEEE, pp. 711-720.
Lemoff B., Aronson L., Buckman L., Multimode WDM LAN using novel wavelength
demultiplexer, CLEO 98, Monday May 4 pp. 27-28
Musa S. et al. Multimode fiber matched arrayed waveguides grating-based (de-) multiplexer for
short distance communications ECOC, 2002. PLC 6.2.1.
Nadarajah N., Manik A., Ampalavanapillai N., Wong E., A Novel Local Area Network
Emulation Technique on Passive Optical Networks, IEEE Photonic Technology Letters,
Vol. 17,No. 5, May 2005. pp. 1121-1123.
Optical Fiber Communications and Devices
54
Olshansky R., Keck D., Pulse broadening in graded-index optical fibers, Applied Optics, Vol.
15(2), February 1976, pp. 483-491.
Pawlik E., Juszczak R., Asymmetrical multimode couplers for local area networks, Optica
Applicata, Vol. XXIX, No. 1-2, 1999,
Pawlik E., Słowiński Z., Polish Patent no 162049, 1993
Pepeljugoski P. et al., Modeling and Simulation of Next-Generation Multimode Fiber Links,
Journal of Lightwave Technology, vol.21, No 5, 2003, pp.1242-1255.
Pesavento G. Ethernet Passive Optical Network (EPON) architecture for broadband access, Optical
Networks Magazine, January/February 2003,
Piotorowski A., Bereś-Pawlik E., Passive Optical Multimode Fibre Network, ICTON 2004,
Wroclaw 4-8 July, Proceedings Conference.
Podwika D., Stefański D., Witkowski J., Pawlik E , Computer Networks based on optical Passive
Couplers , ICTON 2000, Gdańsk 5-8 June, Proceedings Conference pp.123-126,
Radovanović I., Ethernet - Based Passive Optical Local-Area Networks for Fiber-to-the-Desk
Application, Journal of Lightwave Technology, vol. 21, no. 11, November 2003,
Rainer M. Four-Channel coarse WDM 40 Gb/s Transmission of short –Wavelength VCSEL Signals
Over High-Bandwidth Silica Multi-Mode Fiber, Annual Report 2000, Optoelectronics
Department, University of Ulm.
Rawson E., Metcalfe R., Fibernet: Multimode Optical Fibers for Local Computer Networks, IEEE
Transactions on Communications, Vol. COM-26(7), ©1978 IEEE pp. 983-990.
Reedy J., Jones J. R., Methods of Collision Detection in Fiber Optic CSMA/CD Networks IEEE
Journal on Selected Areas in Communications, vol. 3, no. 6, November 1985,
Schmidt R., Rawson E., Norton R., Jackson S., Bailey M.D., Fibernet II: A Fiber Optic Ethernet,
Journal on Selected Areas in Communications, ©1983 IEEE, pp. 291-300.
Stallings W., Local Network Performance, IEEE Communications Magazine, Vol. 22(2), © 1984
IEEE, pp. 27-35.
Stępniak G., Ł.Maksymiuk, J Siuzdak, Bandwidth analysis of multimode fiber passive optical
network (PONs), Optica Applicata, vol XXXIX, No2, 2009, pp.239 – 233.
Tamura T., Masuru Nakamura M., Ohshima S., Ito T., Ozeki T., Optical Cascade Star Network
– A New Configuration for a Passive Distribution System with Optical Collision Detection
Capability, Journal of Lightwave Technology, Vol. LT-2(1), ©1984 IEEE, pp. 61-66.
Shimada T. et al. WDM Access system Based on Shared Demultiplexer and MMF Links Journal
of Lightwave Technology , vol.23, No.9 2005, pp. 2621-2628.
Wong E., Chang-Joon Chae, CSMA/CD-based Ethernet passive optical network with shared LAN
capability, 2000 Optical Society of America, Fiber optics communications; Networks.
Wong E., Chang-Joon Chae,
Performance of Differentiated Services in a CSMA/CD-based
Ethernet o
ver Passive Optical Network, 2004 IEEE. pp. 641-642.
Wong E., Summerfield M., Sensitivity Evaluation of Baseband Carrier-Sense Circuit for Optical
CSMA/CA Packet Networks, Journal of Lightwave Technology, Vol. 22, No. 8,
August 2004 pp.1834-1843.
Zheng J., Hussein T. Mouftah, An Adaptive MAC Polling Protocol for Ethernet Passive Optical
Networks, 2005 IEEE. pp.1874-1878
Zheng J., Hussein T. Mouftah, Media Access Control for Ethernet Passive Optical Networks: An
Overview, IEEE Communications Magazine, February 2005, IEEE. pp. 145-150.
Zhu Y., Maode Ma, Tee Hiang Cheng, A Novel Multiple Access Scheme for Ethernet Passive
Optical Networks, GLOBECOM 2003, pp. 2649-2653.
3
Effects of Dispersion Fiber on CWDM
Directly Modulated System Performance
Carmina del Río Campos and Paloma R. Horche
Escuela Politécnica Superior, Universidad San Pablo CEU
ETSIT, Universidad Politécnica de Madrid
Spain
1. Introduction
The Coarse Wavelength Division Multiplexing technology (CWDM) enables carriers to
transport more services over their existing optical fiber infrastructure by combining multiple
wavelengths onto a single optical fiber. CWDM is technologically simpler and easier to
implement and is a good fit for access networks and many metro/regional networks. ITU-T
G.694.2 defines 18 wavelengths for CWDM, using the wavelengths from 1270 nm through
1610 nm with a channel spacing of 20 nm. This channel spacing allows to use, in CWDM
systems, low-cost and uncooled lasers, e.g. direct modulated laser (DML).
The high output power of commercial 1.55- µm DMLs can provide a power budget that
allows for amplifier/regenerator spacing of 80–100 km. However, the frequency chirp
characteristics of DMLs significantly limit the maximum achievable transmission distance
over standard single-mode fibers (SMF) [Cartledge 1989].
A number of approaches have been used to improve transmission performance using
directly modulated lasers, including cutting down the chirp externally using a narrow band-
pass filter [Yan 2005] and the deployment of a negative dispersion fiber [Tomkos 2001a,
Tomkos 2002]. However, typical metro and access networks are made up of a conventional
single-mode fiber (SMF) and because of the cost and difficulty (or lack of feasibility) in
changing embedded fiber links, a method that enhances system performance requiring only
the modification of one or both of the endpoints of a link is a critical requirement.
In this chapter, by means of a commercial Optical Communication System Design Software,
we evaluate the interaction of fiber dispersion with the laser chirp in context of positive and
negative dispersion coefficient. We evaluate two types of laser, with different characteristics
and we determine optimal optical output power in every case. We have demonstrated that
enhanced system performance, which uses a positive dispersion fiber, can be achieved if
positive chromatic dispersion in the optical fiber is equalized by SPM, whereas laser
transient chirp can be compensated using a negative dispersion fiber.
2. Dispersion in optical fibers
Dispersion occurs when a wave interacts with a medium or passes through an inhomogeneous
geometry. It causes pulses to broaden in optical fibers, degrading signals over long distances.
Optical Fiber Communications and Devices
56
If dispersion is too high, a group of pulses representing a bit-stream will spread in time
making the bit-stream unintelligible. This limits the length of link or the information capacity
of the fiber without regeneration. There are different types of dispersion, which all involve the
dependence of the phase velocity or phase delay of light in some medium: intermodal
dispersion, polarization mode dispersion and chromatic dispersion.
Intermodal dispersion results from different propagation characteristics of higher-order
transverse modes in waveguides and can limit the possible data rate of a system for optical
fiber communications based on multimode fibers.
Polarization mode dispersion results from polarization-dependent propagation
characteristics. In a waveguide, different polarizations of light travel at different speeds due
to imperfections and asymmetries, causing spreading of optical pulses.
Chromatic dispersion is the result of the wavelength dependence of the group velocity v
g
.
The most commonly used chromatic dispersion parameter is D, defined as
=
1
=−
2
(1)
Where c is the velocity of light in vacuum, is the wavelength and β
2
is the Group Velocity
Dispersion parameter (GVD).
The reason for defining the dispersion in this way is that D is the temporal pulse
spreading t per unit bandwidth per unit distance travelled, commonly reported in
ps/nm km form optical fibers. D is generally used to indicate the amount of dispersion in
fiber specifications. If D is less than zero, the medium is said to have positive dispersion and
if D is greater than zero, the medium has negative dispersion.
There are two sources of chromatic dispersion: material dispersion and waveguide
dispersion.
Material dispersion occurs because an optical pulse emitted by a light source has a certain
spectral width. The index of refraction of a material is dependent on the wavelength, so each
frequency component travels at a slightly different speed. As the distance increases, the
pulse becomes broader as a result. Waveguide dispersion refers to differences in the signal
speed depending on the distribution of the optical power over the core and cladding in an
optical fiber.
Material dispersion and waveguide dispersion have opposite effects (see Figure 1) and due
to the difference of signs, there is a lambda (λ
ZD
) for which the chromatic dispersion
coefficient is zero.
Fiber manufacturers can manipulate these effects to change the location and slope of the
chromatic dispersion curve so it is possible to shift the zero dispersion wavelength to the
1.5-μm region (C band).
All fibers with λ
ZD
near to 1550 nm are called dispersion-shifted Fibers (DSF) and fibers
with λ
ZD
outside C band are called non-zero dispersion shifted (NZ-DSF). Figure 2 shows
the dispersion curves for different models of optical fiber.
Effects of Dispersion Fiber on CWDM Directly Modulated System Performance
57
Fig. 1. Chromatic dispersion curve
Fig. 2. Dispersion coefficients for different types of fibers.
For wavelengths longer than the zero dispersion wavelength (λ
ZD
), called anomalous
dispersion region, the rate of change of the index of refraction with respect to the
wavelength changes sign, in which case high frequency components travel faster than the
lower ones, and the pulse becomes negatively chirped or down-chirped, decreasing in
frequency with time.
By the other hand, if a light pulse is propagated through a normally dispersive medium
(for wavelengths no longer than the zero dispersion wavelength) the result is the higher
frequency components travel slower than the lower frequency components. The pulse
therefore becomes positively chirped or up-chirped, increasing in frequency with time.
ZD
Material
Total
Waveguide
Wavelength (nm)
Optical Fiber Communications and Devices
58
3. The effect of dispersion on directly modulated systems
Currently DML transmitters are used to build low-cost optical communication architectures.
A block diagram of the externally modulated transmitter is illustrated in Fig. 3, in contrast
with directly modulated transmitter, in Figure 4. It consists of a bit random generator, which
determines the sequence of bits, a
k
, that will be sent to an electric pulse generator, with NRZ
format, which injects a modulation current, I(t) to a Mach-Zehnder modulator. The CW
Laser output port is connected to the Mach-Zehnder Modulator.
In both cases, the injected laser current is given by the expression:
() ( )
bkp
k
It I aI t kT
(2)
where I
b
is the bias current, T is the period of the modulation pulse, the sequence of bits
transmitted (a
k
= 1 (0) if a binary one (zero) is transmitted during the k
th
time), and I
p
(t) is
the applied current pulse.
k
a I(t) P(t)
Fig. 3. Block diagram of the externally modulated transmitter
Ip (t)
k
a I(t) P(t)
Fig. 4. Block diagram of the directly modulated transmitter
0100110011100
0100110011100
Effects of Dispersion Fiber on CWDM Directly Modulated System Performance
59
In an externally modulated laser, the optical power output pulse of the laser, P(t), is given by
0
() . . ( )
kp
k
h
Pt aI t kT
q
(3)
where
0
is differential quantum efficiency of the laser, h the photon energy at the optical
frequency , q is the charge of an electron and Ip(t) the applied current pulse.
However, expression (3) is not applicable in case of directly modulated sources where the
injected current that modulates the laser introduces a shift in the emission frequency (chirp
frequency). As a consequence, the optical power output pulse is not a linear transformation of
the applied current pulse.
The optical power and chirping response of the semiconductor laser to the current
waveform I(t) is determined by means of the large-signal rate equations [Tomkos 2001b],
which describe the interrelationship of the photon density, carrier density, and optical phase
(t), within the laser cavity.
Thus, the emission frequency associated with the output of the laser (chirp) can be
formulated by:
1
()
2
d
t
dt
(4)
where is the optical phase, which variation with the time depends on
0
11
[()]
2
gt
p
d
va n n
dt
(5)
n
t
represents the carrier density at transparency, the line-width factor or Henry's factor,
the confinement factor, g the group velocity, a
0
the gain coefficient, and
p
is the photon
lifetime.
To analyze the interaction of dispersion with the chirp generated in directly modulated
systems we initially study systems where pulse have got Gaussian shapes and finally pulses
with others forms.
3.1 Gaussian pulses
Even though the shape of optical pulses representing 1 bits in a bit stream is not necessarily
Gaussian, one can gain considerable insight into the effects of fiber dispersion by focusing
on the case of a chirped Gaussian pulse with the input field.
In Fig. 5 the pulse chirp and optical phase, is plotted together with the pulse intensity. As it
can be seen quadratic changes in the optical phase corresponds to linear frequency
variations, for this reason, such pulses are said to be linearly chirped [Agrawal 2010].
In a linear chirp, the instantaneous frequency f(t ) varies linearly with time:
f(t) = f
0
+ Ct (6)
Optical Fiber Communications and Devices
60
(a) Pulse intensity and optical phase (b) Pulse intensity and chirp
Fig. 5. Pulse intensity, optical phase and chirp in an optical Gaussian pulse.
where f
0
is the starting frequency (at time t = 0) and C is the rate of frequency increase or
chirp rate. In a chirp-free Gaussian pulse, the optical frequency remains constant
throughout the pulse, as shown in Figure 6a, whereas an up-chirp (down-chirp) pulse
means that the instantaneous frequency rises (decreases) with time (Figures 6b and 6c).
(a) Chirp-free gaussian pulse (b) Up-chirped pulse (c) Down-chirped pulse
Fig. 6. Pulse intensity, optical phase and chirp for Gaussian opical pulses.
3.2 Non Gaussians optical pulses
In directly modulated sources, optical pulses are often non-Gaussian and may exhibit
considerable chirp caused by carrier-induced changes in the mode index.
Pulse
intensity
Optical
phase
Pulse
intensity
Chirp
Effects of Dispersion Fiber on CWDM Directly Modulated System Performance
61
In these cases, the chirp is not linear and therefore can not be characterized by the value of
the chirp rate constant (C) and it can be calculated from the following expression [Coldren
1995]
1() () ()
()
4() ()
pn
dP t P t n t
t
Pt dt Pt
(7)
This equation evaluates the chirp for Fabry-Perot semiconductor laser, but is used as a good
approximation for DFB lasers [Morgado 2003]. By the other hand, this expression can be
simplified whenever working with modulation frequencies above 100 MHz, then comes to a
new equation that depends on two laser intrinsic parameters: the adiabatic chirp coefficient
(κ) and the Henry factor (α ).
1()()
()
4()
p
dP t P t
t
Pt dt
1()
()
4()
dP t
Pt
Pt dt
(8)
The
adiabatic coefficient, κ, depends on the laser structure, being the figure that takes into
account the output power and the generated chirp. The relationship to the photon energy,
h, optical frequency, υ, laser quantum efficiency,
0
, confinement factor, , cavity volume,
V
0
and gain compression factor, , is in agreement with the expression:
0
2
a
hV
(9)
Its units of measurement are (W S)
-1
and takes values around 10
12
.
Henry factor, normally called linewidth enhancement factor, quantify the effect of the
change of refractive index with carrier density on the dynamical properties of
semiconductor lasers, [Henry 98]
/
4
/
r
i
N
dn
Nd
g
(10)
where n is the refractive index, g is the gain per unit length, is the wavelength and N is the
carrier density.
A lot of experiments have reported a great variety of values for the α -factor ranging from 0
to values of the order of those commonly observed in bulk and quantum well materials (1.5-
3). Larger values for the α -factor than those published for quantum well devices have also
been reported and a value for α as high as 60 has been published.
The first term of (8), called transient chirp, causes variations in the pulse width and is
scaled by α. The second term (adiabatic chirp) produces a frequency shift proportional to
the instantaneous optical power, and scaled, in addition to α, by parameter κ [C.del Rio
2008]. Figure 7 shown two types of chirp in DML. We can observe a transient chirp
corresponds to the chirp that occurs during the transition between steady states and an
adiabatic chirp corresponds to the frequency offset between steady state output powers of
the laser.
Optical Fiber Communications and Devices
62
(a) Optical pulse
(b) Adiabatic chirp DML-A
(c) Transient chirp DML-T
Fig. 7. Optical pulses shapes (a) and chirp in an adiabatic (b) and transient (c) dominated
laser.
Depending on the term in equation 8 that predominate over the other DMLs can be
classified as transient (DML-T) or adiabatic (DML-A) chirp dominated. This terminology
was first used the Hinton by 1993 [Hinton 93].
Effects of Dispersion Fiber on CWDM Directly Modulated System Performance
63
Each extreme category has significantly different optical spectra. DML-T lasers have higher
bandwidths to DML-A, as shown in Figure 8.
(a) DML-T (b) DML-A
Fig. 8. Spectrum of transient chirp dominated (a) and adiabatic chirp dominate laser (b)
Besides the difference in the spectral width, is observed in lasers DML-T that the emission
peak is centered at the nominal frequency of emission, which corresponds to the peak
frequency during continuous vawe transmission (Figure 8a). However, the laser DML-A there
are two different frequency peaks corresponding to carrier frequencies of the bits "1" and "0"
(Figure 8b). The separation between the wavelengths of the carriers of bits 0 and 1 is directly
related to the adiabatic chirp of the signal and, therefore, depends on the output power.
Figure 9 represents the chirp of bit "1" when the output power varies from 0.1 to 15 mW. As
can be seen, the higher the laser emission power the higher the adiabatic chirp generated. In
this particular case, the peak-to-peak chirp generated when the value of output power is 0.1
mW is 8 GHz and 35 GHz if the power change to 15 mW.
(a) Chirp (b) Spectrum
Fig. 9. Chirp (a) and spectrum (b) for 10 output power DML for 0.1 to 15 mW
The frequency chirp, due to the adiabatic chirp and shown in Figure 9a, implies a shift in the
wavelength emission, as it shown in Figure 9b. This optical frequency shift from the actual
laser output frequency is the principal cause of system performance limitations.
“1”
15 mW
0.1mW
“1” =15 mW
“1” =10 mW
“1” =5 mW
“1” =0.1
mW
“0”
“1”
“0”