Optical Fiber Communications and Devicesan incorrectly Part 5 pot
Bạn đang xem bản rút gọn của tài liệu. Xem và tải ngay bản đầy đủ của tài liệu tại đây (1.63 MB, 25 trang )
Design and Application of X-Ray Lens in the Form of
Glass Capillary Filled by a Set of Concave Epoxy Microlenses
89
Energy, keV
12 12
Size of slit #1, mm
2
1 x 1 0.1 x 0.1
Measured image distance, mm 146 147
Calculated image distance, mm 147 147
Calculated lens focal length f
t
, mm 145 145
Measured horizontal focal size, µm 10.4 4.1
Measured vertical focal size, µm 2.2 1.7
Gain 34/31 113/18
Transmission 9.5% 9.5%
Table 4. Parameters of spherical compound X-ray lens for 12 keV X-rays
Energy, keV
14 14
Size of slit # 1, mm
2
1 x 1 0.1 x 0.1
Measured Image distance, mm 195 196
Calculated image distance, mm 195 195
Calculated lens focal length f
t
, mm 192 192
Measured horizontal focal size, µm 12.2 6.3
Measured vertical focal size, µm 3.0 2.1
Gain 43/40 162 /22
Transmission 21.5% 21.5%
Table 5. Parameters of spherical compound X-ray lens for 14 keV X-rays
2.5 X-ray imaging with compound refractive X-ray lens
X-ray imaging is a power tool to study inner structure of objects and materials. This method
is realised with synchrotron and laboratory X-ray sources. A well-known in-line laboratory
X-ray projection microscopy and microtomography is based on the using of microspot X-ray
tube as a source of radiation. The system for imaging consists of a quasi-point X-ray source
and a CCD-camera. The object for investigation is placed at a distance R
1
from the source,
and the CCD-camera is placed at a distance R
2
from the sample. The spatial resolution of the
method depends on the source size and is in range from 5 to 1 microns. The magnification is
determined as (R
1
+ R
2
)/ R
1
and may be 10 or higher. The disadvantage of the method of
direct imaging is that the position of the point X-ray source is not stable in time. This
disadvantage is remedied by using imaging optics for microscopy. There are some types of
imaging X-ray optics: pin-hole, zone plate and compound refractive X-ray lens. We used
previously discussed microcapillary refractive X-ray lens as an imaging device. In this case
there is no limitation to the source size and ordinary X-ray tubes may be used.
The optical scheme of the system for imaging with refractive X-ray lens is shown in Fig.10.
The object for imaging 3 is exposed by X-rays from X-ray tube 1. The lens 2 forms decreasing
Optical Fiber Communications and Devices
90
Fig. 10. Schematic of X-ray imaging with refractive lens. 1- X-ray source (tube); 2- compound
refractive X-ray lens; 3- object; 4- source image; 5- object image.
image of the X-ray tube focal spot 4 and increased image of the object 5. X-ray CCD-camera
is placed at the position of object image. The object, lens and CCD-camera are placed in-line
at distances from one another that satisfied the lens formula:
11 1
ab f
, (19)
where a is the distance from the object to the lens; b is the distance from the lens to CCD-
camera; and f is the lens focal length.
The imaging system (microscope) was designed in the Institute of Applied Physics Problems
of Belarus State University (Dudchik et al., 2007b; Dudchik et al. 2007c). The system photo is
shown in Fig. 11. The microscope consists of X-ray tube 1, X-ray lens 2 in a holder and
goniometer 5, CCD X-ray camera 3. The object for imaging 4 is place between the X-ray tube
and the lens.
Fig. 11. X-ray microscope. 1- X-ray tube; 2- X-ray lens in a holder; 3- CCD X-ray camera; 4 –
object for imaging; 5- goniometer for X-ray lens.
A water-cooled copper-anode X-ray tube (Russian model # BCV-17) with tube focal spot of
0.6 mm x 8 mm was used as a source of X-rays.
Design and Application of X-Ray Lens in the Form of
Glass Capillary Filled by a Set of Concave Epoxy Microlenses
91
The image of the object was recorded by a Photonic Science camera (model FDI VHR) with
4008 x 2670 pixels, and 4.5 microns pixel size.
The X-ray lens used for imaging consists of 161 individual spherical, biconcave, microlenses,
each with 50-microns curvature radius R. The CRL length is equal to 18 mm. The lens photo
is shown in fig. 12. The lens focal length, calculated in accordance to the formula 5, is equals
to 41 mm for 8 keV X-rays.
Gold meshes #1000 with 5
m wires separated by 20.4
m was used as object for imaging.
Fig. 12. Photo of microcapillry refractive X-ray lens with 161 concave spherical microlenses
inside of glass capillary
The tube voltage was set to 20 kV and the current -14 mA, resulting in a standard
bremsstrahlung and 8 keV characteristic-line spectra from the tube without filtering. The
mesh was placed at distance a= 45 mm to the lens. The X-ray CCD-camera was placed a
distance b= 440 mm to the lens in according to the lens formula (19), magnification M=b/a=
9.8. Fig.13 shows images of mesh #1000 recorded by the CCD-camera at different exposition
equals to 5 min and 7 min.
a)
b)
Fig. 13. X-ray image of mesh # 1000 at magnification 9.8. a) 5 min exposition time; b) 7 min
exposition time
As it can be seen from Fig. 13, 5
m gold wires of mesh #1000 are recognized by the CCD-
camera, which means the spatial resolution of the simple X-ray imaging system is not worse
than 5
m. In according with calculations of lens parameters, presented in Table 1 and Table 2,
Optical Fiber Communications and Devices
92
better spatial resolution may be achieved by using monochromatic X-rays and diaphragm to
decrease spherical aberrations.
To improve spatial resolution of the system imaging experiments were accomplished on the
National Synchrotron Radiation Laboratory (China) (Dudchik et al., 2010). The experiments
were done on X-ray diffraction and scattering beamline (U7B). Synchrotron radiation (SR)
from the Wiggler source was focused by a toroidal mirror. Focused SR was monochromized
with a double-crystal monochromator and selected photon energy was 8 keV. The optical
scheme of the experiments was the same as is shown in Fig. 10. The only difference was that
the torroidal mirror was placed between X-ray source and the lens. Microcapillary X-ray
lens in the form of glass capillary filled by 147 concave epoxy microlenses with 50 microns
curvature radius each was used. The lens focal length is equal to 45 mm. Gold mesh #1500
with 5.5 microns wires were used as an object for imaging. Fig.14 shows images of gold
mesh #1500 obtained with 8-keV monochromatic synchrotron X-rays at magnification
M=11.6 (a) and M=18.6 (b).
a)
b)
Fig. 14. X-ray images of mesh #1500 obtained with 8-keV monochromatic synchrotron X-
rays at magnification M=11.6 (a) and M=18.6 (b).
Comparing images of gold mesh shown in Fig. 13 and Fig. 14 we may conclude that using
monochromatic X-rays give significant improvement of spatial resolution of the system.
In conclusion, imaging experiment shows that the spherical compound refractive lens is a
promising imaging optical element for hard x-rays, giving better than 2- 5
m spatial
resolution.
3. Conclusion
We have fabricated and tested compound refractive lenses (CRL) composed of micro-
bubbles embedded in epoxy. The bubbles were formed in epoxy inside glass capillaries. The
interface between the bubbles formed spherical bi-concave microlenses. The lenses were
named as microcapillary refractive lenses or “bubble lenses”. When compared with CRLs
manufactured using other methods, the micro-bubble lenses have shorter focal lengths with
higher transmissions for moderate energy X-rays (e.g. 7 – 12 keV). The lenses were tested at
the Stanford Synchrotron Radiation Laboratory (SSRL) and ANKA Synchrotron Source. We
used beamline 2-3 at the SSRL to measure focal lengths between 100-150 mm and absorption
apertures between 90 to 120 m. Transmission profiles were measured giving, for example,
Design and Application of X-Ray Lens in the Form of
Glass Capillary Filled by a Set of Concave Epoxy Microlenses
93
a peak transmission of 27 % for a 130-mm focal length CRL at 8 keV. The focal-spot sizes
were also measured yielding, for example, an elliptical spot of 5 x 14-m
2
resulting from an
approximate 80-fold demagnification of the 0.44 x 1.7 mm
2
source. Experiments at ANKA
Synchrotron Source shown that the designed lens with 145 mm focal length focuses 12 keV-
rays into 2.2 X 10.4-m
2
spot.
The lenses are imaging device and may be used as objective for X-ray microscope. A simple
microscope consisting of the X-ray tube, microcapillary refractive X-ray lens and X-ray
CCD-camera was designed at the Institute of Applied Physics Problems of Belarus State
University. The X-ray lens consists of 161 individual spherical, biconcave microlenses, each
with 50-microns curvature radius. The lens focal length is equals to 41 mm for 8 keV X-rays.
It was shown that the spatial resolution of the microscope is better than 5 microns when
unfiltered X-ray beam from cupper anode X-ray tube is used. Better spatial resolution (about
2-3 microns) was obtained in the experiments on the National Synchrotron Radiation
Laboratory’s (China) were monochromatic 8-keV X-ray beam was used.
The micro-bubble technique opens a new opportunity for designing lenses in the 8-9 keV
range with focal lengths less than 30-40 mm.
4. Acknowledgment
I would like to acknowledge my colleague Dr. N.N. Kolchevsky, who spent a lot of time to
improve parameters of the microcapillary lenses when he was PhD student in the Institute
of Applied Physics Problems of Belarus State University. I would like to acknowledge my
colleagues Dr. M.A. Piestrup, Dr. C.K. Gary, Dr. J.T. Cremer from Adelphi Technology, Inc.,
who did a lot of experiments on testing microcapillary lenses for focusing and imaging with
synchrotron and laboratory X-ray sources. Prof. T. Baumbach and Dr. R. Simon were so kind
to invite me for taking part in experiments on focusing X-rays at ANKA Synchrotron
Radiation Source. Prof. Zhanshan Wang, Dr. Baozhong Mu, Dr. Chengchao Huang, Prof.
Guoqiang Pan invited me to take part in imaging experiments with microcapillary lenses at
the National Synchrotron Radiation Laboratory (China). I am grateful to all of them for
continues interest to this research and useful comments.
5. References
Born, M. & Wolf, E. (1975). Principles of Optics. 5
th
edition, Pergamon Press, Elmsford, New
York.
Dudchik, Yu.I. & Kolchevsky, N.N. (1999). A microcapillary lens for X-rays. Nucl. Instr. and
Meth. A 421, pp. 361-364.
Dudchik, Yu.I.; Kolchevsky, N.N.; Komarov, F.F.; Kohmura, Y.; Awaji, M.; Suzuki, Y.&
Ishikawa, T. (2000). Glass capillary X-ray lens: fabrication technique and ray tracing
calculations. Nucl. Instr. Meth. A, 454, pp.512-519.
Dudchik, Yu.I.; Kolchevsky, N.N.; Komarov, F.F.; Piestrup, M.A.; Cremer, J.T.; Gary, C.K.;
Park, H. & Khounsary, A. M. (2004). Microspot x-ray focusing using a short focal-
length compound refractive lenses. Rev. Sci. Instr., 75, N.11, pp.4651-4655.
Dudchik, Yu.I.; Simon, R.; Baumbach, T. (2007a). Measurement of spherical compound
refractive X-ray lens at ANKA synchrotron radiation source. Proceedings of the 8-
Optical Fiber Communications and Devices
94
th International conference “Interaction of radiation with solids”. 26-28 September
2007, Minsk, Belarus . P. 239-241.
Dudchik, Yu.I.; Komarov, F.F.; Piestrup, M.A.; Gary, C.K.; Park, H.& Cremer, J.T. (2007b) .
Using of a microcapillary refractive X-ray lens for focusing and imaging.
Spectrochimica Acta, 62B, pp. 598–602.
Dudchik, Yu.I., Gary, C.K.; Park, H.; Pantell, R.H.; Piestrup, M.A. (2007c). Projection-type X-
ray microscope based on a spherical compound refractive X-ray lens. Advances in
X-Ray/EUV Optics and Components II, edited by Ali M. Khounsary, Christian
Morawe, Shunji Goto, Proc. of SPIE Vol. 6705, pp. 670509-1 – 670509-8.
Dudchik, Yu.I.; Huang, C.; Mu, B.; Wang, Z. & Pan, G. (2010). X-ray microscopy with
synchrotron source and refractive optics. Vestnik Belorusskogo Universiteta.
Physics, Mathematics, Informatics. #2., pp. 24-28.
Kohmura, Y.; Awaji, M.; Suzuki, Y.; Ishikawa,T.; Dudchik, Yu.I.; Kolchevsky, N.N.&
Komarov, F.F. (1999). X-ray focusing test and X-ray imaging test by a
microcapillary X-ray lens at an undulator beamline. Rev. Sci. Instr., 70, No.11, pp.
4161-4167.
Kumakhov, M. & Sharov, V. (1992). A neutron lens. Nature 357, pp. 390-391.
Pantell, R.H.; Feinstein, J.; Beguiristain, H.R.; Piestrup, M. A.; Gary, C.K. & Cremer, J.T.
Characteristic of the thick compound refractive lens. Applied Optics, Vol. 42, pp.
719-724.
Piestrup, M.A.; Gary, C.K.; Park, H. ; Harris, J.L.; Pantell, R.H.; Cremer, J.T.; M. A. Piestrup,
C. K. Gary, H. Park, J. L. Harris, J. T. Cremer, R. H.; Dudchik, Yu.I.; Kolchevsky,
N.N.& Komarov, F.F. (2005). Microscope using an x-ray tube and a bubble
compound refractive lens. Appl. Phys. Lett. 86, pp. 131104-1- 131104-4 .
Lengeler, B.; Schroer, C. G.; Kuhlmann, M.; Benner, B.; Günzler, T. F.; Kurapova, O.;
Zontone, F.; Snigirev, A. & Snigireva, I. Refractive x-ray lenses. (2005). J. Phys. D:
Appl. Phys. 38, pp. A218-A222.
Snigirev, A.; Kohn, V.; Snigireva, I. & Lengeler, B. (1996). A compound refractive lens for
focusing high-energy X-rays. Nature, Vol. 384, N.6604, pp.49-51B.
Thiel, D.J.; Bilderback, D.H.; Lewis, A.; Stern, E.A. & Rich, T. (1992). Guiding and
concentrating hard x-rays by using a flexible hollow-core tapered glass fiber.
Applied Optics, Vol. 31, Issue 7, pp. 987-992.
5
2 Terabit Transmission over Installed
SMF with Direct Detection Coherent WDM
Paola Frascella and Andrew D. Ellis
Photonics System Group, Tyndall National Institute
& Department of Physics, University College Cork
Ireland
1. Introduction
The way people communicate has continued to evolve in the last decade; information is
becoming more visual and digital. Every message exchanged between people is highly
likely to be accompanied by high-definition photos or video and transported over long
intercity distances. This is the era of Visual Networking (Cisco white paper, 2011a), where
social networking websites dominate the market and image based content is increasingly
user-generated using advanced personal mobile devices. In 2010, 14.3 petabytes (10
15
bytes)
of mobile/wireless traffic were offloaded onto the fixed network each month. Driven in part
by the increase in devices and the capabilities of those devices, there will be two networked
devices per capita in 2015, up from one networked device per capita in 2010, resulting in a
32% compound annual growth rate (CAGR) of the total (fixed plus mobile) internet traffic.
On a long term scale (e.g. the last ten years), the CAGR has been approximately 19% and the
total number of internet users grew from 361 million in Dec 2000 to 2,095 million in March
2011 (www.internetworldstats.com, 2011). Moreover, as telecom technology is deployed in
emerging economic powers including Brazil, India and China and is seen by the World Bank
as the key to economic independence in sub-Saharan Africa and other areas of the
developing world (Reuters, 2010a and 2010b), the exponential growth of global internet
traffic will continue, reaching a capacity of one zettabyte (10
21
) per month shortly after 2015
(Cisco white paper, 2011b).
The deployed networks mostly use standard single-mode fibres (SMF), which support a
single propagating mode, and erbium doped fibre amplifiers (EDFAs) for data transport.
The fibre is installed undersea, underground and even sometimes running in the air-
suspended from overhead cables. Optical fibre is dominant in submarine, long haul and
metropolitan area networks, and is beginning to dominate high-performance access
networks. The demand for high-capacity data transmission over the installed fibre networks
is evident. Innovative solutions to support the continuing increase in capacity currently falls
into two alternative approaches: one focuses on direct physical changes to the network to
enable the transport of significantly higher capacities, the second on how to transmit more
capacity on the existing deployed networks. The first direction involves the study of new
optical fibres for more efficient transport of information (Zhu et al., 2011), and new network
architectures, essentially allowing the replacement of electrical switches with optical
Optical Fiber Communications and Devices
96
implemented alternatives (Dunne et al., 2009). Such a radical change in the network will be
adopted when the proposed upgrade to a new fibre and/or a new architecture will offer the
network operator groundbreaking improvements, enabling increases in revenue generation
above the upgrade cost. The second approach, a more short-term solution, enables moderate
upgrade for an immediate satisfaction of the capacity demand, in contrast to the introduction of
novel technologies which often require long terms and high investments. In this chapter we
focus on a solution within the second approach, providing increased capacity over existing
infrastructure at minimum cost and complexity.
In its original form, Ethernet combines low implementation cost, high reliability and relative
simplicity of installation to become the de facto local area network standard. Ethernet has
evolved and adapted to meet the increasing bandwidth demands of end-users. The latest
variants, 40 and 100 Gigabit Ethernet (GbE) were recently standardised by the IEEE data
transport applications over both copper and optical fibre. Other enhancements, such as the
support for operations, administration and maintenance (OAM) functionality, have
contributed to the emergence of Carrier-Class Ethernet as the dominant transport technology
in telecommunication networks. Today it is safe to assume that nearly all internet traffic starts
and ends with an Ethernet connection. With zettabyte data volumes the server farms, used to
host and distribute Visual Networking services, require low cost ultra high-capacity intra and
inter-data centre connections. Indeed recent requests for Terabit Ethernet (Lee, 2011; Lam et al.,
2010) have motivated the work that we will present in this chapter.
In parallel, dual polarisation quadrature phase shift keying (DP-QPSK) was developed for
telecom applications (ITU-T G.709/Y.1331) for the transport of Ethernet without recourse to
inverse multiplexing. The spectral resource (the optical fibre bandwidth) is already highly
shared through wavelength division multiplexing (WDM) in current networks, and will
need to implement high-spectral efficiency techniques in order to carry Terabit Ethernet
data in the future. It is widely accepted that multicarrier systems, such as Coherent WDM
(CoWDM) and other variants of optical Orthogonal Frequency Division Multiplexing
(OFDM), are strong candidates for Terabit Ethernet (TbE) transmission over metro area
networks (10-300 km) (Sanjoh et al., 2002; Ellis & Gunning, 2005; Lowery et al., 2006; Shieh &
Authaudage, 2006; Djordjevic & Vasic, 2006; Jansen, 2007; Goldfarb et al., 2007; Chen, H. et
al., 2009; Hillerkuss et al., 2011; Zhao & Ellis, 2010). With these techniques, in order to
achieve Tbit/s capacities individual WDM channels are further expanded into bands, each
containing many orthogonal subcarriers. Orthogonality opens the possibility to transmit
higher capacities with reduced cost per bit, without recourse to disruptive network
upgrades. Emerging grid-less reconfigurable add-drop multiplexers (ROADMs) (Poole et
al., 2011), which are beginning to dominate the market (www.infonetics.com, 2011), in
combination with flexible multicarrier solutions offer high capacities in the Tbit/s region
and increase the network efficiency (Thiagarajan et al., 2011; Christodoulopoulos et al., 2011;
Takara et al., 2010; Bocoi et al., 2009). For a single carrier m-QAM solution, the required
optical signal-to-noise ratio increases more rapidly than the capacity increases. In contrast,
multi-carrier solutions, such as all-optical OFDM and CoWDM, do not suffer from this
limitation and allow for very flexible and scalable total transmitted capacities.
Multicarrier solutions, which meet growing capacity requirements, must offer compatibility
with Ethernet. Moreover cost-effective implementations are essential, especially for short
network connections as in financial institutions and data centre providers. CoWDM is a
2 Terabit Transmission over Installed SMF with Direct Detection Coherent WDM
97
promising candidate for future high-speed Ethernet transport. In this Chapter we transmit
Ethernet packets and implement forward error correction (FEC), showing how this
determines the system performance. We identified critical clock stability issues unique to
multicarrier systems (Frascella et al., 2010b) and demonstrated the impact on the system
design of the more stringent BER of an Ethernet client(Frascella et al., 2010a). In segments of
the network where high capacity is needed at the lowest cost, direct detection could be used
to avoid the cost, complexity and power consumption of digital coherent receivers. In this
chapter, we consider the field transmission of a 2 Tbit/s multibanded direct detection
CoWDM signal over installed SMF, first using EDFA amplification only (Frascella et al.,
2010c), and then use Raman amplification to enhance the potential reach (Frascella et al.,
2011). Mixed Ethernet (with FEC) and PRBS payloads are used to study both the Ethernet
transmission and the performances against fibre impairments of the optical multiplexing
format. Fourtynine subcarriers were measured with pre-FEC bit error ratio (BER)
performance lower than 10
-5
and post-FEC frame-loss ratio (FLR) below 10
-9
for Ethernet
transmission over unrepeatered 124 km of SMF. Outage probability due to polarisation mode
dispersion (PMD) is estimated from BER measurements extended over several hours,
showing the robustness of CoWDM format. The reach of direct detected 40 Gbaud Terabit
capacities is predicted for single-mode fibre based systems as a function of the amplifier
spacing, suggesting that CoWDM is suitable for Terabit Ethernet transport over metropolitan
links, reaching 1,400 km at spacing of 80 km and up to 130 km unrepeatered transmission.
2. High-capacity transmission over installed SMF
In laboratories, the total capacity and the spectral efficiency have drastically grown thanks
to the introduction of higher modulation formats and digital coherent detection. In March
2011, records were achieved of 101 Tbit/s and 11 bit/s/Hz in a single-mode single-core
optical fibre using coherent detection by (Qian et al., 2011). However, there are no scientific
reports of higher-capacity field results than the 3.2 Tb/s demonstrated in early 2001 (Chen
D. et al., 2001), which was achieved with 80 standard WDM channels carrying 40 Gbit/s
NRZ-OOK spaced at 100 GHz across the L and C-band with Raman amplification and FEC
over 3 spans of 82 km long SMF. The highest spectral efficiencies with high-capacity are
achieved with orthogonal multiplexing, both in laboratory (Qian et al., 2011) and field
experiments (Frascella et al., 2010c; Xia et al., 2011), although other techniques (e.g. based on
pre-filtering) also allow high spectral efficiencies (Gavioli et al., 2010; Roberts, 2011). Multi-
band transmission with orthogonal multiplexing over field deployed fibre started in 2010
where 759 Gbit/s total capacity was achieved with off-line processed coherently detected
DP-QPSK-OFDM and information spectral density (ISD) of 2.35 bit/s/Hz (assuming the use
of 7% FEC overhead) over a total of 764 km of SMF (Dischler et al., 2010). 2 Tb/s capacity
with orthogonal multiplexing was first achieved in 2010 using real time direct detection
(Frascella et al., 2010c) and then in 2011 offline coherent detection (Xia et al., 2011). The reach
and the ISD (respectively, 0.7 bit/s/Hz/pol and 3 bit/s/Hz) were determined by the
repeater spacing and receiver complexity.
2.1 Coherent WDM (CoWDM)
Coherent WDM is an all-optical implementation of OFDM where phase control of adjacent
subcarriers is exploited to minimise inter-subcarrier crosstalk interference arising from non-
Optical Fiber Communications and Devices
98
ideal orthogonally-matched filters (or demultiplexing of orthogonal subcarriers). OFDM
itself is a specific implementation of orthogonal systems developed in the 1950s (Mosier &
Clabaugh, 1958) and extensively studied in the 1960s (Deman, 1964; Chang, 1966; Ito &
Yokoyama, 1967; Zimmerman, 1967), where similarly to orthogonality condition kept in the
time domain to avoid inter-symbol interference (ISI) there is an orthogonality condition in
the frequency domain to avoid inter-channel crosstalk interference (Proakis & Salehi, 2008).
This condition may be expressed as:
() ()
() ()
.
**
0
Th
kj kj
Ek j
X f X f df x t x t dt
kj
+∞ +∞
−∞ −∞
=
==
≠
(1)
where the first equality is Parseval’s theorem,
()
2
k
Extdt
+∞
−∞
=
is the energy of the signal
x
k
(t) of the k-th channel and X
k
(f) its spectrum (and Fourier transform). If we consider the
signal waveforms only to differ in frequency, then the orthogonality condition in Eq. 1
introduces a condition on the signal spacing. OFDM is a particular case of orthogonal
system, where the spacing between frequencies is equal to the symbol rate (1/T):
2
kj
T
ωω π
−=
(2)
Various flavours of orthogonal systems have been proposed, including half of the symbol
rate (Chang, 1970; Rodrigues & Darwazeh, 2002; Zhao & Ellis, 2010), or close
approximations to Eq. (2) (Yamamoto et al., 2010). Whilst all of these systems satisfy the
orthogonality condition and may thus be strictly classified as Orthogonal FDM systems, for
the last decade (2002-2011) the terminology “OFDM” has been understood to apply to
systems with very low inter-subcarrier crosstalk satisfying Eq. 2, and implemented using
Fourier Transforms (Weinstein & Ebert, 1971).
Orthogonally multiplexed multicarrier systems were first proposed for long-haul optical
systems in 2002 (Sanjoh et al., 2002), when OFDM was already standardised for DAB HDTV
and UMTS. Later on, different varieties were proposed by (Ellis & Gunning, 2005; Feced et
al., 2005; Lowery et al., 2006; Djordjevic & Vasic, 2006; Shieh & Authaudage, 2006), and
extensively studied in laboratory experiments (Jansen et al., 2008a, 2008b; Shieh et al., 2008;
Yonenaga et al., 2009; Sano et al., 2007, 2009; Chandrasekhar et al., 2009; Liu et al., 2009;
Schmogrow et al., 2011).
CoWDM derives from the concept that at high symbol rates the orthogonality condition is
only maintained if the optical phases (
φ
k,j
=dω
k,j
/dt) of the subcarrier k and j are constant,
and aligned to ensure that any residual crosstalk is distributed away from the eye crossing.
When CoWDM was first simulated (Ellis & Gunning, 2005), patented (Ellis et al., 2009b) and
experimentally verified (Ellis & Gunning, 2005; Gunning et al. 2005; Healy et al., 2006) it was
clear that the phase control of each subcarrier, implemented at the transmitter, could ensure
orthogonality (reduced BER penalty) by using commercially available modulators and
photodiodes with bandwidths comparable to the symbol-rate, rather than the full system
capacity, as required for DSP based OFDM (Lowery, 2010). It has been recently been
demonstrated that the advantage of phase control is correlated to the transmitter and
receiver structure (Ibrahim et al., 2010). Note that the benefit of phase control is negligible in
the case of coherently detected dual quadrature signals (Zhao & Ellis, 2011) and maximum
2 Terabit Transmission over Installed SMF with Direct Detection Coherent WDM
99
in the case of direct detection of single quadrature signals. A signal-to-residual crosstalk
ratio (SXR) for OOK signals has been defined (Ibrahim et al., 2010), as the ratio between the
signal power in the absence of crosstalk (which corresponds to the signal power in the ‘1’
bits) and the crosstalk, i.e. the sum of the crosstalk in ‘1’ bits and ‘0’ bits. Taking into account
only the crosstalk interference coming from the adjacent subcarriers (j+1 and j-1) and
assuming no ISI, the SXR for direct detected OOK signals is:
() () () () ()
()
() ()
()
() ()
()
222
,1,1,1,, 1
1, , 1 1, 1, 1 1
02 0 0 00cos
0 0 cos 2 0 0 cos
dd jj jj jj jj jj j j
jj jj j j jj jj j j
SXR x x x x x
xx xx
φφ
φφ φ φ
−+− −
++−+−+
=++−+
+−+ −
(3)
where x
k,j
(0) is the baseband representation at the sampling instant of the signal pulse shape
for the k-th subcarrier (corresponding to a frequency spectrum H
Tx
) after optical filtering,
demultiplexing and electrical filtering (all included in the frequency response H
Rx
) targeted
to the subcarrier j:
()
()()
,
1
2
jt
kj Tx k j Rx j
xt H H ed
ω
ωω ω ωω ω
π
+∞
−∞
=−++
(4)
The cosine terms represent the phase of the beats between all the three subcarriers j-1, j and
j+1, which pass through the optical filter. From Eq. (3) is evident that by controlling the
phase difference between adjacent subcarriers the crosstalk could be minimised (or
equivalently the SXR maximised) by setting the CoWDM phase condition:
1
2
jj
π
φφ
−
−=
(5)
CoWDM and in general all-optical OFDM are not only robust against dispersion and
nonlinearities (Ellis et al., 2009a; Healy et al., 2006; Hillerkuss et al., 2011; Sano et al., 2007;
Frascella et al., 2010b), but also remove speed limitations set by electronics as well as
linearity issues introduced during EO/OE conversions (Huang et al., 2009). All-optical
OFDM promises to achieve Terabit transport in real time, when compared to DSP-based
OFDM (Schmogrow et al., 2011; Xia et al., 2011). The ability to operate using direct
detection, and over existing dispersions maps (Ellis et al., 2009a), offers the potential for
low-cost non-disruptive upgrades making CoWDM an attractive proposition for cost
sensitive applications.
2.2 Transmission of 2 TbE with EDFA only
The experimental setup used for the field demonstration of the 2 Tbit/s CoWDM is
illustrated in Fig. 1. One 10.7 Gbit/s pseudo-random binary sequence (PRBS) with a 2
31
-1
pattern length was aggregated with three forward error correction (FEC) encoded 10 Gigabit
Ethernet (10 GbE) WAN PHY (9.953 Gbit/s) streams. The PRBS tributary was synchronised
to the FEC encoded Ethernet signal and used to monitor the system performance and
identify impairments; it was later on replaced with a fourth Ethernet stream to verify the
performance of 2 TbE. Fourtynine subcarriers were generated from seven DFB lasers using
sine wave driven amplitude modulators (Healy et al., 2007; Frascella et al., 2010b). The
Optical Fiber Communications and Devices
100
Ethernet
Tester
TX
data
data
4:1 Mux
62km SMF
mon.
Link
OSNR
mon.
mon.
PD
CRU
DFF
T
AMZI
0.64nm
RX
Phase
stabil.circuit
Polarizer
Comb
generator
MZM
dis-interleaver
PD
Tot Rx
Power mon.
T
MZM
delay
SFP+
10GbE
T
Cork
Cork
Clonakilty
62km SMF
DFB
bank
N = 7
piezo
1
T
T
T
DCM -1977ps/nm
ATT
& mon.
ATT
ATT
ATT
trimming f ibres
T
2
ED
PPG
clk out
10.7Gbit/s
clk in
T
FEC
board
Tx clk o ut
+
-
+
-
+
-
+
-
Tx
Rx
+
-
+
-
T
T
clk in
10.7Gbit/s
1:4 Demux
DFF
DCF
N
Fig. 1. Experimental setup for 2 Tbit/s transmission over 124 km of field-installed SMF
(Frascella et al., 2010b). PPG- pulse pattern generator, DFF- D-flip flop, CRU- clock recovery
unit; PD- photodiode, ED- error detector, DCM- dispersion compensating fibre.
electrically multiplexed 42.84 Gbaud signals were used to modulate the 49 CoWDM
subcarriers with NRZ-OOK, where odd and even channels modulated by data and delayed
inverted data respectively. The transmitted spectrum had a total bandwidth of 2.8 THz
(guard-bands of 85.67 GHz were introduced to minimize the interference between bands)
and transported a total of 2.1 Tbit/s, giving a spectral efficiency of 0.7 bit/s/Hz in a single
polarization after taking into account 7% FEC overhead. Inter-subcarrier phases were
controlled using an electrically driven piezo fibre-stretcher, where the optimum condition
was established by measuring the 42.6 GHz beat frequency between two adjacent subcarriers.
The capacity could have been readily doubled using polarisation multiplexing (Cuenot et al.,
2007). The fibre link, pre-compensated for chromatic dispersion, used EDFA amplification
only. The field-installed SMF was looped-back at Clonakilty to the measurement laboratory
in Cork, giving a total span length of 124 km and an associated loss of 26 dB, which is a
challenge in terms of OSNR, as it would be for all unrepeatered links of similar reach. The
total signal launch power into the SMF was found to be optimum at +16.9 dBm.
At the receiver, channel selection is performed by a passband filter of 0.64 nm bandwidth,
and a one-tap optical FFT is realised with an asymmetric Mach-Zehnder interferometer
(AMZI). After direct detection, the BER and FLR of each optical subcarrier were measured.
The BER is shown in Fig. 2, where the best (#25, 1552.74 nm) and the worst performing (#48,
1562.77 nm) subcarriers are highlighted with different symbols (Fig. 2(a)). At the maximum
received power of –12 dBm, the BER of the worst performing subcarrier (#48) was 1.3×10
-5
.
The band containing subcarrier #48 had an OSNR of 30.8 dB (Fig. 2(b)- the received OSNR is
defined per band, as the ratio of the signal power in a band (2.5 nm) over the noise power in
0.1 nm bandwidth). The best performing subcarrier (#25) achieved a BER of 3×10
-9
and an
OSNR about 1 dB higher. Fig. 3(c) shows the received eye-diagrams after optical
demultplexing for the best (#25) and worst (#48) subcarriers with the crosstalk between
adjacent subcarriers remaining minimized at the centre of the eye after transmission over
fibre.
We believe that the 6 dB difference (at 10
-5
) observed in the required OSNR between the best
and worst subcarriers can be attributed to: a) the wavelength sensitivity within the comb
2 Terabit Transmission over Installed SMF with Direct Detection Coherent WDM
101
generation module (see optical spectrum in Fig. 3 (left-axis)); b) the residual gain variation
in the optical amplifiers; c) phase errors between adjacent comb lines after transmission
(Gunning et al., 2005); and also d) polarisation mode dispersion (Frascella et al., 2010b). An
improvement of the flatness of the 49 subcarriers and the introduction of phase control for
each individual subcarrier would guarantee an equal OSNR for all subcarriers. This enables
the launch power of all subcarriers to be increased to the nonlinear threshold, therefore
improving the OSNR and BER of the worst subcarriers. The average receiver sensitivity at a
BER of 1×10
-5
across the measured sensitivities for the 49 subcarriers (filled diamonds in Fig.
3) was ~ –15.5dBm. A BER of 2×10
-15
is required to achieve a FLR of 10
-12
when transmitting
an Ethernet frame (Frascella et al., 2010a). FEC boards employing a simple Reed Solomon
RS(255,239) code (BER threshold of 1×10
-4
, dashed red line #1 in Fig. 2), as from ITU-T
G.975.1 Recommendation, will leave a system margin of 3 dB received power/OSNR.
Enhanced FEC realised with interleaved RS(1023,1007)/BCH(2047,1952) code (BER
threshold of 2×10
-3
, dashed red line #2 in Fig. 2) can leave a bigger margin, i.e. 7 dB.
Moreover, the removal of additional loss from the system (i.e. variable attenuator and
power monitor) could improve this margin even further.
#25
#48
23.3ps
(b)(a) (c)
-28 -24 -20 -16 -12
12
11
10
9
8
7
6
5
4
3
20 22 24 26 28 30 32
1
2
1
2
~6 dB
max received
power
#25
#48
-log(BER)
Total Rx Power [dBm]
# 25
# 48
OSNR [dB]
Fig. 2. BER performance after transmission for the best (#25) and worst (#48) subcarriers in
terms of (a) total received power, and (b) received OSNR. Grey crosses are all the other 47
subcarriers, represented only on the left graph for clarity. The dashed lines in red represent
the threshold for (1) the used FEC board and (2) an enhanced FEC threshold of 2×10
-3
. (c)
Respective eye-diagrams at maximum received power.
Fig. 3 also shows the Ethernet performance of all the 49 subcarriers. No frame-losses were
observed for any of the 49 subcarriers for the received total power shown in Fig. 3 (open
triangles) when a maximum number of frames (4.3×10
9
) allowed in the Ethernet tester for a
single run was set, suggesting a frame loss rate of below 2.3×10
-10
. When replacing the PRBS
tributary with an Ethernet stream, no frame losses were observed for all four FEC-encoded
Ethernet WAN PHY streams of the optical subcarrier #19. This represented the first attempt
of such a high Ethernet capacity, 2 TbE, transmission over an unrepeatered installed fibre of
an inter-city distance.
Optical Fiber Communications and Devices
102
-40
-30
-20
-10
0
10
1540 1545 1550 1555 1560 1565
Wavelength [nm]
OSA power [dBm]
-35
-30
-25
-20
-15
-10
Total rx power [dBm]
Fig. 3. Left: received optical spectrum after transmission with a resolution bandwidth of 0.02
nm. Right: total received power at BER of 1.0×10
-5
(filled diamonds) and at FLR of 2.3×10
-10
(open triangles).
The BER performance of the PRBS tributary for a random subcarrier (#19) at the maximum
received power (-12 dBm) was monitored over 6 hours to estimate the impact of dynamic
effects in the field-installed fibre. The BER variation against time, plotted in Fig. 4, shows
fluctuations in the BER of up to two orders of magnitude with a peak BER of ~5×10
-5
. We
attribute these variations mainly to PMD, but the features from 5 hours onwards might also
be due to a memory overload of the algorithm used. The feedback control was implemented
on a PC, which stored all the phase error values; therefore at the end of the measurement
cycle, the feedback delay was increased due to increasing memory usage. The results in Fig.
4 can also be illustrated as a probability density function (PDF) of log(BER), as in Fig. 5 (a).
In this case, the PDF shows two distinct peaks: the one with the greater amplitude
corresponding to a typical Maxwellian distribution associated with PMD, and the other
peak can be attributed to either: the proximity of the field-installed fibre cable to a major
motor-vehicular transport link, or the response of the phase-stabilization circuit to the
intermittent frequency modulation present on the synchronizing clock.
0 1 2 3 4 5 6
10
-8
10
-7
10
-6
10
-5
Time [hours]
BER
#19
Fig. 4. Long term BER measurement over time for subcarrier #19. The BER gating window
was set to 100 ms.
The outage probability, which is defined as the probability that a system outage occurs,
could be estimated to understand how the observed effects degraded the system
performance. An outage occurs whenever the BER is greater than 10
-12
after FEC decoding.
2 Terabit Transmission over Installed SMF with Direct Detection Coherent WDM
103
A
B
C
2
1
#19
IXF30007
EFEC100
other FEC board
(b)
#19
(a)
Fig. 5. (a) Probability Density Function (PDF); and (b) complementary cumulative
probability calculated from the long term BER measurement relative to an average
performance subcarrier (#19). The blue lines are extrapolating slopes from the data, and
dashed red lines represent FEC thresholds as from Fig. 2. The green dashed line represents a
desirable outage probability (Kaminow et al., 2008).
From the PDF values in Fig. 5(a), one can calculate the complementary cumulative
probability which is plotted in Fig. 5(b) (blue dots). The complementary cumulative
probability is defined as the probability that the BER is greater than a certain value (x-axis).
The outage probability will then correspond to the intercept between the complementary
cumulative probability and the FEC threshold. We consider two extrapolations from the
complementary cumulative probability, the first omitting the infrequent high BER events
giving an upper bound on the outage probability of 2×10
-6
(point A in Fig. 5(b)) and the
second including these events, giving a lower bound of 3×10
-12
(point B). Consequently, at
full received power, this particular subcarrier delivered an outage probability below the
widely used specification of 10
-5
(Kaminow et al., 2008). The outage probability could be
substantially improved if an enhanced FEC board, represented as a dashed red line #2 in
Fig. 5(b), were used, which would allow outage probabilities below 8×10
-9
(point C).
2.3 Hybrid EDFA/Raman amplification
2.3.1 Stimulated Raman Scattering
Raman Scattering is a spontaneous isotropic process where a pump wave is inelastically
scattered by the fibre material. The process results in the annihilation of the original photon
and the generation of a phonon and a photon at a lower frequency. In optical fibres, only
forward (FW) and backward (BW) scattered photons are guided. The vibrational energy
level of silica dictates the peak value of the Raman shift,
~13
Rps
ωω
Ω= − THz between the
pump frequency
ω
p
and the signal frequency ω
s
. If a weak probe is injected into the fibre at
an appropriate frequency shift from an intense pump, we obtain Stimulated Raman
Scattering (SRS) and the maximum SRS gain
g
R
is 0.6×10
-13
m/W at 1.55 µm (Stolen et al.,
1972; Pizzinat et al., 2003)). The SRS gain has a wide bandwidth (when pump and signal are
co-polarised (Headley & Agrawal, 2005) that exceeds 10 THz, making SRS favourable for
WDM amplification.
The power exchange between the pump and the signal is governed by the following set of
coupled equations, under the approximation of undepleted pumps (Agrawal, 2001):
Optical Fiber Communications and Devices
104
s
Rsp ss
FW
pFW
BW
pBW
dI
g
II I
dz
dI
I
dz
dI
I
dz
α
α
α
=−
=−
=+
(6)
where the intensities of the signal
I
s
and pumps I
p
(sum of FW and BW), I
FW
, I
BW
, are all
functions of the propagation direction
z. Also I
p
(0)=I
FW
(0)+I
BW
(0) and I
FW
(0)=I
BW
(L)=P
p
⁄A
eff
where
P
p
is the nominal power of the pumps in Watts and A
eff
is the effective area of the
fibre. α
p
(=0.069 km
-1
for 1427 and 1455 µm) and α
s
(=0.046 km
-1
) are the attenuation
coefficients at the pump and signal wavelength respectively. Solutions of Eq. (6) are:
() ()
()
() ()
()
()
()()
() () ()
()
{}
0exp
0 exp exp exp
0exp
FW FW p
BW BW
p
BW
pp
ss Rp s
IzI z
IzI zIL L z
Iz I g Izdz z
α
ααα
α
=−
==−
=−
(7)
and
()
()
()
()
()
0 exp 0 exp
FW p BW p
p
pp
IzIz
Izdz c
αα
αα
−
=++
−
(8)
where c is a constant. We could determine c by setting z=0 in Eq. (4):
() ()
00
FW BW
pp
II
c
αα
=−
(9)
The net gain that the signal experiences from one end of the fibre to the other end is given
by G
net
(z):
()
()
()
()
()
exp
0
s
net RA s
s
Iz
Gz Gz z
I
α
== −
(10)
where the Raman gain G
RA
(z) evolves along the propagation direction z, giving its main
contribution within a pump effective length
(
)
1
p
L
e
ff p
Le
α
α
−
=− :
() () ()
{
}
exp 0 0
p
z
RA R eff FW BW
Gz gLI I e
α
=+
(11)
2.3.2 Noise in Distributed Raman Amplification (DRA)
A particular advantage of distributed amplification is the reduced effective noise figure
coupled with a more uniform power distribution along the fibre, which enables an
improved compromise between nonlinearities and noise performances.
2 Terabit Transmission over Installed SMF with Direct Detection Coherent WDM
105
In the case of uni-directional Raman amplification and assuming that the loss coefficients at
the pump and signal wavelength are similar (
p
s
αα
≈ ), the effective noise figure is given by
(Desurvire, 2002):
12
RA e
q
NF n=+
(12)
where the equivalent input noise factor (Desurvire, 1986 & 2002; Walker et al., 1991; Kikuchi,
1990), n
eq
, which could be interpreted as the equivalent number of photons per mode at the
amplifier input, is given by
()
()
0000
0
exp exp
11
1exp
FW
eq s
ssss
BW
s
eq s
net net
aaaa
nEiEiL
nL
Ga G
α
αααα
α
α
=− − −
=− + −
(13)
where Ei(x) is the exponential integral function (Abramovitz & Stegun, 1972),
()
0
ln ln
net s e
ff
RA e
ff
aGLLGL
α
=+ =
is the SRS gain coefficient and G
BW
is the net gain due
to BW pumping only.
When BW pumping is the main source of gain, but bidirectional pumping is also employed,
we could express the equivalent noise figure for the Raman amplifier as (Bromage et al., 2004)
in Eq. (14) where G
FW
is the increase in optical signal power when FW pumps are switched on:
BW
RA
FW
NF
NF
G
=
(14)
2.3.3 Double Rayleigh Backscattering (DRB)
Rayleigh backscattering (RB) is light scattered backwards to the direction of propagation by
material density imperfections occurring in the fibre induced during manufacture. The
backscattered intensity increases with fibre length; in SMF (Rayleigh coefficient R
s
~6.164×10
–5
km
-1
) it reaches a constant value of 32 dB below the signal power after approximately 20 km.
The backscattered light may itself be backscattered through the Rayleigh backscattering
process, resulting in a doubly backscattered signal. In a conventional fibre without
distributed amplification, this process has negligible impact on the system performance,
however if the system contains bidirectional gain this effect could significantly degrade the
equivalent noise figure of the system. This is particularly the case in the presence of Raman
gain which provides distributed gain along the fibre length, but may also be observed in
systems employing bi-directional lumped amplifiers. Within a Raman amplified fibre, the
DRB signal is given by (Nissov, 1999):
() ()
()
()
22
2
0
1
zL
DRB s s net
x
net
P z P z R G y dydx
Gx
=
(15)
The total equivalent noise figure of a distributed Raman amplifier (DRA), taking into
account of amplified spontaneous emission (ASE) and DRB, could be then expressed as
(Essiambre et al., 2002):
Optical Fiber Communications and Devices
106
2
2
5
1
9
2
DRB
DRA RA
net
o
p
t
el
P
NF NF
G
h
ν
νν
=+
Δ
Δ+
(16)
where 5/9P
DRB
is the DRB power copolarised with the signal, Δν
opt
and Δν
el
are respectively
the equivalent double-side bandwidth of the optical signal and the electrical filter at the
receiver.
2.3.4 Impact of cross phase modulation
Raman amplification can enhance the performances of the CoWDM system in terms of
required OSNR and delivered BER (or Q factor). However, the optimization of a DRA
system is complex because the distribution of the gain along the transmission fibre improves
the OSNR by keeping the signal power from falling to very low levels (low noise figure), but
simultaneously increases the signal distortions that result from Kerr and other signal
nonlinearities (higher nonlinear phase shift and effective length). Fig. 6 illustrates our
experimental setup, which transmits 2 Tbit/s NRZ-OOK CoWDM with PRBS 2
31
-1 over the
124 km installed fibre link with distributed amplification. The hybrid EDFA/Raman system
consisted of three units: EDFA #1 in Fig. 6, FW and BW Raman pumping units. At the
output of the transmitter (point A in Fig. 6) the OSNRs (measured per CoWDM band, as the
ratio between the signal power in 2.5 nm and the noise power in 0.1 nm) were between 38
and 39 dB, which dropped to below 37dB at the output of EDFA#1. The first stage EDFA
also included optical supervisory channel equipment in order to ensure the integrity of the
installed link.
B
Tx
3 dB
BER
AMZI0.64nm
OSNR
monitor
Installed
SMF
124 km
DCM
-1977 ps/nm
Backward
Raman pumps
Forward
Raman pumps
Trimming
fibre
1427nm 1455nm1427nm 1455nm
A
1
2
Att. &
Power
mon.
CRU
3
Fig. 6. Experimental setup for hybrid Raman/EDFA transmission over 124 km installed-
SMF of 2 Tbit/s OOK CoWDM.
Conventionally, the equivalent noise figure NF
AB
between the points A and B in Fig. 6 is
defined as:
12
11
11
DCM DCM DCM DCM DCM DCM
DRA
AB
LL L
EEnet
NF NF NF
NF
eeGeGG
αα α
−− −
−−
=+ +
(17)
2 Terabit Transmission over Installed SMF with Direct Detection Coherent WDM
107
where NF
1
and G
E1
are noise figure and gain of EDFA #1, NF
2
is the second EDFA’s noise
figure, α
DCM
and L
DCM
are loss coefficient and length of the DCM, G
net
= G
net
(L) is the net
gain over the SMF as from Eqs. (10) and (11). NF
DRA
is the equivalent noise figure of the
Raman amplifier which takes into account of DRB and ASE as in Eq. (16), and results in a
typical output OSNR in the region of around 34dB after Raman amplification.
In order to calculate the evolution of the signal power, the conventional Raman
amplification formulas (Eqs. (10) and (11) ) should be modified to take into account the
insertion loss of the variable attenuator α
ATT
, insertion losses of the FW pump coupler α
x
,
and efficiency parameters of the pump intensities η
1
, η
2
which will also take into account the
two wavelengths used within each pump module. We therefore have:
() ()
s
z
net ATT RA
Gz eGz
α
α
−
= (18)
() ()
()
()
{
}
12
exp 0
p
zL
RA x R eff BW FW
Gz gL I Le I
α
αη η
−
=+
(19)
Fig. 7 shows the analytically calculated Raman gain (blue solid line), along with
experimental measurements (red squares) to confirm the accuracy of the model. This allows
the calculation of the signal and DRB powers, assuming zero pump depletion as shown in
Fig. 8. Fig. 8(a) shows the case of backwards pumping only with 2 pump wavelengths both
at +27 dBm; Fig. 8(b) is the case of bidirectional pumping each with two pump wavelengths
at +27 dBm. Even for bidirectional pumping, the DRB power is very low (maximum of –40
dBm) and does not degrade the equivalent noise figure significantly. The equivalent link
noise figures are 22.7 dB using backwards pumping only and 11.7 dB using bidirectional
pumping, dominated by ASE generated in the Raman amplifier itself. However, with
bidirectional pumping, the signal power excursions are relatively low (increased path
averaged power), so for a given launch power, we would anticipate a significant increase in
the impact of cross-phase modulation (XPM).
19 20 21 22 23 24 25 26 27
0
5
10
15
20
25
30
Pump Power P
p
[dBm]
Raman Gain G
RA
[dB]
Fig. 7. Raman gain versus pumps’ power: experimental data (red squares) and fitting (η
1
=
0.68, η
2
= 0.36, α
x
=1.26 corresponding to ~1 dB extra loss, g
R
=0.68×10
-13
m/W- blue line).
Optical Fiber Communications and Devices
108
0 20 40 60 80 100 120
-20
-10
0
Signal Power
[dBm]
0 20 40 60 80 100 120
-80
-60
-40
DRB Power
[dBm]
0 20 40 60 80 100 120
-10
0
10
20
30
Distance z along the SMF [km]
Pump Power
[dBm]
0 20 40 60 80 100 120
-20
-10
0
Signal Power
[dBm]
0 20 40 60 80 100 120
-80
-60
-40
DRB Power
[dBm]
0 20 40 60 80 100 120
-10
0
10
20
30
Distance z alon
g
the SMF
[
km
]
Pump Power
[dBm]
BW
FW + BW
(a)
(
b
)
Fig. 8. Trend of the signal (P
s
), DRB (P
DRB
) and pump (P
p
) powers along the SMF.
For a well designed optically pre-amplified receiver, the Q factor for NRZ OOK signal is
limited by signal-ASE beat noise and is given by:
10
1
10 1
10 10
20log 10log
dB
II
I
QSNR
QQSNR
σσ σ
−
=≈=
+
==
(20)
where I
1
and I
0
are the detected photocurrents for the ‘1’ and ‘0’ (I
0
=0 for OOK) and σ
1
and σ
0
are the standard deviations of the noise on the ‘1’ and ‘0’ respectively. On a logarithmic scale
the Q factor scales linearly with the SNR (and hence with the OSNR) with a slope of 0.5. This
linearly increasing trend is inverted when signal nonlinearities become dominant; as the
signal power increases, the Q factor and the BER decrease. Assuming that the system is
limited by signal-spontaneous beat noise and XPM, the power dependence of the signal-to-
noise ratio may be expressed as (Mitra & Stark, 2001):
2
2
2
3
2
1
1
XPM
XPM
ch
Pch
ch
P
XPM
ch
Pch
ch
P
ASE
ASE ch
XPM
P
P
P
Pe
SNR
P
P
PP e
P
−
−
−
=≈
+
+−
(21)
where P
ch
is the power per channel (or subcarrier), P
ASE
the optical noise (ASE) per
polarisation (see Eq. (22)) and P
XPM
a nonlinear threshold associated with XPM. Near the
peak of this function, the exponential terms may be approximated with the first two terms of
the Taylor series expansion, giving the right hand form of Eq. (21).The optical noise contains
contributions from the transmitter OSNR, the Raman amplifier and the receiver
preamplifier, and is given by:
,1
1
1
ASE e
q
BW s
p
o
p
tASEE
net
Pnn h P
G
νν
=+ −Δ+
(22)
2 Terabit Transmission over Installed SMF with Direct Detection Coherent WDM
109
where
opt
ν
Δ
is the receiver optical bandwidth, transparency is assumed (the input power to
the Raman amplifier is restored at the output of the receiver preamplifier) and P
ASE,E1
is the
contribution from the transmitter OSNR. The XPM modelled by (Mitra & Stark, 2001) for a
multi-span system assumes decorrelation in space and time, which corresponds to particular
ratios of nonlinear, dispersion and walk of lengths. However, for a single span system, the
impact of such decorrelation is reduced, and we could anticipate that the nonlinear intensity
would be inversely proportional to the Raman effective length. Taking into account this, we
find that a good fit to our experimental data is obtained if we multiply the nonlinear
threshold from (Mitra & Stark, 2001) by the ratio of effective lengths with and without
Raman pumping, as following:
()
,
22
,
2ln 2
eff EDFA
XPM
ch e
ff
R
BD L
P
NL
λ
γ
Δ
= (23)
where γ and D are the nonlinear and the chromatic dispersion coefficients of the SMF, N
ch
is
the total subcarrier number, B is the subcarrier bandwidth and
λ
Δ is the subcarrier spacing.
The effective Raman length L
eff,R
and the effective EDFA length L
eff,EDFA
are:
()
,
0
L
eff R net
LGzdz=
(24)
,
1
s
L
eff EDFA
s
e
L
α
α
−
−
= (25)
where L is the SMF span length. From Eq. (21) we observe that the Q-factor (or equivalently
the SNR) of the system will vary substantially when varying both the Raman gain and the
launched power into the optical fibre, because of the trade-off between OSNR (or NF) and
nonlinearities. Assuming dominance of XPM, we can predict the Q-factor of the system
when varying both the Raman gain and the launched power into the optical fibre, as in the
contour plot depicted in Fig. 9. An optimum operating area is identified were the Q-factor is
maximum; the optimum launch power into the SMF with Raman amplification is few dBs
lower than the EDFA only system, and it may be varied by around 5 dB for approximately
the same delivered BER or Q-factor. An equivalent Raman gain must be provided to
counterbalance the lower launch power. Note that for gains below 17.2 dB only the BW
pumps were used, whilst for higher gains maximum BW pump power was combined with
an appropriate level of forward pumping.
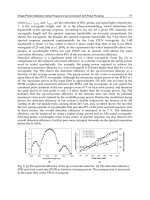
2.3.5 Experimental results
Experimentally two cross-sections (σ
1
and σ
2
) of Fig. 9 were studied. For a fixed Raman gain
of 17.2 dB (BW only), the gain of the first EDFA was varied in order to evaluate the
nonlinear power threshold (corresponding to cross section σ
1
in Fig. 9). Fig. 10 shows the Q-
factor in dB, calculated directly from the BER measurements for the worst-performing
optical subcarrier #48 (left-axis, blue circles) at the receiver, against the launch power, varied
via the gain of the first EDFA. A similar trend was measured on subcarrier #17; hence
negligible variation in the nonlinear performance is expected across the 21 nm bandwidth.
Fig. 10 also shows the OSNR for the 7
th
band (containing subcarrier #48) measured at the
Optical Fiber Communications and Devices
110
13.5
Raman Pump Power [W]
Signal Launch Power [dBm/ch]
Raman Gain [dB]
0
5
10
15
25
20
13
12
σ
2
σ
1
Fig. 9. Predicted Q-factor as a function of power per subcarrier and Raman gain, assuming
XPM and limitations, 3.4 dB multiplexing Q-penalty and finite transmitter OSNR (see Fig. 10
for details). See text for details of Raman pump conditions. Contour levels are in steps of
0.25. Operating conditions for BER measurements shown as cross-sections σ
1
and σ
2
.
output of the first EDFA (#1 in Fig. 6) showing the small variation in OSNR, as a result of
variations in the amplifier population inversion. At low power levels, the degradation in Q-factor
(left-axis, blue circles) is caused by a lower OSNR (right-axis, red circles); at high powers, the
OSNR increases but the Q-factor starts degrading due to nonlinearities. The optimal operating
condition was about –1 dBm per subcarrier launched into the SMF. Fig. 10 also shows the
analytical fit for the Q-factor, taking into account the transmitter OSNR and a 3.4 dB multiplexing
Q-penalty observed for this subcarrier (which could be found in the experimental measurement
(Fig. 12)) showing agreement within 0.5 dB across the entire launch power range studied.
Transmitted OSNR [dB]
20log(Q) [dB]
Signal Launch Power [dBm/ch]
35
36
37
38
34
Fig. 10. Q-factor calculated from BER measurements (blue circles, left-y axis) for optical
subcarrier #48, and measured OSNR (for the associated band) at the output of the
transmitter EDFA (red circles, right-y axis) against power per subcarrier at the input of 124
km installed-SMF. Solid line represents analytically predicted performance (see Fig. 9).
2 Terabit Transmission over Installed SMF with Direct Detection Coherent WDM
111
At the optimum launch power, the Raman gain was increased from 17.2 dB by increasing
the FW pump power or decreased from this level by reducing the BW pump power (cross-
section σ
2
in Fig. 9). In Fig. 11 the Q-factor (calculated from measured BER for optical
subcarrier #48 (left-axis)) against the on-off Raman gain is plotted as blue circles. The
measured OSNR at the output of the receiver preamplifier is also shown on the right-axis.
Experimental optimum working conditions were found to be a Raman gain of 17.2 dB (BW
Raman only) and launch power of –1 dBm. This agrees well with the analytical predictions
(solid lines in Fig. 10 and 11). At this operating point, all 49 subcarriers were characterized
in terms of BER performance, and the corresponding Q-factors are shown in Fig. 12 (right-y
axis) along with the transmitted spectrum, in order to identify the 49 wavelengths. An
average Q-factor of 15 dB across the 49 subcarriers was observed after transmission
(Frascella et al., 2011), which gave a system margin of ~4 dB when related to a BER of 2×10
–3
(enhanced FEC threshold) for 2 Tbit/s system based on CoWDM. BW Raman amplification
induced a 3 dB OSNR improvement when compared to an EDFA only amplification system
(Frascella et al., 2010b), but at maximum BW Raman gain only a 1.2 dB improvement in the
Q-factor was achieved due to the impact of cross phase modulation.
28
30
32
34
36
Raman Gain
[
dB
]
Received OSNR [dB]
20log(Q) [dB]
Fig. 11. Q-factor calculated from BER measurements (blue circles, left-y axis) for optical
subcarrier #48, and measured OSNR (for the associated band) at the output of the receiver
preamplifier (red circles right-y axis) as a function of Raman gain (below 17dB, backwards
pumping only). Solid line represents analytically predicted performance (see figure 9).
1540 1545 1550 1555 1560 1565
-50
-40
-30
-20
-10
0
Power mon. [dBm]
Wavelen
g
th
[
nm
]
6
8
10
12
14
16
20log(Q) [dB]
1
2 3 4 5 6 7
Fig. 12. Spectrum at the transmitter output, with band numeration shown (left-y axis).
Calculated Q-factor from BER measurements of all 49 subcarriers with hybrid
Raman/EDFA amplification (right y-axis).
Optical Fiber Communications and Devices
112
3. Discussion
Having established the accuracy of the analytical predictions using both gain measurements
and Q-factor analysis, Eq. (21) may be used to estimate the maximum reach of a 40 Gbaud
direct detected OOK CoWDM system. Further assuming periodic dispersion compensation
such that the signal power and the pulse shape at the input of each span is the same, the
nonlinear threshold remains as given in Eq. (23), and the optical noise power needs to be
multiplied by the number of fibre spans N
A
.
Maximum Reach [km]
Amplifier Spacing [km]
Optimum Launch
Power [dBm]
Amplifier Spacing [km]
Fig. 13. Reach (left) and optimum per subcarrier launch power (right) of a 40 Gbaud OOK
CoWDM system for delivering a BER of 10
-5
(corresponding to frame loss free Ethernet
performance) calculated under the experimental conditions (3.4 dB maximum multiplexing
penalty and finite transmitter OSNR). Purple, EDFA only; Blue, Backwards pumping; Red
forwards pumping; Green, bidirectional pumping. Pump powers at maximum in each case.
This approach may be used to determine the total reach L
T
dependence on the amplifier
spacing L
A
(implicit in N
A
) and the optimum signal launch power P
in
, as plotted in Fig. 13 for
a target SNR of 16.3 dB, corresponding to a worst case BER of 10
-5
(allowing from frame loss
free Ethernet performance after FEC) and a 3.4 dB multiplexing penalty. As expected, the
reach is larger for low amplifier spacing, which offers reduced gains and reduced levels of
ASE, although this solution tends to result in increased cost due to the increased number of
amplifier sites. The EDFA only case offers the lowest reach, whilst the BW Raman
amplification alone allows the maximum increase in reach. The forward pumping allows
instead for significantly lower optimum signal launch powers (right hand graph in Fig. 13),
but the OSNR benefits are reduced by the increased effective length.
At 124 km spacing, it is confirmed that the best reach is achieved at a launch power close to
–1 dBm in good agreement with the measured nonlinear threshold. Using reduced amplifier
spacing of 80 km or below, the reach is increased to beyond 1,400 km, confirming the
suitability of 40 Gbaud direct detected OOK CoWDM system for use in ultra high capacity
metro area networks employing dispersion management.
4. Conclusions
This chapter demonstrates that direct detection CoWDM with EDFA amplification only is
suitable for Terabit Ethernet transport over unrepeatered spans up to ~130 km. Raman
amplification would allow for an increased system margin, where necessary. Experimental
demonstration showed that one 124 km span transmission with Raman amplification left a
2 Terabit Transmission over Installed SMF with Direct Detection Coherent WDM
113
Q-factor system margin of about 4 dB, which is consistent with theoretical expectations. For
a repeatered system employing EDFAs, with 80 km amplifier spacing the reach of direct
detected 40 Gbaud OOK 2 Tbit/s is expected to be 500 km whilst with Raman amplification,
reaches in excess of 1,000km are possible for repeater spacing below 100 km (Healy et al.,
2007). Hence orthogonal multiplexing and direct detection constitute a feasible low-cost per
bit solution for metropolitan links based on single-mode fibres.
5. Acknowledgments
The authors acknowledge F.C.G. Gunning, C. Antony, N. MacSuibhne, S.K. Ibrahim from
the Photonics Systems Group of the Tyndall Institute and P. Gunning from BT Innovate and
Design for invaluable assistance with the experimental demonstrations; W. McAuliffe and
D. Cassidy from BT Ireland for provision of and access to the installed optical fibre; D.
Pearce from Ixia Europe for the loan of Ethernet Protocol Test Equipment. This work was
supported in part by Science Foundation Ireland (SFI) under grant number 06/IN/I969
6. References
Abramovitz, M. & Stegun, I.A. (1972). Handbook of Mathematical Functions. Dover
Publications, New York, 1972, chapters 15 and 22.
Agrawal, G.P. (2001). Nonlinear Fiber Optics. 3rd ed., Academic Press, San Diego, CA, 2001.
Agrawal, G.P., (2002). Fiber-Optic Communication Systems. 3
rd
edition, Wiley Inter-Science,
New York, 2002.
Bocoi, A., Schuster, M., Rambach, F. & Kiese, M., Bunge, C A. & Spinnler, B. (2009). Reach-
Dependent Capacity in Optical Networks Enabled by OFDM. Proceedings of
Optical Fiber Communication (OFC) Conference 2009, OMQ4.
Bromage, J., Bouteiller, J C., Thiele, J., Brar, K., Nelson, L.E., Stulz, S., Headley, C., Boncek,
R., Kim, J., Klein, A., Baynham, G., Jørgensen, L.V., Grüner-Nielsen, L., Lingle,
R.L.Jr. & DiGiovanni, D.J. (2004). WDM Transmission Over Multiple Long Spans
With Bidirectional Raman Pumping. IEEE Journal of Lightwave Technology, Vol.22,
No.1, pp.225-232.
Chandrasekhar, S., Liu, X., Zhu, B. & Peckham, D.W. (2009). Transmission of a 1.2-Tb/s 24-
Carrier No-Guard-Interval Coherent OFDM Superchannel over 7200-km of Ultra-
Large-Area Fiber. European Conference on Optical Communications (Sep 2009), PD2.6.
Chang, R. W. (1966). Synthesis of band-limited orthogonal signals for multichannel data
transmission. Bell System Technological Journal, Vol. 45, pp. 1775-1796 (Dec. 1966).
Chang, R. (1970). Orthogonal frequency multiplex data transmission system. US Patent
3,488,445, filed Nov 1966, published Jan 1970.
Chen, H., Chen, M. & Xie, S. (2009). All-optical sampling orthogonal frequency-division
multiplexing scheme for high-speed transmission system. IEEE Journal of Lightwave
Technology, Vol.27, No.21, pp. 4848-4854.
Chen, D., Wheeler, S., Nguyen, D., Färbert, A., Schöpflin, A., Richter, A., Weiske, C J.,
Kotten, K., Krummrich, P.M., Schex, A. & Glingener, C. (2001). 3.2 Tb/s field trial
(80 x 40 Gb/s) over 3 x 82 km SSMF using FEC, Raman and tunable dispersion
compensation. Optical Fiber Communication Conference (2001), PD36.