Mass Transfer in Multiphase Systems and its Applications Part 5 pot
Bạn đang xem bản rút gọn của tài liệu. Xem và tải ngay bản đầy đủ của tài liệu tại đây (6.23 MB, 40 trang )
Toward a Multiphase Local Approach in the Modeling
of Flotation and Mass Transfer in Gas-Liquid Contacting Systems
149
The decomposition of the Reynolds stress tensor in a turbulent and pseudo-turbulent
contributions with specific transport equation for each part makes possible the computation of
the specific scales involved in each part. The determination of these scales allows to describe
correctly the different effects of the bubbles agitation on the liquid turbulence structure.
10 100 1000
0
0,02
0,04
0,06
0,08
0,1
y+
sqrt(u'2)
alpha=0. - u=0.75 m/s
data from Moursali et al (1995)
alpha=0.015 - u=0.75 m/s
data from Moursali et al (1995)
Fig. 4. Turbulent intensity in single-phase and bubbly boundary layer.
0 0,2 0,4 0,6 0,8 1
0
2
4
6
8
10
y/R
u'v' (10-3 m/s)
Jl=1.36 - Jg=0. m/s
data from Serizaw a (1992)
Jl=1.36 - Jg=0.077 m/s
data from Serizaw a (1992)
Jl=1.36 - Jg=0.092 m/s
data from Serizaw a (1992)
Fig. 5. Turbulent shear stress in single-phase and bubbly pipe flows.
If from a theoretical point of view, second order is an adequate level for turbulence closure
in bubbly flows, the implementation of such turbulence models in two-fluid models clearly
improves the predetermination of the turbulence structure in different bubbly flow
configurations, (Chahed et al., 2002, 2003). Nevertheless, from a practical point of view,
second order modeling is still difficult to use and turbulence models based on turbulent
viscosity concept, particularly two-equation models, remain widely used in industrial
applications. Several two-equation models were developed for turbulent bubbly flows
(Lopez de Bertodano et al., 1994; Lee et al., 1989; Morel, 1995; Troshko & Hassan, 2001). All
of these models are founded on an extrapolation of single-phase turbulence models by
introducing supplementary terms (source terms) in the transport equations of turbulent
energy and dissipation rate. In some models, the turbulent viscosity is split into two
contributions according to the model of Sato et al. (1981): a “turbulent” contribution induced
by shear and a “pseudo-turbulent” one induced by bubbles displacements. To adjust the
turbulence models some modifications of the conventional constants are sometimes
proposed (Lee et al., 1989; Morel, 1995).
The reduction of second order turbulence modeling developed for two-phase bubbly flows
furnish an interpretation of second order turbulence closure in term of turbulent viscosity
149
Toward a Multiphase Local Approach in the
Modeling of Flotation and Mass Transfer in Gas-Liquid Contacting Systems
Mass Transfer in Multiphase Systems and its Applications
150
model. On the basis of this turbulent viscosity model, two-equation turbulence models (k-ε
model, (Chahed et al., 1999) and k-ω model (Bellakhel et al., 2004) were developed and
applied to homogeneous turbulence in bubbly flows (uniform and with a constant shear).
The numerical results clearly show that the model reproduces correctly the effect of the
bubbles on the turbulence structure.
The turbulent viscosity formulation (18) keeps the essential of the physical mechanisms
involved in second order turbulence modeling. It expresses two antagonist interfacial effects
due to the presence of the bubbles on the turbulent shear stress of the liquid phase: the
bubbles agitation induces in one hand an enhancement of the turbulent viscosity as
compared to and on the other hand a modification of the eddies stretching characteristic
scale that causes more isotropy of the turbulence with an attenuation of the shear stress.
According as the amount of pseudo-turbulence is important or not, we can expect an
increase or a decrease of the turbulent viscosity. As a result, the turbulent shear stress in
bubbly flow can be more or less important than the corresponding one in the equivalent
single-phase flow. In the case where the turbulent shear stress is reduced, the turbulence
production by the mean velocity gradient is lower and we can reproduce, under certain
conditions, an attenuation of the turbulence as observed in some wall bounded bubbly flows
(Liu and Bankoff, 1990; Serizawa et al., 1992).
Void fraction and bubbles size distributions
The distribution of void fraction is governed by the interfacial forces exerted by the
continuous phase on the bubbles as they move throughout the liquid. We have to specify the
contributions of the average and fluctuating flow fields to this force. Numerical simulations
of upward pipe bubbly flow in micro-gravity and in normal gravity conditions show clearly
the role of the turbulence and of the interfacial forces on the void fraction distribution,
(Chahed et al., 2002). These numerical simulations are compared to the experimental data of
Kamp. et al. (1994). An important result of these experiences is to show that the radial void
fraction gradient is inverted according as the gravity is active or not (according as the
interfacial momentum transfer associated with the average relative velocity is important or
not). Figure (5) shows the profile of void fraction in pipe upward and downward bubbly
flows in microgravity and in normal gravity conditions. In micro-gravity condition, the
average relative velocity between phases is weak; thus the action of the continuous phase on
the bubbles is reduced to the pressure gradient effect (Tchen force) and to the turbulent
contributions of the interfacial force. The pressure gradient effect provokes a bubble
migration toward the wall and can't explain the experimental void fraction profile. When
the turbulent terms issued from the added mass force are introduced, the whole action of
turbulence is inverted and the phase distribution prediction is in good agreement with the
experimental data.
This result indicates that the effect of the continuous phase turbulence on the phase
distribution includes, beside the pressure gradient action (Tchen force), the turbulent
contributions of the interfacial forces. Consequently, the accuracy in the predetermination of
the turbulence of the dispersed phase is also for importance in the computation of the void
fraction distribution. The turbulent stress tensor of the dispersed phase can be related to the
liquid one through a turbulent dispersion models, (Hinze, 1975; Csanady, 1963). The recent
results issued from numerical simulations can be viewed as a prelude to more progress in
this direction.
As compared to the void fraction profile in micro-gravity condition, the prediction of the
void fraction distribution in upward and downward bubbly flows in normal gravity
conditions clearly shows the effect of the lift force. In upward flow, the lift force is
150
Mass Transfer in Multiphase Systems and its Applications
Toward a Multiphase Local Approach in the Modeling
of Flotation and Mass Transfer in Gas-Liquid Contacting Systems
151
responsible of the near-wall void fraction peaking while in downward flow, the lift force
action is inverted and the migration of the bubble toward the centre of the pipe provoked by
the global turbulent action is more pronounced than in micro-gravity condition.
The adjustment of the coefficients in the expression of the near wall lift force was tested in
boundary layer bubbly flow (
0.75 /ums= and 1/ums= ) with bubble’s diameter between
2.3 and 3.5 mm (the more is the external void fraction the more is the bubble diameter); in
these simulations the diameter of the bubbles was adjusted from the experimental data of
Moursali et al. (1995). It yields
L
C =0.08,
*
1
y
=1 and
*
2
y
=1.5. These computations allow us to
consider that these coefficients could have a somewhat general character. The value of
*
1
y
suggests that the position of the void fraction peaking is, for the most part, controlled by lift
and wall forces: its value corresponds to the void fraction peaking position observed in the
experiences.
0 0,2 0,4 0,6 0,8 1
0
0,05
0,1
0,15
y/R
void fraction
g=9.81 - Jg=0.026 m/s
data from Kamp et al (1994)
g=-9.81 - Jg=0.025 m/s
data from Kamp et al (1994)
g=0. - Jg=0.03 m/s
data from Kamp et al (1994)
Fig. 5. Void fraction distribution in pipe bubbly flows : upward – downward and in micro-
gravity conditions. Data from Kamp et al. (1995)
0 0,005 0,01 0,015 0,02
0
0,02
0,04
0,06
0,08
0,1
alphae
alphap
u=0.75 m/s
data Moursali
u=1m/s
data Moursali
Fig. 6. Amplitude of the near wall void fraction peaking as a function of the external void
fraction in boundary layer bubbly flow.
Figure (6) shows that the less is the bubble diameter the more is amplitude of the void
fraction peaking near wall. This result is well reproduced by the model for millimetric
bubbles: the lift force formulation including the wall effect brings implicitly into account the
bubble size. When the bubble’s size becomes greater and its shape deviates severely from
the sphericity the expression of the force exerted by the liquid should be reviewed. Also on
this point, we can expect some progress issued from the numerical simulation. On the other
hand.
151
Toward a Multiphase Local Approach in the
Modeling of Flotation and Mass Transfer in Gas-Liquid Contacting Systems
Mass Transfer in Multiphase Systems and its Applications
152
4. Conclusion
Many industrial processes in chemical, environmental and power engineering employ gas-
liquid contacting systems that are often designed to bring about transfer and transformation
phenomena in two-phase flows. As for all gas-liquid contacting systems, flotation devices
bring into play gas-liquid bubbly flows where the interfacial interactions and exchanges
determine not only the dynamics of the system but are, in the same time, the technological
reason of the process itself. When applied to flotation, mass transfer approach turns out to
be very convenient for representing various behaviors of the flotation kinetics. It allows a
more phenomenological approach in the analysis of the interfacial phenomena involved in
the flotation process.
From a practical point of view, the development of general models which are able to predict
the fields of certain average kinematic properties of both gas and liquid phases and their
presence rates in two-phase flows is of great interest for the design, control and
improvement of gas-liquid contacting systems. From the scientific point of view, the
modeling and simulation of gas-liquid flows set many important questions; in particular the
ability to predict the phase distribution in gas-liquid bubbly flows remains limited by the
inadequate modeling of the turbulence and of the interfacial forces. Especially in industrial
gas-liquid systems characterized by various additional complexities such as : the geometry
of the reactor, the hydrodynamic interactions particularly in dense gas-liquid flows (high
void fraction), the chemical reactivity, the interfacial area modulation due to the phenomena
of rupture and coalescence All of these issues require new original experiments in order to
sustain the modeling effort that aims at developing more general closures for advanced
Computational Fluid Dynamics of complex gas-liquid systems.
5. References
Ahmed N. & Jameson G.J. (1985). The effect of bubble size on the rate of flotation of fine
particles, Int. J. of Mineral Processing, Vol 14, pp. 195-215
Aisa L.; Caussade B.; George J. & Masbernat L. (1981), Echange de gaz dissous en
écoulements stratifiés de gaz et de liquide : International Journal of Heat and Mass
Transfer vol 24 pp 1005–1018.
Antal S.P; Lahey JR & Flaherty J.E. (1991). Analysis of phase distribution in fully developed
laminar bubbly two-phase flow, Int. J. Multiphase Flow, 5, pp. 635-652
Ayed H.; Chahed J. & Roig V. (2007). Experimental analysis and numerical simulation of
hydrodynamics and mass transfer in a buoyant bubbly shear layer, AIChE Journal,
53 (11), pp. 2742-2753
Buscaglia G. C.; Bombardelli F. A. & Garcia M., 2002. Numerical modeling of large scale
bubble plumes accounting for mass transfer effects, Int. J. of Multiphase Flow, 28,
1763-1785
Bellakhal G.; Chahed J. & Masbernat L. (2004). Analysis of the turbulence structure in
homogeneous shear bubbly flow using a turbulent viscosity model, Journal of
Turbulence, Vol. 5, N°36
Chahed J.; Masbernat L. & Bellakhel G. (1999). k-epsilon turbulence model for bubbly flows,
2nd Int. Symposium On Two-Phase flow Modelling and Experimentation, Pisa, Italy,
May 23-26
Chahed J. & Masbernat L. (2000). Requirements for advanced Computational Fluid
Dynamics (CFD) applied to gas-liquid reactors, Proc. of the Int. Specialized Symp. on
152
Mass Transfer in Multiphase Systems and its Applications
Toward a Multiphase Local Approach in the Modeling
of Flotation and Mass Transfer in Gas-Liquid Contacting Systems
153
Fundamentals and Engineering Concepts for Ozone Reactor Design. INSA, Toulouse
1-3 Mars, pp. 307-310
Chahed J.; Colin C. & Masbernat L. (2002) Turbulence and phase distribution in bubbly
pipe flow under micro-gravity condition", Journal of Fluids Engineering, Vol. 124,
pp. 951-956
Chahed J.; Roig V. & Masbernat L. (2003). Eulerian-eulerian two-fluid model for turbulent
gas-liquid bubbly flows. Int. J. of Multiphase flow. Vol. 29, N°1, pp. 23-49
Csanady G.T. (1963). Turbulent diffusion of heavy particles in the atmosphere" J. Atm. Sc,
Vol. 20, pp. 201-208
Chahed J. & Mrabet K. (2008). Gas-liquid mass transfer approach applied to the modeling of
flotation in a bubble column, Chem. Eng. Technol, 31 N°9 pp.1296-1303
Cockx A.; Do-Quang Z., Audic J.M.; Liné A. & Roustan M. (2001). Global and local mass
transfer coefficients in waste water treatment process by computational fluid
dynamics. Chemical Engineering and Processing, Vol. 40, pp. 187-194.
Dankwerts, P.V. (1951). Significance of liquid-film coefficients in gas absorption. Ind. Eng.
Chem., Vol. 43, pp. 1460-67
Drew D.A. & Lahey R.T (1982) Phase distribution mechanisms in turbulent low-quality two-
phase flow in circular pipe, J. Fluid Mech., Vol. 117, pp. 91-106.
Finch J. A. (1995). Column flotation: a selected review. Part IV: novel flotation devices,
Minerals Engineering, Vol. 8, N° 6, pp. 587-602
George J.; Minel F. & Grisenti M. (1994). Physical and hydrodynamical parameters
controlling gas-liquid mass transfer: J. Fluid Mechanics, Vol. 37 pp. 1569-1578.
Gorain B. K.; Franzidis J. P. & Manlapig E. V. (1997). Studies on impeller type, impeller
speed and air flow rate in an industrial scale flotation cell. Part 4: Effect of
bubble surface area on flotation performance, Minerals Engineering, Vol. 10, N° 4,
pp. 367-379
Higbie, R. (1935). The rate of absorption of a pure gas into a still liquid during short periods
of exposure. Trans. A.I.Ch.E, Vol 31, pp. 365-388.
Hinze J. O. (1995). Turbulence, 2nd edition, Mc Graw-Hill,
Ityokumbul M.T. (1992). A mass transfer approach to flotation column design, Chemical
Engineering Science, Vol. 13, N° 14, pp. 3605-3612
Jameson G. J.; Nam S. & Moo-Young M. (1977). Physical factors affecting recovery rates in
flotation. Miner. Eng. Sci. Vol. 9, pp. 103-118
Kamp A.; Colin C. & Fabre J. (1995). The local structure of a turbulent bubbly pipe flow
under different gravity conditions, Proceeding of the Second International Conference
on Multiphase Flow, Kyoto, Japan
Lain S.; Bröder D. & Sommerfeld M. (1999). Experimental and numerical studies of
the hydrodynamics in a bubble column, Chemical Engineering Science, Vol. 14,
pp. 4913-4920
Lance M. & Bataille J. (1991). Turbulence in the liquid phase of a uniform bubbly air water
flow, J. Fluid Mech., Vol. 222, pp. 95-118.
Lance M.; Marié J.L. & Bataille J. (1991). Homogeneous turbulence in bubbly flows, J. Fluids
Eng., 113, pp. 295-300
Lance M. & Lopez de Bertonado M. (1992). Phase distribution phenomena and wall effects
in bubbly two-phase flows,
Third Int. Workshop on Two-Phase Flow Fundamentals,
Imperial College, London, June 15 -19
Liu T.J. & Bankoff S.G. (1990). Structure of air-water bubbly flow in a vertical pipe : I- Liquid
mean velocity and turbulence measurements", Int. J. Heat and Mass Transfer, vol. 36
(4) pp. 1049-1060
153
Toward a Multiphase Local Approach in the
Modeling of Flotation and Mass Transfer in Gas-Liquid Contacting Systems
Mass Transfer in Multiphase Systems and its Applications
154
Lopez de Bertodano M.; Lee S. J.; Lahey R. T. & Drew D. A. (1990). The prediction of two-
phase turbulence and phase distribution using a Reynolds stress model, J. of Fluid
Eng., Vol. 112, pp. 107-113.
Lopez de Bertodano M.; Lee S.J. & Lahey R.T., Jones. O. C. (1994). Development of a k-ε
model for bubbly two-phase flow, J. Fluids Engineering, Vol. 116, pp. 128-134.
Lee S.J.; Lahey Jr R.T & Jones Jr O.C. (1989). The prediction of two-phase turbulence and
phase distribution phenomena using kε model, Japanese J. of Multiphase Flow. Vol.
3, pp. 335-368.
Morel C. (1995). An order of magnitude analysis of the two-phase k-ε model, Int. J. of Fluid
Mechanics Research, Vol. 22 N° 3&4, pp. 21-44.
Moursali E., Marié J.L. & Bataille J. (1995). An upward turbulent bubbly layer along a
vertical flat plate, Int. J. Multiphase Flow, Vol. 21 N°1, pp. 107-117
Nguyen A. V. (2003). New method and equations determining attachment and particle size
limit in flotation, Int. J. Miner. Process, Vol. 68, pp. 167-183
Reidel, Boston, McKenna S.P. & Mc Gillis W.R. (2004) : The role of free-surface turbulence
and surfactants in air–water gas transfer: International Journal of Heat and Mass
Transfer, Vol. 47, pp. 539–553.
Rivero M.; Magnaudet J. & Fabre J. (1991). Quelques résultats nouveaux concernant les
forces exercées sur une inclusion sphérique par un écoulement accéléré, C. R. Acad.
Sci. Paris, t.312, serie II, pp. 1499-1506
Serizawa A.; Kataoka I. & Michiyoshi I. (1992). Phase distribution in bubbly flow. Multiphase
Science and Technology, Vol. 6, Hewitt G. F. Delhaye, J. M., Zuber, N., Eds,
Hemisphere Publ. Corp., pp. 257-301.
Sutherland K. L. (1948). Physical chemistry of flotation XI. Kinetics of the flotation process, J.
Phy. Chem., Vol. 52, pp. 394-425
Sato Y.; Sadatomi L. & Sekouguchi K. (1981). Momentum and heat transfer in two phase
bubbly flow, Int. J. Multiphase Flow, Vol. 7, pp. 167-190.
Troshko A. A. & Hassan Y. A. (2001). A two-equation turbulence model of turbulent bubbly
flows, Int. J. Multiphase Flow, Vol. 27, pp. 1965-2000.
Tuteja R.K.; Spottiswood D.J. & Misra V.N. (1994). Mathematical models of the column
flotation process, a review, Minerals Engineering, Vol. 7, N°12, pp. 1459-1472
Wanninkhof; R. & McGillis W. R. (1999), A cubic relationship exchange and wind speed.
Geophysical Research Letters, Vol. 26, N° 13, pp.1889-1892.
Yachausti R. A.; McKay J. D. & Foot Jr. D. G. (1988). Column flotation parameters – their
effects. Column flotation ’88 (K. V. S. Sasty ed.), Society of Mining Engineers, Inc.
Littleton, CO, pp. 157-172
Yoon R. H.; Mankosa M. J. & Luttrel G. H. (1993). Design and scale-up criteria for
column flotation, XVII International Mineral Processing Congress, Sydney, Austria.
pp. 785-795
Zongfu D.; Fornasiero D. & Ralston J. (2000). Particle bubble collision models – a review,
Advances in Collid and Interface Science, Vol. 85, pp. 231-256
Zhou, L. X. (2001). Recent advances in the second order momentum two-phase turbulence
models for gas-particle and bubble-liquid flows, 4
th
International Conference on
Multiphase Flow, paper 602, New Orleans.
154
Mass Transfer in Multiphase Systems and its Applications
8
Mass Transfer in Two-Phase Gas-Liquid Flow
in a Tube and in Channels of
Complex Configuration
Nikolay Pecherkin and Vladimir Chekhovich
Kutateladze Institute of Thermophysics, SB RAS
Russia
1. Introduction
Successive and versatile investigation of heat and mass transfer in two-phase flows is
caused by their wide application in power engineering, cryogenics, chemical engineering,
and aerospace industry, etc. Development of new technologies, upgrading of the methods
for combined transport of oil and gas, and improvement of operation efficiency and
reliability of conventional and new apparatuses for heat and electricity production require
new quantitative information about the processes of heat and mass transfer in these
systems. At the same time necessity for the theory or universal prediction methods for heat
and mass transfer in the two-phase systems is obvious.
In some cases the methods based on analogy between heat and mass transfer and
momentum transfer are used to describe the mechanism of heat and mass transfer. These
studies were initiated by Kutateladze, Kruzhilin, Labuntsov, Styrikovich, Hewitt,
Butterworth, Dukler, et al. However, there are no direct experimental evidences in literature
that analogy between heat and mass transfer and momentum transfer in two-phase flows
exists. The main problem in the development of this approach is the complexity of direct
measurement of the wall shear stress for most flows in two-phase system. The success of the
analogy for heat and momentum transfer was achieved in the prediction of heat transfer in
annular gas-liquid flow, when the wall shear stress is close to the shear stress at the interface
between gas core and liquid film.
Following investigation of possible application of analogy between heat and mass transfer
and hydraulic resistance for calculations in two-phase flows is interesting from the points of
science and practice.
The current study deals with experimental investigation of mass transfer and wall shear
stress, and their interaction at the cocurrent gas-liquid flow in a vertical tube, in channel
with flow turn, and in channel with abrupt expansion. Simultaneous measurements of mass
transfer and friction factor on a wall of the channels under the same flow conditions allowed
us to determine that connection between mass transfer and friction factor on a wall in the
two-phase flow is similar to interconnection of these characteristics in a single-phase
turbulent flow, and it can be expressed via the same correlations as for the single-phase
flow. At that, to predict the mass transfer coefficients in the two-phase flow, it is necessary
to know the real value of the wall shear stress.
Mass Transfer in Multiphase Systems and its Applications
156
2. Analogy for mass transfer and wall shear stress in two-phase flow
2.1 Introduction
The combined flow of gas and liquid intensifies significantly the heat and mass transfer
processes on the walls of tubes and different channels and increases pressure drop in
comparison with the separate flow of liquid and gas phases.
According to data presented in (Kutateladze, 1979; Hewitt & Hall-Taylor, 1970; Collier,
1972; Butterworth & Hewitt, 1977; et al), the methods based on semi-empirical turbulence
models and Reynolds analogy are the most suitable for convective heat and mass transfer
prediction in two-phase flows. Their application assumes interconnection between heat and
mass transfer and hydraulic resistance in the two-phase flow.
Several publications deal with experimental check of analogy between heat and mass
transfer and momentum in the two-phase flows. Mass transfer coefficients in the two-phase
gas-liquid flow in a horizontal tube are compared in (Krokovny et al., 1973) with mass
transfer of a single-phase turbulent flow for the same value of wall shear stress. The mass
transfer coefficient in vertical two-component flow was measured by (Surgenour &
Banerjee, 1980). Wall shear stress was determined by pressure drop measurements. The
experimental study for Reynolds analogy and Karman hypothesis for stratified and annular
wave film flows is presented in (Davis et al., 1975). Experimental studies mentioned above
prove qualitatively and, sometimes, quantitatively the existence of analogy between heat
and mass transfer and wall shear stress.
The main difficulties in investigation of analogy between heat and mass transfer and friction
are caused by the measurement of wall shear stress. Determination of friction by
measurements of total pressure drop in the two-phase flow can give significant errors at
calculation of pressure gradients due to static head and acceleration. Therefore, friction
measurements require methods of direct measurement, which allow simultaneous
measurement of heat and mass transfer coefficients. Among these methods there is the
electrodiffusion method of investigation of the local hydrodynamic characteristics of the
single-phase and two-phase flows (Nakoryakov et al., 1973, 1986; Shaw & Hanratty, 1977).
The current study presents the results of simultaneous measurement of mass transfer
coefficients and wall shear stress for the cocurrent gas-liquid flow in a vertical tube within a
wide alteration range of operation parameters.
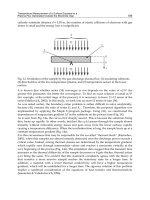
2.2 Experimental methods
The experimental setup for investigation of heat and mass transfer and hydrodynamics in
the two-phase flows is a closed circulation circuit, Fig. 1. The main working liquid of the
electrochemical method for mass transfer measurement is electrolyte solution
3646
() ()K Fe CN K Fe CN NaOH++; therefore, all setup elements are made of stainless steel
and other corrosion-proof materials. Liquid is fed by a circulation pump through a heat
exchanger into the mixing chamber, where it is mixed with the air flow. Then, two-phase
mixture is fed into the test section. Experiments were carried out with single-phase liquid
and with liquid-air mixture in a wide alteration range of liquid and air flow rates and
pressure. The test section is a vertical tube with the total length of 1.5 m, inner diameter of
17 mm, and it consists of the stabilization section, the section for visual observation of the
flow, and measurement sections. The measurement sections are changeable. They have
different design and they are made for investigation of mass transfer and wall shear stress in
a straight tube. There is also section for heat transfer study, and the sections for mass
transfer measurement in channels of complex configuration.
Mass Transfer in Two-Phase Gas-Liquid Flow in a Tube and in Channels of Complex Configuration
157
Separator
Test
section
Pump
Control valves
Liquid
flowmeter
Heat
exchanger
Air
flowmeter
Separator
Test
section
Pump
Control valves
Liquid
flowmeter
Heat
exchanger
Air
flowmeter
Fig. 1. Experimental setup
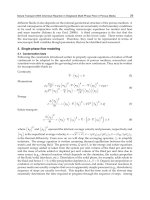
The method of electrodiffusion measurement of mass transfer coefficients is described in
detail in (Nakoryakov et al., 1973, 1986). The advantage of this method is the fact that it can
be used for the measurement of wall shear stress, mass transfer coefficient, and velocity of
liquid phase only with the change in probe configuration. When this method is combined
with the conduction method local void fraction in two phase flow can be measured. To
determine the mass transfer coefficient is necessary to measure current in red-ox reaction
34
66
() ()Fe CN e Fe CN
−−
+⇔ on the surface of electrode installed on the wall, Fig. 2-1. The
current in a measurement cell (cathode – solution – anode) is proportional to mass transfer
coefficient (1)
IkFSC
∞
=
(1)
where k is mass transfer coefficient, S is area of probe surface; F is Faraday constant; and С
∞
is ion concentration of main flow.
Connection between wall shear stress and current is determined by following dependence
3
AI
τ
=
⋅
(2)
where
τ
is wall shear stress, Pa; I is probe current; A is calibration constant.
Probes for wall shear stress measurements were made of platinum wire with the diameter of
0.3 mm, welded into a glass capillary, Fig. 2-2. The working surface of the probe is the wire
end, polished and inserted flash into the inner surface of the channel. The glass capillary is
glued into a stainless steel tube, fixed by a spacing washer in the working section. Friction
probes were calibrated on the single-phase liquid. The probe for velocity measurements,
Fig. 2-3, is made of a platinum wire with the diameter of 0.1 mm, and its size together with
glass insulation is 0.15 mm. The incident flow velocity is proportional to the square of probe
current
2
vI∼ .
Mass Transfer in Multiphase Systems and its Applications
158
1
2
31
2
3
Fig. 2. The electrodiffusion method.
1 – electrochemical cell; 2 – probe for wall shear stress
measurement; 3 – scheme of the test section for measurement of the mass transfer
coefficient, wall shear stress and liquid velocity
To exclude the effect of entrance region and achieve the fully developed value of mass
transfer coefficient, the probe for measurement mass transfer coefficient should be
sufficiently long. Theoretical and experimental studies of (Shaw & Hanratty, 1977), carried
out by the electrochemical method give the expression for dimensionless length of
stabilization
1
3
4
1.9 10LSc
+
≥⋅ (3)
where
*
LL
υ
ν
+
= , Sc D
ν
=
is Schmidt number, and L is probe length. According to (3), the
length of mass transfer probe should be not less than 70–100 mm.
2.3 Wall shear stress in two-phase flow in a vertical tube
Experiments on mass transfer and hydrodynamics of the two-phase flow were carried out in
the following alteration ranges of operation parameters:
0L
V
Superficial liquid velocity 0.5–3 m/s
Re
L
Reynolds number of liquid 8500–54000
G
G
Mass flow rate of air 0.6–35 g/s
Re
G
Reynolds number of air 3000–140000
0G
V
Superficial gas velocity at
p
=0.1 MPa
2–100 m/s
p
Pressure 0.1–1 MPa
Table 1. Experimental conditions
Mass Transfer in Two-Phase Gas-Liquid Flow in a Tube and in Channels of Complex Configuration
159
Measurement error for the main parameters: for liquid flow rate it is 2%, for air flow rate it
is 4%, for mass transfer coefficient it is 4%, and for wall shear stress with consideration of
friction pulsations it is10%.
Experiments were carried out in the slug, annular and dispersed-annular flows. The main
purpose of investigations on hydrodynamics of the two-phase flows was measurement of
wall shear stress under the same flow conditions as for mass transfer investigations.
Moreover, measurement of friction at the flow of gas-liquid mixtures is of a particular
interest because there are no direct measurements of local friction in the range of high void
fraction for the vertical channels and direct measurement of wall shear stress at high
pressures. The friction probe was located at the distance of 60 calibers from the inlet of the
test section. There is no effect of stabilization zone length at this distance. The currents of
friction and velocity probes were registered simultaneously, Fig. 3. The velocity probe
serves simultaneously for void fraction measurement. It is located in the same cross-section
of the test section as the friction probe. When this probe is in liquid, its readings correspond
to the value of liquid phase velocity. The moments, when the probe current drops to zero,
correspond to the gas phase pass.
0.0
0.2
0.4
0.6
0.8
1.0
0 0.2 0.4 0.6 0.8
0.0
0.2
0.4
0.6
0.8
1.0
0 0.2 0.4 0.6 0.8
τ, s τ, s
1
1
22
y = 0.2 mm
y = 1.2 mm
0.0
0.2
0.4
0.6
0.8
1.0
0 0.2 0.4 0.6 0.8
0.0
0.2
0.4
0.6
0.8
1.0
0 0.2 0.4 0.6 0.8
τ, s τ, s
1
1
22
y = 0.2 mm
y = 1.2 mm
Fig. 3. Oscillograph tracings of wall shear stress (1) and liquid velocity in the film (2)
Oscillograms in Fig. 3 (left) correspond to distance from the wall y = 0.2 mm. In this position
the velocity probe is in liquid during the whole measurement period; void fraction is zero. A
synchronous change in the velocity of liquid in the film and wall shear stress is obvious.
When the probe moves from the wall, void fraction in the flow core increases, and at the
distance of 1–2 mm from the wall it becomes almost equal to one. Fig. 3 (right) corresponds
to distance from the wall y = 1.2 mm. Here we can see rare moments, when the velocity
probe is in liquid. These moments correspond to wave passing. At these particular
moments, wall shear stress increases. Wave passing with simultaneous increase in wall
shear stress causes an increase of velocity in a solid layer of the liquid film. Apparently,
waves propagate over the film surface under the action of dynamic pressure of gas. The
velocity of roll waves on the film surface will depend on wave amplitude and gas velocity.
The motion of wave relative to the solid film layer will cause an increase in the velocity
gradient in this layer. As a result, an additional shear stress appears on the wall, and it is
observed in the form of friction pulsations. In the slug flow friction pulsations are caused by
alternation of gas slugs and liquid plugs moving with the velocity of mixture. The level of
wall shear stress pulsations depends on the flow conditions and void fraction, and it can
reach the value of average friction for low flow rates of liquid. At maximal flow rates of
liquid this value approaches the value typical for the single-phase turbulent flow.
Mass Transfer in Multiphase Systems and its Applications
160
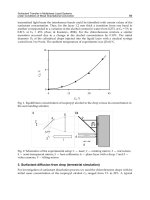
Results on wall shear stress measurements under the atmospheric pressure are shown in
Fig. 4. The effect of superficial velocities of liquid
0L
V and gas
0G
V is shown here. For
constant superficial liquid velocities increase in the superficial gas velocity causes a
nonlinear increase of wall shear stress, Fig. 4 (a). And for constant superficial gas velocities
increase in the superficial liquid velocity results in increase of wall shear stress, Fig. 4 (b).
0
200
400
600
0 20406080100
0
3/
L
Vms
=
2/ms
1/ms
0.5 /ms
,Pa
τ
)a
0
,/
G
Vms
0
200
400
600
0.0 1.0 2.0 3.0
,Pa
τ
)b
0
100 /
G
Vms=
60 /ms
40 /ms
20 /ms
4/ms
0
,/
L
Vms
0
200
400
600
0 20406080100
0
3/
L
Vms
=
2/ms
1/ms
0.5 /ms
,Pa
τ
)a
0
,/
G
Vms
0
3/
L
Vms
=
2/ms
1/ms
0.5 /ms
,Pa
τ
)a
0
3/
L
Vms
=
2/ms
1/ms
0.5 /ms
,Pa
τ
0
3/
L
Vms
=
2/ms
1/ms
0.5 /ms
0
3/
L
Vms
=
2/ms
1/ms
0.5 /ms
,Pa
τ
)a
0
,/
G
Vms
0
200
400
600
0.0 1.0 2.0 3.0
,Pa
τ
)b
0
100 /
G
Vms=
60 /ms
40 /ms
20 /ms
4/ms
0
,/
L
Vms
0
200
400
600
0.0 1.0 2.0 3.0
,Pa
τ
)b
0
100 /
G
Vms=
60 /ms
40 /ms
20 /ms
4/ms
0
,/
L
Vms
Fig. 4. The dependence of the wall shear stress on the gas superficial velocity (a), and on the
liquid superficial velocity (b).
For all studied liquid flow rates at low superficial velocities of gas (
0
210
G
V
=
− m/s) wall
shear stress depends weakly on pressure. At high velocities of air the effect of pressure on
friction becomes significant. A change in pressure causes a change in following values: gas
density
G
ρ
, mass flow rate
0GG
V
ρ
, and dynamic pressure
2
0
GG
V
ρ
.
10
100
10 100 1000 10000
2
0GG
V
ρ
,Pa
τ
0
4/
G
Vms
=
0
2/
G
Vms=
0
10 100 /
G
Vms=−
10
100
10 100 1000 10000
10
100
10 100 1000 10000
2
0GG
V
ρ
,Pa
τ
0
4/
G
Vms
=
0
2/
G
Vms=
0
10 100 /
G
Vms=−
Fig. 5. The influence of the dynamic pressure on wall shear stress
According to analysis of data obtained, the effect of pressure on friction is weak in the
bubble and slug flows, when liquid is continuous phase. Pressure effect is significant in the
annular and dispersed-annular flows (high air velocities), when gas in flow core is
Mass Transfer in Two-Phase Gas-Liquid Flow in a Tube and in Channels of Complex Configuration
161
continuous phase. In the last case the liquid film is thin; therefore, wall shear stress is almost
equal to friction at the film interface, determined by dynamic pressure of gas, Fig. 5.
The well-known homogeneous model is the simplest model for pressure drop prediction in
the two-phase flows. According to this model, the two-phase flow is replaced by the single-
phase flow with parameters
,,
TP TP TP
V
ρ
μ
without slipping between the phases. To determine
viscosity of the two-phase mixture there are several relationships; however, since there is
some liquid on the tube wall at the two-phase flow without boiling, it is more reasonable to
use the liquid phase viscosity instead of
TP
μ
. Experimental data on wall shear stress in the
two-phase gas-liquid flow divided by
0
τ
– wall shear stress for flow liquid with velocity
0L
V
are shown in Fig. 6 (a) depending on the ratio of superficial velocities of phases. Calculation
of relative wall shear stress by the homogeneous model is also shown there. The satisfactory
agreement with calculation by the homogeneous model is observed.
Correlations (Lockhart & Martinelli, 1949) are widely used for prediction of pressure drop in
two-phase flows. Processing of experimental data in coordinates of Lockhart-Martinelli is
shown in Fig. 6 (b) for all studied pressures and liquid and gas flow rates. There is
satisfactory agreement of experimental results with Lockhart-Martinelli correlation.
Fig. 6. Wall shear stress in gas-liquid flow: a) comparison with the homogeneous model;
b) comparison with the model Lockhart – Martinelli.
tt L G
X
τ
τ
= ,
GG
Φ
ττ
= .
The flow of two-phase mixture with high void fraction (the dispersed-annular flow) was
experimentally studied in (Armand, 1946), and the following dependence was derived
()
0
1
1
n
τ
τ
ϕ
=
−
(4)
where
0
τ
is friction in the single-phase flow; and
ϕ
is void fraction. Equation (4) was
obtained with the assumption of the power law for the velocity distribution in the liquid
phase. The friction factor in this case is determined by the Blasius equation with actual
velocity of liquid phase. Results of our experiments show good agreement with this model.
However, there is a range of operation parameters at low velocities of liquid phase in the
bubble flow regime, with an abnormal increase in friction on the tube wall, Fig. 8 (b). Wall
shear stress in this area depends not only on the volumetric quality, but also on the
distribution of gas bubbles in the cross section of the pipe. Mentioned above models do not
predict wall shear stress in such regimes. Therefore, to check the analogy between heat and
Mass Transfer in Multiphase Systems and its Applications
162
mass transfer and wall shear stress, it is necessary to measure the coefficients of heat and
mass transfer and wall shear stress under the same conditions of the two-phase flow.
2.4 Mass transfer in gas-liquid flow in a vertical tube
Mass transfer on the tube wall at forced two-phase flow was studied by the electrochemical
method. In this case mass transfer is identified with ion transfer carried out by the gas-liquid
flow between the test electrode (cathode) and reference electrodes (anode) in the
electrochemical cell. In the diffusion limitation regime the diffusion current depends only on
the rate of ion supply to the test electrode surface and therefore, it is the quantitative
characteristic of mass transfer on a surface, Eq. (1). The diffusion coefficients of reacting ions
in the chosen red-ox reaction correspond to Schmidt number 1500
Sc
≈
. Thickness of
diffusion boundary layer
D
δ
, where the main change in concentration of reacting ions
occurs, is significantly less than thickness of hydrodynamic boundary layer
δ
, i.e.
13
D
Sc
δδ
−
∼ . Application of the electrochemical method for mass transfer measurement has
an advantage over other known methods (Kottke & Blenke, 1970) – it allows measurement
of mass transfer and wall shear stress in one experiment. It is practically important for
determination of interconnection between heat and mass transfer and hydrodynamics in the
two-phase flows. Moreover, application of the electrochemical method for mass transfer
measurement expands significantly the range of physical properties of the studied liquids
towards the higher Prandtl numbers. Relatively thin near-wall liquid layer becomes the
most important zone of the flow, and this allows us to study the role of the two-phase flow
core in the process of heat and mass transfer.
The mass transfer coefficients in the two-phase flow were measured simultaneously with
wall shear stress under the conditions shown in Table 1. The plate of the 5-mm width and
100-mm length was used as the probe. The probe length is sufficient for stabilization of the
diffusion boundary layer (dimensionless length 4000
L
+
> ).
1E-04
6 E-04
110
100
,/km s
0
,/
G
Vms
0
3/
L
Vms
=
0.5 /ms
)a
1E-05
1E-04
5 E-04
0.5
1
2
,/km s
0
,/
L
Vms
0
100 /
G
Vms=
40 /ms
10 /ms
4/ms
0
)b
1E-04
6 E-04
110
100
,/km s
0
,/
G
Vms
0
3/
L
Vms
=
0.5 /ms
)a
1E-04
6 E-04
110
100
110
100
,/km s
0
,/
G
Vms
0
3/
L
Vms
=
0.5 /ms
)a
1E-05
1E-04
5 E-04
0.5
1
2
,/km s
0
,/
L
Vms
0
100 /
G
Vms=
40 /ms
10 /ms
4/ms
0
)b
1E-05
1E-04
5 E-04
0.5
1
2
,/km s
0
,/
L
Vms
0
100 /
G
Vms=
40 /ms
10 /ms
4/ms
0
)b
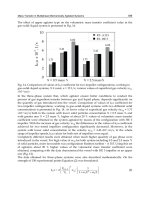
Fig. 7. The dependence of the mass transfer coefficient on the tube wall on superficial gas
velocity (a), and superficial liquid velocity (b)
The effect of superficial gas velocity on mass transfer coefficient is shown in Fig. 7 (а). The
mass transfer coefficient increases with a rise of superficial velocity of gas. The effect of
Mass Transfer in Two-Phase Gas-Liquid Flow in a Tube and in Channels of Complex Configuration
163
superficial gas velocity is almost the same for all studied liquid flow rates. The effect of
superficial velocity of liquid
0L
V on mass transfer coefficient k is shown in Fig. 7 (b). The
lower line corresponds to the flow of liquid. With an addition of gas into the flow the effect
of
0L
V on k decreases in comparison with the single-phase flow. The effect of volumetric
quality
00 0
()
GL G
VVV
β
=+ on the relative mass transfer coefficient for the straight tube is
shown in Fig. 8 (a). It is obvious that for superficial velocities of liquid phase from
0.5 to 1 m/s the relative mass transfer coefficient depends not only on volumetric quality,
but also on liquid flow rate. This ambiguous dependence of mass transfer intensity on the
wall is connected with the character of void fraction distribution over the cross-section in the
bubble flow. The similar effect of volumetric quality on the relative wall shear stress in the
gas-liquid flows in tubes was observed in (Nakoryakov et al., 1973), Fig. 8 (b). It was
explained by an increasing in bubble concentration near the wall at low superficial velocities
of liquid and additional agitation of near-wall layer. Later it was shown on the basis of
simultaneous measurements of wall shear stress and distribution of void fraction and
velocity in an inclined flat channel (Kashinsky et al., 2003). At high velocities of liquid the
level of these perturbations becomes insignificant on the background of high turbulence of
the carrying flow. Under these conditions the relative mass transfer coefficients depend
definitely on the value of void fraction and can be calculated by the known models. Figure 8
illustrates that it is impossible to use the known models, for instance, the homogeneous one
for calculation of mass transfer coefficients and wall shear stress at low void fraction. Data
on heat transfer in the two-phase bubbly flows illustrating an abnormal increase in heat
transfer coefficients under similar conditions are also available (Bobkov et al., 1973).
0
4
8
12
00.2
0.4
0.6 0.8
2
1
0
/
τ
τ
β
1.0
1.5
2.0
2.5
0
0.2
0.4 0.6
0.8
β
0
0.5 /
L
Vms
=
0
23/
L
Vms
=
−
0
1/
L
Vms
=
0
Sh Sh
)a
)b
0
4
8
12
00.2
0.4
0.6 0.8
2
1
0
/
τ
τ
β
1.0
1.5
2.0
2.5
0
0.2
0.4 0.6
0.8
β
0
0.5 /
L
Vms
=
0
23/
L
Vms
=
−
0
1/
L
Vms
=
0
Sh Sh
)a
)b
Fig. 8. Effect of volumetric quality on the relative mass transfer coefficient (a) and wall shear
stress (b):
1 – homogeneous model; 2 – abnormal increasing of the wall shear stress
The relative mass transfer coefficient is shown in Fig. 9 depending on the ratio of superficial
velocities of phases. It is obvious that relative wall shear stress and mass transfer coefficients
depend similarly on relative velocity in the whole studied range of operation parameters. In
these coordinates there are no deviations observed in the zone of low volumetric quality,
Fig. 8. If we compare the relative friction and mass transfer coefficients under the same flow
conditions, when inaccuracies of calculation dependences are excluded, we can see their
qualitative and quantitative coincidence, Fig. 9.
Mass Transfer in Multiphase Systems and its Applications
164
1
10
1 10 100
0
Sh
Sh
00GL
VV
0
τ
τ
1
10
1 10 100
0
Sh
Sh
00GL
VV
0
τ
τ
Fig. 9. Comparison of relative mass transfer coefficient and wall shear stress in two-phase
flow.
It follows from data in Fig. 9 that
00
Sh
Sh
τ
τ
= (5)
i.e., connection between wall shear stress and mass transfer in the two-phase flow is the
same as in the single-phase flow. Hence, the same dependences as for the single-phase flow
can be applied for calculation of mass transfer in the two-phase flow. It is shown in
(Chekhovich & Pecherkin, 1987) that relationship (5) is valid also for heat transfer in the
two-phase gas-liquid flow.
For convective heat transfer at
Pr 1 Kutateladze (1973) has obtained correlation
14
0.115 8 RePrNu
ζ
= (6)
Application of (6) for calculations in the two-phase flows is impossible because the specific
velocity included into the Reynolds number and friction factor are not determined.
However, their product
8 uv
ζ
∗
⋅
= can be found experimentally from wall shear stress
measurements,
L
v
τ
ρ
∗
= . Then 8Re / Revd
ζν
∗
∗
′
⋅= =
and correlation (6) can be applied
for the two-phase flow. For mass transfer it can be written as
14
*
0.115ReSh Sc= (7)
where
kd
Sh
D
=
is Sherwood number;
Sc
D
ν
=
is Schmidt number, D is diffusion coefficient,
ν
is kinematic viscosity of liquid phase. Experimental data on mass transfer in the gas-liquid
flow at
р = 0.1–1 MPa are shown in Fig. 10. The value of friction velocity is determined by
Mass Transfer in Two-Phase Gas-Liquid Flow in a Tube and in Channels of Complex Configuration
165
measurements of wall shear stress simultaneously with mass transfer coefficients. These
data are compared with correlations on convective heat and mass transfer.
1
2
3
*
Re
0
2000
4000
6000
8000
10000
0 4000 8000 12000 16000
Sh
*
Re
1
2
3
1
4
*
3 0.115ReSh Sc−=
0.704
*
Sc
−
−==
1
3
1 0.079 Re
8
Sh Sc
ζ
−=
Sh
1
2
3
*
Re
0
2000
4000
6000
8000
10000
0 4000 8000 12000 16000
Sh
*
Re
1
2
3
Sh
1
2
3
*
Re
*
Re
0
2000
4000
6000
8000
10000
0 4000 8000 12000 16000
Sh
*
Re
1
2
3
1
4
*
3 0.115ReSh Sc−=
2 k = 0.0889 ∙ υ ∙ Sc−
1
3
1 0.079 Re
8
Sh Sc
ζ
−=
–0.704
*
Fig. 10. Comparison of the mass transfer measurements in gas-liquid flow with calculation.
1 – Petukhov, (1967); 2 – Shaw & Hanratty, (1977); 3 –Kutateladze, (1973), Eq. (7).
In the whole range of studied parameters mass transfer coefficients in the two-phase flow
coincide with calculation by correlations for the single-phase convective heat and mass
transfer at
Pr 1 .
For liquid flows with
Pr 1 heat and mass transfer occurs via turbulent pulsations
penetrating into the viscous sublayer of boundary layer (Levich, 1959; Kutateladze, 1973).
Thermal resistance of the turbulent flow core is insignificant. Apparently, the similar
mechanism is kept in the two-phase flow. The measure of turbulent pulsations is friction
velocity
v
∗
. Since the turbulent core of the boundary layer does not resist to mass transfer,
the flow character in the core is not important, either it is the two-phase or the single-phase
flow with equivalent value
v
∗
. Apparently, it is only important is that the liquid layer with
thickness 5
δ
+
> would be kept on the wall. The above correlations for calculation of mass
transfer coefficients differ only by the exponent of Prandtl number, what is caused by the
choice of a degree of turbulent pulsation attenuation in the viscous sublayer, (Kutateladze,
1973; Shaw & Hanratty, 1977). Scattering of experimental data on mass transfer in the two-
phase flows is considerably higher than difference of calculations by available correlations;
thus, we can not give preference to any of these correlations based on these data. It is shown
in (Kutateladze, 1979) that the eddy diffusivity at
Pr 1 changes proportionally to the
fourth power of a distance from the wall in the viscous sublayer, therefore, dependence (6)
should be considered more grounded.
According to analysis of results shown in Figs. 9–10, mass transfer mechanism in the two-
phase flow with a liquid film on the tube wall is similar to mass transfer mechanism in the
Mass Transfer in Multiphase Systems and its Applications
166
single-phase flow and can be calculated by correlations for the single-phase convective mass
transfer, if the wall shear stress is known.
3. Mass transfer in the channels with complex configuration
3.1 Introduction
Many components of the equipment in nuclear and heat power engineering, chemical
industry are subject to erosion and corrosion wear of wetted surfaces. The channels of
complex shape such as various junctions, valves, tubes with abrupt expansion or
contraction, bends, coils, are affected most. The flow of liquids and gases in these channels is
characterized by variations in pressure and velocity fields, by the appearance of zones of
separation and attachment, where flow is non-stationary and is accompanied by generation
of vortices. Analysis of the conditions in which there are certain items of equipment with
two-phase flows, shows that the most typical and dangerous is the impact of drops,
cavitation erosion, chemical and electrochemical corrosion (Sanchez–Caldera, 1988).
The process of corrosion wear in general consists of two stages: formation of corrosion
products and their entrainment from the surface into the flow. The first stage is determined
by the kinetics of the reaction or the degree of mechanical action of the flow on the surface.
The supply of corrosion-active impurities to the surface and entrainment of corrosion
products into the flow are determined by mass transfer process between the flow and the
surface (Sydberger & Lotz, 1982). Due to significant non-uniformity in distribution of the
local mass transfer coefficients the areas with increased deterioration appear on internal
surfaces. Intensification of mass transfer processes caused by the above reasons can lead to a
considerable corrosive wear of equipment parts. Changes in the temperature regimes due to
heat transfer intensification result in the appearance of temperature stresses, which affect
the reliability of equipment operation and the safety of power units (Poulson, 1991; Baughn
et al., 1987). Therefore for safe operation of power plants it is very important to know the
location of areas with maximal mass transfer coefficients in the channels with complex
configuration and the mass transfer enhancement in comparison with the straight pipelines.
The single-phase flow in the bend of various configurations with turn angles 90° and 180°
was studied in (Baughn et al., 1987; Sparrow & Chrysler, 1986; Metzger & Larsen, 1986).
For this purpose the authors used thin film coating with low melting temperature on
internal surface of channels, temperature field measurements, Reynolds analogy for
calculations of mass transfer coefficients based on heat transfer measurements, etc. In
spite of the fact that two-phase coolants are widely used in cooling systems of various
equipment, experimental studies on two-phase flow separation and flow attachment in
channels are limited, (Poulson, 1991; Mironov et al., 1988; Lautenschlager & Mayinger,
1989). Intensity of these processes is determined by flow hydrodynamics within thin near-
wall layers. Therefore the experimental study of these phenomena should be carried out
using the methods which do not distort the flow pattern in the near-wall area in complex
channels. The electrochemical method makes it possible to measure local values of wall
shear stress and mass transfer rate for single-phase and two-phase flows in the channels
with complex configuration.
In this section the results on experimental investigation on distribution of local mass transfer
coefficients in single-phase and two-phase cocurrent gas-liquid flow in vertical channels
with 90° turn and abrupt expansion are presented. The scheme of the experimental setup is
shown on Fig. 1. The scheme of the test sections are presented in Fig. 11.
Mass Transfer in Two-Phase Gas-Liquid Flow in a Tube and in Channels of Complex Configuration
167
In a channel with turn flow the liquid or two-phase medium is fed from bottom and changes
the flow direction at 90°. To provide fully developed flow straight tube of 20 mm diameter
and 2 m long is installed before bend. The channel with the bend is made of two plexiglas
sections, sealed with each other by rubber gaskets and pulled together by bolts, Fig. 11. The
inner diameter of channel is 20 mm and the relative bending radius is
5R =
. Fifteen
electrochemical probes were installed on the test section: 5 – on inner generatrix, 5 – on
middle generatrix, and 5 – on outer generatrix. The probes were installed in the cross-
sections with turn angles
10,28,45,63,80
ϕ
=
. One more probe was installed on a straight
section of the tube in front of the inlet to the channel. This probe measures the local mass
transfer coefficient in a straight tube. The electrochemical probes for measurements of local
mass transfer coefficient were made of platinum wire of 0.3 mm in diameter welded into the
glass capillary, Fig. 2-2. After probe mounting in test section their working surface was
flushed to the internal surface of the channel. The assembled channel was fixed to the
flanges of feed and lateral pipelines.
The channel with sudden expansion was made of plexiglass and enabled to visualize the
flow, as well as to make photo – and video of the process.
Fig. 11. Scheme of the test sections with turn angle 90° and with abrupt expansion
The inner diameter of the channel was
2
42d
=
mm, and the length was 300L
=
mm. The
channel was connected with the stabilization section in such a way that the assembly formed
sudden expansion. The stabilization sections were made of two diameters:
1
d = 10 and
20 mm, correspondingly, and ratio
12
Edd
=
was 1:2 and 1:4 (the exact values of E were
equal to 0.476 and 0.238), and relative channel length was
2
7.1Ld = .
Mass Transfer in Multiphase Systems and its Applications
168
3.2 Mass transfer in a channel with turn flow
In the experiments on measurements of local mass transfer coefficients on the wall of the
channel with the turn flow the volumetric quality
β
was changed within the range from 0 to
0.6, and liquid superficial velocities from 0.5 to 2.6 m/s. At these parameters the main flow
pattern of two-phase mixture is the bubble flow. In certain flow regimes at small liquid flow
rates and maximal gas flow rates the slug fluctuating flow was observed. In order to mark out
the effect of the flow turn angle the data obtained are presented in the form of ratio of the local
mass transfer coefficients in the bend to the local mass transfer coefficient in the straight tube
at the same values of the volumetric quality. Figure 12 shows variation of local mass transfer
coefficient depending on the turn angle for two values of liquid superficial velocity: 0.5 m/s
and 2.6 m/s (Pecherkin & Chekhovich, 2008). Data for the single-phase flow are shown in the
same figure. In case of single-phase flow the first probe on inner generatrix (
ϕ
=
10°) indicates
approximately the same value as in the straight tube independently of the flow rate. Further,
as far as the turn angle increases the mass transfer coefficient diminishes and then slightly
increases at the channel outlet. Probably, a significant decrease in mass transfer coefficients is
associated with the flow separation in this area. The addition of gas into the liquid flow
essentially changes distribution of the local mass transfer coefficient. In the first half of the
channel at the turn angles from 10° to 45° the increase in mass transfer coefficients is observed
as compared with that in straight tube. The increase in mass transfer coefficients comparing
with the straight tube reaches up to 40% at low liquid flow rates, and approximately 20% at
high flow rates. At the channel outlet at a horizontal part of the bend the mass transfer
coefficients decrease comparing with the straight tube.
On the middle generating line, as a single-phase liquid flows, the intensification reaches 60%
at the bend outlet. The mass transfer character in gas-liquid flow is the same as in the single-
phase flow. As compared with the straight tube intensification makes up 10-20% at low
liquid flow rates and 40-50% at high liquid flow rates depending on volumetric quality.
On the external generating line, for small velocities of single-phase liquid flows at the
channel inlet, the mass transfer coefficient remains the same as in a straight tube. At the
outlet of the bend mass transfer enhancement reaches 30%. An increase of volumetric
quality causes rapid decrease in mass transfer coefficient at the inlet to the channel, and it
reaches the minimal value at
ϕ
=
10-30°, and then smoothly increases downstream to the
channel outlet. At high liquid superficial velocities maximal mass transfer coefficients are
observed at the turn angles of 50-70° and increase with volumetric quality.
The highest mass transfer enhancement in the single-phase flow is observed at the channel
outlet on the middle generatrix. The maximal mass transfer coefficient for these areas can be
expressed by the following relation
7
1
8
4
0.0287ReSh Sc= (8)
Comparison of (8) with correlation for wall mass transfer coefficients in the coil (Abdel-Aziz
et al., 2010) shows satisfactory agreement. Clearly expressed local maximum in a two-phase
flow is situated on the inner generatrix within the zone of
ϕ
=
10–45°, and the absolute
maximum is observed at the channel outlet on the middle and outer generatrices.
Figure 13 shows the effect of volumetric quality on distribution of local mass transfer
coefficients in the bend. The data are presented in the form of ratio of mass transfer
coefficients for gas-liquid flow to the mass transfer coefficients for single-phase flow at the
same turn angles.
Mass Transfer in Two-Phase Gas-Liquid Flow in a Tube and in Channels of Complex Configuration
169
0.6
0.8
1.0
1.2
1.4
1.6
060
30
90
0.2
0.6
1.0
1.4
1.8
0306090
middle generating line
0.6
0.8
1.0
1.2
1.4
1.6
0306090
0
0.4
0.8
1.2
1.6
0306090
internal generating line
0
0.5 /
L
Vms=
0
2.6 /
L
Vms
=
0.6
0.8
1.0
1.2
1.4
1.6
0306090
0.2
0.6
1.0
1.4
0306090
external generating line
β
β
0;−
0.1;
−
0.17;
−
0.3;
−
0.5;
−
0.5;−
0.3;
−
0;
−
T
Sh Sh
ϕ
0.6
0.8
1.0
1.2
1.4
1.6
060
30
90
0.2
0.6
1.0
1.4
1.8
0306090
middle generating line
0.6
0.8
1.0
1.2
1.4
1.6
0306090
0.6
0.8
1.0
1.2
1.4
1.6
0306090
0
0.4
0.8
1.2
1.6
0306090
0
0.4
0.8
1.2
1.6
0306090
internal generating line
0
0.5 /
L
Vms=
0
2.6 /
L
Vms
=
0.6
0.8
1.0
1.2
1.4
1.6
0306090
0.2
0.6
1.0
1.4
0306090
external generating line
β
β
0;−
0.1;
−
0.17;
−
0.3;
−
0.5;
−
0.5;−
0.3;
−
0;
−
T
Sh Sh
ϕ
Fig. 12. The influence of the turning angle on the relative mass transfer coefficient in a bend.
At low liquid flow rate,
0
0.5
L
V = m/s, on the inner generatrix at
ϕ
=
45° mass transfer
intensification is 5-fold higher as compared to that for the single-phase flow, Fig. 13 (a).
At higher liquid superficial velocity
0
2.6
L
V = m/s, intensification reaches 60-80% at high
volumetric quality, Fig. 13 (b).
Mass Transfer in Multiphase Systems and its Applications
170
0.0
2.0
4.0
6.0
0 0.2 0.4 0.6 0.8
1
2
3
0.2
0.6
1.0
1.4
1.8
2.2
0 0.2 0.4 0.6
1
2
3
0
Sh Sh
0
Sh Sh
β
β
0
0.5 /
L
Vms=
0
2.6 /
L
Vms
=
)a
)b
0.0
2.0
4.0
6.0
0 0.2 0.4 0.6 0.8
1
2
3
0.2
0.6
1.0
1.4
1.8
2.2
0 0.2 0.4 0.6
1
2
3
0
Sh Sh
0
Sh Sh
β
β
0
0.5 /
L
Vms=
0
2.6 /
L
Vms
=
0.0
2.0
4.0
6.0
0 0.2 0.4 0.6 0.8
1
2
3
0.2
0.6
1.0
1.4
1.8
2.2
0 0.2 0.4 0.6
1
2
3
0
Sh Sh
0
Sh Sh
β
β
0
0.5 /
L
Vms=
0
2.6 /
L
Vms
=
)a
)b
Fig. 13. The influence of the volumetric quality on the relative mass transfer coefficient in a
bend. a – (1) Internal generating line,
45
ϕ
°
= ; (2) middle generating line, 80
ϕ
°
= ; (3) external
generating line,
80
ϕ
°
= ; b – (1) Internal generating line, 45
ϕ
°
= ; (2) middle generating line,
63
ϕ
°
= ; (3) external generating line, 63
ϕ
°
= .
The character of relationship between the local mass transfer coefficients and the volumetric
quality is the same as in the straight tube, Fig. 8. Very likely, that due to the curvature effect
and formation of vortex flow on inner generatrix of the tube surface, concentration of gas
bubbles increases and their motion determines mass transfer intensity on the wall in this
area. On the middle and outer generatrices the relative mass transfer coefficient depends
only on the void fraction and it is practically irrespective of liquid flow rate and turn angle.
On middle and outer generatrices the effect of void fraction consists mainly in increase of
actual velocity of liquid near the wall due to flow swirl.
3.3 Mass transfer in a channel with abrupt expansion
3.3.1 Gas-liquid flows in a channel with abrupt expansion
The flow in the channel behind a backward facing step is characterized by the fact that at
some distance from the step the heat and mass transfer coefficients may exceed by an order
those in the straight smooth tube. The increase in heat or mass transfer coefficients is
observed in the area of shear layer attachment to the tube wall. This area is usually situated
at a distance of 5 to 15 step heights (Baughn et al., 1984; 1989). Then the heat and mass
transfer coefficients gradually decrease and approach the value typical for fully developed
flow in a tube. The qualitative behavior of the heat and mass transfer coefficients in single-
phase and two-phase flows (Chouikhi et al. 1987) is similar. The measurements of local void
fraction distribution and velocity components across the channel near the expansion cross-
section have shown that there is a correlation between these values (Bel Fdhila et al., 1990).
In present work visual observations of the flow patterns were carried out as well as
measurements of local mass transfer coefficients in channels with abrupt expansion.
Volumetric quality
β
was varied within the range from 0 to 0.6, liquid superficial
velocity
2L
V
was changed from 0.11 to 0.66 m/s. Figure 14 presents the photos of two-phase
flow in a channel with abrupt expansion. The lower pictures show the flow near the outlet
from the tube of the smaller diameter. Upper pictures show the flow in the upper part of the
channel of the larger diameter. At low void fraction mainly bubble flow regime was
observed, Fig. 14, left photo.
Mass Transfer in Two-Phase Gas-Liquid Flow in a Tube and in Channels of Complex Configuration
171
V
L1
=0.46 m/s
V
G1
=0.27m/s
V
L1
=0.46 m/s
V
G1
=3.4 m/s
V
L1
=1 m/s
V
G1
=11 m/s
V
L1
=0.46 m/s
V
G1
=0.27m/s
V
L1
=0.46 m/s
V
G1
=3.4 m/s
V
L1
=1 m/s
V
G1
=11 m/s
Fig. 14. View of two-phase gas-liquid flow in channel with abrupt expansion.
At an increase in expansion ratio ( 1 : 4
E
=
) the bubble flow exists at higher liquid velocities
and lower gas flow rates. At an increase of void fraction we observed the churn flow, Fig. 14,
in center. The flow pattern changes along the height of a channel. The zone near the
expansion cross-section is free of gas bubbles, and this zone is significantly greater for
expansion ratio 1 : 4
E
=
. Here rotating flow of liquid is observed. Direction of rotation is
changed periodically. In the zone of 1 to 3-4 tube diameters near the wall we observed the
vortex flow and downflow, while stabilization of the upward flow takes place just at the
channel outlet. The size of bubbles depends on expansion ratio. The smaller is the diameter
of the tube where the outflow occurs, the smaller is the bubbles diameter. At an increase of
Mass Transfer in Multiphase Systems and its Applications
172
void fraction in the channel we observed the foamed flow with large-scale bubbles, while at
very high outflow velocities the flow detaches from the channel walls, Fig. 14, right photo.
After separation of the flow from the pipe wall the two-phase jet in the center of the channel
was observed. Near the outlet from the test section the jet diameter increases, and the certain
portion of liquid drops out to the channel walls and flows down as a film or rivulets. The
location of flow attachment may move along the channel height depending on the velocity
of jet. A decrease in flow rate of one of the components at constant flow rate of another
component leads to step-like reverse transition: now the two-phase flow fills up the whole
cross-section of the channel along its height.
Figure 15 (a) presents gas flow rates corresponding to transition to the jet flow depending on
liquid mass flow rate. The less is liquid flow rate the larger gas flow rate is required to
provide the transition to the jet flow. The kind of transition shows the change in the balance
of inertial and mass forces in the flow.
Fig. 15. The correlation between mass flow rate of liquid and gas phases at the boundary of
the jet flow transition
The similar phenomenon is observed at counter-current two-phase flow in a vertical tube.
Increasing gas flow rate over the critical value causes flooding. Though the flooding
mechanisms and mechanisms of transition to jet pattern most likely are different,
nevertheless the transition criteria in both cases may be the same. Froude numbers or their
combinations may serve as dimensionless criteria to characterize interaction between the
gravity forces and inertial forces. Wallis, (1969) proposed the empirical correlation for
description of flooding process
11
22
GL
VaVc
∗∗
+
=
(9)
where
()
G
GG
LG
VV
gD
ρ
ρ
ρ
∗
=
−
;
()
L
LL
LG
VV
gD
ρ
ρ
ρ
∗
=
−
, ,
LG
VV are superficial liquid and gas
velocities;
,
LG
ρ
ρ
are densities of liquid and gas. We obtained a = 1.02, с = 0.84 for
*
0.4
L
V <
and
a = 0.092, с = 0.29 for
*
0.4
L
V > , Fig. 15 (b). More detailed investigations are needed to
study the regime of two-phase jet flow in a channel with abrupt expansion.
Mass Transfer in Two-Phase Gas-Liquid Flow in a Tube and in Channels of Complex Configuration
173
3.3.2 Mass transfer on the wall of a channel with abrupt expansion
The results on measurements of mass transfer coefficients on the wall of channel with
abrupt expansion in gas-liquid flow are presented in this section. Fifteen probes were
installed to measure the local mass transfer coefficients at the internal surface. Along the
initial section of the channel with expansion the probes were installed with the interval of 14
mm, and at the outlet of the channel, where the flow becomes stable, the interval was
increased up to 42 mm, Fig. 11. The design and the size of electrochemical probes for
measurements of the local mass transfer coefficients were similar to those used for
measurements of wall shear stress, Fig. 2 - 2.
Fig. 16. Distribution of local mass transfer coefficient along the channel with abrupt
expansion
Figure 16 represents the dimensionless mass transfer coefficient
Sh depending on
dimensionless length of the channel for various volumetric quality and diameter
enlargement (Pecherkin et al., 1998). Distribution of the local mass transfer depends both on
liquid velocity and volumetric quality
β
. Mass transfer coefficient depends on the length in
a way similar to that for the single-phase flow, though there may appear local maximums in
mass transfer depending on volumetric quality. The effect of volumetric quality becomes
apparent in different ways for various liquid flow rates. At low liquid flow rates there are
two local maximums at the distances of 1 and 2 channel diameters. In the second half of the
channel the mass transfer coefficient practically does not change along the length at 1 : 2
E = .