Báo cáo hóa học: " Rapid thermal annealing and crystallization mechanisms study of silicon nanocrystal in silicon carbide matrix" doc
Bạn đang xem bản rút gọn của tài liệu. Xem và tải ngay bản đầy đủ của tài liệu tại đây (814.25 KB, 7 trang )
NANO EXPRESS Open Access
Rapid thermal annealing and crystallization
mechanisms study of silicon nanocrystal in
silicon carbide matrix
Zhenyu Wan
*
, Shujuan Huang, Martin A Green, Gavin Conibeer
Abstract
In this paper, a positive effect of rapid thermal annealing (RTA) technique has been researched and compared with
conventional furnace annealing for Si nanocrystalline in silicon carbide (SiC) matrix system. Amorphous Si-rich SiC
layer has been deposited by co-sputtering in different Si concentrations (50 to approximately 80 v%). Si
nanocrystals (Si-NC) containing different grain sizes have been fabricated within the SiC matrix under two different
annealing conditions: furnace annealing and RTA both at 1,100°C. HRTEM image clearly reveals both Si and SiC-NC
formed in the films. Much better “degree of crystallization” of Si-NC can be achieved in RTA than furnace annealing
from the research of GIXRD and Raman analysis, especially in high-Si-concentration situation. Differences from the
two annealing procedures and the crystallization mechanism have been discussed based on the experimental
results.
Introduction
Shockly and Queisser [1] have calculated the upper the-
oretical efficiency limitation for on p-n junction silicon
solar cell as 30%. In order to further obtain a higher
efficiency, multi-junction solar cells with different mate-
rials have been designed and fabricated [2]. However, to
create different band gap solar cell layers, expensive and
perhaps toxic materials have to be involved and this is
assumed to be the main obstacle for the wide use of
multi-junction solar cell. As a resul t, in recent years, the
theory of “all silicon multi-junction solar cell” has been
developed [3,4], and silicon nanocrystals (Si-NCs) in var-
ious dielectric materials study have gained researchers’
interests in all silicon multi-junction solar cell applica-
tions [5]. Due to quantum size effect, three-dimensional
quantum-confined silicon dots have been proven to be
able to tune the bandgap in a wide range by controlling
the dot size. The bandgap of each cell layer can be
adjusted by the wavelength of different light spectrum
and all silicon multi-junction solar cells with high effi-
ciency can be well expected.
Many research efforts have been allocated in looking
for a better dielectric material as a matrix to embed the
Si-NC. Comparing the band gap with different materials
such as silicon dioxide (approximately 8.9 eV) and sili-
con nitride (approximately 4.3 eV), the band gap of sili-
con carbide (approximately 2.4 eV) is the lowest [5].
The small SiC bandgap increases the electron tunnelling
probability. Increased carrier transportation performance
and greater current can be expected from these multi-
junction solar cells. Kurokawa et al. and M. Künle et al.
[6,7] have reported the fabrication of good quality Si-
NC in SiC matrix film by plasma-enhanced chemical
vapor deposition (PECVD) system. However, the main
disadvantages of PECVD deposition are extremely time
consuming in superlattice structur e and in toxic, explo-
sive, and expensive gases involved, such as silane (SiH
4
),
monomethylsilane (MMS), methane (CH
4
), and hydro-
gen (H
2
) etc. In our group, Si-NCs in a SiC matrix
deposited by a sputtering process have been intensively
investigated in order to overcome the dis advantages
listed above.
In our previous research, Si-NCs are fabricated by
post-deposition annealing of Si-rich SiC (SRC) layer in a
nitrogen furnace for a long time (more than 1 h) [8,9].
Both Si and SiC NC have been clearly observed in x-ray
diff raction (XRD) and transmission electron microscopy
* Correspondence:
ARC Photovoltaics Centre of Excellence, University of New South Wales
(UNSW), Sydney, Australia
Wan et al. Nanoscale Research Letters 2011, 6:129
/>© 2011 Wan et al; licensee Springer. This is an Open Access article distributed under the terms of the Cre ative Comm ons Attribution
License ( which permits unrestricted use, distribution, and reproducti on in any medium,
provided the original work is properly cited.
(TEM) measurements when a nnealing temperature rise
above 900°C. After annealing, SiC-NCs in beta phase (b-
SiC) as well as amorphou s Si are found surrounding the
Si-NC. Rapid thermal annealing (RTA) has been consid-
ered as a primary annealing technique in semiconductor
industry because of the low energy cost and better crys-
tallization result [10,11] In nanocrystalline system, better
crystallization has also been reported in RTA because
heating of the structure is caused by light directly
absorbed in the layers [12]. In this paper, we compare
two annealing techniques: conventional furnace anneal-
ing and RTA upon Si and SiC nanocrystalline system,
and subsequently research the differences of structural
characterization. By investigating the crystallization dif-
ferences, we try to explain the crystallization mechanism
of Si and SiC-NC.
Experimental details
The SRC films are deposited by magnetron co-sputter-
ing a Si and a SiC target at room temperature using a
multi-target sputtering machine (AJA International,
ATC-2200, North Scituate, MA, USA). Radio frequency
(RF, 13.56 MHz) power supplies are connected to the
targets. The Si concentration in the SRC films is con-
trolled by adjusting the RF supply power connected to
the Si target. The base pressure of the main chamber of
deposition was 8.0 × 10
-7
Torr and the working pressure
is 2.0 × 10
-3
Torr. Table 1 includes the sample details
reported in this paper.
After deposition, either furnace or RTA annealing is
carried out for the purpose of Si precipitation from the
matrix. The furnace annealing is processed i n nitrogen
(N
2
) ambient at 1,100°C for 1 h with 40 m in ramping-
up time from 500°C to 1,100°C. The RTA annealing is
also processed in N
2
ambient at 1,100°C, but with a very
short ramping time of 45 s in the same temperature
range and much shorter annealing time of 2 min.
A detailed temperature ramping profile is listed in Table 2.
The structural properties including the nanocrystal
size, shape, and phase separation are studied using TEM
(Phillips CM200) at 200 kV. The crystalline properties
are evaluated by grazing inci dence XRD using a Philips’s
X’ Pert Pro material research diffraction system at a
voltage of 45 kV and a current of 40 mA, using Cu K a
radiation (l = 1.5418 Å). The glancing angle of the inci-
dent x-ray beam is optimised by omega scan and set
between 0.2° and 0.4° The nanocry stal size is estimated
using the Scherrer equation. Additional structural prop-
erties such as phase separation and crystallinity are stu-
died by Raman spectroscopy (Renishaw, RM2000) in
backscattering configuration. The power of the Ar ion
laser (514 nm) was reduced below 8 mW to avoid local
crystallization by laser beam.
Results and discussion
TEM study
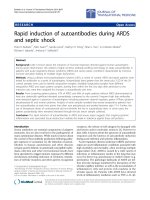
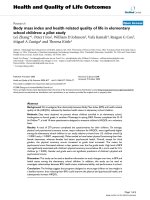
Figures 1 and 2 show the plan view TEM images of the
sample SRC50 after RTA and furnace annealing. The
volume percentage of Si over SiC is 50 v% from RF
sputter rates of Si and SiC are calibrated by crystal
thickness monitor. Both images clearly reveal the forma-
tion of NC. The N C which is circled by solid lines with
a fringe spacing 3.1 Å corresponds to Si (111) lattice
plane; and the dash-line which is circled with a fringe
spacing of 2.5 Å corresponds to the lattice plane of
b-SiC (111) [8]. The nanocrystal size and shape
are similar in both annealing conditions, with Si size
6-7 nm and SiC size 2-3.5 nm.
X-ray diffraction investigation
The crystalline properties of samples annealed by RTA
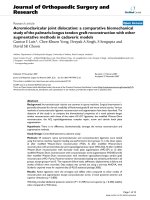
and furnace are studied by XRD. Figure 3 shows a wide
scan XRD curve of the sample SRC60 annealed by fur-
nace. The Bragg peaks can be assigned to cubic Si nano-
crystal as well as b-SiC nanocrystal, as shown by the
indexes in the graph. This suggests the formation of
both Si and b-SiC-NC which is consistent to TEM
results.
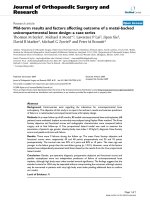
Figure 4 compares the XRD spectra of the samples
with differ ent Si concentrations after 1,100 C annealing.
All the annealed samples show clear Bragg peaks from
Si and b-SiC crystallization. In addition, the intensity of
Si Bragg peak increases while the SiC peak decreases
with the increasing of Si concentration. This phenom-
enon can be explained by more amorphous silicon (a-Si)
is involved in precipitation and crystallization, as a
result, higher crystallization volume of crystallized-Si
can be achieved. This reason can also be used to explain
SiC peaks: when Si conc entration increase, SiC concen-
tration decreases, and the volume of SiC crystallinity
decreases due to less available a-SiC.
It should be noted that there is no Bragg peak of
b-SiC phase detected from a sputtered stoichiometric
SiC film, indicating that SiC film does not crystallize
under1,100°Cannealingcondition itself due to i nsuffi-
cient kine tic energy [13]. That both Si and SiC-NC
appear in silicon-rich carbide samples could be due to
Table 1 Sample names and deposition conditions
Sample
name
Silicon-rich
concentration
(volume percentage v
%)
Sample structure/thickness
(nm)
SRC80 80 Single layer/approximately 600
SRC70 70 Single layer/approximately 600
SRC60 60 Single layer/approximately 600
SRC50 50 Single layer/approximately 600
SiC 0 Single layer/approximately 600
Wan et al. Nanoscale Research Letters 2011, 6:129
/>Page 2 of 7
the Si inducement. Some researchers reported sputte red
Si starts to crystallize at 900°C [14]. Si and SiC-NC
could be observed after annealing at 900°C in our pre-
vious research [8,9]. From these results, we propose that
at annealing temperatures of 900°C, the formation of Si-
NC [8], act as nuclei for SiC nanocr ystal growth. As a
result, both Si and SiC diffr action peaks could be
observed in silicon-rich carbide samples while no SiC
peak observed in sputtered stoichiometric SiC film.
The full width at half maximum (FWHM) of each
XRD peak were carefully measured, and the nanocrystal
size was calculated by Scherr formula,
Gk=
/( )cosΔ 2
(1)
where l is the wavelength of the X-rays, θ is the Bragg
diffraction angle at the peak position in degrees, Δ(2θ)is
the FWHM in radian, and k is a correction factor. The
value of k is usually chosen to be 0.9 for Si films. Nano-
crystal sizes from RTA and furnace annealing samples
are calculated by this formula and are indicated and
compared in Figure 5.
In both RTA and furnace annealing samples, we can
see that when Si concentration increases, Si grain size
which is calculated from formula (1) also tends to
increase. But the change is not significant until the Si
concentration reaches 60 v% and grain size in furnace
annealing samples tends to increase faster in high Si
concentration (>70 v%). The same trend can also be
observed in SiC-NC, the grain size of SiC crystal start to
decrease when Si concentration falls below 60 v%.
The degree of Si crystallization can be estimated by
the relative intensity of XRD peaks [15]. Figures 6 and 7
comp are the RTA and the furnace annealing samp les in
different concentration. The relative intensity of two Si
peaks (at 28.4°) is almost the same under low Si concen-
tration at 50 v% (Figure 6). The intensity difference
changes significantly when Si concentration increased to
80 v% (Figure 7). However, the difference of SiC peak
intensity barely changes in both Si concentrations.
We then further measure the intensity of Si peak from
XRD result carefully as shown in Figure 8. Under low Si
concentration range (50 and 60 v%), Si peak intensity of
samples annealed by either RTA or furnace are almost
the same. The intensity of RTA samples increased dra-
matically to two to three times higher compared to the
furnace annealing samples when Si concentration
increased above 60 v%.
Figure 1 HRTEM plan view of image of SRC50 sample annealed
by RTA.
Table 2 Temperature ramping profile for conventional furnace annealing and RTA
Room temperature,
approximately 500°C
500°C to
approximately 900°C
900°C to
approximately 1,100°C
1,100°C
Conventional furnace annealing N/A 25 min 15 min 60 min
RTA 15 min 30 s 15 s 2 min
Figure 2 Cross-section TEM image of SRC50 sample annealed
by furnace.
Wan et al. Nanoscale Research Letters 2011, 6:129
/>Page 3 of 7
Raman investigation
Figure 9 shows Raman spectrum of furnace annealed
SRC60 sample. As we can see, the peak within the range
of 400 to 600 cm
-1
can be de-convoluted to two main
components: the peak centred at approximately 511 cm
-1
corresponds to Si nanocrystal phase and the peak centred
at approximately 480 cm
-1
corresponds to the amorphous
Si phase [6]. The hump at 400 cm
-1
maybeassignedas
partial breakdown of Raman selection rules [16]. Mean-
while, two small SiC peaks are also observed at approxi-
mately 800 and 940 cm
-1
attributed to the TO and LO of
cubic and hexagonal SiC poly types [17,18].
The degree of crystallization of Si nanocrystal could also
be evaluated by calculating the intensity ratio of the crys-
talline Si peak and amorphous Si peak: I
C-Si
/I
a-Si
[6]. Figure
10 shows the relation of Si peak intensity ratio and silicon
concentration in the SRC layers. The results indica te, for
both RTA and furnace annealing conditions, when Si
concentration increases, higher degree of silicon crystalli-
zation and less residual amorphous Si tend to be observed.
Meanwhile, the samples from RTA show higher degree of
Si crystallization in the matrix, comparing to the furnace
annealing, especially in high Si concentration level.
Discussion of structural difference and crystallization
mechanism
RTA is considered as a positive annealing method in Si/
SiC nanocrystalline system compared with furnace
annealing. For the purpose of quantitative investigation,
we calculate the degree of crystallization in all Si con-
centration range by comparing the RTA and furnace
value ratio (D
RTA
/D
furance
)fromtheresultofbothXRD
Si peak intensity (Figure 8) and Raman peak intensity
ratio (Figure 10).
As shown in Table 3, from XRD analysis, the ratio
remains at 1 when Si concentration is low (50-60 v%).
Figure 3 Wide scan XRD curve of the sample SRC60 annealed
by furnace.
Figure 4 XRD c urves of the s amples with di fferent Si
concentrations after furnace annealing.
Figure 5 Si and SiC grain size from RTA and furnace anneal ing
in different Si concentration.
Figure 6 XRD curve comparison of SRC50 sample by RTA and
furnace annealing.
Wan et al. Nanoscale Research Letters 2011, 6:129
/>Page 4 of 7
The value comes to 2.4 under 70 v% Si concentrations
and 2.8 under 80 v% Si concentrations. From Raman
analysis, we can see the ratio stays also around 1 when
in low Si concentration range (50-60 v%), and 2.2 in 70
v% Si concentration and 2.6 in 80 v% Si concentration.
The Si degree of crystallization ratio behaves in a
similar ov erall increase trend from b oth XRD and
Raman results. It’ s further confirmed that better Si
nanocrystal crystallization could be obtained from RTA
since more Si-NC are formed and less amorphous Si
remained, especially under high Si concentration.
There are two p ossible crystal mechanisms to explain
the main structural difference coming from RTA and
furnace annealing procedure as we discussed above:
1. Si-NC have not reached nucleation equilibrium in RTA
In classical theory of nucleat ion [19], free energy related
to the formation of nanocrystal with radius r in an
amorphous matrix can be described as:
ΔΔGrGr
total
3
phase
2
4/3 4 =+
(2)
Here, ΔG
total
isthedifferenceinfreeenergybetween
the nanocrystal phase and the matrix phase, and g is the
interface energy, ΔG
phase
is the difference in free energy
between the nanocrystal phase and the matrix phase.
For negative ΔG
phase
, the critical nanocrystal size
r
G
*
phase
2
=
-
Δ
(3)
Figure 7 XRD curve comparison of SRC80 sample by RTA and
furnace annealing.
Figure 8 Si peak intensity of different Si concentration by RTA
and furnace annealing.
Figure 9 Raman spectrum of SRC60 after furnace annealing.
Figure 10 Calculated Si peak intensity ratios (I
C-Si
/I
a-Si
)in
different Si concentration.
Wan et al. Nanoscale Research Letters 2011, 6:129
/>Page 5 of 7
When r <r*, because of the decrease o f the total free
energy, NC tend to reduce in size and vanish in equili-
brium. On the other hand, when r >r*, the NC must
grow in size to reduce the total free energy until they
reach equilibrium.
In our situation, obtaining reliable g is extreme ly diffi-
cult, but J. K. Bording’s group predicted the r* theoretically
to be about 2 nm [20] for crystals and this value matches
well with all our measured average SiC-NC size value in
Figure 5. Basing on this theory, we may conclude, espe-
cially in high Si concentration, Si-NC may have not
reached the equilibrium before the annealing temperature
(1,100°C) drops in RTA. So, Si-NC whose grain size less is
than 2 nm may have not completely vanished, thus more
Si-NCs would be observed. The grain size increase trend
in Figure 5 can further prove this point, we can see in high
Si concentration region (70-80 v%) the Si grain size in
RTA is smaller than furnace. This means Si- NCs in RTA
could still grow up compare with samples of same Si con-
centration in furnace, which indicates Si-NC have not
reached the equilibrium in RTA.
2. Less SiC-NC pre-existed during ramping-up period before
Si nanocrystal grow fast at high temperature
This explanation relies on the crystall ization sequenc e.
For both annealing techniques, the peak annealing tem-
peratu res (1,100°C) are the same, however the duratio n
of temperature raise (from 500-1,100°C) is different. For
the RTA system, it takes 45 s to increase but 40 min are
needed to ramp up in furnace annealing situation. We
believe the time period of temperature ramping up is
crucial to Si crystallization process. From the result of Si
degr ee of crystallization, much larger quantity of Si-NC
are observed in RTA, which means Si-NC can be crystal-
lized better in short ramping ti me situation. It may be
because of the existence of SiC-NC before Si nanocrystal
fast grows. As discussed earlier, Si nanocrystal start to
form around 900°C, meanwhile, SiC-NC are induced to
crystallize. Short ramping-up time in RTA may lead to
less SiC nanocrystal before 1,100°C. As soon as the tem-
perature rise up to Si fast crystallization point at 1,100°C,
more Si-NC could be formed in RTA due to the
decrease in SiC-NC.
Conclusion
Si-rich SiC (SRC) layers with various Si concentrations
were prepared by co-sputtering Si and SiC targets. Fur-
nace annealing and RTA tec hniques were compared by
studying the precipitation andcrystallizationofSiand
SiC-NC with varying Si/SiC ratio after annealing.
Si and SiC-NC were observed by TEM in both furnace
and RTA annealed at 1,100°C. SiC-NC are believed to
be induced by Si nuclei from XRD spectra analysis.
Meanwhile, when silicon concentration raised from 50
to 80 v%, increased size of Si nanocrystal (from 6 nm to
10 to approxi mately 12 nm) are observed but SiC nano-
crystal size remains same (2 to approximately 4 nm).
Compared with furnace annealing, RTA samples
reveal a better degree of crystallization on Si nanocrystal
and less amorphous Si residual. More Si-NCs are
detected by XRD and Raman analysis for this approach.
Thi s could possibly be explained by Si-NC not reaching
nucleation equilibrium in the RTA or that l ess SiC-NC
are present during the ramping-up period which
increases Si-NC crystallization at high temperatures.
Acknowledgements
The authors thank other members of the Third Generation Group at the ARC
Photovoltaics Centre of Excellence for their contributions to this project. This
work was supported by the Australian Research Council ARC via its Centres
of Excellence scheme.
Authors’ contributions
ZW designed and carried out all the experiments as well as the article
writing. SH produced all the TEM images. SH, MAG and GC all offered
significant financial and technical support throughout the whole project.
Competing interests
The authors declare that they have no competing interests.
Received: 10 November 2010 Accepted: 10 February 2011
Published: 10 February 2011
References
1. Shockley W, Queisser HJ: Detailed balance limit of efficiency of p-n
junction solar cells. Journal of Applied Physics 1961, 32(3):510-519.
2. King RR, Law DC, Edmondson KM, Fetzer CM, Kinsey GS, Yoon H, Sherif RA,
Karam NH: 40% efficient metamorphic GaInP/GaInAs/Ge multijunction
solar cells. Applied Physics Letters 2007, 90(18):183516.
3. Conibeer G, Green M, Cho EC, König D, Cho YH, Fangsuwannarak T,
Scardera G, Pink E, Huang Y, Puzzer T, Huang S, Song D, Flynn C, Park S,
Hao X, Mansfield D: Silicon quantum dot nanostructures for tandem
photovoltaic cells. Thin Solid Films 2008, 516(20):6748-6756.
4. Conibeer G, Green M, Corkish R, Cho Y, Cho EC, Jiang CW,
Fangsuwannarak T, Pink E, Huang Y, Puzzer T, Trupke T, Richards B,
Shalav A, Lin KL: Silicon nanostructures for third generation photovoltaic
solar cells. Thin Solid Films 2006, 511-512:654-662.
5. Jiang C, Green MA: Silicon quantum dot superlattices: Modeling of
energy bands, densities of states, and mobilities for silicon tandem solar
cell applications. Journal of Applied Physics 2006, 99(11):114902.
6. Kurokawa Y, Miyajima S, Yamada A, Konagai M: Preparation of
nanocrystalline silicon in amorphous silicon carbide matrix. Japanese
Journal of Applied Physics Part 2: Letters 2006, 45:37-41.
Table 3 Degree of crystallization from RTA and furnace annealing in all Si concentration
Si concentration
(50 to approximately 60 v%)
Si Concentration
(70 v%)
Si Concentration
(80 v%)
++Degree of crystallization: D
RTA
/D
furance
(from XRD) 1 2.4 2.8
Degree of crystallization: D
RTA
/D
furnace
(from Raman) 1 2.2 2.6
Wan et al. Nanoscale Research Letters 2011, 6:129
/>Page 6 of 7
7. Künle M, Hartel A, Löper P, Janz S, Eibl O: Preparation Of Si-Quantumdots
In Sic: Single Layer Vs Multi Layer Approach. 24th European Photovoltaic
Solar Energy Conference Hamburg, Germany; 2009.
8. Song D, Cho EC, Conibeer G, Huang Y, Flynn C, Green MA: Structural
characterization of annealed Si1-x Cx/SiC multilayers targeting formation
of Si nanocrystals in a SiC matrix. Journal of Applied Physics 2008,
103(8):83544.
9. Song D, Cho EC, Cho YH, Conibeer G, Huang Y, Huang S, Green MA:
Evolution of Si (and SiC) nanocrystal precipitation in SiC matrix. Thin
Solid Films 2008, 516(12):3824-3830.
10. Wang Y, Liao X, Ma Z, Yue G, Diao H, He J, Kong G, Zhao Y, Li Z, Yun F:
Solid-phase crystallization and dopant activation of amorphous silicon
films by pulsed rapid thermal annealing. Applied Surface Science 1998,
135(1-4):205-208.
11. Szekeres A, Gartner M, Vasiliu F, Marinov M, Beshkov G: Crystallization of a-
Si:H films by rapid thermal annealing. Journal of Non-Crystalline Solids
1998, 227-230(Part 2):954-957.
12. Arguirov T, Mchedlidze T, Kittler M, Rolver R, Berghoff B, Forst M,
Spangenberg B: Residual stress in Si nanocrystals embedded in a SiO[sub
2] matrix. Applied Physics Letters 2006, 89(5):053111.
13. Schmidt H, Fotsing ER, Borchardt G, Chassagnon R, Chevalier S, Bruns M:
Crystallization kinetics of amorphous SiC films: Influence of substrate.
Applied Surface Science 2005, 252(5):1460-1470.
14. Rüther R, Livingstone J, Dytlewski N: Large-grain polycrystalline silicon
thin films obtained by low-temperature stepwise annealing of
hydrogenated amorphous silicon. Thin Solid Films 1997, 310(1-2):67-74.
15. Carvalho AP, Brotas de Carvalho M, Pires J: Degree of crystallinity of
dealuminated offretites determined by X-ray diffraction and by a new
method based on nitrogen adsorption. Zeolites 1997, 19(5-6):382-386.
16. Zi J, Büscher H, Falter C, Ludwig W, Zhang K, Xie X: Raman shifts in Si
nanocrystals. Applied Physics Letters 1996, 69(2):200-202.
17. Kuenle M, Janz S, Eibl O, Berthold C, Presser V, Nickel KG: Thermal
annealing of SiC thin films with varying stoichiometry. Materials Science
and Engineering: B 2009, 159-160:355-360.
18. Nakashima S, Harima H: Raman investigation of SiC polytypes. Physica
Status Solidi (A) Applied Research 1997, 162(1):39-64.
19. Riabinina D, Durand C, Margot J, Chaker M, Botton GA, Rosei F: Nucleation
and growth of Si nanocrystals in an amorphous Si O2 matrix. Physical
Review B 2006, 74(7) :075334.
20. Bording JK, Taftø J: Molecular-dynamics simulation of growth of
nanocrystals in an amorphous matrix. Physical Review B 2000, 62(12):8098.
doi:10.1186/1556-276X-6-129
Cite this article as: Wan et al.: Rapid thermal annealing and
crystallization mechanisms study of silicon nanocrystal in silicon carbide
matrix. Nanoscale Research Letters 2011 6:129.
Submit your manuscript to a
journal and benefi t from:
7 Convenient online submission
7 Rigorous peer review
7 Immediate publication on acceptance
7 Open access: articles freely available online
7 High visibility within the fi eld
7 Retaining the copyright to your article
Submit your next manuscript at 7 springeropen.com
Wan et al. Nanoscale Research Letters 2011, 6:129
/>Page 7 of 7