Solar Collectors and Panels, Theory and Applicationsband (CTB) Part 2 potx
Bạn đang xem bản rút gọn của tài liệu. Xem và tải ngay bản đầy đủ của tài liệu tại đây (4.3 MB, 30 trang )
Solar Collectors and Panels, Theory and Applications
22
rigid. Glass fibres have a light attenuation higher than silica fibres, but they are considerably
cheaper and more flexible, which is a fundamental advantage. Generally plastic is the
preferred material to make fibres bundles, since it facilitates production and plastic fibre
bundles are inexpensive, almost unbreakable and extremely flexible. In particular they have
a bend radius of few centimetres for a fibre diameter of 1.5mm, while a silica fibre of the
same diameter has a 900mm bend radius. Glass fibres are slightly more rigid than plastic
ones, but they usually have lower transmission losses. Nevertheless an innovative plastic
fibre bundle, realised in a polymeric mixture with an original composition, can reach a
similar transmission performance to that of glass fibres.
For the museum installation, fibre bundles were selected in preference to a single fibre. Two
fibre materials, glass and plastic, were considered by examining samples of fibre bundle
with seven terminations: our samples of plastic fibres were produced by DGA (www.dga.it),
while the samples of glass fibres were produced by 3M (www.3m.com). The sample of
plastic fibre bundle had a single core diameter of 1.5mm and length 30m. The sample of the
glass fibre bundle had a single core diameter 0.6mm and length 40m. To compare the optical
performance of these two fibre types, measurements were carried out with sunlight and by
analysing the illuminance at the fibre ends. These field tests examined the light transmitted
by the seven terminations of the fibre bundle coupled to the plastic lens exposed to the sun.
The use of the sun tracking system (in Sect. 4) is fundamental for performing these tests,
because it keeps the lens in the sun’s direction. The tests were performed at noontime, when
the illuminance of the sunlight impinging on the demonstrator collectors was 950 lx to 1020
lx. Measurements were repeated with various sun conditions and on different days.
The illuminance obtained on the exposed object was measured at two reference distances:
50cm and 75cm. These lengths correspond to minimum and maximum distances between
lighting points and exposed objects within the museum showcases. For the plastic fibre
bundle the illuminance was 300 lx to 510 lx at 50cm and 150 lx to 270 lx at 75cm. The glass
fibre bundle provides illuminance values of 340 lx to 560 lx at 50cm and 230 lx to 260 lx at
75cm. As seen from the results, the measurement values fluctuate during the test and it was
found that they can vary even more between days and sun conditions. The final choice for
the application of the museum plant was to employ polymeric fibre bundles.
5.5 Light level and colour suitable for museum illumination
The museum demonstrator employed a combination of solar light and other sources,
represented by white LED with high emission levels at low supplying power (DGA product
number 700001.31 “1W fixed LED gem”, ref. www.dga.it). Museum object illumination has
specific requirements on illuminance levels, light colour and light distribution uniformity.
The first task was to reach a mean illuminance of 100÷120 lx, with the uniformity of light
distribution being maximised within the showcases. The second task was the colorimetric
equivalence between LED and fibre illumination. The third task was to obtain a yellow-
orange colour. This section is devoted to photometric analyses and colour studies on the
three light categories: sunlight guided by glass and plastic fibres and LED emission. The
purpose was to minimise the colour difference between the three illumination categories by
introducing suitable filters. The aspect of illuminance values is separately examined in Sect.
5.6, since they depend on the source distribution within the showcases.
A preliminary analysis compared the spectral components of the three illumination
categories. Figure 18 presents the emission spectrum of the white LED and the illuminance
spectrum of the sun after passing through glass and plastic, in the visible range. They were
Internal Lighting by Solar Collectors and Optical Fibres
23
measured using a Minolta CS1000 spectrophotometer, which examined a Spectralon
(LabSphere
TM
) surface illuminated by the radiation under test. The LED light was located
between 420nm and 700nm and it was characterised by two isolated peaks, while the light
guided by fibres presented a more continuous spectrum. Glass fibres transmitted in the
whole visible range and over 800nm in the infra red region. The transmission of plastic
fibres lied within 380nm and 700nm, almost covering the whole visible range. The colour
temperatures were 4294 °K for glass fibres, 7982 °K for plastic fibres and 5183 °K for the
white LED, whilst the Colour Rendering Index was: 95.4 for glass fibres, 67.3 for plastic
fibres and 72.8 for the LED. A visual comparison of the solar illumination transmitted by the
two fibre types is shown in the photo of Fig. 19: plastic fibres supplied a blue illumination,
while glass fibres provided a yellow lighting.
Fig. 18. Spectral comparison of the lighting using white LED, plastic and glass fibres.
Fig. 19. Visual comparison of the sunlight transmitted by plastic and glass fibres.
Solar Collectors and Panels, Theory and Applications
24
Glass fibre appeared to be more appropriate for obtaining the correct hue. Nevertheless for
the museum installation we finally decided to use polymeric fibre bundles because they are
almost unbreakable and easier for installation, owing to their very short bend radius.
However, the light guided by polymeric fibre bundles required some filtering.
The introduction of filters was necessary to match colour requirements. The filters were
chosen from the catalogue of Supergel filters produced by Rosco (www.rosco.com). The
museum experts preferred the yellow hue of the light transmitted by glass fibres to the blue
hue of the plastic fibre illumination. Therefore, the glass fibre light was taken as the
reference for the colour matching, and filtering was used for the other two lighting
categories. In addition to modifying the colour, the filter attenuated the light, thus reducing
the illuminance obtained within the showcases.
The selection of suitable filters was performed on the basis of photometric tests between the
three lighting categories. The scheme for Colour_Test_1, comparing Glass Fibre and LED
lights, is reported in Fig. 20a; while Fig. 20b presents the scheme for Colour_Test_2,
comparing Plastic Fibre and filtered LED lights.
In Colour_Test_1, the radiation guided by glass fibres represented the reference quantity.
This glass fibre lighting was compared to the filtered LED emission. Spectral tests on the
effect of a set of filters mounted on the LED sources individuated the filter (FILTER_L),
which minimised the colour difference. In Colour_Test_2 the filtered LED illumination was
considered as the reference. The comparison test was performed for the light guided by
plastic fibres and the emission of LED with FILTER_L. The choice of the best filter
(FILTER_F) for plastic fibres was made by testing several filters and finding the spectrum
approaching the reference one.
The experimental set-up included two channels guiding the two types of radiation to be
compared on two faces of a Spectralon cube. In front of the Spectralon cube a screen with a
hole was positioned so that the observer, located at a suitable distance, had a view angle of
2° (fovea vision). For balancing the luminance, neutral filters were mounted on the two
channel lights, thus facilitating the colour matching by the observer.
All tests were repeated with several different observers to obtain a preliminary selection of
the most suitable filters. Then the final filter choice was made on the basis of the chromatic
coordinates measured by the Minolta spectrophotometer CS1000.
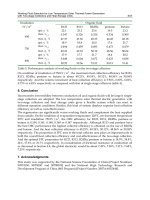
The examined quantities were the chromatic coordinate (u’,v’) and the distance D on the
(u’,v’) diagram: the results for the two colour tests are separately compared in Tables 5a, 5b,
6a and 6b. The criterion for selecting the optimum filter was the minimum distance between
reference and filtered light. The (u’,v’) chromatic coordinates were preferred to the (x,y)
coordinates since they appeared to be more linear. The 1976 (u’,v’) chromaticity diagram is
significantly more uniform than the (x,y) diagram, yet it is still far from perfect. In fact in the
(u’,v’) diagram the distance between two colour-points, in a quadratic calculation, is not
rigorously correct because indistinguishable colours are included inside ellipses. However,
the use of the distance between two colour-points is more correct in the (u’,v’)-system than
in the (x,y)-system [17-18].
For Colour_Test_1, Table 5a examines the colour of LED emission and glass fibre lighting,
both measured without filtering. The errors are < 1% for all quantities in Tables 5 and 6. The
preliminary choice of FILTER_L was represented by filters #2 “Bastard Amber” and #304
“Pale Apricot” of the Rosco catalogue. The chromatic coordinates measured after the
introduction of the proposed filters are compared in Table 5b, where filter #02 corresponded
to the minimum distance on the chromaticity diagram.
Internal Lighting by Solar Collectors and Optical Fibres
25
Spectralon cube
Screen
FILTER L
LED
Glass Fibre
OBSERVER
(a)
Spectralo
n
cube
Screen
L RETLIF F RETLIF
OBSERVER
LED
Plastic Fibre
(b)
Fig. 20. (a) Set-up for Colour_Test_1 comparing Glass Fibre and LED lights. (b) Set-up for
Colour_Test_2 comparing Plastic Fibre and filtered LED lights.
Solar Collectors and Panels, Theory and Applications
26
u’ v’ D
Glass Optical Fibre 0.2206 0.5079
LED 0.2000 0.4915 0.0263
Table 5. (a) Colour_Test_1. Chromatic coordinates u’v’ and distance D in the u’v’ diagram
for the lights before filtering.
u’ v’ D
Glass Optical Fibre 0.2206 0.5079
LED + filter #02 0.2183 0.5083 0.0023
LED + filter #304 0.2226 0.5011 0.0071
Table 5. (b) Colour_Test_1. Chromatic coordinates u’v’ and distance D in the u’v’ diagram
for the lights after filtering.
u’ v’ D
LED + filter #02 0.2168 0.5073
Plastic Optical Fibre 0.1695 0.4845 0.0525
Table 6. (a) - Colour_Test_2. Chromatic coordinates u’v’ and distance D in the u’v’ diagram
for the lights before filtering.
u’ v’ D
LED + filter #02 0.2168 0.5073
Plastic Fibre + filter #03 0.2064 0.5065 0.0104
Plastic Fibre + filter #17 0.2274 0.5205 0.0169
Plastic Fibre + filter #317 0.2310 0.5236 0.0216
Table 6. (b) - Colour_Test_2. Chromatic coordinates u’v’ and distance D in the u’v’ diagram
for the lights after filtering.
In Colour_Test_2, the light colour was measured with LED with filter #02 and on plastic
fibre without a filter: Table 6a shows the results. Three possibilities for FILTER_F were
identified in the Rosco catalogue: #3 “Dark Bastard Amber”, #17 “Light Flame” and #317
“Apricot”. Table 6a compares the chromatic coordinates measured with the possible
FILTERS_F and the minimum distance D in the (u’,v’) diagram corresponded to filter #03.
Internal Lighting by Solar Collectors and Optical Fibres
27
Combining the results of both colour tests, it can be concluded that the nearest illumination
colours were obtained by:
1. Light transmitted by glass optical fibres
2. Emission of LED with filter #02 “Bastard Amber”
3. Light guided by plastic fibres with filter #03 “Dark Bastard Amber”
5.6 Installation and validation of the museum plant demonstrator
A demonstrator of our solar collection system was installed in a prestigious museum in
Florence to provide illumination inside several large showcases. The width of the showcases
can be 5m or 2m, while the height is 3m. The photos of Fig. 21 present two 5m X 3m
showcases: the pictures show the showcases before (left) and after (right) the installation of
the solar lighting plant. The installation of the lighting terminations within the showcases
was realised in the occasion of a re-styling of the exposition showcases, with displacement
Fig. 21. Two museum showcases without (left) and with (right) the internal lighting
supplied by the installed solar plant.
Solar Collectors and Panels, Theory and Applications
28
of the shelves and consequent new arrangement of the exhibit items (particularly evident in
the lower pictures). The museum plant demonstrator included two separated installations:
five devices were placed on the museum roof (Fig. 15a) and four devices were located in the
garden. The roof devices were devoted to supply internal illumination in a room of the
museum; while the garden installation had didactic purposes.
Each device (in Fig. 14) included eight solar lenses (in Fig. 16), coupled to eight fibre
bundles, each of which had seven fibre terminations. The plastic optical fibres transported
the light, concentrated by the solar collectors, within the showcases realising the lighting
points that are suitably distributed within the spaces to be lighted. The total number of
lighting terminations was 5x8x7=280 (from 5 devices with 8 collectors each and 7
terminations in every fibre bundle).
Museum illumination had several fundamental requirements on: illuminance depending on
the exhibit items; equivalence between the two lighting types (solar light and LED); light
colour and uniformity. Lighting hue and colour balance have been examined in Sect. 5.5,
where photometric and colorimetric measurements have determined the appropriate filters
for LED emission and light guided by plastic fibres. The museum experts indicated 100÷120
lx as average illuminance required to light the showcase interior. This value took into
account the illuminance levels recommended by the International Council of Museum [19-
20]. The exhibition objects were basically weapons, armatures and metallic objects: items
made of metal, stone and ceramic have no limits on maximum illuminance; but some
exposed objects were made of leather or wood and others contained horn, bone or ivory and
for these materials the illuminance limit is 150 lx. The more fragile exhibit items were
costumes and textiles that should not receive illumination higher than 50 lx.
The two lighting configurations, with plastic fibres or LED, were separately estimated and
practically experimented directly within the showcases to individuate the best arrangement
of the lighting points. The vertical positioning of the lighting spots improved the light
uniformity, with respect to the horizontal positioning. The total emission angle was about
120° for LED and around 60° for the plastic fibre (numerical aperture NA=0.48) thus the LED
lighting achieved a higher distribution inside the showcases. On the other hand, fibre
terminations could be orientated to maximise the uniformity of lighting distribution. The
selected fibres disposition and LED arrangement fulfilled illuminance correspondence and
illuminance level requirements. The illuminance measured on the showcase background
resulted to be between 80 lx and 170 lx; the employed luxmeter had an error of 2% ±1 digit.
The solar illuminance within the showcases obviously depended on the external sunlight
irradiation, which presented daily and monthly variations. This effect introduced
fluctuations in the solar illuminance provided by the fibres, but the illuminance variations
were judged compatible with the requirements of museum lighting.
6. References
[1] Winston R. Light collection within the framework of geometrical optics. J. Opt. Soc.
Amer. 60 (2), 245-247 (1970).
[2] Winston R, Minano J C, Benitez P. Non-Imaging Optics. Optics and Photonics. Elsevier
Academic Press USA, 2005.
Internal Lighting by Solar Collectors and Optical Fibres
29
[3] Collares – Pereira M, Rabl A, Winston R. Lens-mirror combinations with maximal
concentration. Applied Optics 16 (10), 2677-2683 (1977).
[4] Jenkins DG. High-uniformity solar concentrators for photovoltaic systems. Proc. SPIE 4446, 52-
59, (2001).
[5] Luque A. Solar cells and optics for photovoltaic concentration. The Adam Hilger Series on
Optics and Optoelectronics. Bristol and Philadelphia; ISBN 0-85274-106-5; 1989.
[6] Winston R, Goodman N B, Ignatius R, Wharton L. Solid-dielectric compound parabolic
concentrators: on their use with photovoltaic devices. Applied Optics 15 (10), 2434-2436
(1976).
[7] Xiaohui Ning. Three-dimensional ideal
θ
1
/θ
2 angular transformer and its uses in fiber optics.
Applied Optics 27 (19), 4126-4130 (1988).
[8] Cariou J M, Dugas J, Martin L. Transport of Solar Power with Optical Fibres. Solar Power 29
(5), 397-406 (1982).
[9] Liang D, Nunes Y, Monteiro L F, Monteiro M L F, Collares –Pereira M. 200W solar power
delivery with optical fiber bundles. SPIE Vol. 3139, 277-286 (1997).
[10] Sansoni P, Francini F, Fontani D, Mercatelli L, Jafrancesco D. Indoor illumination by solar
light collectors. Lighting Res. & Technol. 40 (4), 323-332 (2008).
[11] Solar Collectors, Power Storage and Materials. Edited by Francis de Winter. The MIT press
Cambridge, Massachusetts London ISBN 0-262-04104-9; 1991.
[12] Ciamberlini C, Francini F, Longobardi G, Piattelli M, Sansoni P. Solar system for the
exploitation of the whole collected energy. Optics and Laser in Engineering 39 (2), 233-
246 (2003).
[13] Fontani D, Francini F, Jafrancesco D, Longobardi G, Sansoni P. Optical design and
development of fibre coupled compact solar collectors. Lighting Res. & Technol. 39 (1),
17-30 (2007).
[14] Fontani D, Francini F, Sansoni P. Optical characterisation of solar collectors. Optics and
Laser in Engineering 45, 351-359 (2007).
[15] Fontani D, Sansoni P, Francini F, Jafrancesco D, Mercatelli L. Sensors for sun pointing.
proceedings of WREC/WREN World Renewable Energy Congress / Network
2008, Editor A. Sayigh 2008 WREC, Glasgow - UK, 19-25 July 2008.
[16] Fontani D, Sansoni P, Francini F, Mercatelli L, Jafrancesco D. A pinhole camera to track the
sun position. t5.1.O12, ISES Solar World Congress 2007, Beijing - China, 18-21 Sept.
2007.
[17] Wyszecki G, Stiles W S. Color Science. Concepts and Methods. Quantitative Data and
Formulae. Second Edition A Wiley-Iterscience Publication, John Wiley and Sons Inc,
New York; 1982.
[18] Y. Ohno, CIE Fundamentals for Color Measurements, Proc. IS&T NIP16 International
Conference on Digital Printing Technologies, Vancouver, Canada, Oct. 15-20 2000:
540-545 (2000).
[19] Cuttle C. Damage to museum objects due to light exposure. Lighting Res. & Technol. 28 (1),
1-10 (1996).
[20] Castellini C, Cetica M, Farini A, Francini F, Sansoni P. Dispositivo per il monitoraggio della
radiazione ultravioletta e visibile in ambiente museale. Colorimetria e Beni culturali -
SIOF, atti dei convegni Firenze 1999 e Venezia 2000, 168-180 (2000).
Solar Collectors and Panels, Theory and Applications
30
[21] Littlefair P.J. The luminous efficacy of daylight: a review Lighting Res. & Technol., 17 (4),
162-182 (1985).
[22] EERE Information Centre (
of the U.S. Dept. of Energy - Energy Efficiency & Renewable Energy (EERE).
2
Photovoltaic Concentrators – Fundamentals,
Applications, Market & Prospective
Andrea Antonini
CPower Srl
Italy
1. Introduction
The main obstacles for the photovoltaic energy to be competitive with standard energy
sources are 3: the low efficiency, intended as low density of energy production for occupied
area, the high cost of the constituting materials and the variability of the production which
is correlated to the meteorological conditions.
While for the last point the solutions are related to technologies external to the PV, touching
issues of grid management and distribution of solar plants, the first two issues are the aims of
the PV research. One way investigated to improve the efficiency and reducing the costs is the
concentrated photovoltaic (CPV); the light concentration allows higher efficiency for the cells’
PV conversion and permits to replace large part of photoactive materials with cheaper
components concentrating the light. Unfortunately, besides these advantages some limitations
are present for the CPV too; the most evident are the necessity for the panel to be mounted on
a sun tracker and the capacity to convert only the direct component of the sunlight; moreover,
the reliability of the CPV systems has not yet been proofed in field for long time as for the
standard PV, since this technology has achieved an industrial dimension only in the last years.
The photovoltaic concentrators spread on a large space of different possible configurations;
there are concentrators with concentration factor from 2 to over 1000, there are CPV
assemblies using silicon solar cells as well as using III-V semiconductors solar cells; there are
CPV systems with one axis tracker as well as two axis tracker, and with different
requirements on the pointing precision. All these different configurations have been
developed from the first pioneer works in the ‘70s till the current commercial products, to
find the best solutions for cost competitive solar energy.
The CPV industry is very different from that of other PVs; indeed, a CPV module or
assembly is made of many components requiring high precision of mounting. So, the CPV
sector appears like an hybrid between the microelectronic and the automotive industries.
This possibility to derive large part of the automation necessary for medium-high volume of
production from other well consolidated industrial field is an important advantage for the
first assessment of CPV and an useful reference for the cost analysis of large productions.
2. Optics for concentrators
The optics for the Sun concentrators have been mostly developed during the last 30 years;
the non-imaging optics, a branch of geometrical optics, has given a great contribution to the
Solar Collectors and Panels, Theory and Applications
32
evolution of the shapes for solar light concentrators. For this application there isn’t the
concern to reconstruct images avoiding distortions, but the aim is to maximize the transfer
of light flux from the first intercepting area of the concentrator, to the photovoltaic receiver.
In this application, the light can be represented with sunrays, so the geometric optics is
suitable to describe the optical properties of the concentrators.
Some optical parameters cover a substantial role in photovoltaic concentrators; the
parameter are both geometrical, related to the ideal design of the parts, and physical, related
to manufacturing issues and material choice.
The main geometrical parameters are:
- Concentration factor
- Acceptance angle
The main physical factors to consider in the optics for concentrators are:
- Light transmittance
- Light reflectance
- Light absorbance
- Dispersion
- YI (Yellowing Index)
- BRDF (Bidirectional Reflectance Distribution Function)
- BTDF (Bidirectional Transmission Distribution Function)
The BRDF is the Bidirectional Reflectance Distribution Function defined as the scattered
radiance per unit incident irradiance; mathematically it’s expressed as in Eq. (9).
(,)
(,, , )
(,)
SS S
iiSS
ii i
dL
BRDF
dE
θ
ϕ
θϕθ ϕ
θ
ϕ
= (9)
Where θ
i
, φ
i
represent the angles of incidence for the incoming radiation, in spherical
coordinates, while θ
s
, φ
s
are the angles indicating the scattering directions. L
s
is the scattered
radiance, while E
i
is the incident irradiance. This optical property can become significant
after the aging of the materials/surfaces, introducing unwanted light scattering at the
reflector surfaces. The BTDF accounts for a detailed description of the scattering of the light
through a transparent mean; usually, the parameter employed to describe the scattering of
the light in transparent materials is the haze. The haze, defined as the ratio of the scattered
light to the total light that get through a transparency, normally expressed as a percent, does
not provide indication of the distribution of the light scattered (ASTM D 1003-97, 1997).
Sometimes, this scattered light is not completely lost for CPV, but, however, the haze of a
material is usually enough to estimate the optical performances useful for concentrators.
All these properties affect the optical efficiency of the solar concentrator, where the optical
efficiency is usually defined as in (1):
@
@
opt
Irradiance receiver surface
Irradiance entrance surface
η
= (1)
The aim of the optics designer is to maximize the optical efficiency, the concentration factor
and the acceptance angle of the concentrator; moreover, for the photovoltaic application can
be very important to consider other optical characteristics, like the spatial distribution of the
irradiation onto the receiver surface and the light incidence angles distribution onto the
Photovoltaic Concentrators – Fundamentals, Applications, Market & Prospective
33
solar cells. Indeed, the PV devices usually work better with an even irradiation and with low
incidence angles of the incident rays.
The geometrical concentration factor, defined as in (2), is a mere ratio of surfaces, which can
growth indefinitely; however, to maintain an high efficiency, i.e. a maximal transfer of the
incident energy flux of light, the concentration factor is constrained by the maximal light
divergence of the incident rays.
geom
Entrance Area
C
Receiver Area
=
(2)
This constrain, obviously consistent with the second law of thermodynamic considering the
Sun as heating body and the receiver (Smestad et al., 1990), is the sine brightness equation
for ideal geometrical flux transfer; in its general form, with the receiver immersed in a
material with refractive index n, this law is like in (3) for a 3D concentrator with axial
symmetry. The θ
in
represents the maximal incident angle for the incoming radiation respect
to the normal direction at the entrance surface allowing for a maximal ray collection, while
θ
out
is the maximal angle for the rays at the receiver.
22
2
out
max
in
nsin
C
sin
θ
θ
= (3)
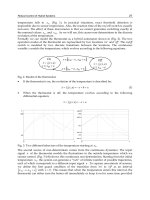
In fig.1 a schematic representation of a generic concentrator is sketched.
θ
in
Generic
concentrator
n
Fig. 1. Generic concentrator: the rays achieving the entrance with a maximal incident angle
θ
in
are collected to the exit aperture immersed in a means of refractive index n
Considering the maximal concentration achievable, the output angle is with θ
out
= 90°, so the
theoretical max concentration becomes (4). For a solar concentrator with the receiver in air,
i.e. with θ
in
=0.27° and n=1, this value is 46000; this and even higher values using n>1 have
been experimental obtained (Gleckman et al, 1989). The sunlight divergence, due to the non
negligible dimension of the Sun, is determined by the Sun radius and the Sun-Earth
distance.
Solar Collectors and Panels, Theory and Applications
34
2
2
max
in
n
C
sin
θ
= (4)
For a linear concentrator the sine brightness equation is as (6), for an θ
out
= 90°; the
demonstration is straightforward. Considering a radiance L, an ideal concentrator must
conserve the flux (Φ
in
= Φ
out
) given by the radiance integrated onto the entry surface. For a
linear concentrator, this flux becomes as in (5) and the concentration factor becomes (6). For
a solar concentrator in air, it becomes about 200.
00
cos( ) cos( )
in out
in in out out
LA d LA n d
θθ
Φ
ΦθθΦ θθ
== = =
∫∫
(5)
)
in
max
out in
A
n
C
Asin(
θ
== (6)
In the CPV field, the acceptance angle is defined as the angle of incidence for the rays at
which the optical efficiency of the concentrator achieves the 90% of its maximal value.
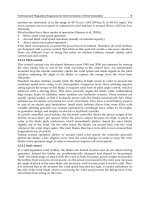
The two geometrical properties (optical efficiency and acceptance angle) of a light
concentrator with defined concentration level are well represented with a graphic like in fig.
(2), where the optical efficiency is plotted vs the incidence angle. The rectangular shaped
dashed line with a side at the limit angle is the graph corresponding at an ideal
concentrator; it collects at the exit surface all the rays with angle lower than the Θ
max
defined
by the theoretical limit. The other lines represent 2 possible characteristics of non-ideal
concentrators; their acceptance angle can be determined in correspondence of the 90% of the
optical efficiency.
η
opt
100%
θ
Θ
max
Fig. 2. Optical efficiency vs incident angle for solar concentrators: the rectangular shaped
dotted line represents the characteristics of an ideal concentrator, while the others are for
non ideal concentrating geometries
In the real applications, the concentrators have surfaces different from the geometrical
ideals; this because the geometrical shapes allowing for the theoretically best results are
limited and usually with complex structures or requiring special materials. These conditions
are constrains for the cost competitiveness of the concentrators, so a trade-off between
performances and cost must be achieved.
As previously indicated, the theoretically maximal concentration of an optical system is
limited; an optical invariant, called Lagrange invariant or étendue, accounts for this relation
Photovoltaic Concentrators – Fundamentals, Applications, Market & Prospective
35
between concentration and angle of divergence consistently with the thermodynamic limits.
It describes the integral of the area and the angular extends over which is set a radiation
transfer, as in (7).
2
cos( )étendue n dAd
θ
Ω
=
∫∫
(7)
Using this optical invariant is possible to derive (4,6) (Winston et al., 2005). Considering a
bundle of rays, the étendue can be represented univocally as a volume in a phase space
characterized by the cosine directions of the rays and their positions in the real space; a
geometric concentrator works as an operator with the function to modify this volume; in
this transformation the étendue must be conserved.
2.1 Design methods
The design of solar concentrators has different drivers respect to imaging optical elements.
Indeed, the design goal here is to maximize the flux density, i.e. the irradiance, at the
receiver. Different methods can be implemented to achieve this result (Winston et al., 2005);
one of the most commons is the edge ray method. This is based on the assumption that the
edge rays in the phase space, i.e. with higher incidence angle at the entrance boundaries of
the concentrator, correspond at the extreme rays, in term of positions as well as angles, at
the receiver too; the rays between the edge rays are collected to the receiver as well,
supposing smoothing and optical active surfaces in continuous media for the concentrator.
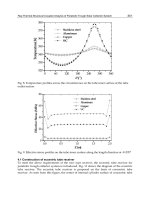
The first example of non-imaging concentrator obtained with this technique is the
compound parabolic concentrator (CPC), as shown in fig. (3); a bundle of parallel rays with
an angle respect to the CPC’s axis of symmetry (which is the max angle of divergence for the
collected rays), is focused onto a point at the exit area by the reflection on a parabolic
surface; this point is on the edge of the exit of the concentrator. All the rays entering with
lower angle of incidence are collected at the exit surface. This kind of concentrator allows for
the maximal theoretical level of concentration for a linear collector, and it’s almost ideal for
the 3D case, with a surface obtained by revolution.
p
arabola 1
p
arabola 2
F
2
F
1
1
CPC axis
Fig. 3. Scheme of the edge ray method applied to a compound parabolic concentrator (CPC);
the dotted arrows represents the incoming rays
Other methods have been developed since the 70’s till today (flow line method, Tailored
Edge Ray, Poisson bracket method, Simultaneous Multiple Surface, Point-source Differential
Equation method) both analytical as well as numerical.
The design of solar concentrators must take into account many different aspects other than
the geometrical optical efficiency and concentration levels; indeed, the physical optical
properties former reported have to be considered, in order to achieve an effective high
Solar Collectors and Panels, Theory and Applications
36
optical efficiency. Moreover, the concentrators should be as much compact as possible,
deliver a suitable irradiance distribution at the receiver, allowing for cheap assembling and
good thermal management of the system components. All these variables have enlarged the
space of possible configurations for CPV optics and there is indeed a wide spectrum of real
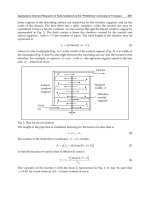
applications. Currently, most of them are based on Fresnel lenses for the primary optics; the
Fresnel lenses are particular kind of lenses for which the dielectric transparent volume
material is reduced at the minimum, as shown in fig.(4a), in order to reduce the mass, so the
weight, as well as the light absorbance. Other solutions use the reflection of the light instead
of the refraction to concentrate the light; the classical parabolic reflectors are used as well as
more complex configuration in the form of cassegrain designs, as in fig. (4c); this optical
design based on two reflections has the aim to achieve a compact structure, with the light
focus behind the primary concentrator. The cassegrain structure is normally employed in
telescopes, for the magnification of the far field objects, and, in its basic design for imaging
optics, use a parabolic mirror reflecting toward a hyperbolic mirrored surface.
Sunlight
Secondary
Mirror
Primary
Concentrator
Receiver
a) b) c)
Fig. 4. Classical designs for photovoltaic concentrators: a) Fresnel lenses equivalent to the
standard lens of b); c) schematic drawn of a cassegrain optics
The CPV optical systems are often composed of a primary concentrator with a secondary
optical element (SOE); these secondary elements are usually joint to the photovoltaic cells and
are employed to improve the concentration factor and the angular acceptance. Moreover, they
are often used to increase the light uniformity on the receiver through multiple reflections with
kaleidoscopic effect (Ries et al, 1997; Chen et al, 1963); in this latter case, to allow for good
optical efficiency, the reflections must be associated to negligible losses. An optical phenomena
used to achieve this result is the total internal reflection (TIR) effect; this is obtainable through
the channeling of the light into transparent dielectric means shaped to allow the striking of the
rays on their surfaces only with an angle lower than the limit angle Θ
c
(8); this angle is a
direct consequence of the Snell law, when the SOE is made of a material with dielectric index
n
1
, placed in a mean of dielectric index n
2
. It works like a light pipe.
2
1
()
n
c
n
Arcsin
Θ
= (8)
The shape of the secondary optics is directly related to the primary concentrator, because it
works on the already deflected bundle of rays. So, a number of different designs for these
components can be found. However, the most popular can be classified in few groups, like
domed shapes, CPCs, truncated pyramids or cones (Victoria et al., 2009). Other original
configurations can be found, depending on the requirements of every CPV manufacturer.
Photovoltaic Concentrators – Fundamentals, Applications, Market & Prospective
37
Concentrated light beams
Fig. 5. Examples of geometries for simple secondary concentrators
Currently, powerful modern raytrace-based analysis tools for optics design are available; the
majority of these software employ the Monte-Carlo method to solve the coupled integral
differential equations used to calculate the illuminance distribution in 3D models (Dutton &
Shao, 2010).
These software tools often allow for the accounting of physical parameters too, delivering
very realistic estimations for optical performances.
Fig. 6. Cassegrain type optics for solar concentration arranged in modules by Solfocus Inc.
(www.solfocus.com)
2.2 Other concepts
In order to maximize the conversion efficiency of the solar cells and of the complete
concentrating system, some CPV designs act onto the spectral properties of the light
together with the geometrical ones. Each photovoltaic materials has the best photovoltaic
performances for wavelengths with energy slightly higher than the semiconductor bandgap.
A splitting of the incoming light or the wavelength shifts are tricks used in dichroic and
luminescent concentrators to try to increase the PV conversion efficiency.
2.2.1 Dichroic concentrators
The idea to split the sun spectrum in light beams and to drive theem toward different cells
of selected material is not new. As well as the idea of concentrating the light, it can be
realized in a number of different configurations; the constrains for its implementations are
mainly related to the costs of these assemblies, considering that additional complexities are
Solar Collectors and Panels, Theory and Applications
38
introduced; indeed, to split the solar spectrum, two physical ways are possible: dispersion
through a transparent prism or reflection/transmission through dichroic filter working for
light interference. The light is concentrated too, in order to reduce the costs of the cells
dedicated to defined wavelengths. In these configurations the theoretical efficiency can
achieve its maximal level, because each cell produces power in the best conditions of
irradiation, without constrains of series electrical connections as happen for multijunction
monolithic structures. Multi-cells arrays with a record efficiency of 43% have been fabricated
(Green & Ho-Baillie, 2010) to demonstrate the feasibility of this approach.
2.2.2 Luminescent concentrators
The aforementioned solutions and methods to concentrate the light are not the only
developed for photovoltaic applications. One important limitation of these designs is the
necessity to use tracking structure to follow the sun. This constrain must not be considered
always a limitation; indeed, especially for utility scale installations, tracking structure are
used for standard flat plate modules too, in order to improve the energy harvesting, being
always on the plane perpendicular to the sunrays. However, the possibility to use static
photovoltaic concentrator able to capture also the diffuse radiation has been developed,
using a different optical approach, not just the geometrical optics, but involving also some
physical properties of particular material like the luminescence; these concentrators, named
luminescent concentrators, are usually made of a flat plate of transparent material, with
solar cells connected to the sides of the plate; inside the transparent material, luminescent
particles like organic dyes or quantum dots are dispersed, absorbing part of the light
spectrum and re-emitting light with shifted wavelengths, matching the spectral response of
the cells. The re-emitted light is than guided toward the solar cells through the transparent
mean, using the total internal reflection at the surface. The limiting point of this technology
is the low efficiency achieved due to the losses in the different physical processes involved;
it is currently in the order of 6-7% for record prototypes; moreover, the usual concentration
for this kind of modules is in the order of 10-40 and the overall size of each luminescent
concentrator, to avoid significant losses for light absorption from the transparent material,
must be limited.
In fig.(7) a sketch describing the basic concept of these concentrator is reported.
Rejected
Collected
Solar cell
n
Fig. 7. Simplified drawn of a luminescent solar concentrator
3. Solar cells
The solar cells used in CPV are made with many different technologies, depending on the
kind of used concentrator. In general, for low and medium concentration level, up to about
Photovoltaic Concentrators – Fundamentals, Applications, Market & Prospective
39
300 Suns, cells made of Silicon are still used; for higher concentrations, cells based on III-V
semiconductors are usually employed; these latter cells allow for efficiency in the order of
40% and find their natural application under high concentration. Due to the high cost of the
base materials and processes, these ultra-high efficiency cells found application for space
satellites and for terrestrial concentrators. Thin film solar cells, in particularly made of CIS-
CIGS, have given interesting results under concentration too (Ward et al, 2009), but, till now,
no significant applications have been developed out of the laboratory scale.
The light concentration, through the increasing of the concentration of the minority carriers,
improves the efficiency of the solar cells logarithmically. The produced current is linearly
proportional to the irradiation level; because of the generated power is given by the product
between the current and the voltage and the voltage increases logarithmically with the
concentration level as in (9), the power increases in the mentioned super-linear way. In (9) C
is the concentration level, while J
ph_1sun
is the photo-generated current under one standard
sun level of irradiation.
1
0
ln 1
Sun
ph
oc
CJ
AkT
V
qJ
⎛⎞
=
+
⎜⎟
⎜⎟
⎝⎠
(9)
Where J
0
is the dark current of the diode and A is the ideality factor of the device.
An additional advantage for CPV cells is the performances reduction with the temperature,
which is lower under concentrated light respect to the same effect under one Sun of
irradiation, for the same kind of cell. This is true in general, for all semiconductor; in
addition, III-V cells, often used in CPV, have a lower temperature coefficient than standard
crystalline silicon solar cells. For example, the interdigited back contact silicon solar cells
have a voltage temperature coefficient of about -1.78 mV/°C under one sun and of about -
1.37 mV/°C at 250 suns (Yoon, 1994), while for GaAs from –2.4 mV/°C under one sun, to -
1.12 mV/°C at 250 suns (Siefer, 2005). The dependence of the temperature coefficient with
the concentration appears, in first approximation, with a logarithmic behaviour, as in (10);
considering the V
oc
as the voltage associated to the energy gap between the quasi-Fermi
energy levels of the illuminated cell, as from fig.(8), this value is given by (11), where C is
the concentration level, while B is a parameter dependent on various physical
characteristics of the material.
Fig. 8. Schematic band diagram of an illuminated p-n junction of a cell in open circuit
conditions
1
ln( )
g
CB
oc
EkT
V
q
−
≅ (10)
So, the temperature coefficient becomes:
E
oc
p
n
Solar Collectors and Panels, Theory and Applications
40
1
ln( )
oc CB
k
dV
dT q
≅−
(11)
One of the main differences in the technology fabrication between concentrator solar cells
and standard solar cell is the requirement for the CPV cells, producing high current density,
to have low series resistance.
A simplified formula describing the I-V characteristics of a solar cell taking into account the
resistance effect is eq.(12); two electrical resistances can be considered: a series resistance, R
s
,
and a parallel resistance, R
shunt
. In a simple one dimensional model they are represented
using the solar cell equivalent electrical circuit of fig.(9). It’s a rough electrical
schematization of the SC, because of the resistances are lumped; a more precise equivalent
circuit should require distributed parameters in 3-D (Galiana et al., 2005).
0
()
s
s
ph
shunt
qV JR
VJR
JJ Jexp
AkT R
+
+
⎛⎞
=− −
⎜⎟
⎝⎠
(12)
Where J
0
is the dark current of the diode and J
ph
represents the photo-generated current.
Fig. 9. Simplified 1D equivalent electric circuit of a solar cell
The simplified electrical equivalent circuit of fig.(9) is enough to explain the importance of
attaining R
s
as low as possible, especially in the case of concentrator solar cells. Indeed, the
higher the current, the higher the voltage drop across the series resistance; in this way, the
diode senses a voltage higher than that one on the external load, so its exponential
behaviour reduces the current in the external circuit when the voltage on the diode is closed
to its threshold voltage. The discrepancy between the voltage on the diode and the voltage
on the external load gives a shortage in the current delivered from the cell in the region of
the I-V characteristic with higher V.
3.1 Silicon solar cells
High efficiency silicon solar cells have been manufactured since the 80’s (Green, 1987). These
cells were manufactured in labs with microelectronic technology steps and with ultrapure
crystals, in order to allow for the maximal performances; efficiency in the order of 27% have
been achieved for back contact solar cells under around 100x and in the order of 25% under
around 250x for cells produced by Amonix Inc. (Yoon et al., 1994). However, the fabrication
processes required for these cells is expensive, and the ultimate device cost is comparable to
that for multijunction solar cells on III-V semiconductors. Mainly for this reason the back
contact technology is no longer used for CPV under the mentioned value of concentration;
Sunpower Corp. commercialized this kind of solar cells until the beginning of 2000
th
but
moved forward and transferred the technology on low cost processes for one Sun module
Photovoltaic Concentrators – Fundamentals, Applications, Market & Prospective
41
production. The silicon cells are currently used in CPV systems with concentration up to
around 100 Suns; the technology used in this range of concentration must not differ so much
from that of standard solar cells, in order to allow for an economical convenience of the CPV
solutions. One established technology is the laser grooved buried contact (LGBC), in which
the metallic contacts of the frontal grid are buried into the bulk of the wafer, as in fig.(10);
the high aspect ratio of the fingers allows for low resistance of the contacts, while the large
area of metal-semiconductor interface permits to strongly reduce the electrical resistance at
the interface of the Shottky energy barrier, keeping a low shadowing of the photo-active
material.
Fig. 10. Cross section of the LGBC silicon solar cell (Cole et al., 2009)
This LGBC concept is employed for the Saturn cells commercialized by BP Solar in flat plate
PV modules (Bruton et al., 1994). For concentrated light BP Solar produced cells with this
technology for the Euclides concentrators (40x) (Sala et al., 1998); at the Narec PV technology
centre, these cells are manufactured and developed for different concentrating solutions,
with efficiency approaching the 20% (Cole et al., 2009).
Standard solar cells obtained with screen printing technology and designed for one sun
application strongly reduce their efficiency even at 2-3 suns because of ohmic losses due to
series resistance; however, some improvements can be achieved through slight design
modifications, varying doping concentrations, electroplating parameters, line pitches and
other fabrication steps.
3.2 Solar cells of III-V materials
The highest conversion efficiency for solar cells has been obtained with the multijunctions
approach. Through epitaxial growth the deposition of crystalline layers of compound
semiconductors is possible whenever specific requirements on the lattice parameter are
satisfied (Yamaguchi, 2002). Many layers of different semiconductors are stacked in order to
create a structure where the first layers appear transparent at the light absorbed by the
semiconductors at their bottom. This is obtained decreasing the band gaps of the compound
semiconductors, from the frontal surface to the rear. The Germanium is often used as
substrate material, both for its lattice parameter as well as for its band gap adapt for the
bottom cell function. Unfortunately, some semiconductor compounds with suitable band
gaps haven’t a lattice matching with the other materials useful for the stack; however, cells
growth with lattice matched (LM) technique have achieved the 40% of efficiency under
concentration. To further improve the performances of the cells, the metamorphic (MM)
approach has been developed (King et al., 2007), delivering record cells efficiency higher
than 41% under concentration; with this technique, consisting in the introduction of step-
Solar Collectors and Panels, Theory and Applications
42
graded buffer layers allowing for stress/strain relief to avoid the formation of dislocations
in the layers growth, the flexibility in band gap selection is greatly improved, providing
freedom from the constrain of same crystal lattice constant for all the stacked material in the
monolithic structure as for LM. In fig.(11) a semplified MM multijunction cell structure
from (King et al., 2007) and the distribution of irradiance absorbed for photovoltaic
conversion by the three active materials are reported. To electrically connect the integrated
sub-cells of different materials, tunnel junctions are formed.
These complex structures represent 3 solar cells series connected. So, the active element
producing the lower current limits the current generation. The current produced by each
layer depends on the light spectrum too, so spectral variations, as happen with different
weathering conditions, can affect the performances of the cells (Muller, 2010).
a) b)
Fig. 11. Triple-junctions solar cells; a) stacks of layers of different semiconductor compounds
from (King et al., 2007); b) absorbed portions of the solar spectrum (AM1.5) for the three
photo-active semiconductors
Theoretically, a cell with 4 junctions can achieve an efficiency of 58% under an AM1.5
spectrum; with a combination of real and known materials, a terrestrial concentration cell
with efficiency of 47% is possible. Until now, however, the most performing cells are 3-J
solar cells; at the end, for energy production installations, a trade off between costs and
performances in field must be carried out. Because of the detrimental effect of the spectral
changes becomes more influent increasing the number of monolithically stacked junction,
the convenience to use, in the future, 4-J solar cells instead of 3-junctions solar cells for in
Sun installation must be demonstrated.
The cost of these devices is decreasing, but it is still in the order of 4€/cm
2
. To evaluate the
cost contribution of the cells on the global system, let’s suppose a collected area of the
concentrator of 400 cm
2
and of a cell of 1cm
2
(physical area of the cell, usually higher than
the irradiated zone, because of, at least, the area for the pads for contact leads is necessary);
with a nominal irradiation level of 850W/m
2
and a module efficiency of 25% the cell
Photovoltaic Concentrators – Fundamentals, Applications, Market & Prospective
43
generates 8.5W, so the €/W
p
contribution of the cell on the overall CPV system cost is of
4/8.5 = 0.47 €/W. It’s a significant voice of cost, but it can be reduced increasing the
concentration level and with the specific cost reduction of the devices obtained with their
volume production, as well as with their efficiency improvement.
New products based on III-V semiconductors are doing their first steps into the CPV
market, moving from labs to pilot production lines. The approach of the strain balanced
quantum well solar cells (SB-QWSC) (Barnham et al., 2002), appears of great technical
interest for the efficiency improvement of multi-junctions solar cells as well as for the
possibility to tail the cells on particular optical designs acting on the spectral properties of
the light, like as dichroic concentrators (Martinelli et al., 2005).
In order to reduces the cost of these cells high research efforts have been invested, following
different routes. From the manufacturing point of view, molecular organic chemical vapour
deposition (MOCVD) equipments, industrially used for the epitaxial growth of the
compound layers have been developed for high productivity. On the other side, different
ways to reduce the cell cost replacing the Germanium or GaAs substrate with cheaper
Silicon wafers (Archer et al., 2008) or using peeling-off techniques (Bauhuis, 2010) in order
to use the same substrate for different growth have been investigated.
3.3 Solar cells assemblies
In general, the cells for concentration are assembled on supporting substrates, treated
similarly to bare dies in electronic technology. So, the process is completely different to that
for standard PV assembling, but can take advantages by the huge progresses,
standardizations and experiences collected during the last decades by the electronic devices
industry.
Depending on the cells nature (materials, sizes and manufacturing technologies) and on the
operative working conditions, different mounting technologies are used. Generally, the
surface mounting technologies (SMT) directly derived from power electronics are applied.
Even in this particular subset of components there’s plenty of different solutions. A good
assembling is fundamental for the performances of the systems; thermal properties,
reliability and optical matching are strongly dependent on the assembling solutions.
Generally, thermal substrates are used, in order to drain out the high heat flux generated by
the concentrated beam on the small cells; as every PV devices, the cells for concentration
decrease their performances, as previously described, with the temperature. A substrate able
to efficiently drain the heat out from the cells and spreads it onto a large area for heat
exchange with the external air or with other cooling means is required. For this purpose,
ceramic materials like alumina (Al
2
O
3
) or aluminium nitride (AlN) are often use, as in
hybrid electronics, when the thermal flux are very high, because of their properties of
thermal conductivity; when the thermal budget is lower, cheaper material can be employed
as, for example, insulated metal substrate (IMS), i.e. an electronic support fabricated
laminating an insulator between a massive mechanical substrate of aluminium and a foil of
copper used as electrically conductive layer. Depending on the material and thickness
adopted for the insulator layer, the circuit will have consequent thermal properties as well
as dielectric capabilities. These insulating materials have usually a thermal conductivity in
the range of 0.8 – 3 W/mK. In table (1) a summary of thermal conductivity of useful
materials employed in CPV receivers assembling is reported.
The cells are electrically connected at the circuitry on the substrate; the rear contacts are
attached using electrically conductive adhesives or soldering, while the frontal contact is
Solar Collectors and Panels, Theory and Applications
44
connected with soldered ribbons or bonded wires; in fig.(12) two different solutions using
soldered leads and wire bonding, with chip on board technology (CoB), are shown.
Material Thermal conductivity
W/mK
Aluminium 204
Copper 390
Tin 67
Silicon 150
Germanium 60
Alumina 25
Aluminium Nitride 160
Silicones 0.1 – 0.2
Electrically conductive adhesives 4 – 5
Thermal conductive adhesives 1 - 4
Table 1. Thermal conductivity of materials usually considered for the assembly of CPV
receivers
a) b)
Fig. 12. CPV solar cells assembled on substrates: a) soldered silicon solar cell (Courtesy of
CPower Srl); b) solar cell of 1mm
2
assembled with chip on board technology (Courtesy of
CRP – Centro Ricerche Plast-ottica)
Because of the technology used is derived from the electronic industry, the reliability issue
related to the assembling with these approaches have been evaluated for long time; the CPV
receivers in working condition can suffer different stresses respect to many electronic
applications; however, many standards are already defined to verify the level of quality of
the assembling processes and some possible defects leading to probable reliability problems
can be identified even prior to carry out accelerated aging tests. In fig.(13a) a X-ray picture
of a solar cell soldered onto a substrate using a correct surface mounting technology is
shown, while in fig.(13b) a cell with an excess of voids in the soldering of the rear cell’s
surface is sketched. The voids can produce cracking and failures during thermal cycling, as
known in electronic technology. (Yunus et al., 2003).
Photovoltaic Concentrators – Fundamentals, Applications, Market & Prospective
45
a) b)
Fig. 13. X-ray image of soldered solar cells – a) acceptable soldering with <5% of voids area;
b) unacceptable soldering, with high fraction of voids under the cell
Bypass diodes are often mounted on the same substrate of the cells; for multijunctions solar
cells these component assumes great importance due to the high sensitivity to reverse bias
of these cells, protecting the devices against destructive reverse loads. Currently, each
individual cell has its own bypass diode, which can be an integral diode or an external,
more standard, Si-diode. Basically, the integral concept consists in separating small area of
the multijunction cell via mesa etching, and using the p-n junctions of the cell as protective
diode.
Secondary optics, wherever used, are components of the receiver. These components require
a high level of precision for their assembling in the module; indeed, the higher is the
concentration level to ménage, the higher is the precision of positioning, in order to avoid
magnified losses; these secondary optics usually have to work under beams already highly
concentrated. In high concentration photovoltaic modules, positioning errors higher than
100 microns can produce not negligible power losses (Diaz et al. 2005); however, this level of
precision is usually achieved by high speed pick & place equipments for SMT in electronics,
which are employed for the receivers assembly (Jaus et al., 2009).
4. Systems
The CPV system is composed of many parts which must cooperate efficiently; generally, the
modules or assemblies must follow the Sun in its apparent motion, to ensure the collection
of the direct irradiation from the cells, through the optics. The possibility of the
concentrators to catch only the direct portion of the sunlight, with an additional circumsolar
light dependent on the acceptance angle of the optics, is an important limitation for the CPV
respect to standard photovoltaics. Diversely, the necessity to follow the Sun is not generally
a limitation; indeed tracking installations are already in fields for standard, flat plate
modules too. The tracking of the Sun gives a significant improvement in the energy
collection, because of it allows for a constant maximal intercepted area of the modules for
the sunrays. This fact permits to improve the energy production of 30-40% respect to fixed
installations of same peak power, with this percentage depending on the latitudes of the
installation. So, for an economical point of view, the additional costs introduced by the Sun-
tracker have to be balanced by the gain in the energy production; this is the straightforward