The Discovery of Type II Superconductors Part 8 pot
Bạn đang xem bản rút gọn của tài liệu. Xem và tải ngay bản đầy đủ của tài liệu tại đây (9.5 MB, 25 trang )
Superconductor
166
Tc(onset) is the temperature at which grains become superconducting. The granular Tc is
controlled by the lattice oxygen content. Hence, Tc(onset) is affected by x, the excess
oxygen, whereas Tc(R=0) is controlled by the intergranular links too. In polycrystalline
samples, grain boundaries are regions of the highest energy and most vulnerable for
radiation damage like enhanced formation of defects, outdiffusion of oxygen etc., which
lead to destruction of weak intergranular links and depression of Tc(R=0) even at lower
doses of irradiation, whereas the granular Tc i.e. Tc(onset) is not affected.
It is the radiation induced destruction of weak intergranular links in polycrystalline
samples that causes an increase in the transition width and fast decrease in Tc(R=0) of
40Mev α-irradiated Bi-2212 sample at higher dose where it is underdoped with respect to
oxygen. This is reflected in the overdoped region too. In the overdoped region,
irradiation induced knock-out of oxygen increases Tc on one hand and the destruction
of intergranular links causes a decrease in Tc. Hence, Tc(R=0) versus excess oxygen curve is
less sharp than that of Allgeier et al. [13], i.e. the increase of Tc (R=0) with dose is less
compared to Tc (onset) in the overdoped region. It is because of this intergranular effects
that the peak of Tc (R=0) corresponds to oxygen content of 0.10 and not 0.15 where the
peaking of Tc(onset) occurs.
Unlike polycrystalline Bi-2212, there has been no increase in Tc(onset) and no change in
oxygen content in particle irradiated Bi-2223. The irradiation induced knock-out of
oxygen is absent in Bi-2223. In most cases (both proton and α-irradiation on Bi-2212 and Bi-
2223), there are increases of transition widths (ΔTc).
The resistivity changed from metallic to insulating behavior by α-irradiation at a dose
of 1x10
16
α/cm
2
and higher for both Bi-2212 and Bi-2223. The nonlinear behavior of
resistivity is indicative of localization of charge carriers caused by irradiation induced
disorder. We analysed the non linear behavior of resistivity in the framework of variable
range hopping (VRH). Normally, the resistivity in the insulating region is given by
ρ = ρ
0
exp [(T
0
/T)
1/(d+1)
] (2)
where the hopping conduction of carriers occurs in d-dimension. Here, T
0
and ρ
0
are
constants.
Thus, for 2-dimensional VRH, ρ = ρ
0
exp [(T
0
/T)
1/3
,
and for 3-dimensional VRH, ρ = ρ
0
exp [(T /T)
1/4
].
In our case, the best fit was obtained in the case of Ln(ρ) vs. (T)
-1/4
plot in the temperature
range of 256K to 115K for Bi-2212 and 190K to 120K for Bi-2223. Thus, the conduction in the
non-metallic region proceeds through 3-Dimensional VRH. Similar metal to insulator
transition was observed in Bi
2
Sr
2
Ca
1-x
Y
x
Cu
2
O
8+x
at x>0.5 [15,16]. Substituting Y(III) in Ca(II)
site causes a lowering of carrier concentration. From the general phase diagram for these
systems, it is now evident that, they are Mott-Hubbard insulators at very low carrier
concentration and become superconducting as the carrier concentration is increased to a
certain extent and the normal state behavior changes from insulator to metallic [17-20].
For the carrier concentration corresponding to the cross-over region from metal to insulator,
the conduction is generally seen to occur through 3D-VRH [21].
The reasons for transition from metal to insulator behavior of the irradiated sample at the
highest dose may be two fold: 1) lowering of carrier concentration due to the knock-out of
oxygen, 2) generation of localisation caused by irradiation induced disorder [22]. There is a
difference between the irradiation induced localizations in Bi-2212 and Bi-2223. In α-
Charged Particle Irradiation Studies on Bismuth Based High Temperature
Superconductors & MgB
2
; A Comparative Survey
167
irradiated Bi-2223, the change of carrier concentration due to change in oxygen content is
not significant which is dominant in α-irradiated Bi-2212 as evident from iodometry. Rather
localisation caused by the radiation induced disorder plays a major part in case of Bi-2223.
We have estimated the localisation length denoted as α
-1
. For 3D VRH, α
-1
is derived from T
0
using the following expression:
T
0
= (16α
3
)/[k
B
N(E
F
)]; N(E
F
) is the density of states at Fermi level and k
B
is Boltzmann
constant. For Bi-2212, the values of N(E
F
) obtained from specific heat data range from
1.25-5.62x10
-2
states/eV/Å
3
(for three dimensions) [23,24]. We have taken the value
~1.8x10
-2
states/eV/Å
3
[20]. The localisation length (α
-1
) comes ~10.7Å. This value of α
-1
is
quite low compared to that (60-80Å) in the case of Bi
2
Sr
2
Ca
1-x
Y
x
Cu
2
O
10+x
in 3D-VRH regime
at the cross-over of metal to insulator transition (for x=0.55) [21]. Our value is comparable to
that for x=0.6. In case of Bi-2223, the localisation length (α
-1
) comes 10.6Å, around five times
the Cu-O bond length in CuO
2
plane.
The Cu-O bond in CuO
2
sheet is the strongest bond and it controls the lattice constants [25].
The other layers in the crystal structure are constrained to match the CuO
2
sheet and thus
internal stress is generated within the crystal structure. The lattice stability in these cuprates
is governed by a tolerance factor defined as:[26]
t=(A-O)/[2
1/2
(B-O)]
In Bi-2212, A-O and B-O are bond lengths of Bi-O in rock salt block and Cu-O in perovskite
block respectively. In perovskites, for stable structure, value of ‘t’ should be as 0.8 <t <0.9
[36]. If the bond lengths are taken to be the sum of the ionic radii of the respective ions, then
with r
(Bi
3+
)
=0.93 Å, r
(O
2-
)
=1.4 Å, r
(Cu
2+
)
=0.72 Å , ‘t’ comes out to be 0.78 in Bi-2212, and is less
than the value needed for structural stability and an internal strain is developed. Since the
Cu-O bond is rigid, the strain due to lattice mismatch can be relieved by the increase of A-O
bond length which can be attained either by substitution of Bi
3+
by larger ion or by
accommodating excess oxygen in the Bi-O layer. In undoped Bi-2212, the latter process
occurs, whereby the Bi-O bond distance increases to 2.6 Å and the tolerance factor comes
within proper range. This excess oxygen resides in Bi-O layer because of the repulsion
of the lone pair of electrons in Bi
3+
ion and oxygen along c-axis. The extra oxygen atoms
form rows along a-axis and cause incommensurate modulation along b-axis [27]. They are
not valence bound. The binding energy of these extra oxygen atoms is very low and hence
they are vulnerable to be knocked out by energetic α-particles and protons depending on
the amount of energy deposited by the projectile.
The decrease in oxygen content (or the knock-out of oxygen) caused by irradiation with
charged particles from Bi-2212 sample can be understood to occur through following steps:
1) Appreciable oxygen vacancies are created by charged particle irradiation induced
displacement at a dose > 1x10
15
particles/cm
2
; 2) These displaced oxygen atoms occupy
pores which are energetically favourable to them; 3) These 'free' or labile oxygen molecules
diffuse from pores to outside (of the sample) which is in vacuum (~10
-6
torr) during
irradiation [28]. This is the driving force for migration. The rate of oxygen atoms/molecules
diffusing out is proportional to the atoms/molecules of oxygen present in pores. At room
temperature, there is no reabsorption of oxygen by Bi-2212 as oxygen absorption needs
activation energy and hence a net decrease in oxygen content occurs.
In Bi-2223 synthesised by partially doping Pb in Bi-site, the tensile stress in Bi-O layer is
relieved by substitution of larger Pb
2+
ion (1.2Å) in Bi
3+
(0.93Å) site. So, Pb doped Bi-2223
Superconductor
168
does not accommodate excess oxygen significantly. Pb(II) substituting Bi(III) provides holes
to CuO layer, thereby relieving its compressive stress. Hence there is no loosely bound
oxygen to be knocked out. In Bi-2223, because of absence of loosely bound oxygen, only
strong lattice bound oxygen comes into picture for being knocked out. TRIM-95 calculations
show the number of oxygen atoms displaced by 40 MeV α-particles is ~5/ion in case of Bi-
2223, whereas the same in case of Bi-2212 containing loosely bound oxygen is around
110/ion [28]. This gives rise to the difference in Bi-2212 and Bi-2223 with respect to oxygen
knock-out. Manifestation of this difference was reflected in their behaviour in Tc and
resistivity and also in Jc and pinning potential, as the irradiation induced knocked out
oxygen vacancies play the role of flux pinning centres. Thus, Bi-2212 and Bi-2223 behave
differently with respect to the enhancement of Jc and pinning potential, as will be revealed
in the following section 4.
3. Jc and pinning potentials for irradiated BSCCO superconductors
The most important aspects of defects governing the physical properties of superconductors,
in particular Jc and pinning, are their size and concentration. Pinning is intimately related to
the size of defects and is maximum when the size of the defects is nearly same as vortex
core. Hence to assay the pinning due to defects, it is essential to have an idea of
concentration and size of defects. We are highlighting studies of defects and their pinning in
proton irradiated BSCCO (Bi-2212 and Bi-2223) superconductors
Positron Annihilation Lifetime (PAL) study is a probe for assaying defect size and
concentration. Positron annihilates with electrons of atoms. Absence of atoms or, vacancies
causes trapping of positrons and hence enhancement of lifetime. More the size of vacancies,
the more will be the lifetime of positrons. Moreover, there is some broadening of the
annihilated γ spectra due to the angular momentum of the electrons with which the positron
annihilation takes place. Thus, Doppler Broadened Positron Annihilation Radiation
technique (DBPARL) also highlights about defects.
The positron lifetime spectra of Bi-2212 and Bi-2223 revealed three lifetimes − the longest
one designated as τ
3
of 1.6-2.0 ns being the pick-off annihilation lifetime of ortho-
positronium atoms, formed at the intergranular space. Among other life times, the shorter
one τ
1
represents the combined effects of positrons annihilating in the bulk and those with
free Bloch state residence time. Longer one τ
2
is the result of trapping of positrons in
vacancy type defects with which we are mostly concerned regarding the size of defects. For
unirradiated Bi-2212 and Bi-2223, the values of τ
2
are 284 and 274 ps respectively. These
values indicate that the unirradiated Bi-2212 and Bi-2223 consist of defects essentially in
form of divacancy and monovacancy respectively [29]. τ
2
increases for Bi-2212 up to the
dose of 5x10
15
proton/cm
2
and then decreases (Fig. 11). But, in case of Bi-2223, there is no
significant change in τ
2
up to this dose compared to the unirradiated sample. From Table-II,
we see that there is no significant change in the concentration of defects in Bi-2223, which is
higher than Bi-2212 in unirradiated stage.
Increase in τ
2
and defect size of Bi-2212 are manifestations of irradiation induced knock-out
of oxygen, creating thereby oxygen vacancies. These oxygen vacancies agglomerate with
each other increasing the defect size and τ
2
. Increase in defect size causes a decrease in
concentration of defects in Bi-2212 with increasing dose, as evident from Table-II. In Bi-2223,
the knock-out of oxygen is absent and hence there is no change in size of defects. Because of
increase in size, there is a reduction in concentration of defects in Bi-2212 up to the dose of
5x10
15
protons/cm
2
as seen from Table-II.
Charged Particle Irradiation Studies on Bismuth Based High Temperature
Superconductors & MgB
2
; A Comparative Survey
169
Irradiation dose
(Protons/cm
2
)
N
(number of vacancies per
vacancy cluster)
C (ppm)
Bi-2212
Unirradiated 2 2.63
1x10
15
2 2.57
2x10
15
2 1.76
5x10
15
3 1.06
8x10
15
1 4.26
1x10
16
1 6.37
Bi-2223
Unirradiated 1 5.10
1x10
15
1 5.25
2x10
15
1 5.25
5x10
15
1 5.30
8x10
15
1 5.45
1x10
16
1 5.55
Table II. Defect Size (N) and Concentration ( C) in Bi-2212 and Bi-2223 as a function of dose.
Increase in defect size causes a decrease in concentration of defects in Bi-2212 with
increasing dose, as evident from Table-II. At high dose of irradiation however, there will be
appreciable generation of cationic vacancies too by displacement of either of Bi, Sr, Ca, Cu.
There is a possibility of combination of a fraction of these cationic atoms with oxygen
vacancies. This process can reduce the size of oxygen vacancies, which is reflected at a dose
higher than 5x10
15
protons/cm
2
. In Bi-2223, the knock-out of oxygen is absent and hence
there is no change in size of defects.
In the mixed state of a Type II superconductor with transport current, Lorentz force is exerted
on magnetic flux lines which causes flux motion and energy dissipation. There are two
categories of flux motion- flux flow and flux creep. In the former case, Lorentz force dominates
and drives the flux lines. In the latter case, the flux pinning is strong and the flux lines move
only by thermally activated jump from one pinning site to another. Magnetoresistance under
high field in the superconducting state is a manifestation of this dissipation. Thus, the
systematic study of the influence of an external magnetic field on resistive transition is an
important source of information for Jc and pinning potential. So, DC electrical resistivity of
irradiated as well as unirradiated BSCCO samples were measured in magnetic field.
The conventional Lorentz force induced dissipation plays a minor role in the high
temperature part of resistive transition (i.e. near Tc(onset)) due to fluctuation of the
superconducting order parameter which is very dominant in case of HTSC materials [30].
Only, in case of low temperature part of the resistive transition temperature (i.e. near
Tc(R=0), dissipation energy due to motion of vortices by thermally activated flux creep
plays an important role in pinning [31,32]. Hence, thermally activated flux creep model [48]
was used to analyse the magnetoresistance of irradiated and unirradiated BSCCO samples
in the temperature regime Tc(onset) to Tc(R=0). According to this model, the resistivity in
this temperature regime is given as:
ρ(T,H) = ρ
0
exp [-U(T,H)/(K
B
T)] (3)
Superconductor
170
where prefactor ρ
0
is a coefficient related to the vortex volume, the average hopping
distance of vortices and the characteristic frequency with which vortices try to escape the
potential well. Usually, ρ
0
is of the order of normal state resistivity near Tc(onset) [33]. ρ
0
in
our case has been taken as the normal state resistivity at 100K and 125K for Bi-2212 and Bi-
2223 respectively. The activation energy U(T,H) for various fields H has been extracted by
using Arrhenius type equation (3) in the form:
U(T,H) = (K
B
T)ln[ρ
0
/ ρ(T,H)] based on ρ(T)/ρ
0
. Finally, U(0,H) was determined from the
plots of U(T,H) versus temperature fitted with the equation:
U(T,H) = U(0,H) [1-T/Tc(H)]
n
(4)
We have done the analysis in low temperature regime corresponding to flux creep, i.e.
where U(T,H)>>K
B
T [34]. The best fit was obtained for n=2.
In Bi-2212, the pinning potential U(0,H) has increased with dose up to 5x10
15
protons/cm
2
.
This is in tune with the increase in positron lifetime τ
2
in PAL studies and hence the
increase in defect size from divacancy to trivacancy and thereby defects acting as more
effective pinning centre. Beyond this dose, U(0,H) values have decreased with reduction in
vacancy size from trivacancy to monovacancy. In Bi-2223, U(0,H) does not show any
significant change with the dose of irradiation as seen in PAL studies. U(0,H) of
unirradiated Bi-2223 is significantly higher than Bi-2212. The defect concentration of
unirradiated Bi-2223 was also higher than Bi-2212 as revealed from Table-II.
Jc of proton irradiated as well as unirradiated BSCCO samples were evaluated from DC
magnetisation studies at fields up to 1 Tesla. At the field higher than Hc
1
, magnetic flux
enters into the grain and hence the intragranular critical current density Jc can be evaluated
using Clem-Bean formula [36,37]:
Jc = [30ΔM] / a
where M is the magnetisation and ‘a’ is the average grain size of the samples taking into
account the granularity in polycrystalline samples.
Jc versus H shows a clear exponential relation as:
Jc = Jc
0
exp (-H/H
0
),
where Jc
0
and H
0
are fitting parameters [38].
Jc
0
is defined as the critical current density at zero magnetic field. In Bi-2212, Jc and Jc
0
increase with dose up to 5x10
15
protons/cm
2
and then decreases. But, in Bi-2223, there is no
significant change up to this dose, though in the unirradiated stage, Jc and Jc
0
are higher for
Bi-2223 owing to high defect concentration in the unirradiated stage, as discussed earlier.
At doses higher than 5x10
15
protons/cm
2
, there is a possibility of occupancy of cationic atom
at the site of oxygen vacancies causing a decrease in defect size in Bi-2212. The smaller
defects are less effective in pinning causing a reduction in pinning potential and Jc. On the
other hand, in Bi-2223, there is a reduction in positron lifetime τ
2
implying the formation of
vacancy loops acting as a weak trapping centre. This defect configuration might be
deleterious in pinning, whereby there is a drastic fall in Jc in Bi-2223 above the dose of
5x10
15
protons/cm
2
.
Thus, there is one to one correspondence between defect size, pinning potential and Jc in Bi-
2212 and Bi-2223. Moreover, difference in these two systems with respect to
abovementioned properties is due to the difference with respect to the irradiation induced
knock-out of oxygen.
Charged Particle Irradiation Studies on Bismuth Based High Temperature
Superconductors & MgB
2
; A Comparative Survey
171
5. Particle irradiation on MgB
2
In MgB
2
, the irradiation studies with heavy ions on thin films [39] and protons on bulk
materials [40] have not reflected any significant changes in T
c
and other superconducting
properties. Hence we employed heavy ions like Neon with large deposition energy and high
values of displacements per atom (dpa) to bring about changes in bulk samples. There has
not been significant change in Tc up to the dose of 1x10
15
Neon/cm
2
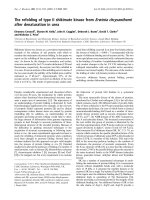
. The plots of resistivity
versus temperature for all the four samples are shown in Fig. 4. We observe that there is no
significant change in Tc indicative of rather insensitivity of MgB
2
towards particle
irradiation. There is slight decrease in Tc for the sample with the highest dose. The values of
Tc and room temperature resistivity (ρ
300
) are listed in Table III. There is almost no increase
in ΔTc excepting at the highest dose. ρ
300
of the polycrystalline samples increased with dose
except for the lowest dose. The decrease in resistivity for the sample irradiated with the dose
of 1x10
13
Neon/cm
2
may be due to thermal annealing of the defects, which were initially
present in the sintered sample leading to a decrease in the residual resistivity. At low dose
of irradiation, mobile defects are also seen to increase the long-range ordering in partly
ordered metallic alloys [41]. The depth of 160 MeV Neon ion implantation is 106μ, as
obtained from Monte Carlo simulation using the code TRIM [6]. Displacement energy of
both Mg and B has been 25eV with lattice binding energy of 3eV. The high binding energy
of B is an outcome of strong sp
2
hybrid σ bonding between in-plane B atoms. The number of
displacements/ion is 2734 as obtained from TRIM simulations. The dpa in the range of 106μ
obtained thereby is 8.2x10
-18
/ion/cm
2
. Energy loss here is larger by a factor of 10
2
than that
caused by 6 MeV protons in MgB
2
. Defect concentration at the highest dose is around 0.1%
in the range of the projectile with fairly bulk damage.
As already stated, in MgB
2
, the grains are strongly coupled which are not disturbed even
after irradiation, as noticed by inappreciable change in ΔTc in contrast to HTSC cuprates.
MgB
2
is a strongly coupled phonon mediated superconductor. The decrease in resistivity is
Fig. 4. Resistivity versus temperature. Though it is metallic, the resistivity is nonlinear.
Superconductor
172
Dose
(ions/cm
2
)
Tc
(K)
ρ
0
(μΩ-cm)
ρ
300
(μΩ-cm)
ρ
’
(μΩ-cm/K)
ρ
300 -
ρ
0
(μΩ-cm)
Zero 38.7 25.01 86.94 0.32 61.93
1X10
13
38.6 22.47 67.57 0.26 45.10
1X10
14
38.7 33.71 124.60 0.48 90.89
1X10
15
38.0 39.94 139.46 0.52 99.52
Table III.
linear with temperature from 300K up to a certain point (~ 200 K) and then it deviates from
linearity. This shows that resistivity can be explained from phonon scattering mechanism.
We have fitted the experimental curve to Bloch-Grüneisen expression [42],
() ( )
()
()
()
'
0
2
0
exp
1
exp 1
m
m
T
xx
T
Tm dx
x
ρρ ρ
Θ
⎛⎞
=+− Θ
⎜⎟
Θ
⎝⎠
−
∫
(5)
Here, ρ
0
is the residual resistivity, ρ
’
the temperature coefficient of resistivity and Θ the
Debye temperature. ρ
0
, ρ
’
and Θ are the fitting parameters. ρ(T) varies as T
5
at low
temperature. The increase in resistivity has contributions from ρ
0
and ρ
’
. The increase of ρ
0
can be related to the increase in defect concentration and the damage at grain boundaries
with irradiation. The decrease in ρ
0
at the lowest dose can be understood from annealing of
the defects as already mentioned. Debye temperature did not vary much with irradiation
and was from 903K to 909K (variation is within the error range of the fit).
We have obtained the EPC constant λ about 0.84 for the unirradiated sample using the
experimentally obtained Tc and the fitted Θ value in the McMillan equation
()
()
*
1.04 1
exp
1.45 1 0.62
c
T
λ
λ
λμ
⎡
⎤
−+
Θ
=
⎢
⎥
−+
⎢
⎥
⎣
⎦
(6)
with the value of Coulomb pseudopotential μ
*
taken as 0.1 [43]. λ also has not changed
significantly with irradiation due to insignificant variation of T
c
and Θ.
The increase in ρ’ can be understood from bonding nature of MgB
2
. As mentioned earlier,
strong covalent σ-bonding within B-B layer gives rise to σ bands. The carriers of the σ bands
are strongly coupled with the in-plane B E
2g
stretching modes, giving rise to
superconductivity [44,45]. Electron- phonon coupling constant along σ bands (λ
σ
) governs
Tc. The contribution to the conductivity is expected to be low in σ bands due to strong EPC.
In two band system, the conductivity can be considered arising from the parallel network of
the σ and π bands [43]. As compared to σ bands, conductivity would be large in π bands due
to low EPC constant. The density of states around the Fermi surface (N(E
F
)) of π band is 56%
and that of σ bands is 44% [46]. So the normal state conductivity is mainly governed by the
carriers of the metallic π bands.
Particle irradiation causes vacancies in both B and Mg layers. Irradiation induced B
vacancies would damage both σ and π bonding network. π bonding network extends
towards Mg ions as there is an interaction between them. Irradiation induced vacancies in
both Mg and B sites affect the π bonding and hence N(E
F
) due to π-bonding. As ρ’ is
inversely proportional to N(E
F
), decrease in N(E
F
) with irradiation causes an increase in ρ’.
Charged Particle Irradiation Studies on Bismuth Based High Temperature
Superconductors & MgB
2
; A Comparative Survey
173
There is no role of Mg ions with σ bonding hence no role in EPC and Tc. Irradiation induced B
vacancies up to the dose of 1x10
15
ions/cm
2
do not cause significant change in λ
σ
and hence tc.
6. Upper critical field
Upper critical field H
c2
(T) was extracted from the magneto transport measurements from the
intersection of the slopes at the points of resistivity at 40K (ρ
40
) and at the point
corresponding to 0.9ρ
40
. In Fig. 5, H
c2
(T) for samples A and B (A: Unirradiated & B:
Irradiated) are plotted as a function of temperature. There has been only an appreciable
increase in upper critical field with lowering of coherence length, which has got some
significance in application.
H
c2
(0) was extracted using the formula:
() ()
22
01
cc
c
T
HT H
T
β
α
⎧
⎫
⎛⎞
⎪
⎪
=−
⎜⎟
⎨
⎬
⎜⎟
⎝⎠
⎪
⎪
⎩⎭
(7)
with α = 2 and H
c2
(0) and β as fitting parameter. β was found to be ~ 1.67 for unirradiated
sample and 1.78 for irradiated sample. In MgB
2
single crystal μ
0
H
c2
(0) is around 3.5T along c
axis and around 15 to 17 T along ab direction [47, 48]. In polycrystalline sample where the
grains are randomly oriented, H
c2
(0) is governed by the higher value of the H
c2
c and H
c2
ab
.
μ
0
H
c2
(0) of the unirradiated sample is 18.7T and for the irradiated sample, it increases to
20.4T due to disorder introduced by Ne ion irradiation. There is a positive curvature of the
H
c2
–T near T
c
. In MgB
2
single crystal this positive curvature is observed in H
c2
ab
(T) [47]. The
positive curvature is believed to be characteristic of layered superconductors [49]. It seems
that both the two-gap and the anisotropic gap model [50] can qualitatively explain the
positive curvature of MgB
2
near T
c
. But this feature is also observed in single gap
superconductor or in isotropic (K,Ba)BiO
3
systems [51]. The curvature of the irradiated
sample is greater than the unirradiated sample.
Using Ginzburg-Landau (GL) expression for B
c2
:
()
0
02
2
2
c
H
φ
μ
πξ
⎡
⎤
⎢
⎥
=
⎢
⎥
⎢
⎥
⎣
⎦
(8)
where,
φ
0
is the quanta of flux h/2e, we obtain ξ(0) = 4.2 nm for the unirradiated sample A
and 3.9 nm for B-slight reduction due to irradiation.
7. Critical current density
The magnetisation critical current density (J
c
) was extracted using Bean’s critical state
model. J
c
of the unirradiated sample A at 15K and 1.0T is around 10
5
Amp/cm
2
. The value is
quite high as compared to HTS like bismuth cuprate superconductor. However, there is a
sharp fall of J
c
with increasing B for the unirradiated sample like HTS. In case of the
irradiated sample B, the magnetisation measurement shows J
c
to be lower than the
unirradiated sample A at low field but higher than A at high field as evident from Fig. 6.
Superconductor
174
24 26 28 30 32 34 36 38 40
0
2
4
6
8
μ
0
H
c2
(T)
Temperature (K)
A
B
Fig. 5. Temperature variation of upper critical field for A & B.
1234567891011
10
0
10
1
10
2
10
3
10
4
10
5
T = 2K
J
c
(A/cm
2
)
Ma
g
netic field
(
T
)
A
B
Fig. 6. Jc as a function of field. Jc for B is lower at low field but higher at high field .
J
c
(B) is governed by the nature of pinning and pinning force density. In order to see the
effect of irradiation on pinning force density F
p
(F
p
= J
c
xH), we have plotted F
p
(H,T)
versus
H in reduced scale. It is known that such curves form universal scaling at different
temperatures [52]. In fig. 7, we have plotted fp (f
p
= F
p
/F
p
max
) versus h (h = H/H
irr
); F
p
max
is
the maximum value of F
p
and H
irr
is the irreversibility field at that particular temperature
being explained as follows. In high temperature superconductors there exist a large region
below the thermodynamic upper critical field (H
c2
) line in H-T phase diagram (high T high
H region) where the motion of the flux lines is reversible [53]. The lower boundary of this
region is marked by a line called irreversibility line (IL). This region occurs in H-T phase
Charged Particle Irradiation Studies on Bismuth Based High Temperature
Superconductors & MgB
2
; A Comparative Survey
175
diagram due to some dissipative effects. In low temperature superconductors there is little
or insignificant difference between IL and H
c2
line. However, in HTS, IL is found to lie much
below H
c2
line. IL is attributed to a line above which the temperature enhances the classical
Kim-Anderson flux creep or phase transition of flux line (like vortex-glass to liquid phase
transition, melting of flux line lattice etc) [54, 55]. HTS has high critical temperature and at the
same time they are highly anisotropic. Hence there is a large gap between IL and H
c2
in HTS.
We have demonstrated a representative plot of fp versus h at 20 K (figure 7). There is a
slight change between irradiated and unirradiated sample. We have fitted the curve using
the generalized function:
()
1
m
k
f
ah h=− (9)
The exponents k and m are 0.89 and 3.14 respectively for sample A and 0.61 and 2.22
respectively for sample B. Fig. 8 shows the 3D plot of F
p
max
-H-T relation for the sample A.
This shows that the pinning mechanism is somewhat altered due to Neon ion irradiation.
The lower value of pinning force density F
p
max
for irradiated sample B causes J
c
to be lower
than that of A at low field. But the lower values of the exponents for B in equation (9) show
that F
p
is higher for sample B than that of A at high field and hence J
c
. This indicates that F
p
decreases with applied magnetic field more slowly in case of B implying lower slope of J
c
-B
curve for sample B. The lower values of the exponents k and m of the irradiated sample
show that there is reduction of the distance of the pinning centers (though to a low extent).
8. Conclusion
High temperature Cuprate superconductors (HTSC) are nonstoichimetric based on defects and
disorders, which play a great role as carrier concentration and hence control Tc, Jc, resistivity
etc. Particle irradiation induced defects modulate the carrier density through change in oxygen
stoichiometry. In particular, irradiation induced oxygen vacancies act as flux pinning centres
causing enhancement in Jc, pinning potential. Other cationic defects and disorder manifest,
0.0 0.2 0.4 0.6 0.8 1.0
0.0
0.2
0.4
0.6
0.8
1.0
20 K
f
h = H/H
irr
A
B
Fig. 7. Normalised pinning force versus magnetic field normalized with H
irr
.
Superconductor
176
0
5
10
15
20
25
30
35
40
0.0
2.0x10
4
4.0x10
4
6.0x10
4
8.0x10
4
1.0x10
5
1.2x10
5
1.4x10
5
0.0
0.2
0.4
0.6
0.8
1.0
1.2
1.4
1.6
1.8
F
p
(
a
m
p
T
/
cm
2
)
μ
0
H
(
T
)
T
e
m
p
e
r
a
t
u
r
e
(
K
)
Fig. 8. 3D plot of pinning force density as function of temperature, magnetic field.
where this irradiation induced oxygen knock out is absent. We studied particle irradiation
effects on Bi-based superconductors- Bi-2212 and (Bi,Pb)-2223. In Bi-2212 containing loosed
excess oxygen needed for structural stability, particle irradiation causes knock-out of loose
oxygen. In these systems, this excess oxygen plays the role of hole carrier. Hence, change of
excess oxygen content due to particle irradiation causes a change in Tc (increase in the
overdoped Bi-2212) and resistivity. Moreover, knocked out oxygen vacancies act as flux
pinning centre for the enhancement of Jc. But, in Bi-2223, the presence of larger Pb(II)
minimizes the presence of loose excess oxygen, and the irradiation induced oxygen knock-out
is not the scenario. Hence there is no significant enhancement of Jc owing to irradiation. There
is decrease in Tc and increase in resistivity. In both systems, there is a metal to insulator
transition above the fluence of 1x10
16
α/cm
2
, but, the reasons are different. Lowering of oxygen
carrier concentration is the cause in Bi-2212 and in Bi-2223, localization due to irradiation
induced disorder is the prime factor. Thus, HTSC’s are in general very much sensitive to
particle irradiation, whether by lowering of carrier concentration or, by generation of
irradiation induced disorder. On the other hand, MgB
2
, which is an intermediary between
conventional superconductors and HTSC’s is fairly insensitive to irradiation. It is a multiband
BCS type phonon mediated superconductor. Strong covalent σ-bonding within B-B layer gives
rise to σ bands and carriers of σ bands are strongly coupled with the in-plane B E
2g
stretching
modes, giving rise to superconductivity. Electron- phonon coupling constant along σ bands
(λ
σ
) governs Tc, which is not significantly affected by heavy ion like neon irradiation, even at
the fluence of 1x10
15
ions/cm
2
. In two band system, the conductivity can be considered arising
from the parallel network of the σ and π bands. As compared to σ bands, conductivity would
be large in π bands due to low EPC constant. Particle irradiation affects the π band network.
Hence, there is an appreciable increase in resistivity without any significant decrease in Tc and
also, the role of irradiation induced defects in intragranular pinning is insignificant. The grain
boundary pinning is the dominant scenario in case of MgB
2
as evident from magnetization and
Charged Particle Irradiation Studies on Bismuth Based High Temperature
Superconductors & MgB
2
; A Comparative Survey
177
magnetoresistance measurements. We also studied the enhancement of Jc by doping Mg with
Hf (1%). The enhancement was enormous! The contribution was from other borides
precipitating at the grain boundary.
9. References
[1] S.K.Bandyopadhyay, P.Barat, S.K.Kar, U. De, A.Poddar, P.Mandal, B.Ghosh, and
C.K.Majumdar, Solid State Communications 82 (1992) 397.
[2] S.K.Bandyopadhyay, P.Barat, Pintu Sen, A.K.Ghosh, A.N.Basu and B.Ghosh, Phys. Rev.
B58 (1998) 15135.
[3] G.Linker, J.Geerk, T.Kroener, O.Meyer, J.Remmel, R.Smithey, B.Strehlau, and X.X.Xi,
Nucl. Inst. Meth. in Phys. Res.B59-60 (1991) 1458.
[4] O.Meyer, in Studies of High Temperature Superconductors, ed. A.V.Narlikar, V.
1. (Nova Science Publishers, New York, 1989); p. 139 and. the references therein.
[5] P. Sigmund, Radiation Effects 1 (1969) 15; M.J.Norgett, M.T.Robinson and I.M.Torrens,
Nucl. Eng. De sign 33 (1974) 50.
[6] J.P.Biersack and L.G.haggmark, Nucl. Inst. & Meth. 174 (1980) 257.
[7] R.Viswanathan and R.Certon, Phys. Rev. B18 (19780 15.
[8] L.R.Testardi and L.F.Matthews, Phys. Rev. Lett. 41 (1978) 1612.
[9] B.D.Weaver, E.M.Jackson, G.P.Summers and E.A.Burke, Phys. Rev. B46 (1992) 1134; and
references therein.
[10] G.P.Summers, D.B.Chrisley, W.G.Maisch, G.H.Strauss, E.A.Burke, M.Nastasl and
J.R.Tesmer, IEEE Trans. On Nucl. Sci. 36 (1989) 1840.
[11] G.C.Xiong, H.C.Li, G.Linker and O.Meyer, Phys. Rev. B38 (1988) 1; Physica C153-155
(1988) 1447.
[12] G.J.Russell, H.B.Sun and K.N.R.Taylor, Physica C241 (1995) 219.
[13] C.Allgeier and J.S.Schilling, Physica C168 (1990) 499.
[14] J.M.Tarascon, Y.LePage, P.Bardoux, B.G.Bagley, L.H.Greene, W.R.McKinnon,
G.W.Hull, M.Giroud and D.M.Hwang, Phys. Rev. B37 (1988) 9382.
[15] T.Tamegai, K.Koga, K.Suzuki, M.Ichimara, F.sakai and Y.Iye, Jpn. J. Appl.Phys. 28
(1989) L112.
[16] R.Yoshizaki, Y.Saito, Y.abe and H.Ikeda Physica C152 (1988) 408.
[17] J.B.Torrance, Y.Tokura, A.I.Nazzal, A.Bezinge, T.C.Huang and S.S.P.Parkin,
Phys. Rev. Lett. 61 (1988) 1127.
[18] Y.Shimakawa, Y.Kubo, T.Manako and H.Igarashi, Phys. Rev. B40, (1989)11400.
[19] A.Matsuda, K.Kinoshita, T.Ishii, H.Shibata, T.Watanabe and T.Yamada, Phys. Rev.
B38 (1988) 2910.
[20] Z.Z.Wang, J.Clayhold, N.P.Ong, J.M.Tarascon, L.H.Greene, W.R.McKinnon and
G.W.Hull, Phys. Rev. B36 (1987) 7222.
[21] P.Mandal, A.Poddar, B.Ghosh and P.Choudhury, Phys. Rev B43 (1991)13102 .
[22] P.W.Anderson, Phys. Rev. 109 (1958) 1492.
[23] R.A.Fisher, S.Kim, S.E.Lacy, N.E.Phillips, D.E.Morris, A.G.Markelz, J.Y.T.Wei and
D.S.Ginley, Phys. Rev. B 38 (1988) 11942.
[24] N.Okazaki, T.Hasegawa, K.Kishio, K.Kitazawa, A.Kishi, Y.Ikeda, M.Takano, K.Oda,
H.Kitaguchi, J.Takada and Y.Miura, Phys. Rev.B 41 (1990) 4296.
[25] H.Zhang and H.Sato, Physica C214 (1993) 265.
[26] F.S.Galasso, Structure, Properties and Preparation of Perovskite-Type Compounds
(Pergamon. , New York, 1969) p. 4
Superconductor
178
[27] S.B.Samanta, P.K.Dutta, V.P.S.Awana, E.Gmelin and A.V.Narlikar, Physica C178 (1991)
171.
[28] S.K.Bandyopadhyay, Pintu Sen, P.Barat, P.Mukherjee, S.K.Das and B.Ghosh, Pramana,
Journal of Physics 47, 309 (1996); S.K.Bandyopadhyay, A.K.Ghosh, P.Barat, Pintu
Sen, A.N.Basu and B.Ghosh, Phys. Stat. Sol. A162 (1997) 701.
[29] M.J.Puska and R.M.Nieminen, J.Phys. F : Metal Phys 13 (1983) 333.
[30] D.H.Kim, D.J.Miller, J.C.Smith, R.A.Holoboff, J.H.Kang and J.Talvacchio, Phys. Rev. B44
(1991) 7607.
[31] R.Ikeda, T.Ohmi and T.Tsuneto, Phys. Rev. Lett. 67 (1991) 3874.
[32] O.Brunner, L.Antognazza, J.M.Triscone, L.Miévelle and Ø.Fisher, Phys. Rev. Lett. 67
(1991) 1354.
[33] T.T.M.Palstra, B.Batlogg, R.B.van Dover, L.F.Schneemeyer and J.V.Waszczac, Phys. Rev.
B41 (1990) 6621.
[34] C.Attanasio, C.Coccorese, V.N.Kushnir, L.Maritato, S.L.Prischepa and M.Salvato,
Physica C255 (1995) 239.
[35] M.D.Lan, J.Z.Liu, Y.X.Jia, L.Zhang, Y.Nagata, P.Klavins and R.N.Shelton, Physica C218
(1993) 69.
[36] Shin-Pei Matsuda, T.Doi, A.Soeta, T.Yuasa, N.Inoue, K.Aihara and T.kamo, Physica
C185-189 (1991) 2281.
[37] W.M.Chen, S.S.Jiang, Y.C.Guo, J.R.Jin, X.S.Wu, X.H.Wang, X.Jin, X.N.Xu, X.X.Yao and
S.X.Dou, Physica C 299 (1998) 77.
[38] J.Fontcuberta, S.Pinol, X.Obradors, F.Lera and C.Rillo, Cryogenics 30 (1990) 656.
[39] A Gupta, H. Narayan, D. Astil, D. Kanjilal, C. Ferdeghini, M. Paranthaman and A.V.
Narlikar, Supercond. Sci. Technol. 16 (2003) 951-955.
[40] E. Mezzeti, D. Botta, R. Cherubini, A. Chiodoni, R. Gerbaldo, G. Ghigo, G. Giunchi, L.
Gozzeline and B. Minetti, Physica C 372-376 (2002) 1277.
[41] E.M. Schulson, J Nucl. Mater. 83 (1979) 239.
[42] Y. Kong, O.V. Dolgov, O. Jepsen and O.K. Anderson, Phys. Rev. B 64 (2001) 020501(R).
[43] I.I. Mazin and V.P. Antropov, Physica C 385 (2003) 49.
[44] A.Y. Liu, I.I. Mazin and J. Kortus, Phys. Rev. Lett. 87 (2001) 087005.
[45] J.Kortus, I.I. Mazin, K.D. Belashchenko, V.P. Antropov and L.L.Boyer, Phys. Rev. Lett.
86 (2001) 4656.
[46] H.J. Choi, M.L. Cohen and S.G. Louie, Physica C 385 (2003) 66.
[47] M. Zehetmayer, M. Eisterer, J. Jun, S.M. Kazakov, J. Karpinski, A. Wisniewski, and H.
W. Weber, Phys. Rev. B 66 (2002) 052505.
[48] L. Lyard, P. Samuely, P. Szabo, T. Klein, C. Marcenat, L. Paulius, K.H.P. Kim, C.U. Jung,
H.S. Lee, B. Kang, S. Choi, S.I. Lee, J. Marcus, S. Blanchard, A.G.M. Jansen, U. Welp,
G. Karapetrov and W. K. Kwok, Phys. Rev. B 66 (2002) 180502.
[49] J.A. Woollam, R. Somoano and P.O’Connor, Phys. Rev. Lett. 32 (1974) 712.
[50] A.I. Posazhennikova, T. Dahm and K. Maki, Europhys. Lett., 60 (2002) 134.
[51] S. Blanchard, T. Klein, J. Marcus, I. Joumard, A. Sulpice, P. Szabo, P. Samuely, A. G. M.
Jansen, and C. Marcenat, Phys. Rev. Lett. 88 (2002) 177201.
[52] D. Dew-Hughes, Phil. Mag. 55, (1987) 459.
[53] Y. Yeshurun and A.P. Malozemoff, Phys. Rev. Lett. 60 (1988) 2202.
[54] M.P.A. Fisher, Phys. Rev. Lett. 62 (1989) 1416.
[55] A. Houghton, R.A. Pelcovits and S. SudbØ, Phys. Rev. B, 40 (1989) 6763.
9
Application of Optical Techniques in the
Characterization of Thermal Stability and
Environmental Degradation in High
Temperature Superconductors
L. A. Angurel
1
, N. Andrés
2
, M. P. Arroyo
2
, S. Recuero
2
,
E. Martínez
1
, J. Pelegrín
1
, F. Lera
1
and J.M. Andrés
3
1
Instituto de Ciencia de Materiales de Aragón, CSIC-University of Zaragoza
2
Instituto de Investigación en Ingeniería de Aragón, I3A, University of Zaragoza
3
Instituto de Carboquímica, CSIC
Zaragoza,
Spain
1. Introduction
The possibility of applying non-destructive techniques is important in the characterization
of different problems that are associated with the use of high temperature superconducting
materials in diverse technological applications. In this context, optical characterization
techniques are being implemented in the analysis of several properties of solid materials
due to their non-destructive nature. In particular, in some optical techniques the sample is
illuminated with a coherent light and the recorded images present a granularity. This
granularity is called speckle and its origin comes from the interference of the light scattered
by the different points of the surface (Goodman, 1975b; Andrés et al., 2008). In consequence,
any change taking place in the surface is immediately transferred to the speckle. Some
speckle techniques that use digital recording have been developed. In this work, we present
the applicability of Digital Speckle Pattern Interferometry (DSPI) and Digital Speckle
Photography (DSP) in the study of two important problems associated with high
temperature superconducting materials: the thermal stability and the environmental
degradation (Recuero et al., 2005a; Angurel et al., 2006).
Thermal stability is a great challenge in the development of applications. In comparison
with low-T
c
superconductors, thermal properties of High Temperature Superconductors
combine higher specific heat values and lower thermal conductivity ones. With these
properties, the normal zone propagation velocities in these materials are several orders of
magnitude lower than in the classical superconductors (Wang et al., 2007). Due to these
properties, usually a hot spot appears in these materials and an important heat amount is
generated leading to local temperature increases. Several stabilizing strategies have been
used in order to facilitate heat dissipation in higher volumes and to reduce the possibility of
local thermal degradation of the material. In addition, a great amount of work is being
performed in order to obtain information about quench generation and propagation in High
Superconductor
180
Temperature Superconductors. Usually, a local transition to the normal state is induced in
the sample while the temporal evolution of the temperature or/and the electric field along
the sample is recorded. Other experimental techniques that have been proposed are acoustic
noise detection (Lee et al., 2004), dynamic magneto-optical imaging (Song et al., 2009) or
fluorescent paints, which provide a two-dimensional temperature distribution during
quench propagation (Ishiyama et al., 2007).
Digital Speckle Pattern Interferometry (DSPI) has also been proposed as an adequate
technique to obtain valuable information about quench generation in different high
temperature superconductors (Recuero et al., 2005b, Lera et al., 2005, Angurel et al., 2008).
DSPI allows us to measure small displacements in diffusively reflecting objects (Rastogi,
2001). In this technique, a fringe pattern is obtained after having compared two
specklegrams, one recorded in a reference state and the second one after having produced a
deformation in the object. This fringe pattern has the information associated with the
displacement of each surface point. DSPI is adequate due to several of its properties: non-
contact nature, digital recording, high sensitivity and the possibility of obtaining
information of large surfaces. In the case of superconducting materials, the surface
deformation is associated with thermal expansion that is originated when a transition to the
normal state takes place in any point of the sample and its temperature increases. One of the
most important features of this technique is the ability for visualizing where a hot spot will
appear before it causes severe damage, thus marking the defective area where further
microstructural analyses are to be made looking for the associated defects (Lera et al., 2005).
The second problem that will be analysed is the environmental degradation of high
temperature superconductors in atmospheres with a high humidity (Argyropoulou et al.,
2007). These materials have a strong chemical reactivity with water and for this reason
environmental degradation plays an important role in the design of new applications in which
effective protective methods have to be considered. Speckle Photography is a technique that
has been proposed to study the surface degradation that takes place during corrosion (Fricke-
Begemann et al., 1999). The technique analyses the decorrelation that takes place in the speckle
images due to surface degradation. In this work, we show that Digital Speckle Photography
(DSP) is an adequate tool to obtain qualitative and quantitative information about the surface
degradation of different materials in different conditions, and, in particular, textured
Bi
2
Sr
2
CaCu
2
O
8+
δ
(Bi-2212) monoliths (Andrés et al., 2008, Recuero et al., 2008).
In this chapter, section 2 summarises the fundamentals of speckle techniques. Section 3
shows several examples of DSPI applied to the analysis of thermal stability on
superconductors: Bi-2212 monoliths and 2G HTS wires. Section 4 analyses the
environmental degradation of textured bulk Bi-2212 samples using DSP technique.
2. Fundamentals of speckle optical techniques
2.1 Introduction
Speckle techniques rely on a basic phenomenon that arises when an optically rough surface
is illuminated with a laser. Thus, a granular structure appears over it. These randomly
distributed spots are called speckles. The intensity of each speckle is the superposition of many
scattered waves with random intensities and phases, coming from different points of the object
surface. The specific pattern is related to the microstructure. Changes in the shape or structure
of the surface can be measured by comparing scattered speckle fields, which are obtained at
different states of the object. Two types of deformations are distinguished: Macroscopic
Application of Optical Techniques in the Characterization of Thermal Stability and
Environmental Degradation in High Temperature Superconductors
181
deformations, which lead to a bulk movement on the speckle pattern, and changes in the
microscopic structure of the surface, which induce modifications in the speckle pattern or
decorrelation. Depending on the case, different techniques can be used (Vest, 1979).
Speckle Interferometry is a technique that determines displacements or deformations. An
initial image of the object is taken as the reference state. The object is imaged on the sensor
of a CCD camera where it is superimposed to a reference beam. New images are taken by
the camera after a change in the object is produced. The subtraction of both images produces
an image with bright and dark fringes which represent iso-lines of equal deformation. The
technique is sensitive to out of plane displacements. It has been used in solids to determine
the out of plane deformation (Jones & Wykes, 1989) and, in fluids, to determine velocities
(Andrés et al., 1999; Andrés et al., 2001).
Speckle photography is a technique that compares intensities of the speckle fields and
determines alterations on the surface through movements or changes of the speckle pattern.
No reference wave is used in these images. Thus, phase information is lost but the method is
very simple and easy to use. Traditionally, this technique has been applied to measure the
in-plane displacements in solids (Archbold & Ennos, 1972), deformations (Fricke-Begemann,
2003) and roughness (Yamaguchi et al., 2004).
2.2 The speckle
The image recorded when a rough surface is illuminated with white light is different from that
obtained when a coherent laser beam is used. An example of a metallic surface sanded with
emery paper of 400# is presented in Fig. 1. In the image obtained with white light (Fig. 1.a) the
scratched structure produced by sand paper is distinguished. When the same object is
illuminated with a laser beam the image presents a granularity called speckle (Fig. 1.b).
The origin of this granularity is the coherent superposition of many scattered waves with
random intensities and phases, coming from different points of the object surface. This process
takes place when the sample surface is optically rough, that is, if the surface height variations
are greater that the optical wavelength (in this case λ ~ 6 x 10
-7
m). Thus, a coherent addition
of the scattered waves from different object points is obtained. The intensity of each speckle
changes from 0 to a maximum value depending on the interference state.
Fig. 1. Recorded images of a metallic sample sanded with emery paper of 400# and
illuminated: (a) with white light and (b) with a coherent laser beam.
A statistical analysis (Goodman, 1975b) is done by assuming that the phases of the small
contributions are uniformly distributed over a complete 2π-interval, that the amplitude and
phases are statistically independent variables, and that the number of contributions is
sufficiently large. This analysis leads to probability density functions of the intensity I and of
the phase of a fully developed, polarized speckle field as follows:
(a)
(b)
Superconductor
182
() ()
11
2
I
I
pI e p
I
θ
π
−
== (1)
where p(I)dI is the probability for a speckle to have an intensity value between I and I+dI
and p(θ)d θ is the probability for the phase to have a value between θ and θ+dθ.
There are two main geometries to observe the speckles. A freely propagating field, called
objective speckle, and the imaged speckle, called subjective speckle, when the object is
recorded by means of a lens system. In the techniques described in this section, speckles are
recorded on the image plane (subjective speckle). Thus, the speckle mean size d
s
is
determined by the following equation:
(
)
1
1.22
s
M
f
d
D
λ
+
=
(2)
where f is the focal length, M the magnification, λ the wavelength and D the aperture
diameter of the recording system.
2.3 Digital speckle photography (DSP)
In digital speckle photography, the object is illuminated with a laser beam under an angle θ
and the scattered light is imaged onto a CCD sensor (Fig. 2.a). The lens of the recording
system is determined by the required magnification. The speckle size must be bigger than
the pixel dimensions. The purpose of this technique is the comparison of two different
speckle patterns, corresponding to two object states. The first one is considered as the
reference state, and is recorded before the object modification process starts, while the
second one is recorded after the surface has been modified.
Fig. 2. (a) Digital Speckle Photography recording setup. (b) Plot of a 2D cross correlation
function.
As it is a digital recording, each speckle image is a matrix of intensity values, I(r), associated
with the intensity of the interference at each point of the image. The characteristics of the
CCD camera determine the intensity level range and the matrix dimensions. Due to the
random nature of the speckle fields, changes in the object surface cannot be inferred from
each individual speckle. The information has to be extracted through an averaging process.
Correlation functions are used to quantify the variation between the intensity fields in two
speckle images. The normalized 2D cross correlation function has been used. It is defined
as:
Application of Optical Techniques in the Characterization of Thermal Stability and
Environmental Degradation in High Temperature Superconductors
183
()
(
)
(
)
(
)
(
)
() ()
(
)
() ()
(
)
12
12 12
22
221/2
11 22
II
IrIr r IrIr
CC r
Ir Ir Ir Ir
+Δ −
Δ=
⎡⎤
−−
⎢⎥
⎣⎦
G
GG G G
G
GG GG
(3)
where I
1
(r) and I
2
(r) are the intensity field of the first and second speckle images,
respectively. This function has a different value for each Δr=(Δx,Δy) (Fig. 2.b), and has a
maximum at a certain value. The peak position is proportional to the in-plane sample
displacement and its height is related to the surface modifications. Both contributions can be
analysed separately. The peak value, also known as the correlation coefficient, changes from
1, when the surface remains unchanged, to cero that corresponds to a total decorrelation.
The calculation of the 2D cross correlation function using eq. 3 is a time consuming process,
it is numerically implemented with Fast Fourier Transform algorithms (Takeda, 1982).
Then:
()
()
[][]
1
12 12
IrIr r I I
−
⎡
⎤
⎡
⎤
+Δ = ℑ ℑ ℑ
⎣
⎦
⎣
⎦
G
GG
(4)
where
ℑ means Fourier Transform. The correlation coefficient can be calculated over the
full image or using correlation windows of N
x
x N
y
pixels. In the first case, the evolution of
the correlation coefficient gives a global value of surface changes. As the value at each
interrogation area indicates the local changes, the second procedure allows obtaining a 2D
correlation map
, with information on where the surface modification process has taken
place. The size of the sub-regions has to be big enough for the statistical analysis to be
feasible but as small as the size of the defects to be identified.
2.4 Digital speckle pattern interferometry (DSPI)
In digital speckle pattern interferometry, the light scattered by the object is made to interfere
with a reference beam (Fig. 3). This interference, called specklegram, is recorded on a CCD
camera at different time states. The reference wave is obtained by diverting a small amount of
the main laser beam. Due to the small spatial resolution of CCD cameras, the angle between
both beams has to be very small. Then, both beams are combined in front of the CCD camera
by means of a cube beam-splitter (Fig. 3). The sustration of two specklegrams, recorded for
different object states, produces an image, whose intensity in each point is proportional to:
I(x,y) ~ (1-cos
Δφ) (5)
where
Δφ is the phase difference in the object wave, which is related to the object local
displacement as:
Δφ=K·L (6)
with K=(k
o
-k
i
) the sensitivity vector, being k
i
and k
o
the wave vectors of the illumination
and observation beams and L the surface displacement vector.
Since the fringes are loci of constant phase difference, the deformation vector components
can be measured using appropriate configurations. In many cases, the visual aspect of the
fringes, that represent regions of equal displacement, can provide enough information in the
analysis of a given experiment.
In order to know the quantitative phase difference value, spatial phase shifting (SPS) can be
introduced (Burke et al., 1998; Creath, 1985). It is based on the addition of a known phase
Superconductor
184
function called phase carrier. A conventional DSPI setup can be turned into a SPS-DSPI
setup by shifting the origin of the smooth divergent reference wave with respect to the lens
centre an amount
Δx (Fig. 4). This generates a linear phase shift in the x-direction of the
sensor. The phase-shifted data are recorded simultaneously on adjacent pixels, in the same
speckle. To resolve this modulation frequency, a phase shift of 2
π (maximum-minimum-
maximum) must be recorded in each speckle instead of the constant phase in a standard
speckle of a DSPI specklegram. Thus, the speckle size is appropriately increased up to a
value of around 3 pixels.
Fig. 3. Digital Speckle Inteferometry setup
Fig. 4. Experimental setup used for introducing SPS in a DSPI system.
Phase maps are obtained using a global Fourier Transform method (FTM) (Takeda et al.,
1982; Lobera et al., 2004). This analysis is based on the calculation of the Fourier transform of
the specklegram. The positive frequency side lobe is isolated and translated to the origin to
eliminate the carrier frequency component. The inverse discrete Fourier transform is then
carried out, and the object phase at each pixel is obtained. A phase difference map, instead
of a intensity map, is retrieved by subtracting two object phase maps. For visualization, the
phase differences are mapped to grey levels such as that 0 is black and 2
π is white, given
that the phase differences are wrapped (only known in the range 0 to 2π).
Although this technique is more sensitive to out-of-plane displacements, if big changes take
place on the surface the correlation between images decreases and then the visibility of the
fringe pattern decreases and even disappears.
Application of Optical Techniques in the Characterization of Thermal Stability and
Environmental Degradation in High Temperature Superconductors
185
3. Analysis of quench generation in high temperature superconductors using
digital speckle pattern interferometry
In this section we show several examples on the use of DSPI for the analysis of the thermal
stability in High Temperature Superconductors. First, we present the experimental
modifications needed to apply this technique in cryogenic conditions, as required for the
study of superconducting materials, and then we show several examples of inhomogeneity
along the length in the transition from superconductor to normal state in different materials.
3.1 Experimental modifications required to apply DSPI in cryogenic conditions
In this application, DSPI has to be used while the superconducting material is in the
superconducting state, at temperatures close to 77 K. For this reason, it has been necessary
to build a new experimental set-up (Recuero et al., 2005). A glass dewar (height of 420 mm
and diameter of 200 mm) was designed with several 85 mm x 100 mm windows with optical
access for different optical techniques (Fig. 5.a). This window was heated with an external
manganin resistance to avoid any condensation on the external wall that could strongly
disturb the DSPI observations.
Two different DSPI configurations have been used in different works. In the first one the
sample was illuminated at an angle of
ϕ=45º (Recuero et al., 2005, Lera et al., 2005). The
angle between the illumination and the recording direction was 90º. With this set-up two
optical windows were required to illuminate and to observe the sample. The sensitivity of
the technique was 0.45
μm per fringe. As can be observed in Fig. 5.b, ϕ can be reduced. In
the case of the second configuration
ϕ =10º (Angurel et al., 2008, Angurel et al., 2009), only
one optical window was required and the sensitivity increased up to 0.28
μm/fringe. In
both cases, the size of this window can be adjusted to the sample size.
One of the difficulties to overcome is the need of a stable atmosphere around the sample.
In the initial experiments, the sample was fixed to an aluminium plate held at the centre
from the dewar top cover and it was cooled by a conduction system, thermally anchored
to the aluminium plate, which is partially immersed in liquid nitrogen. In these
conditions, the sample cannot be placed inside liquid nitrogen because liquid movements
induce some changes in the refraction index that create a random fringe pattern and hide
any observation related to the sample deformation. For this reason, the sample was
usually placed above the liquid surface and the pressure inside the dewar was reduced to
approximately 0.1 atm.
Obviously it is also interesting to obtain information about quench generation with samples
immersed in liquid nitrogen because in some applications these superconducting materials
have to work in these conditions. A new experimental configuration, with the sample placed
very close to the dewar window, was designed (Angurel et al., 2009) (Fig. 5.b). In this case,
the sample was placed closer to the dewar wall in order to reduce the light path inside the
liquid nitrogen from 20 cm to 1 cm. The measurement procedure consists on reducing the
pressure inside the dewar and wait for approximately 15 minutes. It has been observed that
during this time, the random fringe pattern transforms in a series of near horizontal fringes
whose number decreases with time (Fig. 6) and finally almost disappears. This means that
liquid nitrogen movement changes from a random state to a still stratified one and finally it
stabilizes. In these conditions, there is a time window of approximately 10-15 minutes where
the sample displacements can be visualized. The sample temperature can be controlled by
changing the gas pressure inside the dewar.
Superconductor
186
Fig. 5. (a) Experimental arrangement used to apply DSPI in cryogenic conditions. (b) Detail
of the modification performed for placing the sample close to the dewar window in order to
take measurements with the sample immersed in liquid nitrogen.
Fig. 6. Fringe patterns associated with liquid nitrogen movements at different instants after
having reduced the pressure inside the dewar.
3.2 Hot spot generation in Bi-2212 monoliths
Properties of bulk Bi-2212 monoliths are determined by the quality of the intergranular
junctions. Laser melting techniques were introduced as an adequate tool to texture these
materials in a planar geometry and to obtain good superconducting properties (Mora et al.,
2003). When the material transits to the normal state, heat dissipation starts in the points
where the junctions have the poorest properties. These materials have very low thermal
5 min
(a)
(b)
9 min
11 min
13 min
Application of Optical Techniques in the Characterization of Thermal Stability and
Environmental Degradation in High Temperature Superconductors
187
conductivity values and this local heat generation induces inhomogeneous temperature
increments that can deteriorate the superconductor.
Experiments were performed with the optical configuration that had a sensitivity of 0.45
μm/fringe for deformations in the direction perpendicular to the sample surface (Recuero et
al., 2005; Lera et al., 2005). The sample was fixed by one point to the aluminium plate in
order to avoid the movement of the sample and to have a fixed reference point (Fig. 7). The
sample and the metallic support were electrically isolated.
Fig. 7. Photograph of the system used to hold the Bi-2212 monoliths.
An initial characterization was performed at room temperature. In this case, small currents
were applied for some seconds and the fringe pattern was recorded. At the same time, the
resistance change, which is proportional to the temperature variation, was measured. Fig. 8
shows the time dependence of the resistance that was measured in a Bi-2212 monolith at
room temperature for different applied current values. The observed behaviour correlates
with the DSPI fringe patterns recorded at different instants (Fig. 9). The fringe pattern
corresponds to a bending sample movement with fringes appearing in the image right side.
In the case of 1.5 A only two fringes are observed, they appear at t=20s and they remain
constant during the rest of the pulse. In the case of a current of 2.5 A, the number of fringes
increases up to 6, at t=40s, remaining unchanged afterwards. As in other samples (Lera et
al., 2005) the number of fringes is proportional to the resistance change and, in consequence,
to the temperature variations. This confirms that the number of fringes is related to the
sample deformation associated with thermal expansion.
These monoliths were also characterized at temperatures below
T
c
, applying current pulses
higher than the critical current value (Recuero et al., 2005). Samples were cooled by
conduction. A rotary pump vacuum was made in order to eliminate unwanted fringe
patterns associated with gas movement. As it has been mentioned, in these materials, when
a current higher than the critical current value is applied, dissipation starts at the points
with the poorer superconducting properties. This is reflected on a different fringe pattern
shape. Fringes arise from a point whose location coincides with the point that has the poorer
properties. An example in which the applied current is approximately 3 times higher than
the critical current is presented in Fig. 10. This was confirmed by applying higher currents
values, with the objective of generating enough heat to melt the sample. Results showed
that melting was originated in a point (Fig. 10), that coincided with the point where the
fringes were originated.
In consequence, DSPI allows determining where a hot spot will be located. The main
advantage is that it can be located when the temperature reached by the sample is lower that
100 K. These experimental conditions do not deteriorate the sample. For this reason, these
Superconductor
188
studies can be performed combined with microstructural analysis in order to obtain
information on the defects that are responsible of the hot spot generation (Lera et al., 2005).
In these materials, texture processing induces a microstructure where the grains are very
well aligned to the sample axis. DSPI showed that the hot spots were located in regions
where many holes, originated during the texturing process, were concentrated.
27.8
28.0
28.2
28.4
28.6
28.8
29.0
0 1020304050607080
Resistance (mΩ)
t (s)
1 A
1,5 A
2 A
2,5 A
Fig. 8. Time dependence of the Bi-2212 monolith resistance at room temperature for different
applied currents.
1.5 A
10 s 20 s 40 s
80 s
2.5 A
10 s 20 s 40 s
80 s
Fig. 9. Fringe patterns obtained in a Bi-2212 monolith at room temperature for two applied
currents at different times.
This example shows that DSPI observations can be used to obtain information on the origin
of hot spots and how the processing conditions can be modified in order to control these
defects and to reduce their influence on the final properties of the superconducting material.
Application of Optical Techniques in the Characterization of Thermal Stability and
Environmental Degradation in High Temperature Superconductors
189
Fig. 10. Fringe pattern observed in a Bi-2212 monolith at low temperature when a current
higher that the critical current is applied. Longitudinal and transverse photographs of the
sample after having applied a high current pulse that melted it.
3.3 Quench generation in 2G HTS wires
Visualization of quench generation in 2G HTS wires has also been analysed using DSPI
techniques (Angurel et al., 2008; Angurel et al., 2009). This work is being performed in the
framework of a collaboration with SuperPower Inc The experiments were done in
homogeneous samples as well as in samples with a controlled defect. This defect produced a
local reduction of the critical current value at 77 K to values around a 20% of the average
value. Experiments were performed with the sample placed both above and below the
liquid nitrogen level. In the first case, two different cooling conditions were used: with the
sample fixed to an isolation sample holder or fixed to a metallic holder. The main result
(Angurel et al., 2008) is that quench generation does not always appears in the point with
the lower critical current value and that other facts as the cooling conditions or
inhomogeneities in the sample thermal stabilization can play a fundamental role.
The results presented here correspond to the case of the sample immersed in liquid
nitrogen, as required in many applications of these conductors. For this reason, as it was
mentioned in section 3.1, an effort was made for performing DSPI observations in these
challenging experimental conditions (Angurel et al., 2009). In addition, the measuring
system has been modified in order to obtain simultaneous measurements of the optical
properties and of the electric field and temperature profiles during the current pulse.
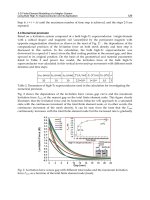
Fig. 11 and Fig. 12 show the results of the DSPI technique applied to two different samples
of the same batch, corresponding to a SCS4050 2G HTS wire with a width of 4 mm and a 20
μm thick stabilizing copper layer. A special sample holder was designed for allowing both
sides of the sample to be in contact with liquid nitrogen or for placing the sample on a
metallic support. The sample is fixed at the two ends and, for this reason, the deformation
associated with the thermal stabilization leads to the bending of the sample.
Fig. 11 shows the typical behaviour of a homogeneous sample, as it is seen by the electric
field and by the temperature profiles, during a pulse of 120 A for 3 s while the sample was
immersed in liquid nitrogen and T=78.6K (I
c
(77K)=123 A) because the pressure inside the
dewar was above atmospheric pressure. Both sides of the sample are in contact with liquid
nitrogen. The electric field values at the pulse end is on the order of 3x10
-4
V/cm (Fig. 11.a)
and temperature rises less than 0.8 K (Fig. 11.b). DSPI fringe patterns are presented in Fig.
11.c to 11.h. In this case, the reference state has been recorded before applying the pulse and
Meltin
g
re
g
io
n
Superconductor
190
Fig. 11. (a) Electric field and (b) temperature profiles recorded in a 2G HTS wire after
applying a current pulse of 120 A for 3 s at 78.6K. (c) to (h) Fringe patterns observed at
different instants: 0.15s, 0.59s, 1.25s, 1.69s, 2.23s, 2.78s, taking as reference t=0s.