Advances in Lasers and Electro Optics Part 16 pptx
Bạn đang xem bản rút gọn của tài liệu. Xem và tải ngay bản đầy đủ của tài liệu tại đây (7.91 MB, 50 trang )
Combining Optical Coherence Tomography with Fluorescence Imaging
731
Haberland, U. H. P., Blazek, V. & Schrnitt, H. J. (1998) Chirp optical coherence tomography
of layered scattering media. Journal of Biomedical Optics, 3, 259-266.
Hariri, L. P., Tomlinson, A. R., Wade, N. H., Besselsen, D. G., Utzinger, U., Gerner, E. W. &
Barton, J. K. (2007) Ex vivo optical coherence tomography and laser-induced
fluorescence spectroscopy imaging of murine gastrointestinal tract. Comparative
Medicine, 57, 175-185.
Hariri, L. P., Tumlinson, A. R., Besselsen, D. G., Utzinger, U., Gerner, E. W. & Barton, J. K.
(2006) Endoscopic optical coherence tomography and laser-induced fluorescence
spectroscopy in a murine colon cancer model. Lasers in Surgery and Medicine, 38,
305-313.
Hillman, E. M., Boas, D. A., Dale, A. M. & Dunn, A. K. (2004) Laminar optical tomography:
demonstration of millimeter-scale depth-resolved imaging in turbid media. Optics
Letters, 29, 1650-1652.
Hillman, E. M. C., Bernus, O., Pease, E., Bouchard, M. B. & Pertsov, A. (2007) Depth-
resolved optical imaging of transmural electrical propagation in perfused heart.
Optics Express 15, 17827-17841.
Huang, D., Swanson, E. A., Lin, C. P., Schuman, J. S., Stinson, W. G., Chang, W., Hee, M. R.,
Flotte, T., Gregory, K., Puliafito, C. A. & Fujimoto, J. G. (1991) Optical coherence
tomography. Science, 254, 1178-1181.
Huber, R., Wojtkowski, M. & Fujimoto, J. G. (2006) Fourier Domain Mode Locking (FDML):
A new laser operating regime and applications for optical coherence tomography.
Optics Express, 14, 3225-3237.
Iftimia, N. V., Hammer, D. X., Bigelow, C. E., Rosen, D. I., Ustun, T., Ferrante, A. A., Vu, D.
& Ferguson, R. D. (2006) Toward noninvasive measurement of blood hematocrit
using spectral domain low coherence interferometry and retinal tracking. Optics
Express, 14, 3377-3388.
Jang, I. K., Tearney, G. J., Macneill, B., Takano, M., Moselewski, F., Iftima, N., Shishkov, M.,
Houser, S., Aretz, H. T., Halpern, E. F. & Bouma, B. (2005) In-vivo characterization
of coronary atherosclerotic plaque by use of Optical Coherence Tomography.
Circulation, 111, 1551-1555.
Jemal, A., Siegel, R., Ward, E., Hao, Y., Xu, J., Murray, T. & Thun, M. J. (2008) Cancer
statistics, 2008. CA a Cancer Journal for Clinicians, 58, 71-96.
Kak, A. C., Slaney, M. & Ieee Engineering in Medicine and Biology Society. (1987) Principles
of computerized tomographic imaging, New York, IEEE Press.
Levitz, D., Thrane, L., Frosz, M. H., Andersen, P. E., Andersen, C. B., Valanciunaite, J.,
Swartling, J., Andersson-Engels, S. & Hansen, P. R. (2004) Determination of optical
scattering properties of highly-scattering media in optical coherence tomography
images. Optics Express, 12, 249-259.
Li, A., Miller, E. L., Kilmer, M. E., Brukilacchio, T. J., Chaves, T., Stott, J., Zhang, Q., Wu, T.,
Chorlton, M., Moore, R. H., Kopans, D. B. & Boas, D. A. (2003) Tomographic optical
breast imaging guided by three-dimensional mammography. Applied Optics, 42,
5181-5190.
Advances in Lasers and Electro Optics
732
Li, X. D., Boppart, S. A., Van Dam, J., Mashimo, H., Mutinga, M., Drexler, W., Klein, M.,
Pitris, C., Krinsky, M. L., Brezinski, M. E. & Fujimoto, J. G. (2000) Optical coherence
tomography: advanced technology for the endoscopic imaging of Barrett's
esophagus. Endoscopy, 32, 921-930.
Liu, B. & Brezinski, M. E. (2007) Theoretical and practical considerations on detection
performance of time domain, Fourier domain, and swept source optical coherence
tomography. Journal of Biomedical Optics, 12, 044007.
Mandel, L. & Wolf, E. (1995) Optical Coherence and Quantum Optics, Cambridge University
Press, Cambridge, England.
Marten, K., Bremer, C., Khazaie, K., Sameni, M., Sloane, B., Tung, C. H. & Weissleder, R.
(2002) Detection of dysplastic intestinal adenomas using enzyme-sensing molecular
beacons in mice. Gastroenterology, 122, 406-414.
Mcnally, J. B., Kirkpatrick, N. D., Hariri, L. P., Tumlinson, A. R., Besselsen, D. G., Gerner, E.
W., Utzinger, U. & Barton, J. K. (2006) Task-based imaging of colon cancer in the
Apc(Min/+) mouse model. Applied Optics, 45, 3049-3062.
Ntziachristos, V., Tung, C. H., Bremer, C. & Weissleder, R. (2002) Fluorescence molecular
tomography resolves protease activity in vivo. Nature Medicine, 8, 757-760.
Ntziachristos, V. & Weissleder, R. (2001) Experimental three-dimensional fluorescence
reconstruction of diffuse media by use of a normalized Born approximation. Optics
Letters, 26, 893-895.
Otis, L. L., Everett, M. J., Sathyam, U. S. & Colston, B. W., Jr. (2000) Optical coherence
tomography: a new imaging technology for dentistry. The Journal of the American
Dental Association, 131, 511-4.
Pan, Y. T., Xie, T. Q., Du, C. W., Bastacky, S., Meyers, S. & Zeidel, M. L. (2003) Enhancing
early bladder cancer detection with fluorescence-guided endoscopic optical
coherence tomography. Optics Letters, 28, 2485-2487.
Pope, R. M. & Fry, E. S. (1997) Absorption spectrum (380-700 nm) of pure water. II.
Integrating cavity measurements. Applied Optics, 36, 8710-8723.
Roney, C. A., Xie, J., Xu, B., Jabour, P., Griffiths, G. & Summers, R. M. (2008) Glycoprotein
expression by adenomatous polyps of the colon. Proceedings of SPIE, 6916, 69161O.
Schmitt, J. M. (1999) Optical coherence tomography (OCT): a review. IEEE Journal of
Selected Topics in Quantum Electronics, 5, 1205-1215.
Schmitt, J. M., Knuttel, A. & Bonner, R. F. (1993) Measurement of Optical-Properties of
Biological Tissues by Low-Coherence Reflectometry. Applied Optics, 32, 6032-6042.
Schuman, J. S., Puliafito, C. A. & Fujimoto, J. G. (2004) Optical coherence tomography of
ocular diseases (2nd Edition), Thorofare, NJ, Slack Inc.
Sivak, M. V., Jr., Kobayashi, K., Izatt, J. A., Rollins, A. M., Ung-Runyawee, R., Chak, A.,
Wong, R. C., Isenberg, G. A. & Willis, J. (2000) High-resolution endoscopic imaging
of the GI tract using optical coherence tomography. Gastrointestinal Endoscopy, 51,
474-479.
Tearney, G. J., Brezinski, M. E., Bouma, B. E., Boppart, S. A., Pitvis, C., Southern, J. F. &
Fujimoto, J. G. (1997) In vivo endoscopic optical biopsy with optical coherence
tomography. Science, 276, 2037-2039.
Combining Optical Coherence Tomography with Fluorescence Imaging
733
Troy, T. L. & Thennadil, S. N. (2001) Optical properties of human skin in the near infrared
wavelength range of 1000 to 2200 nm. Journal of Biomedical Optics, 6, 167-176.
Tumlinson, A. R., Hariri, L. P., Utzinger, U. & Barton, J. K. (2004) Miniature endoscope for
simultaneous optical coherence tomography and laser-induced fluorescence
measurement. Applied Optics, 43, 113-121.
Tung, C. H., Mahmood, U., Bredow, S. & Weissleder, R. (2000) In vivo imaging of
proteolytic enzyme activity using a novel molecular reporter. Cancer Research, 60,
4953-4958.
Turchin, I. V., Sergeeva, E. A., Dolin, L. S., Kamensky, V. A., Shakhova, N. M. & Richards-
Kortum, R. (2005) Novel algorithm of processing optical coherence tomography
images for differentiation of biological tissue pathologies. Journal of Biomedical
Optics, 10, 064024.
Vanstaveren, H. J., Moes, C. J. M., Vanmarle, J., Prahl, S. A. & Vangemert, M. J. C. (1991)
Light-Scattering in Intralipid-10-Percent in the Wavelength Range of 400-1100 nm.
Applied Optics, 30, 4507-4514.
Wang, C. S., Cheng, W. H., Hwang, C. J., Burns, W. K. & Moeller, R. P. (1982) High-Power
Low-Divergence Super-Radiance Diode. Applied Physics Letters, 41, 587-589.
Wang, R. K. (2007) Fourier domain optical coherence tomography achieves full range
complex imaging in vivo by introducing a carrier frequency during scanning.
Physics in Medicine and Biology, 52, 5897-5907.
Wang, Z. G., Durand, D. B., Schoenberg, M. & Pan, Y. T. (2005) Fluorescence guided optical
coherence tomography for the diagnosis of early bladder cancer in a rat model.
Journal of Urology, 174, 2376-2381.
Welzel, J., Reinhardt, C., Lankenau, E., Winter, C. & Wolff, H. H. (2004) Changes in function
and morphology of normal human skin: evaluation using optical coherence
tomography. British Journal of Dermatology, 150, 220-225.
Wojtkowski, M., Leitgeb, R., Kowalczyk, A., Bajraszewski, T. & Fercher, A. F. (2002) In vivo
human retinal imaging by Fourier domain optical coherence tomography. Journal
of Biomedical Optics, 7, 457-463.
Yasuno, Y., Endo, T., Makita, S., Aoki, G., Itoh, M. & Yatagai, T. (2006) Three-dimensional
line-field Fourier domain optical coherence tomography for in vivo dermatological
investigation. Journal of Biomedical Optics, 11, 014014.
Youngquist, R., Carr, S. & Davies, D. (1987) Optical coherence-domain reflectometry: a new
optical evaluation technique. Optics Letters, 12, 158-160.
Yuan, S., Li, Q., Jiang, J., Cable, A., & Chen, Y. (2009) Three-dimensional coregistered optical
coherence tomography and line-scanning fluorescence laminar optical tomography.
Optics Letters, 34, 1615-1617.
Yuan,S., Roney, C. A., Li, Q., Jiang, J., Cable, A., Summers, R. M. & Chen, Y. (2010a)
Correlation of morphological and molecular parameters for colon cancer.
Proceedings of SPIE 7555. (Submitted)
Yuan,S., Roney, C. A., Wierwille, J., Chen, C. W., Xu, B., Griffiths, G., Jiang, J., Ma, H., Cable,
A., Summers, R. M. & Chen, Y. (2010b) Co-registered optical coherence tomography
Advances in Lasers and Electro Optics
734
and fluorescence molecular imaging for simultaneous morphological and
molecular imaging. Physics in Medicine and Biology, 55, 191-206.
Zaccanti, G., Del Bianco, S. & Martelli, F. (2003) Measurements of optical properties of high-
density media. Applied Optics, 42
, 4023-4030.
31
Polarization-Sensitive Optical Coherence
Tomography in Cardiology
Wen-Chuan Kuo
Institute of Electro-optical Science and Technology, National Taiwan Normal University
Taiwan
1. Introduction
Atherosclerotic vascular disease is a common cause of morbidity and mortality in developed
countries (Arroyo & Lee, 1999). In particular, the rupture of atherosclerotic plaques is the
most common event initiating acute ischemic heart disease (Shah, 2003). Therefore, it is
crucial to detect vulnerable coronary atheromatous plaques prior to their rupture or erosion
to prevent irreversible myocardial damage. Autopsy studies have identified several
histological characteristics of these vulnerable plaques, such as a large lipid pool, thin
fibrous cap (<65 μm), and activated macrophages near the fibrous cap (Falk et al., 1995).
Therefore, modalities capable of visualizing the vessel wall might help in detecting lesions
with high risks for acute events (Pasterkamp et al., 2000; Peters et al., 1994). There are
several plaque imaging modalities. The oldest and most widely used technology is X-ray
angiography, which can detect narrowing of the coronary blood vessels. The first imaging
technique to demonstrate the benefits of imaging inside the arterial wall is intravascular
ultrasound (IVUS). However, the current resolution is not sufficient to visualize the thin
fibrous caps and small disruptions within the intimal and medial dissections. In the 1980s,
coronary angioscopy, which allows direct visualization of the surface color and superficial
morphology of atherosclerotic plaque, thrombus, neointima, and stent struts, was
introduced. However, it cannot help in the assessment of subsurface lesions. Other
proposed techniques include electron beam computed tomography (EBCT), magnetic
resonance imaging (MRI), or positron emission tomography (PET); these are noninvasive
screening tools that do not subject the patient to catheterization. In addition to the
aforementioned techniques, which are merely a selection of the imaging modalities
currently used in vivo or that are in the validation stage, the use of optical techniques for
biomedical imaging is gaining considerable attention. This is largely due to the potential of
optical techniques to provide high-resolution imaging without the need for ionizing
radiation and associated risks.
Optical coherence tomography (OCT), which is based on a low-coherence interferometer,
has emerged as a rapid, non-contact and noninvasive, high-resolution imaging tool (Huang
et al., 1991). From the mid-1990s, the ability of intravascular OCT to provide high-resolution
(10–20 μm) cross-sectional images of both in vitro human aorta and coronary arteries has
been demonstrated (Brezinski et al., 1996; Fujimoto et al., 1995). The resolution of OCT
images was up to 10 times better than that of conventional ultrasound, MRI, and computed
tomography (CT) (Jang et al., 2002; Yabushita et al., 2002). Therefore, using OCT, small
Advances in Lasers and Electro Optics
736
structural details (such as the width of intimal caps and the presence of fissures in
atherosclerotic plaques (Bresinski et al., 1997) could be resolved and intramural collections
of lipid within the intima of a vessel wall could be detected (Brezinski et al., 1996; Fujimoto
et al., 1995). Furthermore, the objective OCT image criterion for risk-stratifying plaque
characterization has been established on the basis of the intrinsic optical properties of a
typical plaque, whose constituents are lipid, calcium, and fibrous tissue (Bresinski et al.,
1997; Jang et al., 2002; Stamper et al., 2006; Tearney et al., 2006; Yabushita et al., 2002). On
this basis, OCT has a detection sensitivity and specificity of 71%–79% and 97%–98% for
fibrous plaques, 95%–96% and 97% for fibrocalcific plaques, and 90%–94% and 90%–92% for
lipid-rich plaques, respectively (Tearney et al., 2006; Yabushita et al., 2002). Moreover, OCT
has also been shown to quantify plaque macrophage content (Tearney et al., 2003) in lipid-
rich plaques and to assess the success of intracoronary stent implantation in patients with
coronary artery disease during percutaneous intra-arterial procedures (Bouma et al., 2003).
At present, a company, LightLab Imaging, is targeting the cardiovascular market using
commercializing intravascular OCT technology by providing dedicated imaging wires and
occlusion balloon catheters.
In general, OCT images are obtained from measurements of the echo time delay and the
intensity of the backscattered light from a specimen. Further, OCT employs the inherent
differences in the index of refraction, rather than enhancement with dyes, to differentiate
tissue types. However, since the plaque components are heterogeneous, they may
sometimes generate reflected signals that confuse or obscure the identity of these
components; multiple scattering by the cap also creates difficulties in identifying the plaque
due to the diffuse nature of the plaque border (Stamper et al., 2006). Polarization-sensitive
OCT (PS-OCT), a functional mode of OCT, combines the advantages of OCT with additional
image contrasts obtained by using the birefringence of the specimen as a contrast agent.
Many biological tissues have a microscopic fibrous structure and so exhibit intrinsic
birefringence. Moreover, changes in birefringence may indicate changes in functionality,
structure, or viability of tissues in the early stages of the disease (de Boer et al., 1997).
From 2004, we have been presenting the application of PS-OCT in human atherosclerosis,
and have proposed approaches to characterize a plaque lesion on the basis of its
birefringence property (Kuo et al., 2004; 2005; 2007). Moreover, in a recent study, our
laboratory has assessed the arterial characteristics in human atherosclerosis by
quantitatively determining both scattering and birefringence properties of vessel tissue from
PS-OCT images (Kuo et al., 2007; 2008). Based on our findings, a quantitative PS-OCT image
criterion for plaque characterization was constructed. In the remainder of this chapter, the
results that we obtained using the PS-OCT system for imaging human atherosclerosis in
vitro are summarized. We hope that our results, along with the results from other
investigators, will construe a step forward in the application of PS-OCT imaging technology
for clinically diagnosing atherosclerosis in the near future.
2. Principle of polarization-sensitive optical coherence tomography (PS-OCT)
system
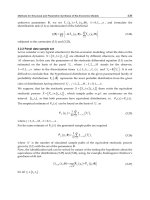
The optical setup of the PS-OCT system used in this study is shown in Fig. 1. A collimated
beam from a superluminescent diode (SLD) centered at a wavelength of 837 nm with a
spectral bandwidth of 17.5 nm was used as a low-coherence light source in a Michelson
interferometer. The axial resolution, which depends on the temporal coherence properties of
Polarization-Sensitive Optical Coherence Tomography in Cardiology
737
the SLD), was 17 μm, while the lateral resolution (determined by the numerical aperture of
the objective) was 10 μm. The incident beam was vertically polarized by a polarizer placed
in the interferometer. A nonpolarization beam splitter (BS) was used to split the light wave
into signal and reference beams. In the Michelson interferometer, a quarter-wave plate
(QWP) with an azimuth angle set at 45° to the horizontal was used to focus the circular
polarized light onto the examined specimen. On the other hand, the reference beam light
was directed to a plane mirror mounted on a linear translator, which repetitively scanned
the reference arm optical path length at a constant speed (1 mm/s). Another QWP (set at
22.5° to the horizontal) in the reference beam path rotated the polarization of the incident
laser beam by 45°, thereby becoming the reflected reference beam.
Fig. 1. Schematic of the conventional PS-OCT system: SLD, superluminescent diode; QWP,
quarter wave plate; M, reference mirror; BS: beam slitter; PBS, polarized beam splitter; Dp
and Ds, photo-detectors; PC, personal computer.
The laser beam was reflected from the specimen and recombined with the reflected
reference beam, and then both the horizontal (P wave) and vertical components (S wave)
were independently directed toward two photodetectors Dp and Ds, respectively, using a
polarized BS (PBS). From the ac coupling of the detector signals, the full interferometric
signals were recorded. The amplitudes A
i
(z) and phases φ
i
(z) of the interference signals at
different depths (z) were determined using the Hilbert transform; i = P and S represent the P
and S polarization states, respectively. Three parameters—the backscatter intensity R(z),
phase retardation
)(zΦ
, and fast-axis angle β(z) of a specimen—were calculated using the
amplitude and phase of the interference signal (Hitzenberger et al., 2001):
22
)(A)(A~)( zzzR
SP
+
(1)
Advances in Lasers and Electro Optics
738
()
)(/)(tan)(
1
zAzAz
PS
−
=Φ
(2)
)180(2/1)(
φ
β
Δ−°×=z
(3)
Here,
P
S
φφ φ
Δ= −
is the phase difference between the P- and S-polarized heterodyne signals.
Finally, 2D images of the above three parameters were obtained simultaneously by using
repeated A-scan acquisition and mechanically scanning the specimens laterally through a
focused 0.5 mW signal beam. In this experiment, the system sensitivity was obtained as 100
dB using a highly reflective plane mirror as the test object in this setup. The following
section demonstrates our preliminary in vitro investigations of human aortic specimens
using PS-OCT.
In this study, we adapted a free-space PS-OCT system to precisely control the polarization
state of the laser beam used in birefringent imaging. Several other groups have developed a
high speed fiber-based PS-OCT system for application as a medical instrument in vivo (Guo
et al., 2004; Park et al., 2001; 2004; Saxer et al., 2000). Moreover, an optically clear
hemoglobin-based blood substitute has also been used to displace blood and enable OCT
imaging with minimal patient discomfort (Villard et al., 2002). Further, several Fourier
domain PS-OCT techniques (Park et al., 2005; Yamanari et al., 2006; Zhang et al., 2004) have
been reported recently and have received considerable attention due to the high data
acquisition rates (e.g., acquisition at 80 to 110 fps), which can eliminate motion artifacts and
reduce ischemia during blood-free optical imaging. This allows for comprehensive scanning
of long arterial segments during a short balloon occlusion or even 1 bolus liquid flush
without occlusion. The first clinical study using this technology is being initiated in order to
investigate vulnerable plaque hypothesis in a prospective multicenter manner. By
combining the above features, PS-OCT can be used to measure reflected intensity, phase
retardation, and fast-axis angle distributions, and thereby provide a greater contrast than is
available with conventional OCT systems.
3. In vitro PS-OCT imaging of human atherosclerosis
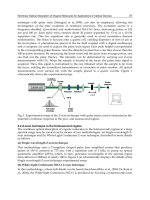
Specimens of the aorta with white or yellow plaque were obtained from heart transplant
recipients at the National Taiwan University Hospital, Taiwan. The photographs of some
specimens are shown in Fig. 2. The protocol was approved by the ethics committees of the
National Taiwan University Hospital. The specimens were dipped in saline (4
°
C), cut into
segments smaller than 1 × 1 cm, and examined. Each segment was mounted in a cuvette and
moistened with a normal saline bath maintained at 37
°
C during the imaging. Only the
intimal surface was exposed for PS-OCT imaging. The aortic specimen regions imaged with
PS-OCT were marked for subsequent histopathological examination. After PS-OCT imaging,
all the specimens were fixed in 10% neutral formalin for 24 h and then processed for
standard paraffin embedding. Serial sections with 4 μm thickness were cut within the region
of the PS-OCT examination, and stained with hematoxylin and eosin (H and E) for routine
examination. The distribution of the collagen structure in the plaque lesion was also
examined using Masson trichrome and picrosirius red staining procedures as well as a
polarization microscope. Finally, the entire specimens were classified into normal vessel (N),
lipid (L), fibrocalcific (C), and fibrous lesions (F) by a pathologist (J. J. Shyu).
Polarization-Sensitive Optical Coherence Tomography in Cardiology
739
Fig. 2. Photographs of the aorta with white or yellow plaque.
Fig. 3. Histological and PS-OCT images of a normal aortic wall (left column) and a plaque
with lipid-loaded lesion (right column): (a) Histology (H and E; magnification ×100); (e)
Histology (Masson’s trichrome; magnification ×40); (b), (f) Back-scattered intensity image;
(c), (g) Phase retardation image (linear color scale degrees); (d), (h) Fast-axis angle image
(linear color scale degrees).
Advances in Lasers and Electro Optics
740
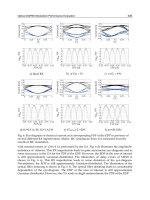
The PS-OCT images of representative specimens are shown in Figs. 3–6. The histological
image of the normal vessel wall [Fig. 3(a)] showing a medial layer below the intima is
compared with the PS-OCT image of the same specimen [Fig. 3(b)]. The signal-rich layer
closest to the lumen is the intima. In the normal vessel wall, the phase retardation increases
uniformly [Fig. 3(c)], and the pseudocolor distribution of the fast-axis angle signals is also
uniform [Fig. 3(d)]. The pale area in Fig. 3(e) is a subintimal lipid-loaded region (L), which is
morphologically composed mostly of the necrotic debris of foamy cells. Because of the
paraffin embedding process, the solvent treatment removes the lipid from these lipid-loaded
structures, which therefore appear as empty spaces in stained sections [Fig. 3(e)]. The
corresponding PS-OCT image [Fig. 3(f)] reveals a decreased signal density under a thin
homogeneous surface band. Moreover, the phase retardation and fast-axis angle signals are
distributed in a slightly more random manner in the atherosclerotic lesion [Figs. 3(g) and
3(h), respectively] than in a normal vessel wall [Figs. 3(c) and 3(d)].
Moreover, the PS-OCT and histological images showed a plaque having small amounts of
fibrous connective tissue (blue stain; black arrows) within a lipid-loaded area [Fig. 4(a)]. The
signal density (arrows) was stronger, the backscattering signal was more heterogeneous
[Fig. 4(b)], and the variation in the phase retardation [Fig. 4(c)] and fast-axis angle
distribution [Fig. 4(d)] was more abrupt in the fibrous tissue than in the lipid-loaded region
(L). Figure 4(e) shows a typically advanced plaque within the vascular intima; it is
characterized by a necrotic lipid core covered by a thicker fibrous cap (CF ~250 μm; stained
blue with Masson’s trichrome). Plaque development in the vascular wall involves a
reorganization of intimal collagen fibers (Rekhter, 1999). Figure 4(f) shows a relatively deep
Fig. 4. Histological and PS-OCT images of vessel wall with a small fibrous lesion in the
lipid-loaded area (left column) and a lipid-loaded fibroatheroma with a thick fibrous cap
(right column): (a), (e) Histology (Masson’s Trichrome; ×40); (b), (f) Back-scattered intensity
image; (c), (g) Phase retardation image (linear color scale degrees); (d), (h) Fast-axis angle
image (linear color scale degrees).
Polarization-Sensitive Optical Coherence Tomography in Cardiology
741
lipid-loaded (L) area close to the media. The medial layer had a low backscattering intensity,
and hence, the interface between the plaque and the media was not well defined. A
comparison of the PS-OCT [Figs. 4(g) and 4(h)] images with the histological images [Figs.
4(e)] showed gradual changes in phase retardation and fast-axis angle signals, which were
due to the accumulation of collagen fiber in the plaque. Further, the changes in the
pseudocolor in Fig. 4(g) were more uniform within the vessel wall than in those regions
indicated by the arrows in Fig. 4(c).
Fig. 5 also shows an atheroma plaque (*) of a coronary artery stained with trichrome (a, 40×)
and picrosirius red (b, 100X), which was examined under a polarization microscope (c,
100×). The structure above the mark (*) is the fibrous cap in the tunica intima, and the
structure below the mark (*) is the tunica media. Picrosirius polarized microscopy reveals
birefringence regions (e.g., organized collagen in a vessel wall). The intense birefringence of
the collagen fiber represented in Fig. 5(e), left region, is confirmed by Figure 5(c) wherein
the thick collagen fiber can be observed (in orange color). The fine collagen fiber (green
color) of Fig. 5(c) is also consistent with small changes in the phase retardation shown in the
right region of Fig. 5(e).
Fig. 5. Lipid-loaded fibroatheroma with a thick fibrous cap. (a) Histology (Masson’s
trichrome; ×40); (b) histology and (c) examined under polarization microscope (Picrosirius
polarization; ×40); (d) back-scattered intensity image; (e) phase retardation image (linear
color scale degrees); (f) fast-axis angle (linear color scale degrees).
Finally, two fibrocalcific plaques are shown in Fig. 6. The PS-OCT image showed a large
sharply delineated, signal-rich area of heterogeneous backscattering [Fig. 6(b) and 6(f)], as
well as strong birefringence [Fig. 6(c) and 6(g)]. Different structural orientations were also
indicated by the PS-OCT image [i.e., different orientations of a fast-axis angle signal in three
Advances in Lasers and Electro Optics
742
parts of the tomogram; see Fig. 6(h)] but not by the H and E stained specimen [Fig. 6(e)].
Since the calcified lesion was damaged during the sectioning process, only a large empty
hole with a few calcified fragments appeared within the calcified plaque.
Fig. 6. Histological and PS-OCT images of fibrocalcific plaques: (a), (e) Histology (H and E);
(b), (f) Back-scattered intensity image; (c), (g) Phase retardation image (linear color scale
degrees); (d), (h) Fast-axis angle image (linear color scale degrees).
Using the above experiments, the capability of PS-OCT for imaging atherosclerotic plaques
in human specimens has been evaluated. We have demonstrated that the normal vascular
intima has a low intrinsic birefringence property, while changes in birefringence
characteristics were apparent in fibrous and calcified plaques; moreover, the birefringence
characteristics were different from those in normal vessels and lipid-loaded lesions. By
using picrosirius staining along with polarization microscopy, we could also identify the
thickness of collagen fiber. Recently, the identification of organized collagen fiber in arteries
has also been demonstrated by using a single-detector PS-OCT (Giattina et al., 2006). In
addition, another report showed that the PS-OCT measurements of birefringence have a
strong positive correlation with thick collagen fiber content (r = 0.76, p < 0.001) and also a
smooth muscle cells density (r = 0.74, p < 0.01) (Nadkarni et al., 2007).
4. Extracting optical properties from PS-OCT images
It is well known that optical properties can be used to indicate whether a tissue is in a
normal or pathological state (Kortum & Muraca, 1996). Further, accurate knowledge of
optical properties is essential for the optimum use of light in diagnosis and the treatment of
diseases. In this study, we constructed a quantitative PS-OCT image criterion for plaque
characterization. Following PS-OCT imaging, an algorithm was used to determine both
scattering (i.e., μ
s
and g
eff
) and birefringence properties (i.e. Δn and β) of vessel tissue from
the above PS-OCT images. The μ
s
can be thought of as the reciprocal of the average distance
a photon travels between scattering events. The g
eff
factor describes how isotropic or
Polarization-Sensitive Optical Coherence Tomography in Cardiology
743
anisotropic the scattering is, and is related to the particle size in the specimen. The Δn value
characterizes the differential speed of propagation between two orthogonal polarized states
of light in the specimen; it may change with derangement and mechanical failure of the
collagen network in the vessel. And the β value could be thought of as a parameter of the
fiber orientation in fibrous tissues where birefringence is caused by form birefringence.
First, the user selected regions (such as the white rectangle shown in the left column of Fig.
7) corresponding to those evaluated by histopathology. The regions were then automatically
divided into several regions of interest (ROIs) (e.g., green dashed inset in the left column of
Fig. 7) beginning from the intimal surface and including approximately 25 A-scans. Further,
the size of each ROI was kept constant. The R, Φ, and β signals within each ROI were
laterally (i.e., along the x-axis) delineated and averaged. Subsequently, μ
s
and the root-
mean-square scattering angle (θ
rms
), which can be used to calculate the effective anisotropy
factor (g
eff
= cos(θ
rms
)), were extracted by fitting the reflectivity signals as a function of depth
to an extended Huygens-Fresnel model (Kuo et al., 2008; Levitz et al., 2004; Thrane et al.,
2000). This is shown in the right column of Fig. 7.
2 2
2 2
RS b s s H
ss
2222
H SHS
P P 4exp(- z)[1-exp(- z)]
i (z) exp(- 2 z) [1-exp(- z)]
1 /
ασ μ μ ω
μμ
πω ω ω ω
⎧
⎫
⎧⎫
⎪⎪⎪ ⎪
=⋅+ +
⎨⎬⎨ ⎬
+
⎪⎪
⎪
⎪
⎩⎭
⎩⎭
(4)
Here 〈i
2
(z)〉 is the mean square of the heterodyne signal current; α, the power to current
conversion ratio; P
R
and P
S
, the power of the reference and input sample beams; σ
b
, the
effective backscattering cross-section; and ω
H
and ω
S
,
the 1/e irradiance radius at the
probing depth in the absence and presence of scattering, respectively. The pixels near the
interface, which was due to the specular reflection between the scattering and non-scattering
media, were excluded from the fit (Levitz et al., 2004). Furthermore, the profiles of the
averaged phase retardation signals have three layers (black arrows in the right column of
Fig. 7). Δn can be calculated by linear least-squares fitting through the averaged Φ data over
the depth of the ROI, and then its slope can be determined from the formula:
Φ = (360/2π)·k
0
·d·Δn (5)
Here k
0
is the wave vector and d is the thickness of the fitting range. In addition, the mean
fast-axis angle calculated by averaging across the width of the ROI at each depth can be
determined from Equation (3).
Statistical analyses were performed using SPSS (version 14.0; SPSS Inc.). A p-value < 0.05
was considered to be statistically significant. The test of significant difference of optical
parameters was performed by Kruskal-Wallis statistics and used to evaluate whether the
four optical properties contributed to the differentiation between different kinds of vessels.
After performing a significant test, multiple comparison procedures were then used to
determine which means are different. The following equation was used:
/( 1)
(1) 11
12
tt
ij kk
ij
nn
RR Z
nn
α
−
⎛⎞
+
−> × × +
⎜⎟
⎜⎟
⎝⎠
(6)
Here R
i
is the mean rank of the i th group; R
j
, the mean rank of the j th group; k, the number
of independent variables; n
t
, the total number of samples; n
i
and n
j
, the sample numbers of
the i th and j th group, respectively;
/( 1)kk
Z
α
−
, the critical value at the significance level
α
; and
Advances in Lasers and Electro Optics
744
Fig. 7. Procedure of the PS-OCT extraction algorithm.
k(k–1), the number of comparisons. A Spearman’s ρ correlation test was also used to
evaluate whether these four properties have correlations with each other.
Finally, multinomial logistic regressions were used to generate a predictive model based on
a linear combination of weights (X
r
ρ
) of optical properties (
ρ
= scattering coefficient,
effective anisotropy factor, birefringence, and fast-axis angle) as shown in this equation:
(diseased vessel type)
logit[ ]
(Normal vessel)
rrr
OR
A
BX
OR
ρρ
=+
∑
(7)
Here OR = Odds Ratio,
C
FL
, ,
NNN
r =
, A
r
is a constant, and B
rρ
is an adjustable
coefficient for each optical property. This model was used to classify the artery specimens
into four diagnostic classes. The accuracy of this model for plaque characterization was
evaluated using receiver operating characteristic (ROC) analysis (Metz, 1978).
Figures 3–6, given in previous pages, show illustrative PS-OCT images with the
corresponding histopathology of normal, lipid, fibroatheroma, and fibrocalcific plaques.
Altogether, 30 aortic specimens and therefore 135 ROIs from each region across totally R, Φ,
and β images were collected. The extracted data, μ
s
, g
eff,
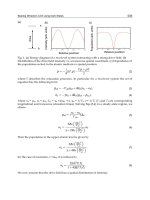
Δn, and β, are summarized in Fig. 8,
where each box shows the median, 25th and 75th percentiles, and the extreme values within
a category. Open circles and stars indicate outlier data.
Kruskal-Wallis statistics shows that μ
s
(p = 0.022), Δn (p < 0.001), and β(p < 0.001) have
significant differences in normal vessels and three types of atherosclerotic vessels, by
measuring how much the ranks of the four groups differ from the mean rank of all groups.
The g
eff
value
does not show any significant difference (p = 0.104). From the multiple
comparison test, we found that F to C shows significant difference in μ
s
; Δn between C and
Polarization-Sensitive Optical Coherence Tomography in Cardiology
745
Fig. 8. Distributions of μ
s
, g
eff,
Δn, and β in normal vascular intima (N), lipid laden (L),
fibrous (F), and fibrocalcific (C) plaques.
N, F and N, L and C, and L and F has significant differences; and β between C and N, F and
N, L and N, and L and F has significant differences.
Spearman’s ρ correlation test shows that only g
eff
correlates with the scattering coefficient (r
= –0.584, p = 0.003) in fibrocalcific plaque, while this value correlates with the birefringence
value (r = –0.563, p = 0.008) in fibrous lesions. Finally, three regression models, Equations
(8)–(10), were used to predict the odds ratio of C to N, F to N, and L to N, respectively.
()
logit 19.182 0.044 0.119 0.141
()
s
n
OR type C
X
XX
OR type N
μβ
Δ
⎡⎤
=
=− + + +
⎢⎥
=
⎣⎦
(8)
()
logit 19.377 0.047 0.068 0.201
()
s
n
OR type F
X
XX
OR type N
μβ
Δ
⎡⎤
=
=− − + +
⎢⎥
=
⎣⎦
(9)
()
logit 9.746 0.008 0.028 0.113
()
s
n
OR type L
X
XX
OR type N
μβ
Δ
⎡⎤
=
=− − + +
⎢⎥
=
⎣⎦
(10)
The prediction results are given in Table 1. This method identified that 17 of 23 lesions are
fibrocalcific and that 105 of 112 lesions are not fibrocalcific. In the case of fibrous plaque, 7 of
21 lesions were identified as fibrous and 110 of 114 as not fibrous lesions. Finally, the
method identified 33 of 48 lesions as lipid regions and 55 of 87 as not lipid regions. The
Advances in Lasers and Electro Optics
746
constructed regression model achieved 90%, 87%, and 65% prediction accuracy for C, F, and
L, respectively.
Classification
Model predicted
Histology observed
N C F L
N
C
F
L
27
1
0
7
0
17
1
6
0
2
7
2
16
3
13
33
Table 1. Plaque characterization by quantitative PS-OCT and histology
Our preliminary data indicated that more than 80% normal arterial samples had
μs value
between 10 and 39 mm
–1
and have significant differences from other different types of
plaques (p < 0.05); this is consistent with the results obtained by Levitz (Levitz et al., 2004).
From the multiple comparison tests, we also noticed that a significant difference in
scattering property exists between fibrous and fibrocalcific plaques. These findings are
consistent with the results obtained with qualitative image-based plaque characterization
methods where fibrous and fibrocalcific plaques can be distinguished by the signal-rich and
signal-poor regions respectively (Stamper et al., 2006; Yabushita et al., 2002). However, the
effective anisotropy factor demonstrates no significant difference between normal and other
atherosclerotic lesions (p = 0.104), perhaps because g
eff
of the fibrocalcific and fibrous lesions
were correlated with
μ
s
and Δn, respectively. In the case of the birefringence property of the
vessel that has not been quantitatively analyzed previously, i.e., β values, they were
maximum in the most atherosclerotic lesion at over 70 degrees. Smaller β values were
present in the best-fit areas of normal vascular intima. The
Δn values were small and more
concentrated in normal intima, but they demonstrated larger variations in the entire
atherosclerotic lesion. The birefringence coefficient was larger in abundant thicker collagen
fibers (
Δn = 9.409
4
10
−
×
; bright yellow to orange color, constituting >60% of the left region of
histology in Fig. 5c) than in thin collagen fibers (
Δn = 5.386
4
10
−
×
; green color in right region
of histology in Fig. 5c). Both β and Δn values have significant differences between the
normal arterial vessel and other different types of plaques (p < 0.05).
In this study, no attempt has been made to differentiate a necrotic core from a lipid pool.
Since the signal from the necrotic cores may be too weak for reliable measurements, future
studies based on histological stains that can differentiate the two are needed. It is also
noteworthy that the
Φ and β signals are distributed in a slightly more random manner in the
lipid lesion than in the normal vessel wall and fibrous and fibrocalcific plaques. This may be
due to the polarization state of light that is to be randomized by multiple scattering in lipid-
rich tissue, which reduces the accuracy of birefringence measurements. Alternatively,
further modifications of these PS-OCT criteria, such as the addition of a threshold limit for
the signal-poor region and incorporation of the standard deviation of the birefringence
signal within one ROI, may be required to differentiate lipid lesions better.
5. Conclusion
Collagen fiber constitutes up to 60% of the total atherosclerotic plaque protein. Uncontrolled
collagen accumulation leads to vascular stenosis, whereas excessive collagen breakdown
Polarization-Sensitive Optical Coherence Tomography in Cardiology
747
weakens plaques making them prone to rupture (Falk et al., 1995; Rekhter, 1999). Assessing
the phase retardation change may be a method to quantify the collagen content in
atherosclerotic lesions, and it may provide significant pathophysiological information that
can influence clinical decision-making in patients with risk factors. Furthermore, computer-
based quantitative analysis can automatically determine the plaque type; this will eliminate
the training time for each reader and disparity between different diagnoses. The
quantitative information on both arterial scattering and birefringence properties can also be
integrated with the qualitative visual information provided by PS-OCT images, and this can
support the facilitation of image-based plaque characterization methods. Our preliminary
results present an important step in validating this new imaging modality and can provide a
basis for the interpretation of PS-OCT images obtained from human specimens. However,
an analysis from a considerably larger set of specimens as well as an analysis taking the
effect of cluster data (i.e., specimens from the same person) into consideration will be
required for developing a more suitable prediction model in the future. Moreover, it is likely
that the combination of other functional modalities such as optical coherence elastography
(Rogowska et al., 2004; 2006) or spectroscopic OCT (Morgner et al., 2000), which can provide
additional indexes (such as cellular and molecular components and mechanical properties of
arterial walls), will have a greater predictive value for constructing a risk-stratifying plaque
characterization criterion that can be applied in future clinical utilities.
6. Acknowledgments
The authors thank Dr. N. K. Chou of the Department of Surgery of National Taiwan
University Hospital for providing aortic tissues and Prof. J. J. Shyu of the Department of
Veterinary Medicine of National Taiwan University for histology examinations. This
research was supported by the National Science Council of Taiwan.
7. References
Arroyo, L. H. & Lee, R. T. (1999). Mechanisms of plaque rupture: mechanical and biologic
interactions. Cardiovascular Research, Vol. 41, No. 2, (369-375), ISSN 0008-6363
Bouma, B. E.; Tearney, G. J.; Yabushita, H.; Shishkov, M.; Kauffman, C. R.; DeJoseph
Gauthier, D.; MacNeill, B. D.; Houser, S. L.; Aretz, H. T.; Halpern, E. F. & Jang, I. K.
(2003). Evaluation of intracoronary stenting by intravascular optical coherence
tomography. Heart, Vol. 89, (317-321), ISSN 1355-6037
Brezinski, M. E.; Tearney, G. J.; Bouma, B. E.; Izatt, J. A.; Hee, M. R.; Swanson, E. A.;
Southern, J. F. & Fujimoto, J. G. (1996). Optical coherence tomography for optical
biopsy: properties and demonstration of vascular pathology. Circulation, Vol. 93,
(1206–1213), ISSN 0009-7322
Brezinski, M. E.; Tearney, G. J.; Weissman, N. J.; Boppart, S. A.; Bouma, B. E.; Hee, M. R.;
Weyman, A. E.; Swanson, E. A.; Southern, J. F. & Fujimoto, J. G. (1997). Assessing
atherosclerotic plaque morphology: comparison of optical coherence tomography
and high frequency intravascular ultrasound. Heart, Vol. 77, (397-403), ISSN 1355-
6037
de Boer, J. F.; Milner, T. E.; van Gemert, M. J. C. & Nelson, J. S. (1997). Two-dimensional
birefringence imaging in biological tissue by polarization-sensitive optical
coherence tomography. Opt. Lett., Vol. 22, (934-936), ISSN 0146-9592
Advances in Lasers and Electro Optics
748
Falk, E.; Shah, P. K. & Fuster, V. (1995) Coronary plaque disruption. Circulation, Vol. 110,
(657–671), ISSN 0009-7322
Fujimoto, J. G.; Bresinski, M. E.; Tearney, G. J.; Boppart, S. A.; Bouma, B. E.; Hee, M. R.;
Southern, J. F. & Swanson, E. A. (1995). Optical biopsy and imaging using optical
coherence tomography. Nature Medicine, Vol. 1, (970-972), ISSN 1078-8956
Giattina, S. D.; Courtney, B. K.; Herz, P. R.; Harman, M.; Shortkroff, S.; Stamper, D. L.; Liu,
B.; Fujimoto, J. G.; Brezinski, M. E. (2006). Assessment of coronary plaque collagen
with polarization sensitive optical coherence tomography (PS-OCT). Int J Cardiol,
Vol. 107, (400-409), ISSN 0167-5273
Guo, S.; Zhang, J.; Wang, L.; Nelson, J. S. & Chen, Z. (2004). Depth-resolved birefringence
and differential optical axis orientation measurements with fiber-based
polarization-sensitive optical coherence tomography. Opt. Lett., Vol. 17, (2025-2027),
ISSN 0146-9592
Hitzenberger, C. K.; Gotzinger, E.; Sticker, M.; Pircher, M. & Fercher, A. F. (2001).
Measurement and imaging of birefringence and optic axis orientation by phase
resolved polarization sensitive optical coherence tomography. Opt. Express, Vol. 9,
(780-790), ISSN 1094-4087
Huang, D.; Swanson, E. A.; Lin, C. P.; Schuman, J. S.; Stinson, W. G.; Chang, W.; Hee, M. R.;
Flotte, T.; Gregory, K.; Pufialito, C. A. & Fujimoto, J. G. (1991). Optical coherence
tomography. Science, Vol. 254, (1178–1181), ISSN 0036-8075
Jang, I. K.; Bouma, B. E.; Kang, D. H.; Park, S. J.; Park, S. W.; Seung, K. B.; Choi, K. B.;
Shishkov, M.; Schlendorf, K.; Pomerantsev, E.; Houser, S. L.; Aretz, H. T. &
Tearney, G. J. (2002). Visualization of coronary atherosclerotic plaques in patients
using optical coherence tomography: comparison with intravascular ultrasound. J.
Am. Coll. Cardiol., Vol. 39, (604–609), ISSN 0735-1097
Kortum R. R. & Muraca, E. S. (1996). Quantitative optical spectroscopy for tissue diagnosis.
Ann. Rev. Phys. Chem., Vol. 47, (555-606), ISSN 0066-426X
Kuo, W. C.; Shyu, J. J.; Chou, N. K.; Lai, C. M.; Huang, H. C.; Chou, C.; & Jan, G. J. (2004).
Imaging of Human Aortic Atherosclerotic plaques by Polarization-Sensitive Optical
Coherence Tomography, Proceedings of IEEE Conference on Engineering in Medicine
and Biology, pp. 1111-1114, ISBN 0879425598, San Francisco, Aug 2004, EMBS, CA
Kuo, W. C.; Shyu, J. J.; Chou, N. K.; Lai, C. M.; Tien, E. K.; Huang, H. J.; Chou, C. & Jan, G. J.
(2005). Correlation of collagen synthesis with polarization-sensitive optical
coherence tomography imaging of in vitro human atherosclerosis, Proceedings of
SPIE 5690, pp. 563-571, ISBN 9780819456649, San Jose, January 2005, SPIE, CA.
Kuo, W. C.; Chou, N. K.; Chou, C.; Lai, C. M.; Huang, H. J. & Shyu, J. J. (2007). Polarization-
sensitive optical coherence tomography for imaging human atherosclerosis. Appl.
Opt., Vol. 46, (2520-2527), ISSN 0003-6935
Kuo, W. C.; Hsiung, M. W. & Yang, P. N. (2007). Extracting quantitative optical properties of
human vessel from PS-OCT images. Journal of Medical and Biological Engineering,
Vol. 27, (191-197), ISSN 1609-0985
Kuo, W. C.; Hsiung, M. W.; Shyu, J. J.; Chou, N. K. & Yang, P. N. (2008). Quantitative
analysis on optical properties of human atherosclerosis by using polarization-
sensitive optical coherence tomography, Proceedings of SPIE 6842, pp. 684223-
1~684223-9, ISBN 9780819470171, San Jose, January 2008, SPIE, CA.
Polarization-Sensitive Optical Coherence Tomography in Cardiology
749
Kuo, W. C.; Hsiung, M. W.; Shyu, J. J.; Chou, N. K. & Yang, P. N. (2008). Assessment of
arterial characteristics in human atherosclerosis by extracting optical properties
from polarization-sensitive optical coherence tomography. Opt. Express, Vol. 16,
(8117-8125), ISSN 1094-4087
Levitz, D.; Thrane, L.; Frosz, M. H.; Andersen, P. E.; Andersen, C. B.; Valanciunaite, J.;
Swartling, J.; Andersson-Engels S. & Hansen, P. R. (2004). Determination of optical
properties of highly-scattering media in optical coherence tomography. Opt.
Express, Vol. 12, (249-259), ISSN 1094-4087
Metz, C. E. (1978). Basic principles of ROC analysis. Seminars in Nuclear Medicine, Vol. 8,
(283-298), ISSN 0001-2998
Morgner, U.; Drexler, W.; Kartner, F. X.; Li, X. D.; Pitris, C.; Ippen, E. P. & Fujimoto, J. G.
(2000). Spectroscopic optical coherence tomography. Opt. Lett., Vol. 25, No. 2, (111-
113), ISSN 0146-9592
Nadkarni, S. K.; Pierce, M. C.; Park, B. H.; de Boer, J. F.; Whittaker, P.; Bouma, B. E.;
Bressner, J. E.; Halpern, E.; Houser, S. L.; & Teaeney, G. J. (2007). Measurement of
collagen and smooth muscle cell content in atherosclerotic plaques using
polarization sensitive optical coherence tomography. J. Am. Coll. Cardiol., Vol. 49,
(1474-1481), ISSN 0735-1097
Park, B. H.; Pierce, M. C.; Cense, B.; Yun, S. H.; Mujat, M.; Tearney, G. J.; Bouma, B. E. & de
Boer, J. F. (2005). Realtime fiber-based multi-functional spectral-domain optical
coherence tomography at 1.3 mm. Opt. Express, Vol. 13, (3931–3944), ISSN 1094-
4087
Park, B. H.; Pierce, M. C.; Cense, B. & de Boer, J. F. (2004). Jones matrix analysis for a
polarization-sensitive optical coherence tomography system using fiber-optic
components. Opt. Lett., Vol. 21, (2512-2514), ISSN 0146-9592
Park, B. H.; Saxer, C.; Srinivas, S. M.; Nelson, J. S. & de Boer, J. F. (2001). In vivo burn depth
determination by high-speed fiber-based polarization sensitive optical coherence
tomography. J. Biomed. Opt., Vol. 6, No. 4, (474-479), ISSN 1083-3668
Pasterkamp, G.; Falk, E.; Woutman, J. & Borst, C. (2000). Techniques characterizing the
coronary atherosclerotic plaque: Influence on clinical decision making. J. Am. Coll.
Cardiol., Vol. 36, (13–21), ISSN 0735-1097
Peters, R. J. G.; Kok, W. E. M.; Havenith, M. G.; Rijsterborgh, H. & vanderWal, A. C. (1994).
Histopathologic validation of intracoronary ultrasound imaging. J. Am. Soc.
Echocardiography, Vol. 7, (230-241), ISSN 0894-7317
Rekhter, M. D. (1999). Collagen synthesis in atherosclerosis: too much and not enough.
Cardiovascular Research, Vol. 41, (376-384), ISSN 0008-6363
Rogowska, J.; Patel, N. A.; Fujimoto, J. G. & Brezinski, M. E. (2004). Optical coherence
tomographic elastography technique for measuring deformation and strain of
atherosclerotic tissues. Heart, Vol. 90, No. 5, (556–562), ISSN 1355-6037
Rogowska, J.; Patel, N. A.; Plummer, S. & Brezinski, M. E. (2006). Quantitative optical
coherence tomographic elastography: method for assessing arterial mechanical
properties. Br. J. Radiol., Vol. 79, No. 945, (707–711), ISSN 1748-880X
Saxer, C. E.; de Boer, J. F.; Park, B. H.; Shao, Y.; Chen, Z. & Nelson, J. S. (2000). High-speed
fiber-based polarization-sensitive optical coherence tomography of in vivo human
skin. Opt. Lett., Vol. 18, (1355-1357), ISSN 0146-9592
Advances in Lasers and Electro Optics
750
Shah, P. K. (2003). Mechanisms of plaque vulnerability and rupture. J. Am. Coll. Cardiol., Vol.
41, No. 4, (15S–22S), ISSN 0735-1097
Stamper, D.; Weissman, N. J.; Brezinski, M. (2006). Plaque characterization with optical
coherence tomography. J. Am. Coll. Cardiol., Vol. 47, (C69–C79), ISSN 0735-1097
Tearney, G. J.; Jang, I-K & Bouma, B. E. (2006). Optical coherence tomography for imaging
the vulnerable plaque. J. Biomed. Opt., Vol. 11, No. 2, (021002), ISSN 1083-3668
Tearney, G. J.; Yabushita, H.; Houser, S. L.; Aretz, H. T.; Janf, I. K.; Schlendorf, K. H.;
Kauffman, C. R.; Shishkov, M.; Halpern, E. F. & Bouma, B. E. (2003). Quantification
of macrophage content in atherosclerotic plaques by optical coherence tomography.
Circulation, Vol. 107, (113–119), ISSN 0009-7322
Thrane, L.; Yura, H. T. & Andersen, P. E. (2000). Analysis of optical coherence tomography
systems based on the extended Huygens-Fresnel principle. J. Opt. Soc. Am. A, Vol.
17, (484-490), ISSN 1464-4258
Villard, J. W.; Feldman, M. D.; Kim, J.; Milner, T. E. & Freeman, G. L. (2002). Use of a Blood
Substitute to determine instantaneous murine right ventricular thickening with
optical coherence tomography. Circulation, Vol. 105, (1843-1849), ISSN 0009-7322
Yabushita, H.; Bouma, B. E.; Houser, S. L.; Aretz, H. T.; Jang, I. K.; Schlendorf, K. H.;
Kauffman, C. R.; Shishkov, M.; Kang, D. H.; Halpern, E. F. & Tearney, G. J. (2002).
Characterization of human atherosclerosis by optical coherence tomography.
Circulation, Vol. 106, (1640–1645), ISSN 0009-7322
Yamanari, M.; Makita, S.; Madjarova, V. D.; Yatagai, T. & Yasuno, Y. (2006). Fiber-based
polarization-sensitive Fourier domain optical coherence tomography using B-scan-
oriented polarization modulation method. Opt. Express, Vol. 14, (6502–6515), ISSN
1094-4087
Zhang, J.; Jung, W.; Nelson, J. S. & Chen, Z. (2004). Full range polarization-sensitive Fourier
domain optical coherence tomography. Opt. Express, Vol. 12, (6033–6039), ISSN
1094-4087
32
Two-photon Fluorescence Endomicroscopy
Yicong Wu and Xingde Li
Department of Biomedical Engineering, Johns Hopkins University
Baltimore, Maryland 21205
U.S.A.
1. Introduction
Two-photon fluorescence (TPF) microscopy is a powerful technique for high-resolution
imaging of biological tissues, enabling depth-resolved morphological and functional
assessment of biological tissues via a non-invasive route (Denk et al., 1990; Helmchen &
Denk, 2005; Konig, 2000; Zipfel et al., 2003). In TPF microscopy, a molecule (i.e., the
fluorophore) can absorb two photons quasi-simultaneously (10
-15
- 10
-18
s) and emit a single
photon during relaxation from the excited state to the ground state. The probability for the
fluorescent emission is thus quadratically dependent on the excitation light intensity. With a
focusing unit, much more two-photon fluorescence is generated from the focal spot than
where the beam is diffused. Effectively, excitation is restricted to the very small focal
volume (~1 femtoliter), resulting in the inherent optical sectioning ability without the need
for a pinhole to reject out-of-focus photons. This optical sectioning capability permits whole-
field fluorescence collection and thus enhances the collection efficiency in highly scattering
tissues. In TPF microscopy, near-infrared (NIR) femtosecond laser is generally employed for
effective excitation, which increases the penetration depth and reduces image deterioration
due to the less scattering in turbid tissues. In addition, NIR excitation likely causes less
photodamage outside the focal volume.
With the advances in micro-optics and micro-mechanical components, a TPF
endomicroscopy system is becoming attractive as a basic research tool with a much smaller
form factor and lower cost compared to a conventional TPF microscope. Moreover, the TPF
endomicroscopy system has a great potential to transform the powerful TPF technology for
in vivo studies and clinical applications. Recently, increasing interests have been focusing on
the development of TPF endomicroscope with a small size which can go through the
accessory port of a standard endoscope for in vivo and clinical studies while maintaining the
TPF imaging ability similar to a standard TPF microscope. Major challenges for TPF
endomicroscopy devices are efficient delivery of single-mode ultrashort pulses, wide-field
collection of the TPF signals, fast 2-D/3-D beam scanning with a miniature objective lens of
good optical properties, and overall miniaturization of the probe assembly (Bao et al., 2008;
Engelbrecht et al., 2008; Flusberg et al., 2005a; Flusberg et al., 2005b; Fu et al., 2006; Gobel et
al., 2004a; Helmchen et al., 2001; Hoy et al., 2008; Jung & Schnitzer, 2003; Jung et al., 2008;
Konig et al., 2007; Le Harzic et al., 2008; Levene et al., 2004; Myaing et al., 2006; Wu et al.,
2009a; Wu et al., 2009b).
Advances in Lasers and Electro Optics
752
This book chapter offers a review of fiber-optic TPF endomicroscopy technologies with
emphasis on major technological development challenges. The advantages and limitations
associated with various TPF endomicroscopy systems are discussed. Special design and
engineering considerations are presented with our recently developed all-fiber-optic rapid
scanning TPF imaging endomicroscopy system as an example. Some representative
endomicroscopic TPF imaging results are illustrated, demonstrating that the emerging TPF
endomicroscopy systems are very promising for basic laboratory research and for early
disease detection and image-guided interventions.
2. Challenges in two-photon fluorescence endomicroscopy
2.1 Single-mode femtosecond laser delivery and large-area TPF signal collection
The first major issue in TPF endomicroscopic implementation is how to efficiently deliver
single-mode femtosecond excitation light and collect multimode two-photon fluorescence
signals. It is well known that a single-mode fiber (SMF) can be used to deliver and focus
single-mode femtosecond excitation light to a near diffraction limited spot. However, the
TPF collection efficiency severely suffers due to the small core diameter of a SMF. Some
embodiments utilize a separate multimode fiber for effective TPF collection (Helmchen et
al., 2001), as shown in Fig. 1(a). The multimode fiber with large core diameter (e.g. 1-2 mm)
and high NA (e.g. 0.4-0.8) increases the collection area and it also makes the collection
efficiency less sensitive to the spherical and chromatic aberration of the objective lens. Such
configuration can be further improved by replacing the common SMF with a hollow-core
photonic bandgap fiber (HC-PCF) with zero dispersion at the selected excitation wavelength
(Engelbrecht et al., 2008; Flusberg et al., 2005b; Gobel et al., 2004b; Hoy et al., 2008; Le Harzic
et al., 2008). Owing to the dramatically reduced group-velocity dispersion (GVD) and
nonlinear optical effects (such as self-phase modulation, SPM) in the specially designed HC-
PCF, femtosecond pulses in HC-PCF experience negligible temporal distortion, and no
additional pulse prechirping is required (Agrawal, 2007).
(a)
MMF
Coated Micro-prism
or Dichroic-mirror
SMF
DCF
Sample
(b)
Small Lens
Sample
Micro-mirror
Small Lens
SM Core
MM Inner Clad
SM Core
MM Core
(a)
MMF
Coated Micro-prism
or Dichroic-mirror
SMF
DCF
Sample
(b)
Small Lens
Sample
Micro-mirror
Small Lens
SM Core
MM Inner Clad
SM Core
MM Core
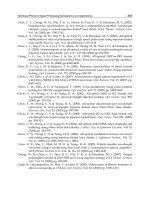
Fig. 1. Schematic of fiber-optic two-photon fluorescence endomicroscope: (a) Two-fiber
configuration; (b) Single-fiber configuration. SMF: single-mode fiber; MMF: multi-mode
fiber; DCF: double-clad fiber; SM: single-mode; MM: multi-mode.
Two-photon Fluorescence Endomicroscopy
753
As shown in Fig. 1(a), the two-fiber configuration involves a dichroic mirror and a prism
and it is difficult to minimize the endomicroscope. In order to create a more compact and
flexible endomicroscope, single double-clad fibers (DCFs, see Fig. 2) have been employed in
TPF endomicroscopes for both single-mode laser excitation delivery with the single-mode
core and efficient TPF collection with the multimode inner cladding layer (Bao et al., 2008;
Fu et al., 2007; Fu et al., 2006; Jung et al., 2008; Myaing et al., 2006; Wu et al., 2009a; Wu et al.,
2009b), as shown in Fig. 1(b). With the advance of fiber fabrication technology, double-clad
fiber could be developed with high performance including large inner clad diameter and
NA and less nonlinear optical effects.
(a)
(b)
Core
Inner clad
Outer clad
(a)
(b)
Core
Inner clad
Outer clad
Fig. 2. Schematic of double-clad fibers generally employed in two-photon fluorescence
endomicroscopy systems: (a) Conventional double-clad fiber; (b) Photonic crystal double-
clad fiber.
A conventional DCF, as shown in Fig. 2(a), is a step-index fiber composed of a single-mode
core, a multi-mode inner cladding layer and an outer cladding layer. The materials for the
three layers are typically germanium-doped silica, pure silica and fluorine-doped silica,
respectively. The DCF, allowing single-mode delivery of fs excitation light through the
single-mode core and collection of multimode TPF signals via the inner clad, is
commercially available (Fibercore Ltd., SMM900) and has been successfully implemented in
a scanning fiber-optic TPF endomicroscope with an excellent imaging ability (Bao et al.,
2008; Myaing et al., 2006; Wu et al., 2009a; Wu et al., 2009b). Compared to a single-mode
fiber, the DCF (with core/inner clad diameter of 3.5/103 μm and NA of 0.19/0.24) greatly
improves the collection efficiency of TPF signals by 2-3 orders. Another type of DCF is
photonic crystal double-clad fiber (PC-DCF) as shown in Fig. 2(b). The PC-DCF comprises a
single-mode core with pure silica and inner and outer cladding layers with hybrid air-silica
structures (Bjarklev et al., 2003; Knight, 2003). PC-DCF is also commercially available
(Crystal Fiber, DC-165-16-Passive) and has been used for developing TPF endomicroscopy
technologies (Fu et al., 2005; Fu et al., 2007; Fu et al., 2006; Jung et al., 2008). The PC-DCF has
a core/inner clad diameter of 16/165 μm and NA of 0.04/0.6. The large core of the PC-DCF
reduces the nonlinear optical effects up to a certain excitation power (Bao & Gu, 2009). But
the large core diameter and the related low NA make it challenging to focus the excitation
beam to a small spot size with a given miniature objective lens. The use of a PC-DCF would
Advances in Lasers and Electro Optics
754
also increase the rigid length of an endomicroscope at its distal end due to the requirement
of beam expansion and refocusing mechanisms. Generally speaking, in engineering a
compact fiber-optic TPF endomicroscope, the core size of the DCF has to be carefully chosen
with a tradeoff among the excitation/collection efficiency, the nonlinear effects, the overall
diameter and the rigid length of the probe.
Since the SMF, DCF and PC-DCF have normal dispersion, ultrashort pulses transmitting in
these fibers will be temporally broadened due to GVD and nonlinear effects such as SPM
(Agrawal, 2007), resulting in the reduction of TPF excitation efficiency. Therefore, pre-
chirping is required for fiber-optic TPF endomicroscopes with such fibers. A conventional
pulse stretcher based on a grating and lens pair can be utilized for negative prechirping
before the pulses are launched into the fibers (Bao et al., 2008; Helmchen et al., 2001; Myaing
et al., 2006; Treacy, 1969). However, the grating/lens pulse stretcher consists of bulky optics
with a double-pass configuration which is generally sensitive to alignment and has
suboptimal throughput. Recently, photonic crystal fibers based on photonic bandgap effects
to guide light propagation have been developed. These fibers exhibit anomalous dispersion
over certain wavelength range and can be used for prechirping (Bjarklev et al., 2003; Reeves
et al., 2003). For example, the hollow-core photonic bandgap fiber (PBF) from Crystal Fibre
(HC-800-02) offers negative GVD with the wavelength longer than 800 nm. It has been
employed for dispersion compensation in the endomicroscopes (Wu et al., 2009a; Wu et al.,
2009b). Table 1 summarizes the measured GVD parameter (β
2
) and dispersion parameter (D)
for excitation pulses at 810±18 nm with an initial pulse width of 60 fs. The reference values
of a conventional silica core single-mode fiber (SMF) at 810 nm are listed (Agrawal, 2007).
As can be seen, the measured GVD of the DCF is ~43,065 fs²/m, whereas the PBF offers a
negative GVD of ~35,246 fs²/m. As a result, the positive dispersion of a DCF can be
compensated by a PBF when the length ratio of the PBF to DCF is ~1.1 at 810±18 nm. The
achievable pulse width is about 130 fs with 20 mW delivered through the DCF core. As the
power laser transmitting in the DCF core increases (e.g. up to 50 mW), the pulses suffer self-
phase modulation and other nonlinear effects, and the temporal pulse duration broadens to
about 200 fs.
β
2
(fs
2
/m)
D
(ps/nm/km)
DCF (810 ± 18 nm)
43,065 -123.7
PBF (810 ± 18 nm)
-35,246 101.2
SMF (810 nm) * 34,120 -98.0
Table 1. Measured GVD parameter (β
2
)
and dispersion parameter (D) of a conventional
double-clad fiber (DCF) and hollow-core photonic bandgap fiber (PBF). For reference, the β
2
and D values of a single-mode fiber (SMF) are cited from Ref. (Agrawal, 2007).
2.2 Miniature high-speed scanning head
The second challenge in developing a fiber-optic TPF endomicroscope is the beam scanner
at the distal end which has to be in a small footprint. Current endomicroscope embodiments
are mainly based on micro-electro-mechanical system (MEMS) scanning mirrors (Bao et al.,
2008; Fu et al., 2006; Hoy et al., 2008; Jung et al., 2008; Piyawattanametha et al., 2006) (Fig.
3(a)) and piezoelectric resonant fiber-optic scanners (Engelbrecht et al., 2008; Flusberg et al.,
2005b; Helmchen et al., 2001; Myaing et al., 2006; Wu et al., 2009a; Wu et al., 2009b) (Fig.
Two-photon Fluorescence Endomicroscopy
755
3(b)). 1-D or 2-D scanning mirrors can be micro-fabricated on a single silicon plate with
torsional hinges, supporting substrates and control circuits integrated on the same chip
(Hagelin & Solgaard, 1999; Lin & Fang, 2003; Yao & MacDonald, 1997). The use of
electrostatic actuation, in particular those with a comb drive structure, permits low power
consumption and strong actuation force (Hah et al., 2004). A wide range of frequency
response from 100 Hz to 10 kHz can be achieved with MEMS scanners. Typical MEMS
mirrors with a 0.5-2 mm diameter can have a mechanical scanning angle up to ~30
o
with
reasonably low driving voltages (~10-120 V) (Lang et al., 1999; Schenk et al., 2000). Using
MEMS techniques, a raster scanning pattern can be easily created, as shown in Fig. 3(a).
Overall, MEMS scanners have a great potential to be integrated in a compact
endomicroscope yet the relatively large substrates with the drive circuits still present
significant engineering challenges in their endomicroscopic applications. A TPF
endomicroscope based on a 2-D MEMS mirror with a size of ~3.2 mm x 3 mm has been firstly
developed with a line acquisition rate of 3.5 kHz (Piyawattanametha et al., 2006). Later,
another 2-D MEMS mirror with a size of ~5 mm in diameter, with a speed of 7 lines/s over an
area of 80 x 130 µm
2
has been assembled in a TPF endomicroscope (Fu et al., 2007). Recently,
higher TPF imaging rate up to 10 frames per second has been demonstrated in an
endomicroscope prototype but with a large dimension of 10 × 15 × 40 mm
3
(Hoy et al., 2008).
(a) (b)
PZT Tube
Fiber
MEMS Mirror
X
Y
X
Y
Four quadrants
(a) (b)
PZT Tube
Fiber
MEMS Mirror
X
Y
X
Y
(a) (b)
PZT Tube
Fiber
(b)
PZT Tube
Fiber
MEMS Mirror
X
Y
X
Y
Four quadrants
Fig. 3. Schematic of miniature 2D scanning mechanism and pattern: (a) MEMS mirror; (b)
PZT based fiber resonant scanner.
Although MEMS scanners can achieve a large lateral beam scan at a high speed, they require
complicated fabrication processes and control mechanisms. A simpler method has been
developed by scanning the distal tip of an optical fiber cantilever at its mechanical resonant
frequency with a piezoelectric actuator (Cobb et al., 2005; Engelbrecht et al., 2008; Flusberg