Báo cáo hóa học: " Research Article Two-Dimensional Beam Tracing from Visibility Diagrams for Real-Time Acoustic Rendering" doc
Bạn đang xem bản rút gọn của tài liệu. Xem và tải ngay bản đầy đủ của tài liệu tại đây (3.69 MB, 18 trang )
Hindawi Publishing Corporation
EURASIP Journal on Advances in Signal Processing
Volume 2010, Article ID 642316, 18 pages
doi:10.1155/2010/642316
Research Article
Two-Dimensional Beam Tracing from Visibility Diagr ams for
Real-Time Acoustic Rendering
F. Antonacci (EURASIP Member), A. Sarti (EURASIP Member),
and S. Tubaro (EURASIP Member)
Dipartimento di Elettronica ed Informazione, Politecnico di Milano, Piazza Leonardo da Vinci 32, 20133 Milano, Italy
Correspondence should be addressed to F. Antonacci,
Received 26 February 2010; Revised 24 June 2010; Accepted 25 August 2010
Academic Editor: Udo Zoelzer
Copyright © 2010 F. Antonacci et al. This is an open access article distributed under the Creative Commons Attribution License,
which permits unrestricted use, distribution, and reproduction in any medium, provided the original work is properly cited.
We present an extension of the fast beam-tracing method presented in the work of Antonacci et al. (2008) for the simulation
of acoustic propagation in reverberant environments that accounts for diffraction and diffusion. More specifically, we show how
visibility maps are suitable for modeling propagation phenomena more complex than specular reflections. We also show how the
beam-tree lookup for path tracing can be entirely performed on visibility maps as well. We then contextualize such method to
the two different cases of channel (point-to-point) rendering using a headset, and the rendering of a wave field based on arrays of
speakers. Finally, we provide some experimental results and comparisons with real data to show the effectiveness and the accuracy
of the approach in simulating the soundfield in an environment.
1. Introduction
Rendering acoustic sources in virtual environments is a
challenging problem, especially when real-time operation
is required without giving up a realistic impression of the
result. The literature is rich with methods that approach
this problem for a variety of purposes. Such methods are
roughly divided into two classes: the for mer is based on
an approximate solution of the wave equation on a finite
grid, while the latter is based on the geometric modeling
of acoustic propagation. Typical examples of the first class
of methods are based on the solution of the Green’s or
Helmholtz-Kirchoff ’s equation through finite and boundary
element methods [1–3]. The computational effort required
by the solution of the wave equation, however, makes these
algorithms unsuitable for real-time operation except for
a very limited range of frequencies. Geometric methods,
on the other hand, are the most widespread techniques
for the modeling of early acoustic reflections in complex
environments. Starting from the spatial distribution of the
reflectors, their acoustic properties, and the location and the
radiation characteristics of sources and receivers (listening
points), geometric methods cast rays in space and track
their propagation and interaction with obstacles in the
environment [4]. The sequence of reflections, diffractions
and diffusions a ray undergoes constitutes the acoustic path
that link source and receiver.
Among the many available geometric methods, a par-
ticularly efficient one is represented by beam tracing [5–
9]. This method was originally conceived by Hanrahan and
Heckbert [5] for applications of image rendering, and was
later extended by Funkhouser et al. [10] to the problem of
audio rendering. A beam is intended as a bundle of acoustic
rays originating from a point in space (a real source or a wall-
reflected one), which fall onto the same planar portion of an
acoustic reflector. Every time a beam encounters a reflector,
in fact, it splits into a set of subbeams, each corresponding
to a different planar region of that reflector or of some other
reflector. As they bounce around in the environment, beams
keep branching out. The beam-tracing method organizes
and encodes this beam splitting/branching process into a
specialized data structure called beam-tree, which describes
the information of the visibility of a region from a point (i.e.,
the source location). Once the beam-tree is available, path-
tracing becomes a very efficient process. In fact, given the
location of the listening point (receiver), we can immediately
determine which beams illuminate it, just through a “look
up” of the beam-tree data structure. We should notice,
2 EURASIP Journal on Advances in Signal Processing
however, that with this solution the computational effort
associated to the beam tracing process and that of path-
tracing are quite unbalanced. In fact if the environment is
composed by n reflectors, the exhaustive test of the mutual
visibility among all the n re flectors involves O(n
3
) tests, while
the test of the presence of the receiver in the m traced beams
needs only O(m) tests. Some solutions for a speedup of
the computation of the beam-tree have been proposed in
the literature. As an example in [10] the authors adopt the
Binary Space Partitioning Technique to operate a selection
of the visible obstacles from a prescribed reflector. A similar
solution was recently proposed in [11], where the authors
show that a real-time tracing of acoustic paths is possible
even in a simple dynamic environment.
In [12] the authors generalized traditional beam tracing
by developing a method for constructing the beam-tree
through a lookup on a precomputed data structure called
global visibility function, which describes the visibility of a
region not just as a function of the viewing angle but also of
the source location itself.
Early reflections are known to carry some information
on the geometry of the surrounding space and on the
spatial positioning of acoustic sources. It is in the initial
phase of reverberation, in fact, that we receive the echoes
associated to the first wall reflections. Other propagation
phenomena, such as diffusion, transmission and diffraction
tend to enrich the sense of presence in “virtual walkthrough”
scenarios, especially in densely occluded environments. As
beam tracing was originally conceived for the modeling of
specular reflections only, some extensions of this method
were proposed to account for other propagation phenomena.
Funkhouser et al. [13], for example, account for diffusion
and diffraction through a bidirectional beam tracing process.
When the two beam-trees that originate from the receiver
and the source intersect on specific geomet ric primitives
such as edges and reflectors, propagation phenomena such
as diffusion and diffraction could take place. The need
of computing two beam-trees, however, poses problems of
efficiency when using conventional beam tracing methods,
particularly when sources and/or receivers are in motion.
Adifferent approach was proposed by Tsingos et al. [14],
who proposed to use the uniform theory of diffraction
(UTD) [15] by building secondary beam-trees originated
from the diffractive edges. This approach is quite efficient,
as the tracing of the diffractive beam-trees can be based on
the sole geometric configuration of reflectors. Once source
and receiver locations are given, in fact, a simple test on
the diffractive beam-trees determines the diffract ive paths.
Again, however, this approach inherits the advantages of
beam tracing but also its limits, which are in the fact that
anewbeam-treeneedsbecomputedeverytimeasource
moves.
As already mentioned above, in [12]weproposeda
method for generating a beam-tree through a lookup on the
global visibility function. That method had the remarkable
advantage of computing a large number of acoustic paths
in real time as both source and reflector are in motion in a
complex environment. In this paper we generalize the work
proposed in [12] in order to accommodate diffusion and
diffraction phenomena. We do so by revisiting the concept
of global visibility and by introducing novel lookup methods
and new operators. Thanks to these generalizations, we will
also show how it is possible to work on the visibility diagrams
not just for constructing beam-trees but also to perform the
whole path-tracing process.
In this paper we expand and repurpose the beam tracing
method for applications of real-time rendering of acoustic
sources in virtual environments. Two are the envisioned
scenarios: in the former the user is wearing a headset, in
the latter the whole sound field within a prescribed volume
is rendered using loudspeaker arrays. We will show that the
two scenarios share the same beam tracing engine which, in
the first case, is followed by a path-tracing algorithm based
on beam-tree lookup [12], with an additional head-related
transfer function. In the second case the beam tracer is used
for generating the control parameters of the beam-shaping
algorithm proposed in [16]. This beam-shaping method
allows us to design the spatial filter to be applied to the
loudspeaker arrays for the rendering of an arbitrary beam.
Other solutions exist in the literature for the rendering of
virtual environments, such as wave field synthesis (WFS) and
ambisonics. Roughly speaking, WFS computes the spatial
filter to be applied to the speakers with an approximation
of the Helmholtz-Kirchoff ’s equation. Interestingly enough,
for example, in [17] the task of computing the para meters
of all the virtual sources in the environment is demanded
to an image-source algorithm. Therefore, some WFS systems
already partially rely on geometric methods. When rendering
occluded environments, however, the image-source method
tends to become computationally demanding, while fast
beam tracing techniques [12]cano
ffer a significant speedup.
It is important to notice that the method proposed in
[12] was developed for modeling complex acoustic reflec-
tions in a specific class of 3D environments obtained as the
cartesian product between a 2D floor plan and a 1D (vertical)
direction. This situation, for example, describes a complex
distribution of vertical walls ending in horizontal floor
and ceiling. When considering acoustic wall transmission,
a2D
× 1D environment becomes useful for modeling a
multi-floored building with a repeated floor plan. Although
2D
× 1D environments enjoy the advantages of 2D modeling
(simplicity, duality, etc.), the computation of all delays and
path lengths still needs to be performed in a 3D space.
While this is rather straig htforward in the case of geometric
reflections, it b ecomes more challenging when dealing with
diffraction and diffusion phenomena.
The paper is organized as follows. In Section 2 we review
and revisit the concept of global visibility a nd its use for
efficiently tracing acoustic paths. In Section 3 we discuss the
main mathematical models used for explaining diffusion and
diffraction phenomena, and we choose the one that best
suits our beam tracing approach. Sections 4 and 5 focus
on the modeling of diffusion and diffraction with visibility
diagrams. In Section 6 we present two possible applications
of the algorithm presented in this paper. In Section 7 we
prove the efficiency and the effectiveness of our modeling
solution. Finally, Section 8 provides some final comments
and conclusions.
EURASIP Journal on Advances in Signal Processing 3
B(0, 1)
A(0,
−1)
x
(i)
y
(i)
(a)
q
+1
−1
m
(b)
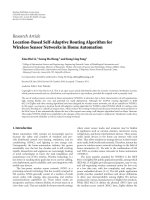
Figure 1: The specialized RRP (a) and the set of rays passing through the reference reflector in the (m, q) domain (visibility region from the
reference reflector) (b).
2. The Visibility Diagram Revisited
In this section we review the concept of visibility diagram,
as it is a key element for the remainder of this paper. In [12]
we adopted this representation for generating a specialized
data structure that could swiftly provide information on
how to trace acoustic beams and rays in real time with
the rules of specular reflection. This approach constitutes a
generalization of the beam tracing algorithm proposed by
Hanrahan and Heckbert [5]. The visibility diagram is a re-
mapping of the geometric structures and functional elements
that constitute the geometric world (rays, beams, reflectors,
sources, receivers, etc.) onto a special parameter space that is
completely dual to the geometric one. Visibility diagrams are
particularly useful for immediately assessing what is in the
line of sight from a generic location and direction in space.
We will first recount the basic concepts of visibility diagrams
and provide a general view of the path-tracing problem for
the specific case of purely specular reflections. This overview
will be provided in a slightly more general fashion than in
[12], as all the algorithmic steps will be given with reference
to visibility diagrams, and will constitute the starting point
for the discussions in the following sections.
2.1. Visibility and the Tracing Problem. Arayina2Dspace
is uniquely characterized by three parameters: two for the
location of its origin, and one for its direction. As we are
tracing paths during their propagation, we are interested in
rays emerging from a reflector after bouncing off it. As a
consequence, the origin corresponds to the virtual source.
Furthermore, because we are interested in assessing only
where the ray will end up, we can afford ignoring some
information on where the ray is coming from, for example
the source distance. This means that a ray description based
on three parameters turns out to be redundant, and can be
easilyreducedtotwoparameters.In[12] we adopted the
Reference Reflector Parametrization (RRP) parametrization
based on the location of the intersection on the reference
reflector and the travel direction of the ray. Although the
RRP is referred to a frame attached to a specific reflector, this
choice does not represent a limitation, due to the iterative
nature of the visibility evaluation process. Let s
i
be the
reference reflector. For reasons that will be clearer later on,
the RRP normalizes s
i
through a translation, a rotation and
a scaling of the axes in such a way that the reference reflector
lies on the segment of the y-axis between
−1and1.The
set of r ays passing through s
i
is described by the equation
y
(i)
= mx
(i)
+ q. Figure 1 shows the reflector s
i
referred to the
normalized frame in the geometric domain (left). The set of
rays passing through s
i
is called region of visibility from s
i
and
it is represented by the horizontal strip (reference visibility
strip) in the (m, q) domain. Due to the duality between
primitives in (x, y)and(m, q) domains we will sometimes
refer to the RRP as the dual space. We are interested in
representing the mutual occlusions between reflectors in the
dual space. With this purpose in mind, we split the v isibility
strip into visibility regions, each corresponding to the set
of rays that hit the same reflector. According to the image-
source principle, all the obstacles that lie in the same half
space of the image-source, are discarded during the visibility
test. As a convention, in the future we will use the rotation
of the reference reflector which brings the image-source in
the half-space x
(i)
< 0. The above parameter space turns out
to play a similar role as the dual of a geometric space. In
Table 1 we summarize the representation of some geometric
primitives in the parameter space. A complete derivation of
the relations of Table 1 can be found in [12, 18]. Notice
that the relation between primitives in the two domains is
of complete duality. For example, the dual of the oriented
reflector is a wedge in the (m, q) domain (sort of an oriented
“beam” in parameter space). Conversely, the dual of an
oriented beam (a single wedge in the (x, y)geometricspace)
is an oriented segment in the (m, q) domain (sort of an
oriented “reflector” in parameter space).
2.1.1. Visibility Reg ion. The parameters describing all rays
originating from the reference reflector s
i
form the region of
visibility from that reflector. After normalization, this region
takes on the strip-like shape described in Figure 1,whichwe
refer to as “reference visibility strip”. Those rays that originate
4 EURASIP Journal on Advances in Signal Processing
Table 1: Primitives in the geometric domain and their correspond-
ing representation in ray space.
Geometric space Ray space
Omnidirectional bundle of
nonoriented rays
Non-oriented ray or two-sided
infinite reflector
x
y
P
m
q
ℓ
Omnidirectional bundle of
outgoing rays (source)
One-sided infinite reflector
x
y
P
m
q
ℓ
Beam (double wedge) Two-sided reflector
x
y
(m
2
, q
2
)
(m
1
, q
1
)
m
q
(m
2
, q
2
)
(m
1
, q
1
)
Two-sided reflector Beam (double wedge)
x
y
P
1
P
2
m
q
ℓ
1
ℓ
2
Oriented beam (single wedge) One-sided reflector
x
y
m
q
(m
2
, q
2
)
(m
1
, q
1
)
One-sided reflector Oriented beam (single wedge)
x
y
P
1
P
2
m
q
from the reference reflector and hit another reflector s
j
form
a subset of this strip (see Figure 1) which corresponds to
the intersection between the dual of s
j
and the dual of s
i
(reference visibility strip). The intersection of the dual of s
j
and the visibility strip is the visibility region of s
j
from s
i
.
Once the source location is specified, the set of rays passing
through s
j
and s
i
and departing from that location will be
a subset of the visibility region of s
j
.Onekeyadvantageof
the visibility approach to the beam tracing problem resides
in the fact that we only need geometric information about
the environment to compute the visibility regions, which can
therefore be co mputed in advance.
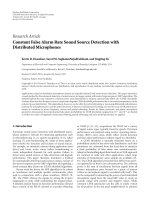
2.1.2. Dual of Multiple Reflectors: Visibility Diagrams. When
there are more than two reflectors in the environment,
we need to consider the possibility of mutual occlusions,
which results in overlapping visibility regions. Sorting out
which reflector occludes which (with respect to the reference
reflector) corresponds to determining which visibility region
overrides which in their overlap. Two solutions for the
occlusion problem are possible: the first, already presented
in [12], is based on a simple test in the geometric domain.
An arbitrar y ray chosen in the overlap of visibility regions
can be cast to evaluate the front-to-back ordering of visibility
regions or, more simply, to determine which oriented
reflector is first met by the test ray. An example is provided
in Figure 2 where, if s
i
is the reference reflector , we end
up having an occlusion between s
2
and s
3
, which needs
to be sorted out. A test ray is picked at random within
the overlapping region to determine which reflector is hit
first by the ray. This particular example shows that, unless
we consider each reflector as the combination of two of
oppositely-facing oriented reflectors, we cannot be sure that
the occlusion problem can be disambiguated. In this case,
for example, s
2
occludes s
3
for some rays, and s
3
occludes
s
2
for others. As shown in Table 1 , a two-sided reflector
corresponds to a double wedge in ray space, each wedge
corresponding to one of the two faces of the reflector. By
considering the two sides of each reflector as individual
oriented reflectors, we end up with four distinct wedge-
like regions in ray space, thus removing all ambiguities. The
overlap between visibility regions of two one-sided reflectors
arises every time the extreme lines of the corresponding
visibility regions intersect. We recall that the dual of a point
P(x, y) is a line whose slope is −x. The extreme lines of the
visibility region of reflector s
j
are the dual of the endpoints
of s
j
, that are (x
(i)
j1
, y
(i)
j1
)and(x
(i)
j2
, y
(i)
j2
) and the slopes of the
extreme lines of the visibility region of s
j
are −x
(i)
ji
and −x
(i)
j2
.
A similar notation is used for the overlapping reflector s
k
.
Under the assumption that s
j
and s
k
never intersect in the
geometric domain, we can reorder one-sided reflectors in
front-to-back order by simply looking at the slopes of the
extreme lines of their visibility regions. If the line
(i)
1
of
equation q
=−mx
(i)
j1
+ y
(i)
j1
and the line
(i)
2
of equation
q
=−mx
(i)
k2
+y
(i)
k2
intersect in the dual space, then −x
(i)
j1
> −x
(i)
k2
guarantees that s
j
occludes s
k
and −x
(i)
j1
< −x
(i)
k2
guarantees
that s
k
occludes s
j
.
2.2. Tracing Reflective Beams and Paths in Dual Space
2.2.1. Tracing Beams. In this paragraph we summarize
the tracing of beams in the geometric space using the
information contained in the visibility diagrams. Further
details on this specific topic can be found in [12]. This
can b e readily done by scanning the visibility diagram
along the line that represents the “dual” of the virtual
source. In fact, that line will be partitioned into a number
of segments, one per visibility region. Each segment will
correspond to a subbeam in the geometric space. Consider
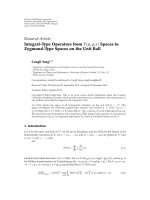
the configuration of reflectors of Figure 3(a). The first step
of the algorithm consists of determining how the complete
pencil of rays produced by the source S is par titioned into
beams. This is done by evaluating the v isibility from the
source using traditional beam tracing. This initial splitting
EURASIP Journal on Advances in Signal Processing 5
y
(i)
S
i
r
a
x
(i)
S
2
r
b
S
3
(a)
q
m
(b)
Figure 2: Ambiguity in the occlusion between two nonoriented reflectors s
2
and s
3
. For some rays (e.g., r
a
) s
2
occludes s
3
. For other rays
(e.g., r
b
) s
3
occludes s
2
.
b
6
b
5
b
4
b
3
S
b
2
b
1
(a)
b
6
b
5
b
4
b
3
S
b
2
b
1
(b)
Figure 3: Beams traced from the source location (a) and the corresponding beam-tree (b).
process produces two classes of beams: those that fall on
a reflector and those that do not. The beams and the
corresponding beam-tree are shown in Figures 3(a) and 3(b),
respectively. We consider the splitting of beam b
3
, shown in
Figure 4. The image-source is represented in the dual space
by the line
P
.Thebeamb
3
will therefore be a segment on
that line, which will be partitioned in a number of segments,
one for each region on the visibility diagram. In Figure 4(a)
the beam splitting is accomplished in the (m, q) domain,
while in Figure 4(b) we can see the corresponding subbeams
in the geometric domain. This process is iterated for all
the beams that fall onto a reflector. Further details can be
found in [12]. At the end of the beam tracing process we
end up with a tree-like data structure, each node b
k
of
which contains information that identifies the corresponding
beam:
(i) the one-sided reference reflector s
i
,
(ii) the one-sided illuminated reflector s
j
(if any),
(iii) the position of the virtual source S(x
(i)
s
, y
(i)
s
) in the
normalized reference fr a me,
(iv) the segment [q
1
, q
2
] that identifies the “illuminating”
region on the y
(i)
-axis,
(v) the parent node (if any),
(vi) a list of the children nodes (if at least one exists).
The last two items are useful when reclaiming the “reflection
history” of a beam. Given the above information we are
immediately able to represent the beams (i.e., segments) in
the (m, q) domain.
2.2.2. Tracing Paths. In [12] the construction of the beam-
tree was accomplished in the dual space but path-tracing
was entirely done in the geometric domain. We will now
derive an alternate and more efficient procedure for tracing
the acoustic paths directly in the dual space. The goal is to
test the presence of the receiver R in the beam b
k
, originating
from the reflector s
i
. The coordinates of the receiver in the
normalized reference frame of s
i
are (x
(i)
r
, y
(i)
r
). In order for R
to be in b
k
, there must exist a ray in b
k
that passes through R,
that is,
∃
m, q
∈
b
k
: y
(i)
r
= mx
(i)
r
+ q.
(1)
This means that the ray (
m, q)fromS to R,isrepresented
in the dual space by a point resulting from the intersection
of the dual of b
k
(a segment) and the dual of R (a line).
The presence test is thus p erformed by computing the
intersection of two lines in the parameter space. If b
k
does not fall onto a reflector, then the condition (1)is
sufficient. If b
k
falls on reflector s
j
, then we must also make
sure that s
j
does not occlude R. Assuming that s
j
lies on
6 EURASIP Journal on Advances in Signal Processing
q
m
l
P
(a)
b
7
b
8
b
9
b
10
b
11
b
12
P
(b)
Figure 4: (a) Beam subdivision performed in the (m, q) domain for the bundle of rays corresponding to the reflection of the beam b
3
of
Figure 3. (b) Corresponding subbeams in the geometric domain.
S
1
S
2
S
3
S
4
S
5
R
S
(a)
b
1
b
2
b
3
b
4
b
5
b
6
b
7
b
8
b
9
b
10
b
11
b
12
S
(b)
Figure 5: Path-tracing from source S to t he receiver R. The beam-tree on the ri ght-hand side is the same as in Figure 3.
the line
(i)
j
: y = m
j
x
(i)
+ q
(i)
j
, we can easily conclude that
R is not occluded by s
j
if the distance between S and R is
smaller than the distance between S and the intersection of
the (
m, q)raywiths
j
, which means that:
(
x
s
− x
r
)
2
+
y
s
− y
r
2
≤
x
s
−
q
j
− q
m
j
− m
2
+
y
s
− m
j
q
j
− q
m
j
− m
− q
j
2
.
(2)
The conditions in (1) and (possibly) (2)aretestedforall
the beams. However, if R falls onto b
k
, then we know that
it cannot fall in other beams that share the virtual source of
b
k
. This speeds up the path-tracing process a great deal. As an
example of the tracing process, consider the situation shown
in Figure 5.HereS and R are not in the line of sight, but
a reflective path exists through the reflection from s
3
. First-
order beams are traced directly in the geometric domain, as
done in [12], therefore the presence of R in beams originating
directly from S is tested directly in the geometric domain.
Let us now test the presence of R in the reflected beams
emerging from b
3
(see Figure 3). The intersection between
b
7
b
8
b
9
b
10
b
11
b
12
l
r
Figure 6: Tracing paths in the visibility diagram: the parameters of
the outgoing ray are found by means of the intersection of the dual
of the beam (a segment) and of the receiver (a line). Paths falling in
beams limited by a reflector, also (2) must hold.
the line
r
,dualofR, and the dual of b
11
(a segment) is easily
found (see Figure 6 on the right). Once we have checked the
presence of the receiver in b
11
, the position of the receiver and
the information encoded in b
11
are sufficient to determine
the delay and the amplitude of the echo associated to that
acoustic path. More details on this aspect will be provided in
Section 6.1.
EURASIP Journal on Advances in Signal Processing 7
Incoming
wavefront
Outcoming
wavefront
Wall
Figure 7: Diffusion phenomenon: a planar wavefront falls onto a
rough surface from a perpendicular direction. The wavefront that
bounces off the surface, resulting from a combination of secondary
wavefronts, will not propagate just in the specular direction with
respect to the exciting wave.
3. Mathematical Models of Diffraction
and Diffusion
In this section we investigate some mathematical models
used in the literature to quantitatively describe the causes
of diffraction and diffusion. Later we will choose the model
which best works for our beam tracing method.
3.1. Models of Diffusion. When a wavefront encounte rs a
rough or nonhomogeneous surface, its energy is diffused
in nonspecular directions (see Figure 7). Let us consider a
flat surface with a single localized unevenness whose size is
bigger than the wavelength λ of the incident wavefront. The
Huygens principle interprets the diffused wavefront as the
superposition of the local wavefronts associated to reflections
on each point of the surface. As we can see in Figure 7, the
direction of propagation of the outgoing wavefront differs
from the direction of the incident one. Consequently, a
sensor facing the wall will pick up energy not just from
the incident wavefront but also from a direction that is not
specular. A rough surface can be characterized through a
statistical description of the speckles (in terms of size and
density). In fact, the acoustic properties of the scattering
material can be predicted or measured using various tech-
niques [19–21]. Diffusion can also be associated to local
variations of impedance (e.g., a flat reflective surface that
exhibits areas of acoustically absorbing material) [22]. From
the listener’s standpoint, diffusion tends to greatly increase
the number of paths between source and receiver and,
consequently, the sense of presence [23]. Different models
have been proposed in the literature to account for diffusion.
A reflection is said to be totally diffusive (Lambertian) if the
probability density function of the direction of the outgoing
rays does not depend on the direction of the incoming
ray. Totally diffused reflections are described by Lambert’s
cosine law. A survey on the typical acoustic characteristics of
materials, however, reveals that Lambertian reflections turn
out to be quite unrealistic. For this reason, in the literature
we find two modeling descriptions: the scattering coefficient
and the diffusion coefficient [24, 25]. The diffusion coefficient
measures the similarity between the polar response of a
Lambertian reflection and the actual one. This coefficient is
expressed as the correlation index between the actual and
the diffusive polar responses corresponding to a wavefront
coming from a perpendicular direction with respect to the
surface. The scattering coefficient measures the ratio between
the energy diffused in nonspecular directions and the total
(specular and diffused) reflected energy. This parameter
is useful when we are interested in modeling diffusion
in reverberant enclosures but it does not account for the
directions of the diffused wavefronts. This approximation
is reasonable in the presence of a large number of diffusive
reflections, but tends to become a bit restrictive when
considering first-order diffusion only (i.e., ignoring diffusion
of diffused paths). This is why in this paper we consider
the additional assumption that diffusive surfaces be wide.
This way the range of directions of diffused propagation
turns out to be wide enough to minimize the impact of the
above approximation. We will use the scattering coefficient
to weight the contribution coming from totally diffuse
reflections (modeled by Lambert’s cosine law) and specular
reflections.
3.2. Models of Diffraction. Diffraction is a very important
propagation mode, particularly in densely occluded environ-
ments. Failing to properly account for this phenomenon in
such situations could result in a poorly realistic rendering
or even in annoying auditory artifacts. In this section we
provide a brief description of three techniques for rendering
diffraction phenomena: the Fresnel Ellipsoid, the line of
sources, and the Uniform Theory of Diffraction (UTD).
We will then explain why the UTD turns out to be the
most suitable approach to the modeling of diffraction in
conjunction with beam tracing.
3.2.1. Fresnel Ellipsoids. Let us consider a source S and a
receiver R with an occluding obstacle in between. According
to the Fresnel-Kirchhoff theory, the portion of the wavefront
that is occluded by the obstacle does not contribute to the
signal measured in R, which therefore differs from what
we would have with unoccluded spherical propagation. In
order to avoid using the Fresnel-Kirchhoff integral, we can
adopt a simpler approach based on Fresnel ellipsoids. If d
is the distance between S and R, only objects ly ing on paths
whose length is between d and d + λ/2 are considered as
obstacles, where λ is the wavelength. If x
s
is the generic
location of the secondary source, the locus of points that
satisfy the equation
Sx
s
R − SR ≤ λ/2 is an ellipsoid with foci
in S and R. The portion of the ellipsoid that is occluded by
obstacles provides an estimate of the absolute value of the
diffraction filter’s response. It is important to notice that the
size of the Fresnel ellipsoid depends on the signal wavelength.
As a consequence, in order to study diffraction in a given
configuration, we need to estimate the occluded portion of
the Fresnel ellipsoids at the frequencies of interest. In [26]
the author proposes to use the graphics hardware to estimate
the hidden portions of the ellipsoids. The main limit related
to the Fresnel ellipsoid is the absence of information related
to the phase of the signal: from the hidden portions of the
ellipsoid, in fact, we can only infer the absolute value of the
diffraction filter. If we need a more accurate rendering of
diffraction, we must resort to other techniques.
8 EURASIP Journal on Advances in Signal Processing
10
0
0
−10
−20
−20
20
x
(m)
y
(m
)
150
100
50
0
z (m)
P
1
P
2
S
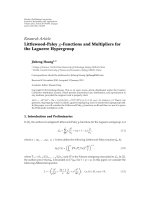
Figure 8: Geometric Theory of Diffraction: an acoustic source is
in S. The acoustic source interacts with the obstacle, producing
diffracted rays. Given the source position S, the points on the
edge behave as secondary sources (e.g., P
1
and P
2
in the figure).
According to the geometrical theory of diffraction, the angle
between the outgoing rays and the edge equals the angle between
the incoming ray and the edge. The envelope of the outgoing rays
forms a cone, known in the literature as Keller cone.
3.2.2. Line of Sources. In [ 27] the authors propose a frame-
work for accurately quantifying diffraction phenomena.
Their approach is based on the fact that each point on a
diffractive edge receives the incident r ay and then re-emits
amuffled version of it. The edge can therefore be seen as
a line of secondary sources. The acoustic wave that reaches
the receiver will then be a weighed superposition of all
wavefronts produced by such edge sources.
In order to quantitatively determine the impact of
diffraction in closed form, we need to be able to evaluate
the visibility of a region (environment) from a line (edge of
secondary sources). As far as we know, there are no results in
the literature concerning the evaluation of regional visibility
from a line. There are, however, several works that simplify
the problem by sampling the line of sources. This way,
visibility is evaluated from a finite number of points [28–30].
This last approach can be readily accommodated into our
framework. However, as we are interested in a fast rendering
of diffraction, we prefer to look into alternate formulations.
3.2.3. Uniform Theory of Diffraction. The Uniform Theory of
Diffraction (UTD) was derived by Kouyoumjian and Pathak
[15] from the Geometric Theory of Diffraction (GTD),
proposed by Keller in 1962 [31]. As shown in Figure 8,
according to the GTD, an acoustic ray that falls onto an edge
with an angle θ
i
produces a distribution of rays that lies on
the surface of a cone. The axis of this cone is the edge itself,
and its ang le of aperture is θ
i
= θ
d
. The GTD assumes that
the edge be of infinite extension, therefore, given a source
and a receiver we can always find a point on the edge such
that the diffracted path that passes through it will satisfy the
constraint θ
i
= θ
d
. The Keller cones for the source S and two
points P
1
and P
2
on the edge are shown in Figure 8.
Inaway,theGTDallowsustocompactlyaccountfor
all contributions of a line distribution of sources. In fact,
if we were to integrate all the infinitesimal contributions
over an infinite edge, we would end up with only one
significant path, which is the one that complies with the
Keller condition, as all the other contributions would end
up canceling each other out. The impact of diffraction on
the source signal is rendered by a diffraction coefficient that
depends on the frequency and on the angle between the
incident ray and the angular aperture of the diffracting wedge
(see Section 6.1 and [32] for further details). This geometric
interpretation of diffraction is also adopted by the UTD. The
difference between GTD and UTD is in how such diffraction
coefficients are computed (see Section 6.1).
The use of the UTD in beam tracing is quite convenient
as it only involves one incident ray per diffractive path. The
UTD, however, assumes that the wedge be of infinite exten-
sion and perfectly reflective, which in some cases is too strong
an assumption. Nonetheless, the advantages associated to
considering only the shortest path make the UTD an ideal
framework for accounting for diffraction in beam tracing
applications. Notice that when the incident ray is orthogonal
to the edge (θ
i
= 90
◦
), the conic surface flattens onto a
disc. This particular situation would be of special interest to
us if we were considering an inherently 2D geometry. This,
however, is NOT our case. We are, in fact, considering the
situation of “separable” 3D environments [12], which result
from the car tesian product between a 2D environment (floor
map) and a 1D (vertical) direction. This special geometry
(sortofanextrudedfloormap)requiresthemodelingof
diffraction and diffusion phenomena in a 3D space. The
Uniform Theory of Diffraction is, in fact, inherently three-
dimensional, but our approach to the tracing of diffractive
rays makes use of fast beam tracing, whose core is two
dimensional. In order to be able to model UTD in fast beam
tracing, we need therefore to first flatten the 3D geometry
onto a 2D environment and later to adapt the 2D diffractive
rays to the 3D nature of UTD. In order to clamp down
the 3D geometry to the floor map, we need to establish a
correspondence between the 3D geometric primitives that
contribute to the Uniform Theory of Diffraction and some
2D geometric primitives. For example, when projected on
a floor map, an infinitely long diffracting edge becomes
adiffractive point, and a 3D diffracted ray becomes a
2D diffracted ray. When tracing diffractive beams, each
wedge illuminated (directly or indirectly) by the source will
originate a disk of diffracted rays, as shown in Figure 8.
At this point we need to consider the 3D nature of the
environment. We do so by “lifting” the diffracted rays in
the vertical direction. We will end up with sort of an
extruded cylinder containing all the rays that are diffracted
by the edge. However, when we specify the locations of the
source and the receiver, we find that this set includes also
paths that do not honor the Keller cone condition θ
i
=
θ
d
, and are therefore to be considered as unfeasible. The
removal of all unfeasible diffracted rays can be done during
the auralization phase. During the auralization, in fac t, we
select the paths coming from the closer diffractive wedges,
as they are co nsidered to be m ore perceptually relevant.
The validation is a costly iterative process, therefore we
only apply it to paths that are likely to be kept during the
auralization.
EURASIP Journal on Advances in Signal Processing 9
3.3. New Needs and Requirements. As already said above,
we are interested in extending the use of visibility maps
for an accurate modeling and a fast rendering of diffusion
and diffraction phenomena. As visibility diagrams were con-
ceived for modeling specular reflections, it is important to
discuss what needs and requirements need to be considered.
Diffraction. Visibility regions can be used for accommodat-
ing and modeling diffraction phenomena. In fact, according
to the UTD, when illuminated by a beam, a diffractive edge
becomesavirtualsourcewithspecificcharacteristics.Our
goal is to model the indirect illumination of the receiver
by means of secondary paths: wavefronts are emitted from
the source, after an arbitrary number of reflections they
fall onto the diffractive edge, which in turn illuminates the
receiver after an arbitrary number of reflections. A common
simplification that is adopted in works that deal with this
phenomenon [14] consists of assuming that second and
higher-order diffra ctions are of negligible impact onto the
auralization result. This, in fact, is a perceptually reasonable
choice that considerably reduces the complexity of the
problem. In fact, a simple solution for implementing the
phenomenon using the tracing tools at hand, consists of
deriving a specialized beam-tree for each diffractive source.
We will see later how. Another important aspect to consider
in the modeling of diffraction is the Keller-cone condition
[31], as briefly motivated above: with reference to Figure 8 we
have to retain paths for which θ
i
= θ
d
. Tsingos et al. in [14]
proposed to account for it by generating a reduced beam-
tree, as constr ained by a generalized cone that conservatively
includes the Keller-cone. The excess rays that do not belong
to the K eller cone, are removed afterwards through an
appropriate check. We will see later that this approach can
be implemented using the visibility diagrams.
Diffusion. Let us consider a source and a receiver, both facing
adiffusive surface. In this case, each point of the surface
generates an acoustic path between source and receiver. This
means that the set of rays that emerge from the diffusing
surface no longer form a beam (i.e., no virtual source
can be defined as they do not meet in a specific point in
space). In fact, according to Huygens principle, all points
of the diffusive surface can be seen as secondary sources
on a generally irregular surface, therefore we no longer
have a single virtual source. Unlike diffraction, diffusion
indeed poses new problems and challenges, as it prevents
us from directly extending the beam tracing method in
a straightforward fashion. One major difference from the
specular case is the fact that the interaction between multiple
diffusive surfaces cannot be described through an approach
based on tracing, as we would have to face the presence of
closed-loop diffusive paths. On the other hand, the impact
of a diffusive surface on the acoustic field intensity is rather
strong, therefore we cannot expect an acoustic path to still be
of some significance after undergoing two or more diffusive
reflections. It is thus quite reasonable to assume that any
relevant acoustic paths would not include more than one
relevant diffusive reflection along its way. We will see later on
S
1
S
2
R
S
S
q
Figure 9: The real source S and the receiver R face the diffusive
reflector s
1
.Reflectors
2
partially occludes s
1
with respect to the
receiver. S
is the image-source of S mirrored over the prolongation
of s
1
.ThesegmentsSq and qR form a diffusive path.
that this assumption, reasonably adopted by other authors
as well (see [13]) opens the way to a viable solution to
the real-time rendering of such acoustic phenomena. In
fact, even if a diffusive surface does not preserve beam-like
geometries, it is still possible to work on the visibility regions
to speed up the tracing process between a source and a
receiver through a diffusivereflection.Thiscanbereadily
generalized to the case in which a chain of rays go from
a source through a series of specular reflections and finally
undergoes a diffusive reflection before reaching the receiver
(diffusive path between a virtual source and a real receiver). A
further generalization will be given for the case in which the
rays undergo all specular reflections but one, which could be
adiffusive reflection somewhere in between the chain. This
last case corresponds to one diffusive path between a virtual
source and a “virtual receiver”, which can be computed by
means of two intersecting beam-trees (a forward one from
the source to the diffusive reflector and a backward one from
the receiver to the diffusive reflector).
4. Tracing Diffusive Paths Using
Visibility Diagrams
As already said before, the rendering of diffusion phenomena
is commonly based on Bidirectional Beam Tracing, from
both the source and the receiver. The need of tracing beams
not just from the source but also from the receiver requires
a certain degree of symmetrization in the definitions. For
example, we need to introduce the concept of “virtual
receiver”, which is the location of the receiver as it gets
iteratively mirrored against reflectors.
Let us consider the situation shown in Figure 9:a
(virtual) source S and a (virtual) receiver R face the diffusive
reflector s
1
.Reflectors
2
partially occludes s
1
with respect
10 EURASIP Journal on Advances in Signal Processing
S
1
S
2
S
y
x
R
q
(a)
q
+1
−1
m
m
o
m
i
q
I
q
l
R
l
S
(b)
Figure 10: Normalized geometric domain (a) and corresponding dual space ( b). The lines
R
and
S
are the dual of the points S
and R.
to R. In order to simplify the problem we singled out the
diffusive path
Sq qR. Figure 9 also shows the image-source
S
, obtained by mirroring S over (the prolongation of) s
1
.
Notice that the geometry (lengths and angles) of the path
Sq qR is preserved if we consider the path S
q qR.Wecan
therefore consider the virtual source S
instead of S,and
trace the diffuse paths onto the visibility diagram “from” the
reference diffusing reflector. If the coordinates of S
and R in
the normalized geometric domain are (x
S
, y
S
)and(x
R
, y
R
),
respectively, then the set of diffuse rays can be represented by
m
i
, m
o
, q
: y
S
= m
i
x
S
+ q, y
R
= m
o
x
R
+ q
.
(3)
In other words, we are searching for the directions
m
i
and m
o
of the rays that originate from the point q on the reference
reflector and pass through S
and R.
The diffuse paths can be quite easily represented in the
RRP from the reference reflector. The path from a point P on
the reflector is, in fact, the intersection of the dual of P,which
is the line q
= q; with the dual of S
, which is the line
S
: q =
−
mx
S
+ y
S
. Similarly, the ray from P to R is the intersection
between the line q
= q and the line
R
: q =−mx
R
+ y
R
.As
we can see, we do not just have the ray that corresponds to
the intersection of the two lines
R
and
S
(same point, same
direction), but a whole collection of rays corresponding to
the horizontal segment that connects the source line
S
and
the receiver line
R
(same point but different directions).
Notice, however, that we have not yet considered poten-
tial occlusions of the diffuse paths from other reflectors in the
environment. In Figure 9 we can see that only a portion of s
1
contributes to d iffusion. In fact there is a portion of s
1
that is
not visible from R,asitisoccludedbys
2
. This occlusion can
be easily identified in the dual space by following a similar
reasoning to that of (2) for the tracing of specular reflective
paths. The set of rays that are potentially occluded by s
2
is represented in the dual space by the beam obtained by
intersecting
R
with the visibility region of s
2
.Inorderto
test whether the beam is actually occluded by s
2
or not, we
can simply pick any ray within that area and check whether
it reaches s
2
before R. The dual space representation of the
problem of Figure 9 is described in the right-hand side of
Figure 10 (the geometric description of the same problem is
shown on the left-hand side of the same Figure, for reasons
of convenience). In the example of Figure 10 the line of
sight between R and s
1
is partially occluded by s
2
, therefore
only the segment [
−1, q
I
] contributes to diffusive paths.
Let us consider, for example, the path
S
q qR, which is the
line q
= q
P
. The directions of the rays from q to R and
S
are given by m
i
and m
o
, respectively. Notice that until
now, for reasons of simplicity, we have considered R to be
the receiver, which forces the diffusion to occur last along
the acoustic path. In order to make the proposed approach
equivalent to bidirectional beam tracing, we will consider
that R is the receiver or a virtual receiver obtained by building
a beam-tree from the receiver location. In order to contain
the computational cost, we only consider low-order virtual
sources and virtual receivers. In Section 7,forexample,we
limit the order of virtual sources a nd virtual receivers to
three.
5. Tracing Diffractive Beams and Paths Using
Visibility Diagrams
In this section we extend the use of visibility diagrams to
model diffractive paths and, using the UTD, we generalize
the fast beam tracing method of [12] to account for this
propagation phenomenon.
5.1. Selection of the Diffractive Wedges. As already discussed
in [14], the diffractivefieldturnsouttobelessrelevant
when source and receiver are in direct visibility. The very
first step of the algorithm consists, therefore, of selecting
which edges are likely to generate a perceptually relevant
diffraction. In what follows, we will refer to a wedge as a
geometric configuration of two or more walls meeting into
EURASIP Journal on Advances in Signal Processing 11
Wedge
II
I
S
1
S
2
S
3
S
4
S
5
S
6
S
7
Figure 11: An example of diffractive wedge and beams departing
from it. Notice that if either the source or the receiver fall outside the
regions marked as I and II, then there is direct visibility, therefore
diffraction can be neglected.
a single edge. If the angular opening of the wedge is smaller
than π and both the receiver and the source fall inside the
wedge, then source and receiver are in direct visibility. Not
all wedges are, therefore, worth retaining. Even if a wedge
is diffractive, we can still find configurations where source
and receiver are in direct visibility. When this happens,
diffraction is less relevant than the direct path and we discard
these diffractive paths. With reference to Figure 11,weare
interested in auralizing diffraction in the two regions marked
as I and II, where source and receiver are not necessarily in
conditions of mutual visibility. For each of the two regions
we will build a beam-tree. This selection process returns a
list i
= 1, , M of diffractive wedges and their coordinates.
5.2. Tracing Diffractive Beam-Trees. With reference to
Figure 12, our goal is to split the bundle of rays departing
from the virtual source and directed towards the regions I
and II into subbeams. In order to do this, we take advantage
of the visibility diagrams. As seen in Section 3, the virtual
source is placed on the tip of the diffracting wedge. The dual
of this virtual source is the semi-infinite line of equation
q
= +1 or q =−1, the sign depending on the normalization
of the RRP. We are interested in auralizing the diffracted field
only in regions I and II, therefore we evaluate the regional
visibility along the lines (virtual sources in the geometric
space) q
=±1onlyform>m
0
or m<m
0
. By scanning
these semi-infinite lines along the visibility diagrams we can
immediately determine all the visible reflectors of the above
beams, and therefore determine their branching. Figure 12
shows the first-level beams and their dual representations
for the configuration of Figure 11 (which refers to regions
I and II). The propagation and the branching of these
diffractive b eams will follow the usual rules, according to the
iterative tracing mechanism defined in Section 2 for specular
reflections. The number of levels (branching order) of the
diffractive beam-trees is indeed to be specified in a differ ent
fashion compared with reflective beam-trees, for reasons of
relevance and computational load. We notice that, at this
stage, the location of source or receiver does not need to be
specified. As a consequence, we can build diffractive beam-
trees in a precomputation phase.
5.3. Diffractive Paths Computation. Once source a nd receiver
are specified, we can finally build the diffractive paths. Let
P
(i,m)
S,I
(P
(i,m)
S,II
) denote the ith reflective path between the
source and the beam-tree to the region I (to the region
II) departing from the diffractive wedge marked with m in
the environment. As far as the auralization of diffraction is
concerned, the path P
(i,m)
S,I
is completely defined if we specify
the source location, the position of the point of incidence of
the ray on the walls (possibly in normalized coordinates) and
the location of the diffrac tive edge. The set of paths between
the source and the diffractive region inside the beam-tree
of the region I (II) is P
(m)
S,I
(P
(m)
S,I
). Similarly, P
( j,n)
R,I
(P
( j,n)
R,I
)
is the jth path between the receiver and the nth diffractive
wedge in the beam-tree I (II), and P
(n)
R,I
(P
(n)
R,II
) is the set of
paths between receiver and the diffractive edge inside the
region I (II).
We are interested in diffractive paths where source and
receiver fall in opposite regions: if the source falls within the
beam-tree I, then we will check whether the receiver is in the
beam-tree II, as diffraction is negligible when both source
and receiver are in the same region. Let P
(m)
I
→ II
be the set of
paths associated to the diffractive edge m (when the source is
in beam-tree I, and the receiver in II). Similarly, P
(m)
II
→ I
is the
set of paths where the source is in the beam-tree II and the
receiver is in I. These sets are obtained as
P
(m)
I
→ II
= P
(m)
S,I
⊗ P
(m)
R,II
,
P
(m)
II
→ I
= P
(m)
S,II
⊗ P
(m)
R,I
,
(4)
where
⊗ denotes the cartesian product. Finally, the set of
paths for the diffractive edge m is the union of P
(m)
I
→ II
and
P
(m)
II
→ I
:
P
(m)
= P
(m)
I
→ II
∪ P
(m)
II
→ I
.
(5)
In order to preserve the Keller cone condition, we have to
determine the point P
d
on the diffractive edge that makes
the angle θ
i
between the incoming ray and the edge equal
to the angular aperture of the Keller cone θ
d
. When dealing
with diffractivebeam-treeswhichincludealsooneormore
reflections, the condition θ
i
= θ
d
is no longer sufficient for
determining the location of the virtual source, as we must
also preserve the Snell’s law for the reflections inside the path.
In [14] the authors propose to compute the diffraction and
reflection points along the diffractive path through a system
of nonlinear equations. This solution is obtained through an
iterative Newton-Raphson algorithm. In this paper we adopt
the same approach.
12 EURASIP Journal on Advances in Signal Processing
Wedge
II
I
S
1
S
2
S
3
S
4
S
5
S
6
S
7
(a)
S
3
S
4
q
m
b
∞
b
∞
b
3
b
4
(b)
Wedge
II
I
S
1
S
2
S
3
S
4
S
5
S
6
S
7
(c)
q
m
b
∞
b
5
b
6
b
7
S
5
S
6
S
7
(d)
Figure 12: When the s ource and the receiver fall outside the regions I and II, diffraction becomes negligible. The diffractive beam-trees will
therefore cover regions I and II only.
6. Applications to Rendering
In this section we discuss the above beam tracing approach
in the context of acoustic rendering. As anticipated, we first
discuss the more traditional case of channel-based (point-
to-point) rendering. This is the case of auralization when the
user is wearing a headset.
We will then discuss the case of geometric wavefield
rendering.
6.1. Path-Tracing for Channel Rendering. In this section we
propose and describe a simple auralization system based
on the solutions proposed above. Due to their different
nature, we will distinguish between reflective, diffusive
and diffractive echoes. In particular, diffraction involves a
perceptually relevant low-pass filtering on the signal, hence
we will stress diffraction instead of diffusion and reflection.
The diffraction is rendered by a coefficient, whose value
depends on the frequency. Each diffractive wedge, therefore,
acts like a filter on the incoming signal, with an apparent
impact on the overall computational cost. We therefore made
our auralization algorithms select the most significant paths
only, based on a set of heuristic rules that take the power of
each diffractive filter into account.
6.1.1. Auralization of Reflective Paths. As far as reflections
are concerned, we follow the approach proposed in [12]:
the echo i is characterized by a length
i
. The magnitude of
the ith echo is A
i
= r
k
/
i
, r being the reflection coefficient
and k being the number of reflections (easily determined by
inspecting the beam-tree). The delay associated to the echo i
is d
i
=
i
/c,wherec is the speed of sound (c = 340 m/s in our
experiments).
6.1.2. Auralization of Diffraction. As motivated in Section
5,wehaveresortedtoUTDtorenderdiffraction. In
order to auralize diffraction paths, we have to compute a
diffraction coefficient, which exhibits a frequency-dependent
behavior. A comprehensive tutorial on the computation of
the diffraction coefficient in UTD may be found in [14]. We
remark here that in order to compute the diffractive filter,
for each path we need some geometrical information ab out
the wedge (available at a precomputation stage) and about
the path, which is available only after the Newton Raphson
algorithm described in the previous Section.
6.1.3. Auralization of Diffusive Paths. Accurate modeling of
diffusion is typically based on statistical methods [33]. Our
EURASIP Journal on Advances in Signal Processing 13
modeling solution is, in fact, aimed at auralization and
rendering applications, therefore we resort to an approxi-
mated but still reliable approach that does not significantly
impact on the computational cost: we make use of the
Lambert cosine law, which works for energies, to compute
the energy response. Then we convert the energy response
onto a pressure response by taking its square root. A similar
idea was developed in [34], where the author combines beam
tracing and radiosity.
In order to compute the energy response, we need
the knowledge of the position of the virtual source and
receiver and the segment on the illuminating reflector from
which rays depart. The energy response H
(i)
d
of the diffusive
path from reflector i is given by the integration of the
contributions of each point of the reflector. If the length of
the diffusive portion is , then the auralization filter may be
approximated as
H
(i)
d
=
N
i=1
D
(
P
i
)
ΔP,
(6)
where P
i
is the coordinate on the diffuser, N is the number
of portions in which the segment has been subdivided and
D(P
i
) is modeled according to the Lambert cosine law:
D
(
P
i
)
=
cos
[
θ
i
(
P
i
)
]
cos
[
θ
o
(
P
i
)
]
π
,
(7)
and θ
i
(P
i
)andθ
o
(P
i
) are the directions of the incident and
outgoing rays referred to the axis of the reflector, respectively.
Angles θ
i
(P
i
)andθ
o
(P
i
) are related to m
i
and m
o
according
to
θ
i
(
P
)
= tan
[
m
i
(
P
)
]
,
θ
o
(
P
)
= tan
[
m
o
(
P
)
]
.
(8)
6.2. Beam Tracing for Sound Field Rendering. The beam-
tree contains all the information that we need to st ructure
a sound field as a superposition of individual beams, each
originating from a different image-source. A solution was
recently proposed for reconstructing an individual beam in
a parametric fashion using a loudspeaker array [16]. Here,
an arbitrary beam of prescribed aperture, orientation origin
is reconstructed using an array of loudspeakers. In particular,
the least squares difference of the wavefields produced by the
array of loudspeakers and by the virtual source is minimized
over a set of predefined control points. The minimization
returns a spatial filter to be applied at each loudspeaker. It
is interesting to notice that the approach described in [16]
offers the possibility to design a spatial filter that performs
a nonuniform weighting of the rays within the same beam.
This feature enables the rendering of “tapered” beams, which
is particularly useful when dealing with diffractive beams. In
fact, the diffraction coefficient (see [14] for further details)
assigns different levels of energy to rays within the same
beam, according to the reciprocal geometric configuration of
the source, the wedge and the direction of travel of the ray
departing from the wedge.
−5 0 5 10152025
−2
0
2
4
6
8
10
x (m)
y (m)
Figure 13: Example of a test environment used for assessing the
computational efficiency of our beam tracing algorithm. The 8 m
×
4 m rooms are all connected together through randomly-located
apertures.
The rendering of the overall sound field is finally achieved
by adding together the spatial filters for the individual beams.
More details and a some preliminary results of this method
can be found in [35].
7. Experimental Results
In order to test the validity of our solution, we per-
formed a series of simulation experiments as well as a
measurement campaign in a real environment. An initial
set of simulations was performed with the goal of assessing
the computational efficiency of our techniques for the
auralization of reflective, diffractive and diffusive paths,
separately considered. In order to assess the accuracy of our
method, were constructed the impulse responses of a given
environment (on an assigned grid of points) through both
simulation and direct measurements. From such impulse
responses, we derived a set of parameters, typically used
for describing reverberation. The comparison between the
measured parameters and the simulated ones was aimed
at assessing the extent of the improvement brought by
introducing cumulatively diffraction and diffusion into our
simulation.
7.1. Computation Time. In order to assess the computational
efficiency of the proposed method, we conducted a series of
simulations in environments of controlled complexity (vari-
able geometry). We developed a procedure for generating
testing environments with an arbitrary number of 8 m
×
4 m rooms, all chained together as shown in Figure 13.An
N-room environment is therefore made of 4N reflectors.
In order to enable acoustic interaction between rooms,
each one of the intermediate walls exhibits a randomly-
placed opening. In our tests, we generated environments
with 20, 40, 80, 120, 320, 640 such walls. The simu-
lation platform was based on an Intel Mobile Pentium
processor equipped with 1 GB of RAM, and the goal was
to:
14 EURASIP Journal on Advances in Signal Processing
100 200 300 400
0.5
1
1.5
2
Walls
Beam tracing time (s)
Visibility diagram
Traditional beam tracing
Figure 14: Beam-tree building time for variable geometry for
traditional beam tracing (circles) and visibility-based beam tracing
(squares) for 10,000 beams. The proposed approach greatly out-
performs traditional beam tr acing especially when the number of
traced beams is very large.
(i) compare the beam-tree’s building time of visibility-
based beam tracing with that of traditional beam
tracing [5];
(ii) measure the diffractive path-tracing time;
(iii) measure the diffusive path-tr acing time.
As far as the time spent by the system in computing the
visibility diagrams is concerned, we invite the reader to [12].
The beam-t ree building time is intended as the time spent by
the algorithm in tracing a preassigned number of beams. In
order to assess the impact of the proposed approach on this
specific parameter, in comparison with a traditional beam-
tracing approach, we stopped the algorithm when 10,000
beams were traced. The simulation results are shown in
Figure 14. As expected, our approach turns out to outper-
form traditional beam tracing. As the beam-tree building
time strongly depends on the source location, we conducted
numerous tests by placing the source at the center of each
one of the rooms of the modular environments. The beam-
tree building time was then computed as the average of the
beam-tree building times over all such simulations. In order
to test the tracing time of the diffusive paths the source
has been placed in the center the modular environment. We
conducted several experiments placing the receiver at the
center of each one of the rooms. We measured the time
spent by the system in computing the diffusive paths. We
considered up to three reflections before and after the diffuse
interaction. Figure 15 shows the average tracing time of the
diffusive paths as a function of the number of walls. If we
are interested in an accurate rendering, we should trace at
least 1000 beams: in this situation we notice that even in a
complex environment (e.g., 640 walls) the auralization of the
diffusive paths takes only a fraction of the time spent by the
100 200 300 400 500 600
0.005
0.01
0.015
0.02
0.025
0.03
0.035
0.04
Variable geometry, 10000 beams
Walls
Diffused paths estimation time (s)
Figure 15: Tracing time of the diffusive paths as a function of the
number of walls of the environment of Figure 13.
100 200 300 400 500 600
0.2
0.4
0.6
0.8
1
Walls
Diffractive path auralization time (s)
Figure 16: Auralization time for diffractive paths (measured in
seconds) versus the complexity (measured by the number of walls)
of the environment.
system for the auralization of the reflective paths. The last test
is aimed at assessing the computational time for auralizing
the diffractive paths. As done above, the source was placed
at the center of the environment and we conducted several
experiments, placing the receiver at the center of each room.
In particular in this situation two tests have been conducted:
(i) the number of diffractive paths with respect to the
number of walls in the environment;
(ii) the computational time for auralizing the diffractive
paths.
Figure 16 shows the time that the system takes to auralize
the diffractive paths, as a function of the number of walls
in the environment. Figure 17 shows the number of paths
for the same experiment. The number of diffractive paths
depends upon both the depth of the diffractive beam-trees
EURASIP Journal on Advances in Signal Processing 15
100 200 300 400 500 600
200
400
600
800
1000
Walls
Number of diffractive paths
Figure 17: Number of diffractive paths versus the complexity of
the environment (measured by the number of walls) in which
experiments are done.
0.5
6.85
6.61 3.57
5
0.6
2
4
0.5
1
1
1
1
1
1
0.5
1
1
1
1
1
1
1
1
0.94
x
y
Figure 18: Floor-map of the validation environment: the grid
represents the 77 acquisition points and the loudspeaker location
is marked with a dot.
and the number of diffractive edges in the environment in
quite an unpredictable fashion. Notice that the auralization
for the diffractive paths can exceed the auralization of the
reflective paths. However, we should keep in mind that the
computation of over 1000 diffractivepathscanbequite
redundant from a perceptual standpoint. We propose here to
select the diffractive paths arisen from the closer diffractive
wedges, as t hey are more perceptually relevant.
7.2. Validation. It becomes important to assess how well
spatial distributions of reverberations are rendered by this
approach. In order to do so, we conducted comparative tests
between simulated data and real data with corresponding
geometries. We placed a high-quality loudspeaker in a
reverberant environment and used it to reproduce a MLS
sequence [36]. The environment’s floor map is shown in
6
4
2
−6 −4 −20 2
Simulated response with reflections: EDT (ms)
140
120
100
80
(a)
Simulated response with reflection and diffraction: EDT (ms)
6
4
2
−6 −4 −20 2
140
120
100
80
(b)
Simulated response with reflection,
diffraction and diffusion: EDT (ms)
140
130
120
110
6
4
2
−6 −4 −20 2
(c)
Measured response: EDT (ms)
140
130
120
110
6
4
2
−6 −4 −20 2
150
(d)
Figure 19: Early Decay Time map: (a) simulated with reflections
only, (b) simulated with reflections and diffraction, (c) simulated
with reflections, diffr action and diffusion, (d) m easured.
Figure 18, where the location of the loudspeaker and micro-
phone are marked with green and red dots, respectively.
The acquired signals were then processed to determine the
impulse responses of the environment in those locations, as
described in [36]. The reflective and diffusive reflection coef-
ficients of the walls, indeed, could not be directly measured
but were coarsely determined so that the T
20
of the simulated
impulse response would approximate the estimated one in
a given test position. As a sample-to-sample comparison of
the acquired and simulated impulse responses is not very
informative, we compared some parameters that describe
the impulse response, which can be readily derived from the
simulated and measured impulse responses. In particular, we
run extensive simulations first with reflections only (up to
the 16th order of the beam-tree), with diffraction (up to the
6th order) and finally with diffusion (with an order 3).
16 EURASIP Journal on Advances in Signal Processing
Simulated response with reflections: Normalized energy
−6 −4 −20 2
2
4
6
0
0.5
1
(a)
Simulated response with reflection and diffraction:
Normalized energy
−6 −4 −20 2
2
4
6
0
0.5
1
(b)
Simulated response with reflection, diffraction and diffusion:
Normalized energy
−6 −4 −20
2
2
4
6
0
0.5
1
(c)
Measured response: Normalized energy
−6 −4 −20 2
2
4
6
0
0.5
1
(d)
Figure 20: Normalized energy map: (a) simulated with reflections
only, (b) simulated with reflections and diffraction, (c) simulated
with reflections, diffr action and diffusion, (d) m easured.
Early Decay Time (EDT). EDT is the time that the Schroeder
envelope of the impulse response takes to drop of 10 dB.
A comparison of the EDT maps (geographical distribution
of the EDT in the measured and simulated cases) is shown
in Figure 19. Notice that the impact of diffusion in this
experiment is quite significant: in fact, as expected, including
diffusion increases the energy in the “tail” of the impulse
response, with the result of obtaining a more realistic
reverberation.
Normalized Energy of the Impulse Response. where the nor-
malization is performed with respect to the impulse response
of maximum energy. A comparison between normalized
energy maps is shown in Figure 20. Once again we notice
that a simulation of all phenomena (reflections, diffraction
and diffusion) produces more realistic results.
6
4
2
−6 −4 −20 2
Simulated response with reflections: Centre time (ms)
100
80
60
40
(a)
Simulated response with reflection and diffraction:
Centre time (ms)
6
4
2
−6 −4 −20 2
100
80
60
40
(b)
Simulated response with reflection, diffraction and diffusion:
Centre time (ms)
6
4
2
−6 −4 −20 2
100
80
60
40
(c)
Measured response: Centre time (ms)
6
4
2
−6 −4 −20 2
100
80
60
40
(d)
Figure 21: Center Time map: measured (a) simulated with
reflections only, (b) simulated with reflections and diffraction, (c)
simulated with reflections, diffraction and diffusion, (d) measured.
Center Time. It is first-order momentum of the squared
impulse response. The Center Time (CT) map is shown
in Figure 21, where we see that a simulation based on
reflections, diffraction and diffusionallowsustoachieve,
once again, a good match. We notice, in particular, that
modeling diffusion increases the level of smoothness of the
simulated map, which makes it more similar to the measured
one.
8. Conclusions
In this paper we proposed an extension of the visibility-
based beam tracing method proposed in [12], which now
allows us to model and render propagation phenomena such
as diffraction and diffusion, without significantly affecting
the computational efficiency. We also improved the method
EURASIP Journal on Advances in Signal Processing 17
in [12] by showing that not just the construction of the
beam-tree but also the whole path-tracing process can be
entirely performed on the visibility maps. We finally showed
that this approach produces quite accurate results when
comparing simulated data with real acquisitions. Thanks
to that, this modeling tool proves particularly useful every
time there is a need for an accurate and fast simulation of
acoustic propagation in environments of variable geometry
and variable physical characteristics.
Acknowledgment
The research leading to these results has received fund-
ing from the European Community’s Seventh Framework
Programme (FP7/2007-2013) under grant agreement no.
226007.
References
[1] S. Kopuz and N. Lalor, “Analysis of interior acoustic fields
using the finite element method and the boundary element
method,” Applied Acoustics, vol. 45, no. 3, pp. 193–210, 1995.
[2] A. Kludszuweit, “Time iterative boundary element method
(TIBEM)—a new numerical method of four-dimensional
system analysis for thecalculation of the spatial impulse
response,” Acustica, vol. 75, pp. 17–27, 1991.
[3] R. Ciskowski and C. Brebbia, Boundary Element Methods in
Acoustics, Elsevier, Amsterdam, The Netherlands, 1991.
[4] U. Krockstadt, “Calculating the acoustical room response by
the use ofa ray tracing technique,” Journal of Sound and
Vibrations, vol. 8, no. 1, pp. 118–125, 1968.
[5] Paul S. Heckbert and Hanrahan, “Beam tracing polygonal
objects,” in Proceedings of the 11th Annual Conference on
Computer Graphics and Interactive Techniques, pp. 119–127,
July 1984.
[6] N. Dadoun, D. Kirkpatrick, and J. Walsh, “The geometry
of beam tr acing,” in Proceedings of the ACM Symposium on
Computational Geometry, pp. 55–61, Sedona, Ariz, USA, June
1985.
[7] M. Monks, B. Oh, and J. Dorsey, “Acoustic simulation and
visualisationusing a new unified beam tracing and image
source approach,” in Proceedings of the 100th Audio Engineer-
ing Society Convention (AES ’96), Los Angeles, Ariz, USA,
1996.
[8] U. Stephenson and U. Kristiansen, “Pyramidal beam tracing
and time dependent radiosity,” in Proceedings of the 15th
InternationalCongressonAcoustics, pp. 657–660, Trondheim,
Norway, June 1995.
[9] J. P. Walsh and N. Dadoun, “What are we waiting for? The
developmentof Godot, II,” Journal of the Acoustical Society of
America, vol. 71, no. S1, p. S5, 1982.
[10] T. Funkhouser, I. Carlbom, G. Elko, G. Pingali, M. Sondhi,
and J. West, “Beam tracing approach to acoustic modeling for
interactive virtual environments,” in Proceedings of the Annual
Conference on Computer Graphics (SIGGRAPH ’98), pp. 21–32,
July 1998.
[11] S. Laine, S. Siltanen, T. Lokki, and L. Savioja, “Accelerated
beam tracing algorithm,” Applied Acoustics,vol.70,no.1,pp.
172–181, 2009.
[12] F. Antonacci, M. Foco, A. Sarti, and S. Tubaro, “Fast tracing
of acoustic beams and paths through visibility lookup,” IEEE
Transactions on Audio, Speech and Language Processing, vol. 16,
no. 4, pp. 812–824, 2008.
[13] T. Funkhouser, P. Min, and I. Carlbom, “Real-time acoustic
modeling for dist ributed virtual environments,” in Proceedings
of ACM Computer Graphics (SIGGRAPH ’99), A. Rockwood,
Ed., pp. 365–374, Los Angeles, Ariz, USA, 1999.
[14] N. Tsingos, T. Funkhouser, A. Ngan, and I. Carlbom, “Mod-
eling acoustics in virtual environments using the uniform
theory of diffraction,” in Proceedings of the 28th International
Conference on Computer Graphics and Interactive Techniques
(SIGGRAPH 2001), pp. 545–552, August 2001.
[15] R. G. Kouyoumjian and P. H. Pathak, “A uniform geometrical
theory of diffraction for an edge in a perfectly conducting
surface,” Proceedings of the IEEE, vol. 62, no. 11, pp. 1448–
1461, 1974.
[16] A. Canclini, A. Galbiati, A. Calatroni, F. Antonacci, A. Sarti,
and S. Tubaro, “Rendering of an acoustic beam through an
array of loud-speakers,” in Proceedings of the 12th International
Conference on Digital Audio Effects (DAFx ’09), 2009.
[17] A. J. Berkhout, “Holographic approach to acoustic control,”
Journal of the Audio Engineering Society, vol. 36, no. 12, pp.
977–995, 1988.
[18] M. Foco, P. Polotti, A. Sarti, and S. Tubaro, “Sound spa-
tialization basedon fast beam tracing in the dual space,” in
Proceedings of the 6th International Conference on Digital Audio
Effects (DAFX ’03), pp. 198–202, London, UK, September
2003.
[19] B. Brouard, D. Lafarge, J. -F. Allard, and M. Tamura,
“Measurement and prediction of the reflection coefficient of
porous layers at oblique incidence and for inhomogeneous
waves,” Journal of the Acoustical Society of America, vol. 99, no.
1, pp. 100–107, 1996.
[20] M. Kleiner, H. Gustafsson, and J. Backman, “Measurement
of directional scattering coefficients using near-field acoustic
holography and spatial transformation of sound fields,”
Journal of the Audio Enginee ring Society, vol. 45, no. 5, pp. 331–
346, 1997.
[21] C. Nocke, “In-situ acoustic impedance measurement using a
free-field transfer function method,” Applied Acoustics, vol. 59,
no. 3, pp. 253–264, 2000.
[22] S. I. Thomasson, “Reflection of waves from a point source by
an impedance boundary,” Journal of the Acoustical Society of
America, vol. 59, no. 4, pp. 780–785, 1976.
[23] T. Funkhouser, N. Tsingos, and J. M. Jot, “Sounds good to
me! computational sound for graphics, vi rtual reality, and
interactive systems,” in Proceedings of ACM Computer Graphics
(SIGGRAPH ’02), San Antonio, Tex, USA, July 2002.
[24] H. Kuttruff, Room Acoustics, Elsevier, Amsterdam, The Nether-
lands, 3rd edition, 1991.
[25] L. L. Beranek, Concert and Opera Halls: How they Sound,
Acoustical Society of America through the American Institute
of Physics, 1996.
[26] N. Tsingos, Simulating high qualit y virtual sound fields for
interactive graphics applications, Ph.D. dissertation, Universite
J. Fourier, Grenoble, France, 1998.
[27] M. A. Biot and I. Tolstoy, “Formulation of wave propagation
in infinite media by normal coordinates with an application
to diffraction,” Journal of the Acoustical Society of America, vol.
29, pp. 381–391, 1957.
18 EURASIP Journal on Advances in Signal Processing
[28] T. Lokki, L. Savioja, and P. Svensson, “An efficient auralization
of edge diffraction,” in Proceedings of 21st International
Conference of Audio Engineering Society (AES ’02), May 2002.
[29] U. P. Svensson, R. I. Fred, and J. Vanderkooy, “An analytic sec-
ondary source model of edge diffraction impulse responses,”
Journal of the Acoustical Society of America, vol. 106, no. 5, pp.
2331–2344, 1999.
[30] R. R. Torres, U. P. Svensson, and M. Kleiner, “Computation
of edge diffraction for more accurate room acoustics auraliza-
tion,” Journal of the Acoustical Society of America, vol. 109, no.
2, pp. 600–610, 2001.
[31] J. B. Keller, “Geometrical theory of diffraction,” Journal of the
Optical Society of America, vol. 52, pp. 116–130, 1962.
[32] D. McNamara, C. Pistorius, and J. Malherbe, Introduction to
the Uniform Geometrical Theory of Diffraction,ArtechHouse,
1990.
[33] J. H. Rindel, “The use of computer modeling in room
acoustics,” Journal of Vibroengineering, vol. 3, pp. 41–72, 2000.
[34] T. Lewers, “A combined beam tracing and radiatn exchange
computer model of room acoustics,” Applied Acoustics, vol. 38,
no. 2–4, pp. 161–178, 1993.
[35] F. Antonacci, A. Calatroni, A. Canclini, A. Galbiati, A. Sarti,
and S. Tubaro, “Soundfield rendering with loudspeaker arrays
through multiple beam shaping,” in Proceedings of IEEE
Workshop on Applications of Signal Processing to Audio and
Acoustics (WASPAA ’09), pp. 313–316, 2009.
[36] D. D. Rife and J. Vanderkooy, “Transfer-function measure-
ment with maximum-length sequences,” Journal of the Audio
Engineering Society, vol. 37, no. 6, pp. 419–444, 1989.