Báo cáo hóa học: " Research Article Real-Time Audio-to-Score Alignment Using Particle Filter for Coplayer Music Robots" doc
Bạn đang xem bản rút gọn của tài liệu. Xem và tải ngay bản đầy đủ của tài liệu tại đây (1.45 MB, 13 trang )
Hindawi Publishing Corporation
EURASIP Journal on Advances in Signal Processing
Volume 2011, Article ID 384651, 13 pages
doi:10.1155/2011/384651
Research Article
Real-Time Audio-to-Score Alignment Using
Particle Filter for Coplayer Music Robots
Takuma Otsuka,
1
Kazuhiro Nakadai,
2, 3
Toru Takahashi,
1
Tetsuya Ogata,
1
and Hiroshi G. Okuno
1
1
Graduate School of Informatics, Kyoto University, Kyoto 606-8501, Japan
2
Honda Research Institute Japan, Co., Ltd., Wako, Saitama 351-0114, Japan
3
Graduate School of Information Science and Engineering, Tokyo Institute of Technology, Tokyo 152-8550, Japan
Correspondence should be addressed to Takuma Otsuka,
Received 16 September 2010; Accepted 2 November 2010
Academic Editor: Victor Lazzarini
Copyright © 2011 Takuma Otsuka et al. This is an open access article distributed under the Creative Commons Attribution
License, which permits unrestricted use, distribution, and reproduction in any medium, provided the original work is properly
cited.
Our goal is to develop a coplayer music robot capable of presenting a musical expression together with humans. Although
many instrument-performing robots exist, they may have difficulty playing with human performers due to the lack of the
synchronization function. The robot has to follow differences in humans’ performance such as temporal fluctuations to play with
human performers. We classify synchronization and musical expression into two levels: (1) melody level and (2) rhythm level to
cope with erroneous synchronizations. The idea is as follows: When the synchronization with the melody is reliable, respond to the
pitch the robot hears, when the synchronization is uncertain, try to follow the rhythm of the music. Our method estimates the score
position for the melody level and the tempo for the rhythm level. The reliability of the score position estimation is extracted from
the probability distribution of the score position. The experimental results demonstrate that our method outperforms the existing
score following system in 16 songs out of 20 polyphonic songs. The error in the prediction of the score position is reduced by 69%
on average. The results also revealed that the switching mechanism alleviates the error in the estimation of the score position.
1. Introduction
Music robots capable of, for example, dancing, singing, or
playing an instrument with humans will play an important
role in the symbiosis between robots and humans. Even
people who do not speak a common language can share
a friendly and joyful time through music not withstanding
age, region, and race that we belong to. Music robots can be
classified into two categories; entertainment-oriented robots
like the violinist robot [1] exhibited in the Japanese booth
at Shanghai Expo or dancer robots, and coplayer robots for
natural interaction. Although the former category has been
studied extensively, our research aims at the latter category,
that is, a robot capable of musical expressiveness in harmony
with humans.
Music robots should be coplayers rather than enter-
tainers to increase human-robot symbiosis and achieve a
richer musical experience. Their music interaction requires
two important functions: synchronization with the music
and generation of musical expressions, such as dancing or
playing a musical instrument. Many instrument-performing
robots such as those presented in [1–3]areonlycapable
of the latter function, as they may have difficulty playing
together with human performers. The former function is
essential to promote the existing unidirectional entertain-
ment to bidirectional entertainment.
We classify synchronization and musical expression into
two levels: (1) the rhythm level and (2) the melody level.The
rhythm level is used when the robot loses track of what part
of a song is being performed, and the melody level is used
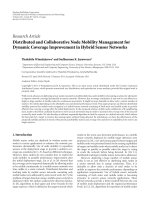
when the robot knows what part is being played. Figure 1
illustrates the two-level synchronization with music.
When humans listen to a song being unaware of the
exact part, they try to follow the beats by imagining a corre-
sponding metronome, and stomp their feet, clap their hands,
or scat to the rhythm. Even if we do not know the song
2 EURASIP Journal on Advances in Signal Processing
Rhythm level interaction
bap ba dee da dee
Stomp
Repetitive actions
(a)
Melody level interaction
I see trees of green
···
Play
Planned actions
regarding the melody
(b)
Figure 1: Two levels in musical interactions.
or the lyrics to sing, we can still hum the tune. On the
other hand, when we know the song and understand which
part is being played, we can also sing along or dance to
a certain choreography. Two issues arise in achieving the
two-layer synchronization and musical expression. First, the
robot must be able to estimate the rhythm structure and the
current part of the music at the same time. Second, the robot
needs a confidence in how accurately the score position is
estimated, hereafter referred to as an estimation confidence,
to switch its behavior between the rhythm level and melody
level.
Since most existing music robots that pay attention to
the onset of a human’s musical performance have focused
on the rhythm level, their musical expressions are limited
to repetitive or random expressions such as drumming [4],
shaking their body [5], stepping, or scatting [6, 7]. Pan
et al. developed a humanoid robot system that plays the
vibraphone based on visual and audio cues [8]. This robot
only pays attention to onset of human-played vibraphone. If
the robot recognizes the pitch of human’s performance, the
ensemble will be enriched. A percussionist robot called Haile
developed by Weinberg and Driscoll [9] uses MIDI signals to
account for the melody level. However, this approach limits
the naturalness of the interaction because live performances
with acoustic instruments or singing voices cannot be de
scribed by MIDI signals. If we stick to MIDI signals, we
would have to develop a conversion system that can take any
musical audio signal, including singing voices, and convert it
to MIDI representation.
An incremental audio-to-score alignment [10]waspre-
viously introduced for the melody level for the purpose of a
robot singer [11], but this method will not work if the robot
fails to track the performance. The most important principle
in designing a coplayer robot is robustness to the score fol
lower’s errors and to try to recover from them to make en
semble performances more stable.
This paper presents a score following algorithm that
conforms to the two-level model using a particle filter [12].
Our method estimates the score position for the melody
level and tempo (speed of the music) for the rhythm level.
The estimation confidence is determined from the probabil-
ity distribution of the score position and tempo. When the
estimation of the score position is unreliable, only tempo
is reported, in order to prevent the robot from performing
incorrectly; when the estimation is reliable, the score position
is reported.
2. Requirements in Score Following for
Musical Ensemble with Human Musicians
Music robots have to not only follow the music but also
predict upcoming musical notes for the following reasons. (1)
Amusicalrobotneedssometemporaloverheadtomoveits
arms or actuators to play a musical instrument. To play in
synchronization with accompanying human musicians, the
robot has to start moving its arm in advance. This overhead
also exists in MIDI synthesizers. For example, Murata et al.
[7] reports that it takes around 200 (ms) to generate a singing
voice using the singing voice synthesizer VOCALOID [13].
Ordinary MIDI synthesizers need 5–10 (ms) to synthesize
instrumental sounds. (2) In addition, the score following
process itself takes some time, at least 200–300 (ms) for our
method. Therefore, the robot is only aware of the past score
position. This also makes the prediction mandatory.
Another important requirement is the robustness against
the temporal fluctuation in the human’s performance. The
coplayer robot is required to follow the human’s performance
even when the human accompanist varies his/her speed.
Humans often changes his/her tempo in their performance
for richer musical expressions.
2.1. State-of-the-Art Score Following Systems. Most popular
score following methods are based on either dynamic time
warping (DTW) [14, 15] or hidden Markov models (HMMs)
[16, 17]. Although the target of these systems is MIDI-based
automatic accompaniment, the prediction of upcoming
musical notes is not included in their score following model.
The onset time of the next musical note is calculated by
extrapolating those of the musical notes aligned with the
score in the past.
Another score following method named Antescofo [18]
uses a hybrid HMM and semi-Markov chain model to predict
the duration of each musical note. However, this method
reports the most likely score position whether it is reliable
or not. Our idea is that using an estimation confidence of the
score position to switch between behaviors would make the
robot more intelligent in musical interaction.
Our method is similar to the graphical model-based
method [19] in that it similarly models the transition of
the score position and tempo. The difference is that this
graphical model-based method follows the audio perfor-
mance on the score by extracting the peak of the probability
distribution over the score position and tempo. Our method
approximates the probability distribution with a particle
filter and extracts the peak as well as uses the shape of the
distribution to derive an estimation confidence for two-level
switching.
EURASIP Journal on Advances in Signal Processing 3
Amajordifference between HMM-based methods and
our method is how often a score follower updates the
score position. HMM-based methods [16–18] update the
estimated score position for each frame of short-time Fourier
transform. Although this approach can naturally assume
the transients of each musical note, for example, the onset,
sustain, and release, the estimation can be affected by
some frames that contain unexpected signals, such as the
remainder of previous musical notes or percussive sounds
without a harmonic structure. In contrast, our method uses
frames with a certain length to update the score position and
tempo of the music. Therefore, our method is capable of
estimating the score position robustly against the unexpected
signals. A similar approach is observed in [20] in that their
method uses a window of recent performance to estimate the
score position.
Our method is an extension of the particle filter-based
score following [21] with switching between the rhythm and
melody level. This paper presents an improvement in the
accuracy of the score following by introducing a proposal
distribution to make the most of information provided by
the musical score.
2.2. Problem Statement. The problem is specified as follows:
Input: incremental audio signal and the correspond-
ing musical score,
Output: predicted score position, or the tempo
Assumption: the tempo is provided by the musical
score with a margin of error.
The issues are (1) simultaneous estimation of the score
position and tempo and (2) the design of the estimation
confidence. Generally, the tempo given by the score and
the actual tempo in the human performance is different
partly due to the preference or interpretation of the song, or
partly due to the temporal fluctuation in the performance.
Therefore, some margin of error should be assumed in the
tempo information.
We assume that the musical score provides the approxi-
mate tempo and musical notes that consist of a pitch and a
relative length, for example, a quarter note. The purpose of
score following is to achieve a temporal alignment between
the audio signal and the musical score. The onset and pitch
of each musical note are important cues for the temporal
audio-to-score alignment. The onset of each note is more
important than the end of the notes because onsets are easier
to recognize, whereas the end of a note is sometimes vague,
for example, at the last part of a long tone. Our method
models the tempo provided by the musical score and the
alignment of the onsets in the audio and score as a proposal
distribution in a framework of a particle filter. The pitch
information is modeled as observation probabilities of the
particle filter.
We model this simultaneous estimation as a state-space
model and obtain the solution with a particle filter. The
advantages of the use of a particle filter are as follows:
(1) It enables an incremental and simultaneous estimation
of the score position and tempo. (2) Real-time processing
is possible because the algorithm is easily implemented with
multithreaded computing. Further potential advantages are
discussed in Section 5.1.
3. Score Following Using Particle Filter
3.1. Overview of Particle Filter. A particle filter is an algo-
rithm for incremental latent variable estimation given ob-
servable variables [12]. In our problem, the observable
variable is the audio signal and the latent variables are the
score position and tempo, or beat interval in our actual
model. The particle filter approximates the simultaneous
distribution of the score position and beat interval by the
density of particles with a set of state transition probabilities,
proposal probabilities, and observation probabilities. With
the incremental audio input, the particle filter updates the
distribution and estimates the score position and tempo. The
estimation confidence is determined from the probability
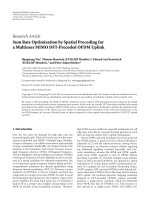
distribution. Figure 3 outlines our method. The particle
filter outputs three types of information: the predicted score
position, tempo, and estimation confidence. According to
the estimation confidence, the system reports either both the
score position and tempo or only the tempo.
Our switching mechanism is achieved by estimating the
beat interval independently of the score position. In our
method, each particle has the beat interval and score position
as a pair of hypotheses. First, the beat interval of each
particle is stochastically drawn using the normalized cross-
correlation of the observed audio signal and the prior tempo
from the score, without using the pitches and onsets written
in the score. Then, the score position is drawn using the beat
interval previously drawn and the pitches and onsets from
the score. Thus, when the estimation confidence is low, we
only rely on the beat interval for the rhythm level.
3.2. Preliminary Notations. Let X
f ,t
be the amplitude of
the input audio signal in the time frequency domain with
frequency f (Hz) and time t (sec.), and let k (beat, the
position of quarter notes) be the score position. In our
implementation, t and f are discretized by a short-time
Fourier transform with a sampling rate 44100 (Hz), a
window length of 2048 (pt), and a hop size of 441 (pt).
Therefore, t and f are discretized at a 0.01-second and 21.5-
Hz interval. The score is also divided into frames for the
discrete calculation such that the length of a quarter note
equals 12 frames to account for the resolution of sixteenth-
note and triplets. Musical notes m
k
= [m
1
k
···m
r
k
k
]
T
are
placed at k,andr
k
is the number of musical notes. Each
particle p
i
n
has score position, beat interval, and weight:
p
i
n
= (k
i
n
, b
i
n
, w
i
n
), and N is the number of particles, that is,
1
≤ i ≤ N. The unit for k
i
n
is a beat, and the unit for b
i
n
is
seconds per a beat. n denotes the filtering step.
At the nth step the following procedure is carried
out: (1) state transition using the proposal distribution,
(2) observation and audio-score matching, and (3) estima-
tion of the tempo and the score position, and resampling
of the particles. Figure 2 illustrates these steps. The size
of each particle represents its weight. After the resampling
4 EURASIP Journal on Advances in Signal Processing
1. Draw new samples from
the proposal distribution
(a)
2. Weight calculation
(audio-score matching)
(b)
3. Estimation of score posting
and tempo, then resampling
Score position: k
i
n
Beat interval (tempo): b
i
n
Estimation confidence: υ
n
+
(c)
Figure 2: Overview of the score following using particle filter.
Incremental
audio
Short time
fourier transform
Novelty
calculation
Chroma vector
extraction
Real-time process
Score
Off-line parsing
Harmonic
Gaussian mixture
Onset frame
Chroma vector
Score position + tempo
or
tempo only
•Score position
•Te m p o
Particle filter
Estimation
confidence
Figure 3: Two-level synchronization architecture.
step, the weights of all particles are set to be equal. Each
procedure is described in the following subsections. These
filtering procedures are carried out every ΔT (sec) and use an
L-second audio buffer X
t
= [X
f ,τ
]wheret−L<τ≤ t.Inour
configuration, ΔT
= 1 (sec) and L = 2.5 (sec). The particle
filter estimates the score position
k
n
and the beat interval
b
n
at time t = nΔT.
3.3. State Transition Model. The updated score position and
beat intervals of each particle are sampled from the following
proposal distribution:
k
i
n
b
i
n
T
∼ q
k, b | X
t
,
b
s
, o
k
,
q
k, b | X
t
,
b
s
, o
k
=
q
b | X
t
,
b
s
q
(
k | X
t
, o
k
, b
)
.
(1)
The beat interval b
i
n
is sampled from the proposal dis-
tribution q(b
| X
t
,
b
s
) that consists of the beat interval
confidence based on normalized cross-correlation and the
window function derived from the tempo
b
s
provided by the
musical score. The score position k
i
n
is then sampled from
the proposal distribution q(k
| X
t
, o
k
, b
i
n
) that uses the audio
spectrogram X
t
, the onsets in the score o
k
, and the sampled
beat interval b
i
n
.
3.3.1. Audio Preprocessing for the Estimat i on of the Beat
Interval and Onsets. We make use of the Euclidean distance
of Fourier coefficients in the complex domain [22]to
calculate a likely beat interval from the observed audio signal
X
t
and onset positions in the audio signal. This method
is chosen from many other onset detection methods as
introduced in [23] because this method emphasizes onsets
of many kinds of timbres, for example, wind instruments
like flute or string instruments like guitar, with moderate
computational cost. Ξ
f ,t
in the following (2) is the distance
between two adjacent Fourier coefficients in time frame. The
more the distance is, the more the onset is likely to exist.
Ξ
f ,t
=
X
2
f ,t
+ X
2
f ,t
−Δt
− 2X
f ,t
X
f ,t−Δt
cos
Δϕ
f ,t
1/2
,
(2)
Δϕ
f ,t
= ϕ
f ,t
− 2ϕ
f ,t−Δt
+ ϕ
f ,t−2Δt
,
(3)
where ϕ
f ,t
is an unwrapped phase at the same frequency bin
and time frame as X
f ,t
in the complex domain. Δt denotes the
EURASIP Journal on Advances in Signal Processing 5
interval time of the short-time Fourier transform. When the
signal is stable, Ξ
f ,t
≈ 0becauseX
f ,t
≈ X
f ,t−Δt
and Δϕ
f ,t
≈ 0.
3.3.2. Proposal Distribution for the Beat Interval. The beat
interval is drawn from the following proposal:
b
i
n
∼ q
b | X
t
,
b
s
,(4)
q
b | X
t
,
b
s
∝
R
b, Ξ
t
× ψ
b |
b
s
. (5)
We ob ta in
Ξ
t
= [Ξ
m,τ
], where 1 ≤ m ≤ 64 and t − L<
τ
≤ t, by reducing the dimension of the frequency bins into
64 dimensions by 64 equally placed mel-filter banks. A linear
scale frequency f
Hz
is converted into a mel-scale frequency
f
mel
as
f
mel
= 1127 log
1+
f
Hz
700
. (6)
64 triangular windows are constructed with an equal width
on the mel scale as
W
m
f
mel
=
⎧
⎪
⎪
⎪
⎪
⎪
⎪
⎪
⎪
⎨
⎪
⎪
⎪
⎪
⎪
⎪
⎪
⎪
⎩
f
mel
− f
mel
m
−1
f
mel
m
− f
mel
m
−1
, f
mel
m
−1
≤ f
mel
<f
mel
m
,
f
mel
m+1
− f
mel
f
mel
m+1
− f
mel
m
, f
mel
m
≤ f
mel
<f
mel
m+1
,
0, otherwise,
(7)
f
mel
m
=
m
64
f
mel
Nyq
,
(8)
where (8) indicates the edges of each triangular window
and f
mel
Nyq
denotes the mel-scale frequency of the Nyquist
frequency. The window function W
m
( f
mel
) when m = 64 has
onlythetoppartin(7)because f
mel
64+1
is not defined. Finally,
we obtain
Ξ
m,τ
by applying the window functions W
m
( f
mel
)
to Ξ
f ,τ
as follows:
Ξ
m,τ
=
W
m
f
mel
Ξ
f ,τ
df ,(9)
where f
mel
is a mel-frequency corresponding to the linear
frequency f . f is converted into f
mel
by (6).
With this dimension reduction, the normalized cross
correlationislessaffected by the difference between each
sound’s spectral envelope. Therefore, the interval of onsets
by any instrument and with any musical note is robustly
emphasized. The normalized cross correlation is defined as
R
b, Ξ
t
=
t
t
−L
64
m=1
Ξ
m,τ
Ξ
m,τ−b
dτ
t
t
−L
64
m
=1
Ξ
2
m,τ
dτ
t
t
−L
64
m
=1
Ξ
2
m,τ
−b
dτ
.
(10)
The window function is centered at
b
s
the tempo specified by
the musical score.
ψ
b |
b
s
=
⎧
⎪
⎪
⎨
⎪
⎪
⎩
1
60
b
−
60
b
s
<θ
0 otherwise.
, (11)
where θ is the width of the window in beats per minute
(bpm). A beat interval b (sec/beat) is converted into a tempo
value m (bpm
= beat/min) by the equation
m
=
60
b
.
(12)
Equation (11) limits the beat interval value of particles so as
not to miss the score position by a false tempo estimation.
3.3.3. Proposal Distribution for the Score Position. The score
position is sampled as
k
i
n
∼ q
k | X
t
, o
k
, b
i
n
, (13)
q
k | X
t
, o
k
, b
i
n
∝
⎧
⎪
⎪
⎪
⎪
⎪
⎪
⎨
⎪
⎪
⎪
⎪
⎪
⎪
⎩
t
t
−L
ξ
τ
o
k(τ)
dτ
o
k(τ)
= 1, ∃τ ∧ k ∈ K
,
1
o
k(τ)
= 0, for ∀τ ∧ k ∈ K
0, k
/
∈ K,
,
(14)
ξ
t
=
Ξ
f ,t
df. (15)
The score onset o
k
= 1 when the onset of any musical note
exists at k, otherwise o
k
= 0.
k(τ) is an aligned score position
at time τ using the particle’s beat interval b
i
n
:
k(τ) = k − (t −
τ)/b
i
n
, assuming the score position is k at time t.Equation
(15) assigns high weight on the score position where the
drastic change in the audio denoted by ξ
t
and onsets in the
score o
k(τ)
are well aligned. In case no onsets are found in
the neighborhood in the score, a new score position k
i
n
is
selected at random from the search area K. K is set such that
the center is at k
i
n
−1
+ ΔT/b
i
n
andthewidthis3σ
k
,whereσ
k
is
empirically set to 1.
3.3.4. State Transition Probability. State transition probabili-
tiesaredefinedasfollows:
p
b, k | b
i
n
−1
, k
i
n
−1
=
N
b | b
i
n
−1
, σ
2
b
×
N
k | k
i
n
−1
+
ΔT
b
i
n
, σ
2
k
,
(16)
where the variance for the beat interval transition σ
2
b
is
empirically set to 0.2. These probabilities are used for the
weight calculation in (17).
3.4. Observation Model and Weight Calculation. At time t,a
spectrogram X
t
= [X
f ,τ
](t − L<τ≤ t) is used for the
weight calculation. The weight of each particle at the nth step
w
i,n
,1≤ i ≤ N is calculated as
w
i,n
=
p
X
t
| b
i
n
, k
i
n
p
b, k | b
i
n
−1
k
i
n
−1
q
b | X
t
,
b
s
, (17)
6 EURASIP Journal on Advances in Signal Processing
where p(b, k
| b
i
n
−1
k
i
n
−1
)isdefinedin(16)andq(b | X
t
,
b
s
)
is defined in (5). The observation probability p(X
t
| b
i
n
, k
i
n
)
consists of three parts as
p
X
t
| b
i
n
, k
i
n
∝
w
ch
i,n
× w
sp
i,n
× w
t
i,n
. (18)
The two weights, the chroma vector weight w
ch
i,n
and spec-
trogram weight w
sp
i,n
, are measures of pitch information. The
weight w
t
i,n
is a measure of temporal information. We use
both the chroma vector similarity and the spectrogram
similarity to estimate the score position because they have
a complementary relationship. A chroma vector has 12
elements corresponding to the pitch name, C, C#, , B. This
is a convenient feature for audio-to-score matching because
the chroma vector is easily derived from both the audio signal
and the musical score. However, the elements of a chroma
vector become ambiguous when the pitch is low due to the
frequency resolution limit. The harmonic structure observed
in the spectrogram alleviates this problem because it makes
the pitch distinct in the higher frequency region.
3.4.1. Alignment of the Buffered Audio Signal with the Score.
To match the spectrogram X
f ,τ
,wheret − L<τ≤ t,
the audio sequence is aligned with the corresponding score
for each particle, as shown in Figure 4. Each frame of the
spectrogram at time τ is assigned to the score frame
k(τ)
i
using the estimated score position k
i
n
and the beat interval
(tempo) b
i
n
as
k
(
τ
)
i
= k
i
n
−
t − τ
b
i
n
.
(19)
3.4.2. Chroma Vector Matching. The sequence of chroma
vectors c
a
τ
= [c
a
τ, j
]
T
,1 ≤ j ≤ 12 is calculated from
the spectrum X
f ,τ
using band-pass filters B
j,o
( f )foreach
element [24]as
c
a
τ, j
=
Oct
hi
o=Oct
low
X
f ,τ
B
j,o
f
df ,
(20)
where B
j,o
( f ) is the band-pass filter that passes a signal
with log-scale frequency f
cent
j,o
of the chroma class j and the
octave o. That is,
f
cent
j,o
= 1200 × o + 100 ×
j − 1
.
(21)
A linear-scale frequency f
Hz
is converted into the log-scale
frequency f
cent
as
f
cent
= 1200log
2
f
Hz
440 × 2
3/12−5
.
(22)
Each band-pass filter B
j,o
( f )isdefinedas
B
j,o
f
Hz
=
1
2
⎛
⎝
1 − cos
2π
f
cent
−
f
cent
j,o
− 100
200
⎞
⎠
,
(23)
where f
cent
j,o
− 100 ≤ f
cent
≤ f
cent
j,o
+ 100. The range of octaves
are set Oct
low
= 3andOct
hi
= 6. The value of each element
in the score chroma vector c
s
k
i
τ
is 1 when the score has a
corresponding note between the octaves Oct
low
and Oct
hi
,
and 0 otherwise. The range of the chroma vector is between
C note in octave 3 and B note in octave 6. Their fundamental
frequencies are 131 (Hz) and 1970 (Hz), respectively.
The chroma weight w
ch
i,n
is calculated as
w
ch
i,n
=
1
L
t
t
−L
c
a
τ
· c
s
k(τ)
i
.dτ.
(24)
Both vectors bfc
a
τ
and c
s
k(τ)
i
are normalized before applying
them to (24).
3.4.3. Harmonic Structure Matching. The spectrogram
weight w
sp
i,n
is derived from the Kullback-Leibler divergence
with regard to the shape of spectrum between the audio and
the score.
w
sp
i,n
=
1
L
t
t
−L
⎛
⎝
1
2
+
1
2
tanh
D
KL
i,τ
− D
KL
ν
⎞
⎠
, (25)
D
KL
i,τ
=
f
max
0
X
f ,τ
log
X
f ,τ
X
f ,
k(τ)
i
,
(26)
where D
KL
i,τ
in (26) is the dissimilarity between the audio and
score spectrograms. Before calculating (26), the spectrum is
normalized such that
f
max
0
X
f ,τ
df =
f
max
0
X
f ,
k(τ)
i
df = 1. The
range of the frequency for calculating the Kullback-Leibler
divergence is limited under f
max
(Hz) because most of the
energy in the audio signal is located in low frequency region.
We set the parameter as f
max
= 6000 (Hz). The positive value
D
KL
i
is mapped to the weight w
sp
i,n
by (25) where the range of
w
sp
i,n
is between 0 and 1. Here, the hyperbolic function is used
with the threshold distance
D
KL
= 4.2 and the tilt ν = 0.8
which are set empirically.
3.4.4. Preprocessing of the Musical Score. For the calculation
of w
sp
i,n
, the spectrum
X
f ,k
is generated from the musical score
in advance of particle filtering by the harmonic Gaussian
mixture model (GMM), the first term in
X
f ,k
= C
harm
r
k
r=1
G
g=1
h
g
N
f ; gF
m
r
k
, σ
2
+ C
floor
.
(27)
In (27), g is the harmonic index, G is the number of
harmonics, and h(g) is the height of each harmonic. F(m
r
k
)
is the fundamental frequency of note m
r
k
and the variance
σ
2
.Letm be a note number used in the standard MIDI
(Musical Instrument Digital Interface), F(m)isderivedas
F(m)
= 440 × 2
(m−69)/12
. The parameters are empirically set
as G
= 10, h(g) = 0.2
g
, σ
2
= 0.8. To avoid zero divides in
EURASIP Journal on Advances in Signal Processing 7
X
f ,τ
t − L time (s)
X
f ,τ
k
i
n
Score position (beat)
X
f ,
k(τ)
t
Foreachparticlep
i
n
Alignment using
score position k
i
n
,
beat interval b
i
n
Figure 4: Weight calculation for pitch information.
(26), the constant factor C
harm
is set and the floor constant
C
floor
is added to the score spectrogram such that
C
harm
r
k
r=1
G
g=1
h
g
N
f ; gF
m
r
k
, σ
2
df = 0.9,
C
floor
= 0.1.
(28)
3.4.5. Beat Interval Matching. The weight w
t
i,n
is the measure
of the beat interval and obtained from the normalized cross
correlation of the spectrogram through a shift by b
i
n
:
w
t
i,n
= R
b
i
n
, Ξ
t
, (29)
where R(b
i
n
, Ξ
t
)isdefinedin(10).
3.5. Estimation of Score Position and Beat Interval. After
calculating the weight of all particles the score position
k
n
and the beat interval, equivalent to the tempo,
b
n
are
estimated by averaging the values of particles that have more
weight. We use the top 20% high-weight particles for this
estimation.
k
n
=
i∈P
20%
w
i
n
k
i
n
W
,
(30)
b
n
=
i∈P
20%
w
i
n
b
i
n
W
, (31)
W
=
i∈P
20%
w
i
n
,
(32)
where P
20%
is the set of indicis of the top 20% high-weight
particles. For example, when the number of particle N
=
1000, the size of P
20%
is 200.
Given the current score position
k
n
and beat interval
b
n
,
the score position ΔT ahead in time
k
pred
n
is predicted by the
following equation:
k
pred
n
=
k
n
+
ΔT
b
n
.
(33)
3.6. Resampling. After calculating the score position and beat
interval with (31)and(32), the particles are resampled. In
this procedure, particles with a large weight are likely to be
selected many times, whereas those with a small weight are
discarded because their score position is unreliable. A particle
p is drawn independently N times from the distribution:
P
p = p
i
n
=
w
i
n
N
i
=1
w
i
n
.
(34)
After resampled, the weights of all particles are set to be
equal.
3.7. Initial Probability Distribution. The initial particles at
n
= 0 are set as follows: (1) draw N samples of the beat
interval b
i
0
value from a uniform distribution ranging from
b
s
− 60/θ to
b
s
+60/θ where θ is the window width in (11).
(2) Set the score position of each particle k
i
n
to 0.
3.8. Estimation Confidence of Score Following. The weight
of local peaks of the probability distribution of the score
position and the beat interval is used as the estimation
confidence. Let P
2%
be the set of indicis of the top 2% high-
weight particles in number, for example,
|P
2%
|=20 when
N
= 1000. Particles P
2%
are regarded as the local peak of
the probability distribution. The estimation confidence υ
n
is
defined as
υ
n
=
i∈P
2%
w
i
n
1≤i≤N
w
i
n
.
(35)
When υ
n
is high, it means that high-weight particles are
tracking a reliable hypothesis; when υ
n
is low, particles fail
to find out a remarkable hypethosis.
Based on this idea, switching the melody level and
rhythm level is carried out as follows.
(1) First, the system is on the melody level, therefore it
reports both the score position and tempo.
(2) If υ
n
decreases such that (37) is satisfied, the system
switches to the rhythm level and stops reporting the
score position.
(3) If υ
n
increases again and (37) is satisfied, the system
switches back to the melody level and resumes
reporting the estimated score position
υ
n
− υ
n−1
< −γ
dec
,
(36)
υ
n
− υ
n−1
>γ
inc
.
(37)
The parameters are empirically set as: γ
dec
= 0.08 and γ
inc
=
0.07, respectively.
4. Experimental Evaluation
This section presents the prediction error of the score follow-
ing in various conditions: (1) comparisons with Antescofo
[25], (2) the effect of two-level synchronization, (3) the effect
of the number of particles N, and (4) the effect of the width
of window function θ in (11). Then, the computational cost
of our algorithm is discussed in Section 4.3.
8 EURASIP Journal on Advances in Signal Processing
Table 1: Parameter settings.
Denotation Value
Filtering interval
ΔT 1(sec)
Audio buffer length
L 2.5 (sec)
Score position variance
σ
2
k
1 (beat
2
)
Beat duration variance
σ
2
b
0.2 (sec
2
/beat
2
)
Upper limit in harmonic
structure matching
f
max
6000 (Hz)
Lower octave for chroma
vector extraction
Oct
low
3(N/A)
Higher octave for chroma
vector extraction
Oct
hi
6(N/A)
Table 2: Songs used for the experiments.
Song ID File name Tempo (bpm) Instrumentsmark
1
1 RM-J001 150 Pf
2 RM-J003 98 Pf
3 RM-J004 145 Pf
4 RM-J005 113 Pf
5 RM-J006 163 Gt
6 RM-J007 78 Gt
7 RM-J010 110 Gt
8 RM-J011 185 Vib & Pf
9 RM-J013 88 Vib & Pf
10 RM-J015 118 Pf & Bs
11 RM-J016 198 Pf, Bs & Dr
12 RM-J021 200 Pf, Bs, Tp & Dr
13 RM-J023 84 Pf, Bs, Sax & Dr
14 RM-J033 70 Pf, Bs, Fl & Dr
15 RM-J037 214 Pf, Bs, Vo & Dr
16 RM-J038 125 Pf, Bs, Gt, Tp & Dr etc.
17 RM-J046 152 Pf, Bs, Gt, Kb & Dr etc.
18 RM-J047 122 Kb, Bs, Gt & Dr
19 RM-J048 113 Pf, Bs, Gt, Kb & Dr etc.
20 RM-J050 157 Kb, Bs, Sax & Dr
1
abbreviations: Pf: Piano, Gt: Guitar, Vib: Vibraphone, Bs: Bass, Dr: Drums,
Tp: Trumpet, Sax: Saxophone, Fl: Flute, Vo: Vocal, Kb: Keyboard.
4.1. Experimental Setup. Our system was implemented in
C++ with Intel C++ Compiler on Linux with an Intel Corei7
processor. We used 20 jazz songs from the RWC Music
Database [26]listedinTa bl e 2. These are recordings of the
actual humans’ performance. Note that the musical scores
are manually transcribed note for note. However, only the
pitch and length of musical notes are the input for our
method. We use the jazz songs as experimental materials
because a variety of musical instruments are included in the
songs as shown in Tabl e 2. The problem that the scores for
jazz music do not always specify all musical notes is discussed
in Section 5.1. The average length of these songs is around 3
minutes. The sampling rate was 44100 (Hz) and the Fourier
transform was executed with a 2048 (pt) window length and
441 (pt) window shift. The parameter settings are listed in
Ta bl e 1.
−20
−10
Mean prediction error (s)
0
20
10
1 2 3 4 5 6 7 8 9 10 11 12 13 14 15 16 17 18 19 20
Song ID
Our method
Antescofo
Figure 5: Mean prediction errors in our method and Antescofo: the
number of particles N is 1500, the width of the tempo window θ is
15 (bpm).
0.1
Fundamental
Frequencies
Harmonics
0.2
0.3
0.4
3000 40002000
Frequency (Hz)
1000
Harmonic GMM
Audio spectrum
Remainder energy of the
previous notes
Figure 6: Comparison between harmonic GMM generated by the
score and the actual audio spectrum.
4.2. Score Following Error. At ΔT intervals, our system
predicts the score position ΔT (sec) ahead as
k
pred
n
in (33)
when the current time is t.Lets(k) be the ground truth
time at beat k in the music. s(k)isdefinedforpositive
continuous k by linear interpolation of musical event times.
The prediction error e
pred
(t)isdefinedas
e
pred
(
t
)
= t + ΔT − s
k
pred
n
.
(38)
Positive e
pred
(t) means the estimated score position is behind
of the true position by e
pred
(t) (sec).
4.2.1. Our Method versus Hybrid HMM-Based Score Following
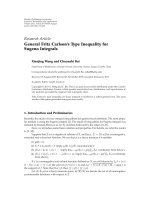
Method. Figure 5 shows the errors in the predicted score
positions for 20 songs when the number of particles N is
1500 and the width of the tempo window θ corresponds
to 15 (bpm). The comparison between our method in blue
plots and Antescofo [25]inredplots.Themeanvaluesof
our method is calculated by averaging all prediction errors
both on the rhythm level and on the melody level. This is
because Figure 5 is intended to compare the particle filter-
based score following algorithm with HMM-based one. Our
method reports less mean error values for 16 out of 20
songs than the existing score following algorithm Antescofo.
EURASIP Journal on Advances in Signal Processing 9
The absolute mean errors are reduced by 69% compared with
Antescofo on average over the all songs.
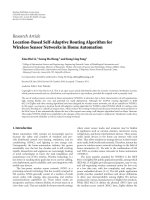
There can be observed striking errors in songs ID 6–14.
Main reasons are twofold. (1) In songs ID 6–10, a guitar
or multiple instruments are used. Among their polyphonic
sounds, some musical notes sound so vague or persist so
long that the audio spectrogram becomes different from
the GMM-based spectrogram generated by (27). Figure 6
illustrates an example that the previously performed musical
notes affect the audio-to-score matching process. Although
the red peaks, the score GMM peaks, matches some peaks of
the audio spectrum in the blue line, the remainder energy
from previous notes reduces the KL-divergence between
these two spectra. (2) On top of the first reason, temporal
fluctuation is observed in songs ID 11–14. These two factors
lead both score following algorithms to fail to track a musical
audio signal.
In most cases, our method outperforms the existing
hybrid HMM-based score following Antescofo. These results
imply that the estimation should be carried out on the audio
buffer that has a certain length rather than just a frame
when the music includes multiple instruments and complex
polyphonic sounds. A HMM can fail to match the score with
the audio because it observes just one frame when it updates
the estimate of the score position. Our approach is to make
use of the audio buffer to robustly match the score with the
audio signal or estimate the tempo of the music.
There is a tradeoff about the length of the audio
buffer L or filtering interval ΔT:Longerbuffer length L
makes the estimation of score position robust against such
mismatches between the audio and score as Figure 6.Longer
filtering interval ΔT allows more computational time for
each filtering step. However, since our method assumes the
tempo is stable in buffered L,largerL could affect the
matching between the audio and score due to a varying
tempo. Also, larger ΔT causes a slow response to the tempo
change. One way to reduce the trade-off is to allow for the
tempo transition in the state transition model (16) and the
alignment of the audio buffer with the score for the weight
calculation (19).
4.2.2. The Effect of Two-Level Switching. Ta bl e 3 shows the
rate of the duration where the absolute prediction error
|e
pred
(t)| is limited. The leftmost column represents the ID
of the song. The next three columns indicate the duration
rate where
|e
pred
(t)| < 0.5 (sec). The middle three columns
indicate the duration rate where
|e
pred
(t)| < 1 (sec). The
most right-hand three columns show the duration rate where
|e
pred
(t)| < 1 (sec) calculated from the outputs of Antescofo.
For example, when the length of the song is 100 (sec) and
the prediction error is less than 1 (sec) for 50 (sec) in total,
the duration rate where
|e
pred
(t)| < 1 is 0.5. Note that the
values in
|e
pred
(t)| < 1 are always more than the values
in
|e
pred
(t)| < 0.5 in the same configurations. The column
“
∼30” means that the rate is calculated from the first 30 (sec)
of the song. The column “
∼60” uses the first 60 (sec), and
“all” uses the full length of the song. For example, when the
prediction error is less than 1 (sec) for 27 seconds in the first
−10
−5
Mean prediction error (s)
0
5
10
1 2 3 4 5 6 7 8 9 10 11 12 13 14 15 16 17 18 19 20
Song ID
N
= 1500
N
= 3000
N
= 6000
Figure 7: Number of particles N versus prediction errors.
30 seconds, the rate in |e
pred
(t)| < 1, “∼30” column becomes
0.9. Bold values in the middle three columns indicate that
our method outperforms Antescofo on the given condition.
Ta bl e 3 also shows that the duration of low error
decreases as the incremental estimation proceeds. This is
because the error in the incremental alignment is cumulative.
The end of the part of a song is apt to be false aligned.
Ta bl e 4 shows the rate of the duration where the absolute
prediction error
|e
pred
(t)| < 1 (sec) on the melody level, or
where the tempo estimation error is less than 5 (bpm). That
is,
|BPM − 60/
b
n
| < 5, where BPM is the true tempo of the
song in question. In each cell of three columns at the center,
the ratio of duration that holds
|e
pred
(t)| < 1 on the melody
level is written in the left and the ratio of duration that holds
|BPM−60/
b
n
| < 5 on the rhythm level is written in the right.
The rightmost column shows the duration rate of the melody
level throughout the music, which corresponds to the “all”
column. “N/A” on the rhythm level indicates that there is no
rhythm level output. Bold values indicate the rate is over that
of both levels in Ta bl e 3 on the same condition. On the other
hand, underlined values are under the rate of both levels.
The switching mechanism has a tendency to filter out
erroneous estimation of the score position especially when
the alignment error is cumulative because more bold values
are seen in the “all” column. However, there still remains
some low rates such as song IDs 4, 8–10, 16. In these cases
our score follower loses the part and accumulates the error
dramatically, and therefore, the switching strategy becomes
less helpful.
4.2.3. Prediction Error versus the Number of Particles. Figure 7
shows the mean prediction errors for various numbers of
particles N on both levels. For each song, the mean and
standard deviation of signed prediction errors e
pred
(t)are
plotted with three configurations of N. In this experiment,
N is set to N
= 1500, 3000, 6000.
This result implies our method is hardly improved by
simply using a larger number of particles. If the state
transition model and observation model match the audio
signal, the error should converge to 0 with the increased
number of particles. This is probably because the erroneous
estimation is caused by the mismatch between the audio and
10 EURASIP Journal on Advances in Signal Processing
Table 3: Score following error ratio w/o level switching.
The range of the evaluation (sec) Antescofo results
∼30 ∼60 all ∼30 ∼60 all ∼30 ∼60 all
song ID
|e
pred
(t)| < 0.5(sec) |e
pred
(t)| < 1(sec) |e
pred
(t)| < 1(sec)
1 0.87 0.52 0.33 1.00 0.97 0.70 0.06 0.04 0.02
2 0.40 0.33 0.16 0.80 0.82 0.39 0.63 0.73 0.38
3 0.83 0.65 0.57 1.00 1.00 0.92 0.04 0.02 0.01
4 0.10 0.05 0.02 0.20 0.10 0.04 0.18 0.08 0.03
5 1.00 0.95 0.62 1.00 1.00 0.79 0.41 0.22 0.09
6 0.40 0.20 0.07 0.63 0.32 0.12 0.69 0.47 0.16
7 0.57 0.38 0.16 0.90 0.63 0.26 0.24 0.12 0.04
8 0.43 0.22 0.05 1.00 0.52 0.13 0.25 0.17 0.05
9 0.40 0.22 0.09 0.70 0.43 0.19 0.53 0.24 0.06
10 0.57 0.28 0.07 0.87 0.45 0.11 0.19 0.11 0.02
11 0.07 0.15 0.18 0.43 0.72 0.43 0.75 0.68 0.42
12 0.33 0.47 0.11 0.73 0.85 0.19 0.70 0.23 0.10
13 0.57 0.42 0.32 1.00 0.75 0.64 0.11 0.04 0.01
14 0.23 0.32 0.22 0.47 0.60 0.40 0.61 0.37 0.10
15 0.07 0.03 0.02 0.37 0.18 0.08 0.05 0.02 0.01
16 0.80 0.53 0.30 1.00 0.88 0.56 0.57 0.35 0.16
17 0.30 0.15 0.18 0.47 0.25 0.28 0.36 0.17 0.10
18 0.93 0.88 0.31 1.00 1.00 0.42 0.16 0.09 0.03
19 0.27 0.52 0.38 1.00 1.00 0.86 0.55 0.30 0.10
20 0.73 0.55 0.18 1.00 0.78 0.25 0.03 0.01 0.02
−10
−5
Mean prediction error (s)
0
5
10
1 2 3 4 5 6 7 8 9 10 11 12 13 14 15 16 17 18 19 20
Song ID
θ
= 5
θ
= 15
θ
= 30
Figure 8: Window width θ versus prediction errors.
score as shown in Figure 6. Considering that the estimation
results have not been saturated after increasing the particles,
the performance can converge by adding more particles such
as thousands or even millions of particles.
4.2.4. Prediction Error versus the Width of the Tempo Window.
Figure 8 shows the mean and standard deviation of signed
prediction errors for various widths of tempo window θ.In
this experiment, θ issetto5,15,and30(bpm).
Intuitively, the narrower the width is, the closer to zero
the error value should be because the chance of choosing a
wrong tempo will be reduced.
However, the prediction errors are sometimes unstable,
especially for those IDs under 10 which has no drums,
because the width is too narrow to account for the tem-
poral fluctuations in the actual performance. The musical
performance tends to temporally fluctuate without drums
or percussions. On the other hand, the prediction errors
for IDs 11–20 are less when the width is narrower. This
is because the tempo in the audio signal is stable thanks
to the drummer. In particular, stable and periodic drum
onsets in IDs 15–20 make the peaks in the normalized cross
correlation in (10)sufficiently striking to choose a correct
beat interval value from the proposal distribution in (5). This
result confirms that our method reports less error with stable
drum sounds even though drum sounds tend to cover the
harmonic structure of pitched sounds.
4.3. Computational Cost in Our Algorithm. The procedure
that requires the computational resource most in our method
is the observation process. In particular, the harmonic
structure matching consumes the processor time as described
in (25)and(26). The complexity of this procedure conforms
to O(NLf
max
), where N is the number of particles, L is
the length of the spectrogram, and f
max
is the range of the
frequency considered in the matching.
EURASIP Journal on Advances in Signal Processing 11
Table 4: Score following error ratio w/ level switching. Left: melody
level accuracy,
|e
pred
(t)| < 1 (sec). Right: rhythm level accuracy,
|BPM − 60/
b
n
| < 5(bpm).
The range of the evaluation (sec) Melody level
song ID
∼30 ∼60 all ratio
1 1.00 N/A 0.97 N/A 0.70 N/A 1.00
2 0.80 N/A 0.82 N/A 0.39 1.00 0.99
3 1.00 N/A 1.00 N/A 0.93 1.00 0.99
4 0.20 N/A 0.10 N/A 0.04 N/A 1.00
5 1.00 N/A 1.00 N/A 0.93 0.70 0.71
6 0.72 1.00 0.72 1.00 0.68 0.95 0.19
7 0.96 0.50 0.68 0.70 0.35 0.40 0.55
8 1.00 0.44 1.00 0.24 0.04
0.14 0.56
90.50
0.69 0.50 0.89 0.12 0.92 0.60
10 1.00 1.00 0.43
1.00 0.15 0.71 0.62
11 0.43 N/A 0.72 N/A 0.59 0.25 0.51
12 0.73 N/A 0.85 N/A 0.25 0.71 0.76
13 1.00 1.00 0.78 1.00 0.72 1.00 0.55
14 0.45
0.38 0.48 0.70 0.20 0.84 0.44
15 1.00 0.22 0.27 0.20 0.05
0.25 0.43
16 1.00 0.42 0.77
0.29 0.48 0.31 0.81
17 0.60 N/A 0.33 N/A 0.34 N/A 1.00
18 1.00 N/A 1.00 N/A 0.42 N/A 1.00
19 1.00 N/A 1.00 1.00 1.00 1.00 0.53
20 1.00 0.71 0.84 0.29 0.36 0.38 0.54
For real-time processing, the whole particle filtering
processmustbedoneinΔT (sec) because the filtering
process takes place every ΔT (sec). The observation process,
namely, the weight calculation for each particle, can be
parallelized because the weight of each particle is indepen-
dently evaluated. Therefore, we can reduce the complexity to
O(NLf
max
/Q
MT
), where Q
MT
denotes the number of threads
for the observation process.
Figure 9 shows the real-time factors in various configu-
rations of the particle number N and the number of threads
Q
MT
. These curves confirm that the computational time
grows in proportion to N and reduces in inverse proportion
to Q
MT
.
5. Discussion and Future Work
Experimental results show that the score following perfor-
mance varies with the music played. Needless to say, a music
robot hears a mixture of musical audio signals and its own
singing voice or instrumental performance. Some musical
robots [7, 11, 27] use self-generating sound cancellation [28]
from a mixture of sounds. Our score following should be
tested with such cancellation because the performance of
score following may deteriorate if such cancellation is used.
The design of the two-level synchronization is intended
to improve existing methods reported in the literature.
There is a trade-off between a tempo tracking and a score
following: the tempo tracking result is accurate when drum
0
2
Real-time factor
4
6
10
8
1500 3000 6000
The number of particles
Q
MT
= 1
Q
MT
= 2
Q
MT
= 4
Q
MT
= 8
Figure 9: Real-time factor curve.
or percussive sounds are included in the audio signal, while
the score following result is sometimes deteriorated by
these percussive sounds because those sounds conceal the
harmonic structure of pitched instruments.
To make a musical expression on the rhythm level, the
robot might require not only the beat interval but also the
beat time. To estimate both the beat time and beat interval
for the rhythm level interaction, a state space model for the
beat tracking will be an effective solution [29]. An extension
of our model to estimate the beat interval, score position, and
beat time can be enumerated as one of the future works. The
switching whether the beat time or the score position along
with the beat interval can be determined by the estimation
confidence.
5.1. Future Works. The error in the estimation of the score
position accumulates as the audio signal is incrementally
input. We present the two-level switching mechanism to cope
with this situation. Another solution is error recovery by
landmark search. When we listen to the music and lose the
part being played, we often pay attention to find a landmark
in the song, for example, the beginning of the chorus part.
After finding the landmark, we can start singing or playing
our instrument again. The framework of a particle filter
enables us to realize the idea of this landmark search-based
error recovery by modifying the proposal distribution. When
a landmark is likely to be found in the input audio signal, the
score follower can jump to the corresponding score position
by adding some particle at the point. The issues in this
landmark search are landmark extraction from the musical
score and the incremental detection of the landmarks from
the audio signal.
There remains a limitation in our framework: Our
current framework assumes that the input audio signal is
performed in the same way as written in the score. Some
musical scores, for example, jazz scores, provide only abstract
notations such as chord progressions. Tracking the audio
with these abstract notations is one of further challenges.
There are other aspects of the advantages in the use of
the particle filter for a score following. Our score following
using the particle filter should also be able to improve an
instrument-playing robot. In fact, a theremin player robot
moves its arms to determine the pitch and the volume
12 EURASIP Journal on Advances in Signal Processing
of theremin. Therefore, the prediction mechanism enables
the robot to play the instrument in synchronization with the
human performance. In addition, a multimodal ensemble
system using a camera [30]canbenaturallyaggregated
with our particle-filter-based score following system. Several
music robots use a camera to acquire visual cues from human
musicians [8, 31]. This is because the flexible framework
of the particle filter facilitates aggregation of multimodal
information sources [32].
We are currently developing ensemble robots with a
human flutist. The human flutist leads the ensemble, and
a singer and thereminist robot follows [31]. The two-level
synchronization approach benefits this ensemble as follows:
when the score position is uncertain, the robot starts scatting
the beats, or faces downward and sings in a low voice; when
the robot is aware of the part of the song, it faces up and
presents a loud and confident voice. This posture-based voice
control is attained through the voice manipulation system
[33].
Another application of score following is automatic page
turning of the musical score [15, 34]. In particular, automatic
page turning systems running on portable tablet computers
like the iPad, developed by Apple Computer Inc., would be
convenient for daily practice of musical instruments where
both hands are required to play, such as piano or guitar.
Further reduction of computational cost is important to run
the score following algorithm on portable tablet computers
that have limited memory and a less powerful processor.
6. Conclusion
Our goal is to develop a coplayer music robot that presents
musical expressions in accordance with a human’s musical
performance. The synchronization function is essential for
a coplayer robot. This paper presented a score following
system based on a particle filter to attain the two-level
synchronization for interactive coplayer music robots. Our
method make use of the onset information and the prior
knowledge about the tempo provided by the musical score
by modeling proposal distributions for the particle filter.
Furthermore, to cope with an erroneous estimation, two-
level synchronization is performed at the rhythm level and
the melody level. The reliability to switch between the two
levels of score following is calculated from the density of
particles and is used to switch between levels.
Experiments were carried out using 20 jazz songs
performed by human musicians. The experimental results
demonstrated that our method outperforms the existing
score following system called Antescofo in 16 songs out
of 20. The error in the prediction of the score position
is reduced by 69% on average compared with Antescofo.
The results also revealed that the switching mechanism
alleviates the error in the estimation of the score position,
although the mechanism becomes less effective when the
error is accumulated and the follower loses the part being
played.
One possible solution to the cumulative error in the
incremental alignment of the audio with the score is
a landmark search. Our particle filter framework would
naturally take this into account as a proposal distribution
of landmark detection. The future work will also include
development of interactive ensemble robots. In particular,
multimodal synchronization function using both the audio
and visual cues would enrich the human-robot musical
ensemble dramatically.
Acknowledgments
This research was supported in part by Kyoto University
Global COE, in part by JSPS Grant-in-Aid for Scientific
Research (S) 19100003, and in part by a Grant-in-Aid for
Scientific Research on Innovative Areas (no. 22118502) from
the MEXT, Japan. The authors would like to thank Louis-
Kenzo Cahier and Angelica Lim for beneficial comments
on earlier drafts, and the members of Okuno and Ogata
Laboratory for their discussion and valuable suggestions.
References
[1] Y. Kusuda, “Toyota’s violin-playing robot,” Industrial Robot,
vol. 35, no. 6, pp. 504–506, 2008.
[2] A. Alford, S. Northrup, K. Kawamura, K W. Chan, and
J. Barile, “A music playing robot,” in Proceedings of the
International Conference on Field and Service Robotics (FSR
’99), pp. 29–31, 1999.
[3] K. Shibuya, S. Matsuda, and A. Takahara, “Toward developing
a violin playing robot—bowing by anthropomorphic robot
arm and sound analysis,” in Proceedings of the 16th IEEE
International Conference on Robot and Human Interactive
Communication (RO-MAN ’07), pp. 763–768, August 2007.
[4] S. Kotosaka and S. Shaal, “Synchronized robot drumming by
neural oscillator,” Journal of Robotics Society of Japan, vol. 19,
no. 1, pp. 116–123, 2001.
[5] H. Kozima and M. P. Michalowski, “Rhythmic synchrony
for attractive human-robot interaction,” in Proceedings of the
Entertainment Computing, 2007.
[6] K. Yoshii, K. Nakadai, T. Torii et al., “A biped robot that
keeps steps in time with musical beats while listening to music
with its own ears,” in Proceedings of the IEEE/RSJ International
Conference on Intelligent Robots and Systems, pp. 1743–1750,
2007.
[7] K. Murata, K. Nakadai, K. Yoshii et al., “A robot uses its
own microphone to synchronize its steps to musical beats
while scatting and singing,” in Proceedings of the IEEE/RSJ
International Conference on Intelligent Robots and Systems,pp.
2459–2464, 2008.
[8] Y. Pan, M. G. Kim, and K. Suzuki, “A robot musician inter-
acting with a human partner through initiative exchange,” in
Proceedings of the Conference on New Interfaces for Musical
Expression (NIME ’10), pp. 166–169, 2010.
[9] G. Weinberg and S. Driscoll, “Toward robotic musicianship,”
Computer M usic Journal, vol. 30, no. 4, pp. 28–45, 2006.
[10] R. B. Dannenberg and C. Raphael, “Music score alignment and
computer accompaniment,” Communications of the ACM, vol.
49, no. 8, pp. 39–43, 2006.
[11] T. Otsuka, K. Nakadai, T. Takahashi, K. Komatani, T. Ogata,
and H. G. Okuno, “Incremental polyphonic audio to score
alignment using beat tracking for singer robots,” in Proceedings
EURASIP Journal on Advances in Signal Processing 13
of the IEEE/RSJ International Conference on Intelligent Robot-
sand Systems, pp. 2289–2296, 2009.
[12] M. S. Arulampalam, S. Maskell, N. Gordon, and T. Clapp, “A
tutorial on particle filters for online nonlinear/non-Gaussian
Bayesian tracking,” IEEE Transactions on Signal Processing, vol.
50, no. 2, pp. 174–188, 2002.
[13] H. Kenmochi and H. Ohshita, “Vocaloid–commercial singing
synthesizer based on sample concatenation,” in Proceedings of
the Interspeech Conference, pp. 4010–4011, 2007.
[14] S. Dixon, “An on-line time warping algorithm for tracking
musical performances,” in Proceedings of the International Joint
Conference on Artificial Intelligence, pp. 1727–1728, 2005.
[15] A. Arzt, G. Widmer, and S. Dixon, “Automatic page turning
for musicians via real-time machine listening,” in Proceedings
of the European Conference on Artificial Intelligence, pp. 241–
245, 2008.
[16] N. Orio, S. Lemouton, and D. Schwarz, “Score following:
state of the art and new developments,” in Proceedings o f
the International Conference on New Interfaces for Musical
Expression, pp. 36–41, 2003.
[17] A. Cont, D. Schwarz, and N. Schnell, “Training IRCAM’s score
follower,” in Proceedings of the AAAI Fall Symposium on Style
and Meaningin Art, Language and Music, 2004.
[18] A. Cont, “ANTESCOFO: anticipatory synchronization and
control of interactive parameters in computer music,” in
Proceedings of the International Computer Music Conference,
2008.
[19] C. Raphael, “Aligning music audio with symbolic scores using
a hybrid graphical model,” Machine Learning,vol.65,no.2-3,
pp. 389–409, 2006.
[20] O. Izmirli, R. Seward, and N. Zahler, “Melodic pattern anchor-
ing for score following using score analysis,” in Proceedings
of the International Computer Music Conference, pp. 411–414,
2003.
[21] T. Otsuka, K. Nakadai, T. Takahashi, K. Komatani, T. Ogata,
andH.G.Okuno,“Designandimplementationoftwo-level
synchronization for interactive music robot,” in Proceedings of
the24th AAAI Conference on Artificial Intelligence, pp. 1238–
1244, 2010.
[22] J. P. Bello, C. Duxbury, M. Davies, and M. Sandler, “On the use
of phase and energy for musical onset detection in the complex
domain,” IEEE Signal Processing Letters, vol. 11, no. 6, pp. 553–
556, 2004.
[23] J. P. Bello, L. Daudet, S. Abdallah, C. Duxbury, M. Davies, and
M. B. Sandler, “A tutorial on onset detection in music signals,”
IEEE Transactions on Speech and Audio Processing, vol. 13, no.
5, pp. 1035–1046, 2005.
[24] M. Goto, “A chorus section detection method for musical
audio signals and its application to a music listening station,”
IEEE Transactions on Audio, Speech and Language Processing,
vol. 14, no. 5, pp. 1783–1794, 2006.
[25] A. Cont, “A coupled duration-focused architecture for real-
time music-to-score alignment,” IEEE Transactions on Pattern
Analysis and Machine Intelligence, vol. 32, no. 6, pp. 974–987,
2010.
[26] M. Goto, H. Hashiguchi, T. Nishimura, and R. Oka, “RWC
music database: music genre database and musical instrument
sound database,” in Proceedings of the International Conference
on Music Information Retrieval, pp. 229–230, 2003.
[27] T. Otsuka, K. Nakadai, T. Takahashi, K. Komatani, T. Ogata,
and H. G. Okuno, “Music-ensemble robot that is capable
of playing the theremin while listening to the accompanied
music,” in Proceedings of the International Conference on
Industrial, Engineering and Other Applications of Applied
Intelligent Systems (IEA/AIE ’10), vol. 6096 of Lecture Notes in
Artificial Intelligence, pp. 102–112, 2010.
[28] R. Takeda, K. Nakadai, K. Komatani, T. Ogata, and H. G.
Okuno, “Barge-in-able robot audition based on ICA and
missing feature theory under semi-blind situation,” in Pro-
ceedings of the IEEE/RSJ International Conference on Intelligent
Robotsand Systems, pp. 1718–1723, 2008.
[29] A. T. Cemgil and B. Kappen, “Monte Carlo methods for
tempo tracking and rhythm quantization,” Journal of Artificial
Intelligence Research, vol. 18, pp. 45–81, 2003.
[30] D. Overholt, J. Thompson, L. Putnam et al., “A multimodal
system for gesture recognition in interactive music perfor-
mance,” Computer Music Journal, vol. 33, no. 4, pp. 69–82,
2009.
[31] A. Lim, T. Mizumoto, L. Cahier et al., “Robot musical
accompaniment: integrating audio and visual cues for real-
time synchronization with a human flutist,” in Proceedings of
the IEEE/RSJ International Conference on Intelligent Robots and
Systems, 2010.
[32] K. Nickel, T. Gehrig, R. Stiefelhagen, and J. McDonough,
“A joint particle filter for audio-visual speaker tracking,” in
Proceedings of the International Conference on Multimodal
Interfaces, pp. 61–68, 2005.
[33] T. Otsuka, K. Nakadai, T. Takahashi, K. Komatani, T. Ogata,
and H. G. Okuno, “Voice-awareness control for a humanoid
robot consistent with its body posture and movements,”
PALADYN Journal of Behavioral Robotics, vol. 1, no. 1, pp. 80–
88, 2010.
[34] R. Dannenberg, M. Sanchez, A. Joseph, P. Capell, R. Joseph,
and R. Saul, “A computer-based multi-media tutor for begin-
ning piano students,” Interface Journal of New Music Research,
vol. 19, no. 2-3, pp. 155–173, 1993.