Solar energy 2012 Part 10 docx
Bạn đang xem bản rút gọn của tài liệu. Xem và tải ngay bản đầy đủ của tài liệu tại đây (3.49 MB, 30 trang )
Organic Solar Cells Performances Improvement Induced by Interface Buffer Layers
263
J. Huang, J. Yu, H. Lin, Y. Jiang (2009). Detailed analysis of bathocuproine layer for organic
solar cells based on copper phthalocyanine and C60, J. Appl. Phys., 105, 073105.
H.C. Im, D.C. Choo, T.W. Kim, J.H. Kim, J.H. Seo, Y.K. Seo, Y.K. Kim (2007). Highly efficient
organic light-emitting diodes fabricated utilizing nickel-oxide buffer layers
between the anodes and the hole transport layers, Thin Solid Films, 515, 5099-5101.
H. Ishii, N. Hayashi, E. Ito, Y. Washizu, L. Sugi, Y. Kimura, M. Niwano, Y. Ouchi, K. Seki
(2004). Kelvin probe study of band bending at organic semiconductor/metal
interfaces: examination of Fermi level alignment, Phys. Stat. Sol (a) 201 1075_1094.
C. Jain, M. Willander, V. Kumar, (2007). Conducting Organic Materials and Devices, High-
Detectivity Polymer Photodetectors with Spectral Response from 300 nm to 1450
nm Semiconductors and Semimetals, 81, 1-188.
X-Y. Jiang, Z L. Zhang, J. Cao, M.A. Khan, K ul-Haq, W Q. Zhu (2007). White OLED with
high stability and low driving voltage based on a novel buffer layer MoOx, J. Phys.
D: Appl. Phys., 40, 5553-5557.
B. Johnev, M. Vogel, K. Fostoropulos, B. Mertesacker, M. Rusu, M C. Lux-Steiner, A.
Weidinger (2005). Monolayer passivation of the transparent electrode in organic
solar cells, Thins Solid Films, 488, 270-273.
B. Kang, L.W. Tan, S.R.P. Silva (2009). Ultraviolet-illuminated fluoropolymer indium–tin-
oxide buffer layers for improved power conversion in organic photovoltaics,
Organic Electronics 10 1178-1181.
K.S. Kang, H.K. Lim, K.J. Han, J. Kim (2008). Durability of PEDOT : PSS-pentacene Schottky
diode, J. Phys. D: Appl. Phys., 41, 012003.
N. Karst, J.C. Bernède (2006). On the improvement of the open circuit voltage of plastic solar
cells by the presence of a thin aluminium oxide layer at the interface organic
aluminium. Physica Status Solidi (a), 203 R70-R72.
M.A. Katkova, V.A. Ilichev, A.N. Konev, M.A. Batenkin, L.L. Pestova, A.G. Vitukhnovsky,
Bochkarev M.N. (2008). Modification of anode surface in organic light-emitting
diodes by chalcogenes, Appl. Surf. Sciences 254 2216-2219.
S. Kato (2005). Designing Interfaces That Function to Facilitate Charge Injection in Organic
Light-Emitting Diodes, J. Am. Chem. Soc., 127 11538-11539.
J.S. Kim, R.H. Friend, F. Cacialli (1999). Surface energy and polarity of treated indium–tin–
oxide anodes for polymer light-emitting diodes studied by contact-angle
measurements, J. Appl. Phys. 86, 2774.
J.Y. Kim, K. Lee, N.E. Coates, D. Moses, T.Q. Nguyen, M. Dante, A.J. Heeger, (2007) Efficient
Tandem Polymer Solar Cells Fabricated by All-Solution Processing, Science, 317, 222
J.Y. Kim, S.H. Kim, H H. Lee, K. Lee, W. Lee, W. Ma, X. Gong, A.J. Heeger, (2006). New
Architecture for High-Efficiency Polymer Photovoltaic Cells Using Solution-Based
Titanium Oxide as an Optical Spacer, Adv. Mater., 18 572-576.
N. Kim, W.J. Potscavage Jr., B. Domercq, B. Kippelen, S. Graham, (2009). A hybrid
encapsulation method for organic electronics, Appl. Phys. Lett., 94, 163308.
S S Kim, S I. Na, J. Jo, D Y. Kim, Y C. Nah, (2008). Plasmon enhanced perfomance of
organic solar cells using electrodeposited Ag nanoparticles, Appl. Phys. Lett., 93,
073307.
S.Y. Kim, K. H. Lee, B.D. Chin, J W. Yu (2009). Network structure organic photovoltaic
devices prepared by electrochemical copolymerization, Solar Energy Materials &
Solar Cells 93, 129-135.
Solar Energy
264
Y. Kinoshita, T. Hasobe, H. Murata (2007). Control of open-circuit voltage in organic
photovoltaic cells by inserting an ultrathin metal-phthalocyanine layer, Appl. Phys.
Lett., 91, 083518.
Th. Kugler, W. R. Salaneck, H. Rast, A. B. Holmes (1999). Polymer band alignment at the
interface with indium tin oxide: consequences for light emitting devices, Chem.
Phys. Lett., 310, 391-386.
B. Kouskoussa, M. Morsli. K. Benchouk, G. Louarn, L. Cattin, A. Khelil, J.C. Bernede, (2009).
On the improvement of the anode/organic material interface in organic solar cells
by the presence of an ultra-thin gold layer. Physica Status Solidi (a) 206, 311-315.
Th. Kugler, A. Johansson, I. Dalsegg, U. Gelius, W.R. Salanek (1997). Electronic and chemical
structure of conjugated polymer surfaces and interfaces: applications in polymer-
based light-emitting devices, Synthetic Metals, 91, 143-146.
Th. Kugler, W. R. Salaneck, H. Rast, A. B. Holmes (1999). Polymer band alignment at the
interface with indium tin oxide: consequences for light emitting devices, Chem.
Phys. Lett. 310, 391-396.
A. Latef, J. C. Bernède (1991). Study of the thin film interface Aluminium –Tellurium, Phys.
Stat. Sol. (a), 124, 243.
C.S. Lee, J.X. Tang, Y.C. Zhou, S.T. Lee, Interface dipole et metal-organic interfaces:
contribution of metal induced interface states (2009). Appl. Phys. Lett. 94 113304.
C.N. Li, C.Y. Kwong, A.B. Djurisic, P.T. Lai, P.C. Chui, W.K. Chan, S.Y. Liu (2005). Improved
performance of OLEDs with ITO surface treatments, Thins Solid Films 477 57-62.
Y. Li, Y. Cao, D. Wang, G. Yu, A. S. Heeger (1999). Electrochemical properties of luminescent
polymers and polymer light-emitting electrochemical cells, Synthetic Metals, 99, 243-
248.
S. G. Liu, G. Sui, R. A. Cormier, R. M. Leblanc, B. A. Gregg (2002). Self-Organizing Liquid
Crystal Perylene Diimide Thin Films: Spectroscopy, Crystallinity, and Molecular
Orientation, J. Phys. Chem. B, 106, 1307-1315.
Lord Kelvin (1898). Philos. Mag., 46, 82.
H-T. Lu, M. Yokoyama (2004). Plasma preparation on indium-tin-oxide anode surface for
organic light emitting diodes, Journ. Crys. Growth, 260, 186-190.
D. Lüthi, , M. Le Floch, B. Bereiter, T. Blunier, J M. Barnola, U. Siegenthaler, D. Raynaud, J.
Jouzel, H. Fischer, K. Kawamura, and T.F. Stocker (2008). High-resolution Carbon
dioxide concentration record 650,000–800,000 years before present, Nature. 453 379-
382.
T. Matsushima, Y. Kinoshita, H. Murata (2007). Formation of Ohmic hole injection by
inserting an ultrathin layer of molybdenum trioxide between indium tin oxide and
organic hole-transporting layers, Appl. Phys. Lett., 91, 253504.
A.G. Milnes, D.L. Feucht 1972. Heterojunctions and metal semi-conductor junctions.
Academic Press Editor, New York,
A.J. Morfa,. K.L. Rowlen, T.H. Reilly III, M.J. Romero, J. van de Lagemaat, (2008). Plasmon-
enhanced solar energy conversion in organic bulk heterojunction photovoltaics,
Appl. Phys. Lett., 92, 013504.
M. Niggemann, M. Riede, A. Gombert, K. Leo (2008). Light trapping in organic solar cells,
Phys. Stat. Sol. (a,) 205, 2862-2874.
T. Nishi, K. Kanai, Y. Ouchi, M.R. Willis, K. Seki (2005). Evidence for the atmospheric
p-type
doping of titanyl phthalocyanine thin film by oxygen observed as the change of
interfacial electronic structure, Chem. Phys. Lett., 414, 479-482.
Organic Solar Cells Performances Improvement Induced by Interface Buffer Layers
265
F. Nüesch, L.J. Rothberg, E.W. Forsythe, Q. Toan Le, Y. Gao, (1999). A photoelectron
spectroscopy study on the indium tin oxide treatment by acids and bases, Appl.
Phys. Lett., 74, 880.
F. Padinger, R.S. Rittenberger, N.S. Sariciftci (2003). Effects of Postproduction Treatment on
Plastic Solar Cells, Adv. Funct. Mater., 13, 85-88.
S. Y. Park, Y. H. Noh, H. H. Lee (2006). Introduction of an interlayer between metal and
semiconductor for organic thin-film transistors, Appl. Phys. Lett., 88, 113503.
P. Peumans, V. Bulovic, S.R. Forrest (2000). Efficient photon harvesting at high optical
intensities in ultrathin organic double-heterostructure photovoltaic diodes, Appl.
Phys. Lett. 76, 2650.
P. Peumans, S.R. Forrest (2001). Very-high-efficiency double-heterostructure copper
phthalocyanine/C
60
photovoltaic cells, Appl. Phys. Lett. 79, 126-128
M. Pfeiffer, K. Leo, N. Karl (1996). Fermi level determination in organic thin films by the
Kelvin probe method, J. Appl. Phys. 80, 6880,
K.L. Purvis, G. Lu, J. Schwartz, S.L. Bernasek (2000). Surface Characterization and
Modification of Indium Tin Oxide in Ultrahigh Vacuum, J. Am. Chem. Soc., 122,
1808-1809.
C. Qiu, Z. Xie, H. Chen, M. Wong, H.S. Kwok (2003). Comparative study of metal or oxide
capped indium–tin oxide anodes for organic light-emitting diodes, J. Appl. Phys., 93,
3253.
B.P. Rand, D.P. Burk, S.R. Forrest (2007). Offset energies at organic semiconductor
heterojunctions and their influence on the open-circuit voltage of thin-film solar
cells, Phys. Rev. B 75, 115327,
B.P. Rand, J. Li, J. Xue, R.J. Holmes, M.E. Thompson, S.R. Forrest (2005). Organic double-
heterostructure photovoltaic cells employing thick tris(acetylacto)ruthenium(III)
exciton-blocking layers, Adv. Mater., 17, 2714-2718.
C.A. Rozzi, F. Mangi, F. Parmigiani (2003). Ab initio Fermi surface and conduction-band
calculations in oxygen-reduced MoO
3,
Phys. Rev., B 68, 075106.
N.S. Sariciftci, D. Braun, C. Zhang, V. I. Srdanov, A. S. Heeger, G. Stucky, F. Wuld (1993).
Semiconducting polymer-buckminsterfullerene heterojunctions: Diodes,
photodiodes, and photovoltaic cells, Appl. Phys. Lett., 62, 585.
N. S. Sariciftci, L. Smilowitz, A. J. Heeger, and F. Wudl, (1992). Photoinduced Electron
Transfer from a Conducting Polymer to Buckminsterfullerene, Science, 258, 5087,
1474–1476.
J.C. Scott, J.H. Kaufman, P.J. Brock, R. DiPietro, J. Salem, J.A. Goitia (1996). Degradation and
failure of MEH-PPV light-emitting diodes, J. Appl. Phys., 79, 2745.
K. Seki, E. Ito, H. Ishii (1997). Energy level alignment at organic/metal interfaces studied by
UV photoemission, Synthetic Metals, 91, 137-142,
S.E. Shaheen, C.J. Brabec, N.S. Sariciftci, F. Padinger, T. Fromherz, J.C. Hummelen, (2001).
2.5% efficient organic plastic solar cells, Appl. Phys. Lett., 78, 841-843.
A. Sharma, P. J. Hotchkiss, S.R. Marder, B. Kippelen, (2009). Tailoring the work function of
indium tin oxide electrodes in electrophosphorescent organic light-emitting diodes,
J. Appl. Phys., 105, 084507.
S.W. Shi, D.G. Ma, J.B. Peng (2007). Effect of NaCl buffer layer on the performance of
organic light-emitting devices (OLEDs), Eur. Phys. J. Appl. Phys., 40, 141-144.
V.P. Singh, B. Parthasarathy, R.S. Singh, A Aguilera, J. Antony, M. Payne (2006).
Characterization of high-photovoltage CuPc-based solar cell structures Solar Energy
Materials and Solar Cells, 90, 798-812.
Solar Energy
266
V.P. Singh, R.S. Singh, B. Parthasarathy, A Aguilera, J. Antony, M. Payne (2005). Copper-
phthalocyanine-based organic solar cells with high open-circuit voltage, Appl. Phys.
Lett., 86, 082106,
Q.L. Song, F.Y. Li, H. Yang, H.R. Wu, X.Z. Wang, W. Zhou, J.M. Zhao, X.M. Ding, C.H.
Huang, X.Y. Hou (2005). Small-molecule organic solar cells with improved stability,
Chem. Phys. Lett., 416, 42.
P. Sullivan, T.S. Jones, A.J. Ferguson (2007). Structural templating as a route to improved
photovoltaic performance in copper phthalocyanine/fullerene (C
60
)
heterojunctions, Appl. Phys. Lett., 91, 233114.
S.M. Sze 1981“Physics of Semiconductor Devices” 2
nd
Edition, John Wiley Editor, New York.
Y. Tanaka, K. Kanai, Y. Ouchi, K. Seki (2009). Role of interfacial dipole layer for energy-level
alignment at organic/metal interfaces, Organic Electronics, 10, 990-993.
C.W. Tang (1986). Two-layer organic photovoltaic cell, Appl. Phys. Lett., 48, 183.
C. Tengstedt, W. Osikowioz, W.R. Salaneck, I.D. Parker, C H. Hsu, M. Fahlman (2006).
Fermi-level pinning at conjugated polymer interfaces, Appl. Phys. Lett., 88, 053502.
B.C Thompson., J.M.J. Fréchet (2008). Polymer-Fullerene Composite Solar Cells, Angew.
Chem. Int. Ed., 47, 58-77.
J. Van de Lagemaat, T.M. Barnes, G. Rumbles, S. E. Shaheen, T.J. Coutts, C. Weeks, I.
Levitsky, J. Peltola, P. Glatkowski (2006). Organic solar cells with carbon nanotubes
replacing In
2
O
3
:Sn as the transparent electrode, Appl. Phys. Lett., 88, 233503.
J. Xue, B.P. Rand, S. Uchida, S.R. Forrest, (2005). Mixed donor-acceptor molecular
heterojunctions for photovoltaic applications. II. Device performance, J. Appl. Phys.,
98, 124903.
I. Yoo, M. Lee, C. Lee, D W. Kim, I.S. Moon, D H. Hwang (2005). The effect of a buffer layer
on the photovoltaic properties of solar cells with P3OT:fullerene composites,
Synthetic Metals, 153, 97-100.
H. You, Y. Dai, Z. Zhang, D. Ma (2007). Improved performances of organic light-emitting
diodes with metal oxide as anode buffer, J. Appl. Phys., 101, 26105.
X-H. Zhang, B. Domercq, B. Kippelen (2007). High-performance and electrically stable C60
organic field-effect transistors, Appl. Phys. Lett. 91 092114.
D. Zhang, Y. Li, Guohui Zhang, Y. Gao, L. Duan, L. Wang, Y. Qiu Lithium cobalt oxide as
electron injection material for high performance organic light-emitting diodes
(2008). Appl. Phys. Lett., 92, 073301.
Z.Y. Zhong, Y.D. Jiang (2006). Surface treatments of indium-tin oxide substrates for polymer
electroluminescent devices, Phys. Stat. Sol., (a), 203, 3882-3892.
Y. Zhou, Y. Wang, W. Wu, H. Wang, l. Han, W. Tian, H. Bässler (2007). Spectrally dependent
photocurrent generation in aggregated MEH-PPV:PPDI donor–acceptor blends, Sol.
Energy Mat. Solar cells, 91, 1842-1848.
B. Zimmermann, M. Glatthaar, M. Niggermann, M. Riede, A. Hinsch (2005).
Electroabsorption studies of organic bulk-heterojunction solar cells, Thin Solid
Films, 493, 170-174.
W.A. Zisman. (1932). A new method of measuring contact potential differences in metals,
Rev. Sci. Instrum. 3, 367-370.
12
New Trends in Designing Parabolic trough
Solar Concentrators and Heat Storage Concrete
Systems in Solar Power Plants
Valentina A. Salomoni
1
, Carmelo E. Majorana
1
, Giuseppe M. Giannuzzi
2
,
Adio Miliozzi
2
and Daniele Nicolini
2
1
University of Padua
2
ENEA – Agency for New Technologies, Energy and Environment
Italy
1. Introduction
Energy availability has always been an essential component of human civilization and the
energetic consumption is directly linked to the produced wealth. In many depressed
countries the level of solar radiation is considerably high and it could be the primary energy
source under conditions that low cost, simple-to-be-used technologies are employed. Then,
it is responsibility of the most advanced countries to develop new equipments to allow this
progress for taking place. A large part of the energetic forecast, based on economic
projection for the next decades, ensure us that fossil fuel supplies will be largely enough to
cover the demand. The predicted and consistent increase in the energetic demand will be
more and more covered by a larger use of fossil fuels, without great technology innovations.
A series of worrying consequences are involved in the above scenario: important climatic
changes are linked to strong CO
2
emissions; sustainable development is hindered by some
problems linked to certainty of oil and natural gas supply; problems of global poverty are
not solved but amplified by the unavoidable increase in fossil fuel prices caused by an
increase in demand. These negative aspects can be avoided only if a really innovative and
more acceptable technology will be available in the next decades at a suitable level to
impress a substantial effect on the society. Solar energy is the ideal candidate to break this
vicious circle between economic progress and consequent greenhouse effect. The low
penetration on the market shown today by the existent renewable technologies, solar energy
included, is explained by well-known reasons: the still high costs of the produced energy
and the “discontinuity” of both solar and wind energies. These limitations must be removed
in reasonable short times, with the support of innovative technologies, in view of such an
urgent scenario.
On this purpose ENEA, on the basis of the Italian law n. 388/2000, has started an R&D
program addressed to the development of CSP (Concentrated Solar Power) systems able to
take advantage of solar energy as heat source at high temperature. One of the most relevant
objectives of this research program (Rubbia, 2001) is the study of CSP systems operating in
the field of medium temperatures (about 550°C), directed towards the development of a
new and low-cost technology to concentrate the direct radiation and efficiently convert solar
Solar Energy
268
energy into high temperature heat; another aspect is focused on the production of hydrogen
by means of thermo-chemical processes at temperatures above 800°C.
As well as cost reductions, the current innovative ENEA conception aims to introduce a set
of innovations, concerning: i) The parabolic-trough solar collector: an innovative design to
reduce production costs, installation and maintenance and to improve thermal efficiency is
defined in collaboration with some Italian industries; ii) The heat transfer fluid: the synthetic
hydrocarbon oil, which is flammable, expensive and unusable beyond 400°C, is substituted
by a mixture of molten salts (sodium and potassium nitrate), widely used in the industrial
field and chemically stable up to 600°C; iii) The thermal storage (TES): it allows for the storage
of solar energy, which is then used when energy is not directly available from the sun (night
and covered sky) (Pilkington, 2000). After some years of R&D activities, ENEA has built an
experimental facility (defined within the Italian context as PCS, “Prova Collettori Solari”) at
the Research Centre of Casaccia in Rome (ENEA, 2003), which incorporates the main
proposed innovative elements (Figure 1). The next step is to test these innovations at full
scale by means of a demonstration plant, as envisioned by the “Archimede” ENEA/ENEL
Project in Sicily. Such a project is designed to upgrade the ENEL thermo-electrical
combined-cycle power plant by about 5 MW, using solar thermal energy from concentrating
parabolic-trough collectors.
Fig. 1. PCS tool solar collectors at ENEA Centre (Casaccia, Rome).
Particularly, the Chapter will focus on points i) and iii) above:
- loads, actions, and more generally, the whole design procedure for steel components of
parabolic-trough solar concentrators will be considered in agreement with the Limit
State method, as well as a new approach will be critically and carefully proposed to use
this method in designing and testing “special structures” such as the one considered
here;
- concrete tanks durability under prolonged thermal loads and temperature variations
will be estimated by means of an upgraded F.E. coupled model for heat and mass
transport (plus mechanical balance). The presence of a surrounding soil volume will be
additionally accounted for to evaluate environmental risk scenarios.
Specific technological innovations will be considered, such as:
New Trends in Designing Parabolic trough Solar Concentrators
and Heat Storage Concrete Systems in Solar Power Plants
269
- higher structural safety related to the reduced settlements coming from the chosen
shape of the tank (a below-grade cone shape storage);
- employment of HPC containment structures and foundations characterized by lower
costs with respect to stainless steel structures;
- substitution of highly expensive corrugated steel liners with plane liners taking
advantage of the geometric compensation of thermal dilations due to the conical shape
of the tank;
- possibility of employing freezing passive systems for the concrete basement made of
HPC, able to sustain temperature levels higher than those for OPC;
- fewer problems when the tank is located on low-strength soils.
2. Description of parabolic-trough solar concentrators
The parabolic-trough solar concentrators are one of the basic elements of a concentrating
solar power plant. The functional thermodynamic process of a solar plant is shown in
(Herrmann et al., 2004). The main elements of the plant are: the solar field, the storage
system, the steam generator and the auxiliary systems for starting and controlling the plant.
The solar field is the heart of the plant; the solar radiation replaces the fuel in conventional
plants and the solar concentrators absorb and concentrate it. The field is made up of several
collector elements composed in series to create the single collector line. The collected
thermal energy is determined by the total number of collector elements which are
characterized by a reflecting parabolic section (the concentrator), collecting and
continuously concentrating the direct solar radiation by means of a sun-tracking control
system to a linear receiver located on the focus of the parabolas. A circulating fluid flows
inside a linear receiver to transport the absorbed heat.
Fig. 2. Functional thermodynamic process flow of a solar plant.
A solar parabolic-trough collector line is divided into two parts from a central pylon
supporting the hydraulic drive system (Antonaia et al., 2001). Each part is composed by an
equal number of identical collector elements, connected mechanically in series. Each
collector element consists of a support structure for the reflecting surfaces, the parabolic
mirrors, the receiver line and the pylons connecting the whole system to a solid foundation
by means of anchor bolts. The configuration of a solar parabolic-trough collector is that of a
cylindrical-parabolic reflecting surface with a receiver tube co-axial with the focus-line, as a
first approximation. The reflecting surface must be able to rotate around an axis parallel to
the receiver tube, to constantly ensure that the incident radiation and the plane containing
the parabolic sections’ axes are parallel. In this way the incident solar light on the reflecting
Solar Energy
270
surfaces is concentrated and continuously intercepted by the receiver tube in any assumed
position of the sun during its apparent motion. The parabolic-trough collector is then
constituted by a rotating “mobile part” to orientate the concentrator reflecting surfaces and
by a “fixed part” guaranteeing support and connection to the ground of the mobile part.
The solar collector performances, in terms both of mechanical strength and optical precision,
are related to one side to the structural stiffness and on the other to the applied load level.
The main load for a solar collector is that coming from the wind action on the structure and
it is applied as a pressure distributed on the collector surfaces.
From a structural point of view, it must be emphasized that the parabolic-trough
concentrator is composed mainly by three systems: the concentration, the torque and the
support system. Other fundamental elements, not treated in this document for sake of brevity,
are the foundation and the motion systems. In Table 1 the subsystems and basic elements
characterizing the structure of the concentrator developed by ENEA are shown. All
elements should be considered when designing a parabolic-trough concentrator and verified
for “operational” and “survival” load conditions. Corrosion risks and safe-life (about 25-30
years) must be taken into account as well.
The following basic operational conditions, listed in Table 2, can be considered valid for a
parabolic-trough concentrator; they define different performance levels under wind
conditions. “Design conditions” can be fixed consequently.
Finally, on the basis of what described above, the main requirements when designing a
parabolic-trough concentrator can be summarized as follows:
• Safety: the collector structures exposed to static loads must guarantee adequate safety
levels to ensure public protection, according (in our case) to the Italian Law 1086/71.
This is translated into a suitable strength level or more generally in safety factors for the
construction within the Limit State Analysis.
• Optical performance: the structure must guarantee a suitable stiffness in order to obtain,
under operational conditions, limited displacements and rotations, the optical
performance level being related to the capacity of the mirrors concentrating the
reflected radiation on the receiver tube.
• Mechanical functionality: the structural adaptation to loads must not produce interference
among mobile and fixed parts of the structure under certain load conditions.
• Low cost: the structure has to respond to typical economic requirements for solar plant
fields (e.g. known from experiences abroad): unlimited plant costs lead to non-
competitive sources employments. This can lead to tolerate fixed damage levels of the
structure under extreme conditions (i.e. collapse of not-bearing elements, local yield,
etc.), but still respecting the above mentioned requirements of public protection.
3. Codes of practice and rules
The parabolic-trough concentrator, on the basis of its structural shape and use and further
considering available National and European recommendations, is classifiable as a “special
structure” (Majorana & Salomoni, 2004 (a); Giannuzzi et al., 2007): it is not a machine or a
standard construction. The definition “special” comes directly from a subdivision in classes
and categories according to the criterion of the “Rates for professional services” as it results
from the Italian law n. 143/1949; this law places “Metallic structures of special type, notable
constructive importance and requiring ad-hoc calculations” into class IX e subclass b.
New Trends in Designing Parabolic trough Solar Concentrators
and Heat Storage Concrete Systems in Solar Power Plants
271
Systems Subsystems Elements
Reflecting surfaces Mirrors, Mirror–structure connection
Concentration
system
Mirrors support
structures
Girders, Girder–framed structure
connection
Framed structure, Framed structure–torque
tube connection
Torque
system
Torque tube, plate, hinge
Torque tube, Torque tube–plate connection,
Plate, Plate–hinge connection, Hinge
Intermediate / final
pylons
Cylindrical pin joint, Pin joint–support
connection, Framed structure, Plate, Anchor
bolts
Module supports
Central pylon
Cylindrical pin joint, Pin joint–support
connection, Framed structure, Engine
support structure, Plate, Anchor bolts
Foundations Piles and/or plinths, Anchor bolts
Other
Drive system Hydraulic drive/pistons, etc.
Table 1. Example of structural elements of a parabolic-trough concentrator.
Level Condition
W1
Response under normal operational conditions with light winds. The
concentration efficiency must be as high as possible under wind velocity less
than a value v
1
characterizing this level.
W2
Response under normal operational conditions with medium winds. The
concentration efficiency is gradually diminishing under wind velocity
comprised between v
1
and v
2
. The wind velocity v
2
characterizes this level.
W3
Transition between normal operating conditions and survival positions
under medium-to-strong or strong winds. The survival must be ensured in
any position under medium–strong winds. The drive must be able to take
the collector to safe positions for any wind velocity comprised between v
2
and v
3
. The wind velocity v
3
characterizes this level.
W4
Survival under strong winds in “rest” positions. The survival wind velocity
must be adapted to the requests of the site according to recommendations.
The wind velocity v
4
characterizes this level.
Table 2. Operational conditions.
From the functional analysis of the structure its special typology clearly emerges, according
to its design, technical arrangements and innovation. When the parabolas are stopped in an
assigned angular configuration, the nature of the structure can be determined: steel
structure of mixed type founded on simple or reinforced concrete placed on a foundation
Solar Energy
272
soil having characteristics closely correlated to a chosen site, also under the seismic profile.
From the structural point of view, the dynamic characteristics play a major role, with the
response deeply influenced not only by the drive-induced oscillations, but also by dominant
winds or seismic actions. Taking into account the above considerations, it is then possible to
state that the examined structure is “special”.
Moreover, such a structure requires appropriate calculations since some parts are mobile, even
if with a slow rotation; at the same time the structure is subjected to wind actions, especially
relevant due to the parabolas dimension. The simultaneous thermal and seismic actions, acting
as self-equilibrated stresses in an externally hyperstatic structure, are equally important.
Special steel made structures are e.g. cranes: they are designed using specific
recommendations; in our case the reference to existing codes of practice is necessary, even if
with the aim of adapting them and/or proposing new ones for CSP systems. Hence it clearly
appears that such structures, built within the European countries, are currently designed and
verified out of standards; the only two Italian recommendations acting as guidelines are:
• Law 5/11/71, n.1086, Norms to discipline the structures made by plain and pre-stressed
reinforced concrete and by metallic materials.
• Law 2/2/74, n.64, Procedures devoted to structures with special prescriptions for
seismic zones.
Moreover, several “technical norms” are related to the above ones, in form of “Minister (of
Public Works) Decrees”, or “explanation documents”, or other documents giving rise to a
certain amount of duplications and repetitions; however, a progressive compulsory use of
Eurocodes is being introduced to push Italian engineers more properly into the European
environment. In this case, Eurocodes 3 and 8 are of interest for the structural design of solar
concentrators, also in view of their seismic performance. It is important to make an
advanced choice regarding the body of recommendations to be followed in the design and
checking phases and to proceed further with them, avoiding the common mistake of some
designers to take parts from one norm (i.e. Italian) and mix it with parts of another norm
(i.e. Eurocodes). The main problems in the so-called harmonization of rules within Europe
reside in finding safety coefficients to be applied for considering special conditions (e.g.
environmental) in each country, as well as those for materials. This is a source of difficulty
in the creation of a unique body of rules valid in the whole European territory. The last
product of recommendations recently emitted by the actual Ministry of Public Works in
Italy is a 438 pages document (plus two Annexes) named "Testo Unico per le Costruzioni". It is
compulsory in the Italian territory from July 1
st
2009. The aim of this decree was also to
unify a series of previous decrees into a single document. As already stated, it has been here
chosen to follow the current Italian laws, and Eurocodes for comparison, in view of the
possible application of solar concentrators at Priolo Gargallo (near Syracuse, Sicily). In
principle, with a few changes, it is possible to apply the technology in other sites, as well as
outside Italy or even Europe: slight changes in dimensioning could occur.
Hence, to take into account the specificity of the investigated structures, it was necessary to
combine together operational states (OSs) (Table 2), characteristic positions and load actions,
reaching to the interpretation of Table 3 within the context of a limit state (LS) analysis
(Salomoni et al., 2006). Additionally, within the serviceability limit states (SLSs) the conditions
of maximum rotation (W
1
operational state) and maximum deformation (W
2
) must be
verified; W
3
requires the collector operability within an elastic ultimate limit state (ULS), i.e.
absence of permanent deformations. Differently, such deformations can be present within
W
4
but without leading to a structural collapse.
New Trends in Designing Parabolic trough Solar Concentrators
and Heat Storage Concrete Systems in Solar Power Plants
273
Table 3. Example of combinations among characteristic positions, operational states and
load actions to study CSPs in the context of LS analyses.
4. Materials
The solar concentrator supporting structure is made of hot-laminated steel. Hence,
according to Eurocode 3 and UNI EN 10025, steels in form of bars, plates or tubes must be of
the types shown in Table 4.
However recommendations allow for using different types of steel once the ensured safety
level remains the same, justifying this through appropriate theoretical and experimental
documentations. Under uniaxial stress states, their design strengths can be deduced from
tables; in case of multiaxial states, suitable combinations are additionally given. In our
calculations, the following material characteristics are considered: elastic modulus E =
210000 N/mm
2
, Poisson’s coefficient ν = 0.3, thermal expansion coefficient α = 12•10
-6
°C
-1
and density ρ = 7850 kg/m
3
. If welding is used for connecting elements, the behaviour of
steel types S235 and S275 is distinguished from that of S360.
thickness t [mm]
t ≤ 40 40 < t ≤ 100
Nominal
steel type
f
y
[N/mm
2
] f
u
[N/mm
2
] f
y
[N/mm
2
] f
u
[N/mm
2
]
Fe360 / S235 (EN 10025) 235 360 215 340
Fe430 / S275 (EN 10025) 275 430 255 410
Fe510 / S360 (EN 10025) 360 510 335 490
Table 4. Strengths and failure stresses (nominal values) for structural steels.
5. Loads
Given the design loads, subdivided in permanent and variable ones, wind conditions are here
examined more in detail, whose effects on the structure are connected to the parabolas
aerodynamics in their different characteristic positions (see below). The role of the snow has
been additionally considered.
Solar Energy
274
5.1 Variable loads
5.1.1 Wind action on the parabolas
The mean value of wind velocity, as a function of the distance from soil V
m
(z), is expressed
by
() () ()
mrtref
Vz CzCzV
=
⋅⋅ (1)
where V
ref
is the reference wind velocity, C
r
(z) the roughness coefficient and C
t
(z) the
topographic coefficient.
The reference wind velocity V
ref
is defined as the mean wind speed over a time period of 10
min, at 10 m height on a second category soil, with a 50 years “return period”. The reference
wind speeds for each Italian area is given by recommendations; e.g. a site located near the
sea in Southern Italy has a reference wind speed of about 28 m/s. An important wind speed
value is the peak wind speed which can be seen as the superposition of the mean wind
speed plus its variation due to turbulence conditions on site. It can be evaluated as
() () ()
peak m
VzGzVz
=
⋅
(2)
where G(z) is the “peak factor”, that is,
0
7
1
()ln(/ )
t
G
Cz z z
=+
⋅
(3)
Usually G is comprised between 1.5 and 1.6. It should be emphasized that the check under
failure loads must be necessarily performed on the basis of the peak velocity, since this gives
an overload capable of making the material reach its strength limit, even if its duration is
short. As far as the operational performance is concerned, it is more feasible to use the mean
velocity. The roughness coefficient C
r
(z) takes into account the variability of the mean wind
speed and the site characteristics by considering the height over the soil and the soil
roughness as functions of the wind direction. The roughness coefficient at height z is
defined by the logarithmic profile
0
() ln(/ )
rr
Cz k zz
=
(4)
where k
r
is the soil factor and z
0
is the roughness length, both related to the soil exposure
category on its turn linked to the geographic location of the investigated area within Italy
and on the basis of the soil roughness. In case of an open country, k
r
is 0.19 and z
0
is 0.05 m.
The topographic coefficient C
t
(z) takes into account the increment in the mean wind speed
on escarpments and isolated hills; in our case C
t
= 1 can be taken.
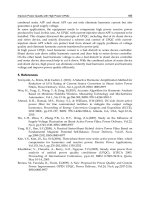
The solar concentrator shape is taken into account by means of aerodynamic coefficients.
The different aerodynamic shape coefficients have been identified by means of a CFD
analysis carried out in (Miliozzi et al., 2007). These coefficients have been determined
starting from wind actions exerted on the linear parabolic collector as functions of its
angular position (Figure 3). Such coefficients have been calculated for the most (external)
and the least (internal) stressed collectors (Giannuzzi, 2007), see e.g. Figure 4. An external
collector is one of those belonging to the first line without any artificial barrier against wind
actions, whereas an internal collector is one on the sixth line, taken as representative of all
the others.
New Trends in Designing Parabolic trough Solar Concentrators
and Heat Storage Concrete Systems in Solar Power Plants
275
Full tables for shape coefficients in case of “external” parabolas as well as “internal” ones
are reported in (Majorana & Salomoni, 2005 (a)) and used in (Majorana & Salomoni, 2005
(b)) for structural assessment within the Limit State Design. Shape coefficients have been
used to evaluate drag (C
fx
), lift (C
fy
), torsion (C
Mz
) and mean pressure (C
pm
), each of them
being function of the concentrator rotation angle, where the allowed rotation is in the range
+/- 120°. Then, shape coefficients for mean pressures have been calculated as functions of
the aperture angle for “external” or “internal” parabolas. By analyzing the above coefficients
it is possible to identify the parabolas’ characteristic positions listed in Table 5.
Fig. 3. Parabolic concentrator scheme at different angular positions.
Starting from the calculated shape coefficients, the corresponding effects referring to drag
and lift force, torsion, mean pressure and pressure distribution have been determined.
By analyzing the results of the CFD analysis, it has been evidenced that aerodynamic
coefficients and associated loads are largely reduced at the internal collectors. The main
reason resides in the shielding effect produced by the first collectors’ rows. This remark
leads to the necessity of designing “strong” collectors along the external rows (Figure 4) and
“light” collectors along the internal ones. Alternatively, it is possible to choose a different
Fig. 4. Angular distribution of the normalized shape coefficients for “external” parabolas.
Solar Energy
276
design strategy, based on the introduction of opportune windbreak barriers and on the
realization of “light” collectors only. The position characterized by smaller loads is at 180°.
This is only a theoretical, unattainable position because of the interferences between
receivers and pylons. The safety position to be really taken in consideration is at about -120°.
The waiting position (at 0°) does not guarantee an adequate level of protection for the
mirrors. All the positions shown in Table 5 must be taken into account during the design
phase but the most relevant position is, without doubt, the one associated to the maximum
torque action. This is consequence of the fact that torque effects are accumulated along all
the line, producing the maximum stresses on the structural elements close to the central
pylon. This can be considered the key action in the parabolic-trough solar concentrators
wind design.
5.1.2 Snow
The snow load is usually evaluated on the roofs (here parabolas), by means of the following
expression
SiSk
=
⋅
μ
(5)
where q
s
is the snow load on the roof,
μ
i
the roof shape coefficient and q
sk
the reference value
of the snow load on the ground.
Angular position (degrees)
Characteristic Effect
“External”
collector
“Internal”
collector
Safety position
-120 -120
Waiting position
0 0
Maximum torque effect
-30 -15
Maximum bending action on the torque tube
+60 +30
Maximum drag force
+75 -45
Maximum lift force
+120 -45
Maximum crush force
+30 +30
Table 5. Wind effect: characteristic positions.
The load acts along the vertical direction and it is referred to the horizontal projection of the
covering surface. The snow load on the ground depends on local environmental and
exposure conditions, where the variability of the snowfall from region to region is taken into
account. The reference snow load in locations at heights less than 1500 m over the mean sea
level (m.s.l.) has to be evaluated on the basis of given expressions (whose values correspond
to a “return period” of about 200 years). In case of a region like Sicily and a site located at a
reference height less then 200 m m.s.l., q
sk
is about 0.75 kN/m². The shape coefficients to be
used for the snow load are those indicated in Table 6, being α (degrees) the angle between
cover and the horizontal plane.
The shape coefficients μ
1
, μ
2
, μ
3
, μ
1*
refer to roofs having one or more slopes, and they
should be evaluated as functions of α, as indicated by the codes. For given parabolas
positions, other coefficients can be used, as e.g. those related to cylindrical covers. In
absence of rifting inhibiting snow sliding, for cylindrical covers of any shape and single
New Trends in Designing Parabolic trough Solar Concentrators
and Heat Storage Concrete Systems in Solar Power Plants
277
curvature of constant sign, the worst uniform and not-symmetric load distribution is there
considered.
0° <= <= 15° 15° < <= 30° 30° < <= 60° > 60°
μ
1
0.8 0.8 0.8(60-)/30 0.0
μ
2
0.8 0.8+0.4(-15)/30 (60- )/30 0.0
μ
3
0.8+0.8/30 0.8+0.8/30 1.6 -
μ
1
*
0.8 0.8(60- )/45 0
Table 6. Shape coefficient for the snow load (Eurocode1-Part 2.3).
In our case, to determine the shape coefficients μ
i
for the parabolas, it is possible to
approximatively evaluate the maximum slope of the parabolic collector with respect to the
horizontal line, if it is rotated with its concavity upwards, being the element profile defined
by means of the equation
2
/4
y
xf= (6)
where -2950 < x < 2950 (mm), f = 1810 (mm); and the slope by
'/2
y
xf
=
(7)
with maximum value equal to 0.815, corresponding to an angle α such that tgα = 0.815, i.e.
α ≈ 39°. On the other side, taking into account the value corresponding to x/2, then α = 22°.
Hence, assuming α = 22° as a mean value, it is possible to calculate the shape coefficients as
indicated in the recommendations. The corresponding load conditions are shown in Figure
5.
Fig. 5. Snow conditions for the parabolas when the solar collector is rotated to the waiting
position.
As demonstrated in (Majorana & Salomoni, 2005 (b)), snow effects are fundamental when
verifying the structure in the safety position (Table 5) or when seismic effects are included.
Solar Energy
278
Discussing about the real significance of such an effect when considering desert locations (as
those typical for CSP systems) is reasonable: this should be another example of the necessity
for ad-hoc codes of practice when studying special structures in possibly special sites.
The parabola’s configuration with its concavity upwards (Figure 5) is not the only possible
one when evaluating the effects of the snow; being the snowy phenomenon largely
predictable, so that a rotation of the collector towards the safety position is expected, an
additional investigated angular position for analyzing snow effects refers to α = ±120°.
When e.g. α = +120°, the situation is the one of Figure 6; the remaining characteristic
positions, even associable to different OSs, can be considered as characterized by a null
snow action: in fact, in case of snow, the collector would be evidently moved to its safety
position with no tracking. Additionally, being L
1
(distance between the point, on the rotated
parabola, with null tangent and the origin of the vertical axis) > L (= 2950 mm in our case), it
is precautionarily assumed L
1
= L and hence from Eurocodes μ
1
= 0.8, μ
2
= 2.0 (μ
3
= 1.0),
with loads as those of Figure 7.
120°
21°
60°
2950mm
1202mm
Fig. 6. Parabola’s position for evaluating snow effects.
Two changes have been essentially introduced to what indicated by the codes: being, as
already stated, L
1
> L, the point of null load amplified by μ
2
goes outside the effective
parabola’s projected dimension (consequently, the effect of μ
3
is zero; anyway, we are still in
favour of safety being μ
2
> μ
3
) and this explains the chosen trapezoidal shape for the load of
Figure 7; the load cusp (from Eurocodes falling on the point whose slope on the curve is of
30°, i.e. at L
1
/4), considered the not-symmetric parabolic profile, is moved with respect to
L
1
/4.
Then, when combining the loads, among the various indicated load conditions only those
revealed as heaviest for the structural system have been adopted.
Hence, the main load combinations are reported in Table 7, where the multiplicative
coefficients related to each basic action (permanent, G
k
, and variable, Q
k
) and to strength (f
y
)
are additionally indicated, for the OSs of Table 3.
New Trends in Designing Parabolic trough Solar Concentrators
and Heat Storage Concrete Systems in Solar Power Plants
279
733,47mm
μ
1
μ
2
1782,53mm
0.8μ
2
Fig. 7. Snow condition for the parabola when the solar collector is rotated to the safety
position.
Combinations G
k
Q
1k
(wind)
Q
2k
(snow)
f
y
W
1
30 W
1
30R
1. 1. 0. 1.
W
2
60 W
2
60R
1. 1. 0. 1.
W
3
-120° ≤ ≤ 75°
(Table 3)
W
3
E
1.4
*
1.5 0. 1.
W
4
β ; β = 0°
(Table 3)
W
4
βE
1.4
*
1.5 0. 1.
1.4
*
1.5 0. 1.
1.4
*
1.5 1.05 1.
1.4
*
1.05 1.5 1.
W
4
βE
1.4
*
0. 1.5 1.
1.4
*
1.5 1.05 0.83
W
4
β ; β = -120°
(Table 3)
W
4
βP
1.4
*
1.05 1.5 0.83
Table 7. Main load combinations and corresponding multiplicative coefficients (*: if not
acting in favour of safety; R: rare; E: elastic limit state; P: plastic collapse).
Particularly, for combinations related to states W
1
30 (W
1
, 30°) and W
2
60, just rare ones are
considered, being frequent and quasi-permanent combinations already included.
In the following, the main results related only to the concentration system are reported,
being the conducted design and analysis methodology repeatable in the same way to the
other macro-systems, i.e. the torque system and the module’s support.
6. Analysis and verification of the concentration system
The concentration system is composed by three main elements: centering, stringers and
reflecting mirrors (Figures 8 and 9). The system has been analysed considering a single
modulus of 12 m, reproducing also the torque tube to which the centerings are linked.
Solar Energy
280
Fig. 8. Sketch of the solar collector (portion).
Fig. 9. Sketch of a typical centering (first proposal).
6.1 Limit states and load combinations
As already reported in the previous Section, the considered limit states and load
combinations are summarized in Table 8. Correspondingly, OSs W
1
and W
2
are associated to
SLSs for which the wind loads refer to a medium velocity and the serviceability limits
referring to maximum torsion and maximum deformation, respectively, must be verified.
Differently, in the ULSs W
3
and W
4
the structural permanence within the elastic state as well
as tightness under loads corresponding to a characteristic peak wind must be verified.
Particularly, in the W4 state the possible presence of snow has to be additionally accounted
for. For both ULSs, a structural instability verification has to be conducted.
Operational
states
V
ref
(m/s)
@10m
Limit state
Reference
velocity
W
1
7 Serviceability Medium
W
2
14 Serviceability Medium
W
3
21 Ultimate, Elastic Peak
W
4
28 Ultimate, Collapse Peak
Table 8. Summary of adopted limit states and load combinations for the concentration
system.
In Table 9 all the possible load combinations are shown which have been considered for
developing the above-mentioned verifications. It is to be noticed that, for the collapse ULS,
in addition to the combinations required by the Recommendations, two other combinations
have been evaluated in which the snow and the wind alone are present: this was necessarily
done due to the fact that the concurrent presence of the two loads, if from one side it
increases the acting forces, from the other it reduces the magnitude of the torque bending, so
New Trends in Designing Parabolic trough Solar Concentrators
and Heat Storage Concrete Systems in Solar Power Plants
281
reducing the stress state in some fundamental structural components. All the analyses have
been performed in an elastic state and just in those cases, corresponding to a collapse ULS,
in which the structure is particularly stressed, a tightness evaluation within a plastic state
has been conducted.
LS OS
Angle
(°)
G_receiver G_conc
Q_
wind
Q_
snow
c_G c_Qv c_Qn f
y
ID
ELS W
1
30 yes yes yes no 1.00 1.00 0.00 1.00
w1p030c1
ELS W
2
60 yes yes yes no 1.00 1.00 0.00 1.00
w2p060c1
75 yes yes yes no 1.40 1.50 0.00 1.00
w3p075c1
1.00 1.50 0.00 1.00
w3p075c2
60 yes yes yes no 1.40 1.50 0.00 1.00
w3p060c1
1.00 1.50 0.00 1.00
w3p060c2
30 yes yes yes no 1.40 1.50 0.00 1.00
w3p030c1
1.00 1.50 0.00 1.00
w3p030c2
0 yes yes yes no 1.40 1.50 0.00 1.00
w3p000c1
1.00 1.50 0.00 1.00
w3p000c2
-30 yes yes yes no 1.40 1.50 0.00 1.00
w3m030c1
1.00 1.50 0.00 1.00
w3m030c2
-120 yes yes yes no 1.40 1.50 0.00 1.00
w3m120c1
ULS
elastic
W
3
1.00 1.50 0.00 1.00
w3m120c2
-120 yes yes yes load1 1.40 1.50 1.05 0.83
w4m120c1
1.00 1.50 1.05 0.83
w4m120c2
1.40 1.05 1.50 0.83
w4m120c3
1.00 1.05 1.50 0.83
w4m120c4
1.40 1.50 0.00 0.83
w4m120c5
1.00 1.50 0.00 0.83
w4m120c6
1.40 0.00 1.50 0.83
w4m120c7
1.00 0.00 1.50 0.83
w4m120c8
-120 yes yes yes load2 1.40 1.50 1.05 0.83
w4m120c9
1.00 1.50 1.05 0.83
w4m120c10
1.40 1.05 1.50 0.83
w4m120c11
1.00 1.05 1.50 0.83
w4m120c12
1.40 1.50 0.00 0.83
w4m120c5
1.00 1.50 0.00 0.83
w4m120c6
1.40 0.00 1.50 0.83
w4m120c13
1.00 0.00 1.50 0.83
w4m120c14
0 yes yes yes no 1.40 1.50 0.00 0.83
w4p000c1
ULS
collapse
W
4
1.00 1.50 0.00 0.83
w4p000c2
Table 9. Details of the load combinations for the concentration system.
Solar Energy
282
6.2 Analysis methodologies.
The structural element has been studied through the F.E. Cast3M code, realizing a 3D model
of the 12 m concentration system (Figure 10). Reflecting mirrors, centerings, stringers, torque
tube and edge plates. Apart from the plates, which have been modelled through infinitely-
rigid beams, all the other components, being made by thin plates, have been modelled
through 2D shell elements, able to take into account membrane as well as bending and shear
stresses.
Fig. 10. 3D F.E. model of the concentration system.
The global structural constraints, applied to the edges of the connecting plates, have been
applied such to create an isolated and isostatic system, so the stress state doesn’t change due
to possible loads transmitted by the adjacent moduli.
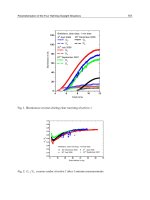
6.3 Discussion of the main numerical results.
The main results referring to SLSs for weak and medium wind, as well as to ULSs (elastic
and collapse) are depicted in Table 10; stresses are calculated as the maximum equivalent
Tresca stress, F
saf
is the safety factor obtained by dividing the material yield limit (reduced
in case of ULS, see Tables 7 and 9) by the above stress. The medium value of the parabola’s
deformation is additionally reported (which is always lower than ± 5 mm, the assumed limit
within SLSs).
It is hence evidenced that in both elastic and collapse ULSs the safety factors are generally
lower than one; by examining the results in more detail, it has been found that local yielding
occur in the higher and middle part of the centering and in some zones connecting the
centering with the stringers.
Anyway, it is to be said that the model has been developed to study the global stress level in
the various components and not to locally analyse the connecting constructive details which
need specific 3D models; a possible local overcome in the stress yield limit and/or
consequent re-distributions of stresses can’t be caught by such an approach, as explained
below.
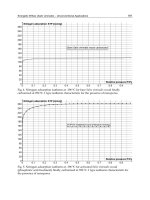
For sake of brevity, the contour maps of stresses have been included (Figures 11 and 12)
referring only to w3p060c1 and w4m120c9 combinations: it is here evidenced the much
localized nature of plasticization, as explained above.
New Trends in Designing Parabolic trough Solar Concentrators
and Heat Storage Concrete Systems in Solar Power Plants
283
Table 10. Numerical results (static analyses) for the concentration system.
Fig. 11. Contour map of maximum equivalent Tresca stresses for w3p060c1.
Solar Energy
284
Fig. 12. Contour map of maximum equivalent Tresca stresses for w4m120c9.
The 3D static analyses revealed an appropriate response of the structure under a variety of
actions and once, for example, the material strength had been locally overcome, appropriate
design procedures have been updated and nonlinear (for material and geometry) analyses
performed (see e.g. Figure 13).
Fig. 13. Typical results from modal and seismic analyses and scheme for a modelled joint.
Additional modal, spectral and generally dynamic analyses have been conducted for the
whole CSP system (see Figure 14) to understand the global structural behaviour and to
newly upgrade the first design sketch.
The discussion about such results and the corresponding structural response can’t be
reported here for sake of brevity.
New Trends in Designing Parabolic trough Solar Concentrators
and Heat Storage Concrete Systems in Solar Power Plants
285
Fig. 14. Joints, pins and specific nodes studied through 3D nonlinear analyses for material
and geometry to test their effective structural response and to verify the requirements of the
different operational states.
7. Description of heat storage concrete systems
The main advantage of thermal solar power plants is the possibility to use relatively
economical storage systems, if compared to other renewable energies (i.e. photo-voltaic and
wind). Storing electricity is much more expensive than storing thermal energy itself.
Thermal Energy Storage (TES) option can collect energy in order to shift its use to later
times, or to smooth out the plant output during irregularly cloudy weather conditions.
Hence, the functional operativeness of a solar thermal power plant can be extended beyond
periods of no solar radiation without the need of burning fossil fuel. Periods of mismatch
among energy supplied by the sun and energy demand can be reduced. Economic thermal
storage is a technological key issue for the future success of solar thermal technologies.
In our days, among eight thermal storage systems in thermo-electric solar plants, seven have
been of experimental or prototypal nature and only one has been a commercial unit
(Salomoni et al., 2008). All the considered systems are “at sensible heat storage”: two single-
tanks oil thermo-cline systems, four two-tanks single medium systems (one oil- and three
molten salt-) and two single-tanks double medium systems. Actually the most advanced
technology for heat storage in solar towers and through collector plants considers the use of
a two-tanks molten salt system (Ives et al., 1985).
Generally, the hot and cold tanks are located on the ground and they are characterized by an
internal circumferential and longitudinally-wrinkled liner, appropriately thermally
insulated. The cost of the liner is the primary cost of such a tank. In recent studies it has been
shown that an increase in the hourly capacity accumulation reduces sensibly the cost of the
Solar Energy
286
produced electrical energy (LEC); this leads to increase the reservoir dimensions from the
11.6 m diameter and 8.5 m height of the Solar Two power plant to the larger 18.9 m diameter
and 2.5 height calculated in the Solar Tres power plant design phase.
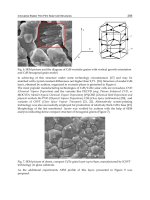
Already in 1985, the Solar Energy Research Institute (SERI) commissioned the conceptual
design of a below-grade cone shape storage (Figure 15) with 900°C molten carbonate salts
(Copeland et al., 1984). This solution, even though interesting because of the use of low cost
structural materials, showed some limits connected to the high level of corrosion induced by
carbonate and high temperature.
Fig. 15. Conical storage partially buried in the ground.
Such a type of storage is here reconsidered in combination with nitrate molten salts at a
maximum temperature of 565°C, using an innovative high performance concrete (HPC) for
the tanks. From the technological point of view, the innovations rely in:
-
higher structural safety related to the reduced settlements;
-
employment of HPC containment structures and foundations characterised by lower
costs with respect to stainless steel structures;
-
substitution of highly expensive corrugated steel liners with plane liners taking
advantage of the geometric compensation of thermal dilations due to the conical shape
of the tank;
-
possibility of employing freezing passive systems for the concrete basement made of
HPC, able to sustain temperature levels higher than those for OPC;
-
fewer problems when the tank is located on low-strength soils.
The planned research activities required the upgrade of a F.E. coupled model for heat and
mass transport (plus mechanical balance) to estimate concrete tanks durability under
prolonged thermal loads and cyclic temperature variations due to changes in the salts level.
The presence of a surrounding soil volume is additionally accounted for to evaluate
environmental risk scenarios.
7.1 Mathematical-numerical modeling of concrete
Concrete is treated as a multiphase system where the voids of the skeleton are partly filled
with liquid and partly with a gas phase (Baggio et al., 1995; Gawin et al., 1999). The liquid
New Trends in Designing Parabolic trough Solar Concentrators
and Heat Storage Concrete Systems in Solar Power Plants
287
phase consists of bound water (or adsorbed water), which is present in the whole range of
water contents of the medium, and capillary water (or free water), which appears when
water content exceeds so-called solid saturation point S
ssp
(Couture et al., 1996), i.e. the
upper limit of the hygroscopic region of moisture content. The gas phase, i.e. moist air, is a
mixture of dry air (non-condensable constituent) and water vapour (condensable gas), and
is assumed to behave as an ideal gas.
The approach here is to start from a phenomenological model (Schrefler et al., 1989;
Majorana et al., 1997; Majorana et al., 1998; Majorana & Salomoni, 2004 (b); Salomoni et al.,
2007 (a)), originally developed by Bažant and co-authors, e.g. (Bažant, 1975; Bažant &
Thonguthai, 1978; Bažant & Thonguthai, 1979; Bažant et al., 1988), in which mass diffusion
and heat convection-conduction equations are written in terms of relative humidity, to an
upgraded version in which its non-linear diffusive nature is maintained as well as the
substitution of the linear momentum balance equations of the fluids with a constitutive
equation for fluxes, but new calculations of thermodynamic properties for humid gases are
implemented too to take into account different fluid phases as well as high ranges of both
pressure and temperature. Additionally, Darcy’s law is abandoned when describing gas
flow through concrete.
The proposed model couples non-linear geometric relations with empirical relations; to
enhance its predictive capabilities, a predictor-corrector procedure is supplemented to check
the exactness of the solution. For additional details the reader is referred to (Salomoni et al.,
2007 (b); Salomoni et al., 2008; Salomoni et al., 2009).
7.2 Numerical analyses
A conical tank for storing hot salts has been modelled through the F.E. research code
NEWCON3D (Figure 16) using 330 8-node isoparametric elements (axis-symmetric
condition). In agreement with the design criteria, it is proposed to employ a High
Performance Concrete (HPC), particularly a C90 for this analysis, to increase both the
operational temperature up to 120°C -against the usual 90°C for ordinary concretes- and
concrete durability. The whole tank is composed by a flat stainless steel liner in contact with
the salts and a ceramic fibre blanket (not modelled here) close to the concrete main structure
(Figure 15). An additional passive cooling system is supposed to be added within the
concrete thickness to reach such operational temperature on concrete surfaces. Geometric
details have not been included for privacy reasons.
Fig. 16. F.E. discretization for the thermal storage concrete tank.