Mobile and wireless communications physical layer development and implementation Part 12 pot
Bạn đang xem bản rút gọn của tài liệu. Xem và tải ngay bản đầy đủ của tài liệu tại đây (1.12 MB, 20 trang )
JointCooperativeDiversityandSchedulinginOFDMARelaySystem 211
fading scenario, some users with highest SNR at the destination will access the channel for a
long time while unfortunately others have to wait until their channel condition improves.
For such slowly time-varying channel environment, joint cooperative diversity and
scheduling (JCDS) technique has been proposed in (Wittneben et al., 2004; Hammerstrom et
al., 2004; Tarasak & Lee, 2007; Tarasak & Lee, 2008) to improve the capacity performance.
The authors in (Wittneben et al., 2004; Hammerstrom et al., 2004) introduced a time-varying
phase rotation in time domain at relay nodes by multiplying each transmit relay signal by a
specific phase rotation. This latter creates a time-variant relay fading channel which can be
exploited to provide opportunity for every user to be scheduled. For frequency selective
fading channel, the works in (Tarasak & Lee, 2007; Tarasak & Lee, 2008) have extended the
JCDS technique by introducing cyclic delay diversity (CDD) at the relay nodes in OFDMA
system. Using CDD technique, additional fluctuation among the sub-carriers is produced
and as a result the scheduler can successfully provide more chance to users to have access to
the channel by allocating subcarriers to users whose SNR are highest.
However, the performance of the JCDS depends as well on the cooperative diversity
technique used at relay nodes. It has been shown in (Laneman et al., 2003) that using single
Amplify and Forward (AF) relay, second order diversity can be achieved. But, it is not
necessarily evident to achieve higher order diversity by using several AF-relays. For
instance, if some relays receive noisy signals then the noises contained in these received
signals are also amplified during a retransmission process. Without any further signal
processing, except amplification relay gain, these noisy signals may disturb the received
signal at the destination and hence diversity order is reduced. With proper processing of the
received signals at the relay nodes, the performance of the JCDS system may perform better
by improving the quality of communication links between relays and destinations. For this
aim, several algorithms have been proposed in literature known as cooperative distributed
transmit beamforming (DTB) for single carrier transmission (AitFares et al., 2009 a; Wang et
al., 2007; Yi & Kim, 2007).
In this Chapter, we will introduce the DTB approach to JCDS OFDMA-based relay network
in multi source-destination pair’s environment and we will highlight its potential to increase
the diversity order and the system throughput performance. By jointly employing the JCDS
with DTB, the aggregate throughput, defined as the total throughput in given physical
resources, is enhanced. On the other hand, the per-link throughput, defined as the user
throughput in a given transmission cycle, is not significantly improved, since the
performance of this per-link throughput depends on how many subcarriers are allocated to
the user during a given transmission cycle. In addition, to trade-off a small quantity of the
aggregate throughput in return for significant improvement in the per-link throughput, we
introduce also the fixed CDD approach at relay stations to the proposed JCDS-DTB. Also we
prove that in multi source-destination pairs system, combining DTB with CDD at relay
nodes creates more fluctuation among subcarriers resulting in time-variant SNR at each
destination and consequently gives more opportunity to users to access to the channel.
2. Evolution of wireless mobile communication technology
In the 1980s, first generation (1G) cellular mobile phone, consisted of voice-only analog
devices with limited range and features, was introduced. In the 1990s, a second generation
(2G) of mobile phones was presented with digital voice/data and with higher data transfer
rates, expanded range, and more features. 2G networks saw their first commercial light of
day on the global system for mobile (GSM) standard. In addition to GSM protocol, 2G also
utilizes various other digital protocols including CDMA, TDMA, iDEN and PDC.
Afterwards, 2.5G wireless technology was established as a stepping stone that bridged 2G to
3G wireless technology. 3G technology was introduced to enable faster data-transmission
speeds, greater network capacity and more advanced network services. The first pre-
commercial 3G was launched by NTT DoCoMo in Japan in May 2001.
Actually, wireless mobile communications have become very persistent. The number of
mobile phones and wireless internet users has increased significantly. The growth of the
number of mobile subscribers over the last years led to a saturation of voice-oriented
wireless telephony. From a number of 214 million subscribers in 1997 to 4 billion cellular
mobile subscribers in 2008 (Acharya, 2008).
However, modern cellular networks need to provide not only high quality voice service for
users, but a large amount of data transfer services as well. Users want to be connected with
the networks not only for making voice conversations anytime and anywhere with people
but also for data downloading/uploading. It is now time to explore new demands and to
find new ways to extend the mobile wireless concept.
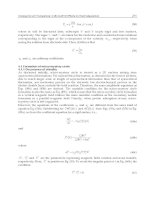
The evolution of 3G mobile networks will be followed by the development of next
generation mobile networks, called 4th generation (4G) or “beyond 3G” mobile phone
technology. 4G refers to the entirely new evolution in wireless communications and will
support extremely high-speed packet data service 100M–1Gbps (Adachi & Kudoh, 2007) as
shown in Fig. 1.
Fig. 1.
Wireless mobile communication network evolution.
Although 4G wireless communication systems are expected to offer considerably higher
data-rate services and larger coverage areas compared to these older generations, these
expectations about wireless communication systems performance appear to be unfeasible in
the conventional cellular architecture due to limited transmission capabilities and spectrum
efficiency (Adachi & Kudoh, 2007; Adachi, 2008). Indeed, for a peak data rate of
MobileandWirelessCommunications:Physicallayerdevelopmentandimplementation212
~1Gbps/Base Station (BS), there are two important technical issues to address: (1) to
overcome the highly frequency-selective fading channel, and (2) to significantly reduce the
transmit power from mobile terminals.
2.1 Spectrum Efficiency Problem
In terrestrial wireless communications, the transmitted signal is reflected or diffracted by
large buildings between transmitter and receiver, creating propagation paths having
different time delays. For instant, for 1Gbps transmission, 1bit time length is equivalent to
the distance of 0.3 m (Adachi, 2008). Then, many distinct multipaths are created, where
strong inter-symbol interference (ISI) may be produced. Consequently, the challenge of 4G
realization is to transmit broadband data close to 1 Gbps with high quality over such a
severe frequency-selective fading channel. In this case, some advanced equalization
techniques are necessary to overcome the highly frequency-selective fading channel
(Adachi, 2008).
2.2 Transmit Power Problem
In fact, the peak transmit power is in proportion to “transmission rate”. Hence, for a very
high rate transmission, a prohibitively high transmit power is required if the same
communication range in distance is kept as in the present cellular systems. Ignoring the
shadowing loss and multipath fading, the energy per bit-to-AWGN (additive white
Gaussian noise) power spectrum density ratio E
b
/N
0
is given by (Adachi & Kudoh, 2007)
where P
T
is the transmit power, B is the bit rate, r
0
is the cell radius, is the path loss
exponent. We can notice from (1), for a given cell radius r
0
, as the bit rate B increases, the
transmit power should be increased in order to satisfy the required E
b
/N
0
. Therefore,
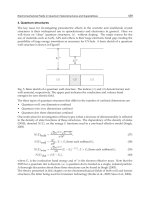
keeping the transmit power the same as in the present conventional cellular network, will
result in decreasing of coverage of the BS to r
0
’ as shown in Fig. 2.
For instant, assume that the required transmit power for 8kbps at 2GHz is 1Watt for a
communication range of r
0
=1,000m. Since the peak power is in proportion to (transmission
rate) x (f
c
2.6
)[Hata-formula] (Kitao & Ichitsubo, 2004) where f
c
is the carrier frequency, then,
the required peak transmission power for 1Gbps at 3.5GHz needs to be increased by
1Gbps/8kbps x (3.5GHz/2GHz)
2.6
= 535,561 times, that is, P
T
=536kWatt. Obviously, this
cannot be allowed. Hence, to keep the 1W power, the communication range should be
reduced by 43 times if the propagation path loss exponent is =3.5. Hence, the cell size
should be significantly reduced to r
0
’=23m and that leads to increase in the number of BS
and consequently gives rise to high infrastructure cost (Adachi, 2008). However, to extend
the coverage of BS even at high transmission rate while keeping the transmit power the
same as in the present cellular systems, fundamental change in wireless access network is
required.
Fig. 2. Decreasing the coverage of BS in the case of keeping the transmit power the same as
in the present conventional cellular network for high data rate transmission.
Without reducing the cell size, the direct transmission between widely separated BS and
mobile terminal (MT) can be extremely expensive in terms of transmitted power required
for reliable communication. Actually, the need of high-power transmissions may increase
the co-channel interferences as well as lead to faster battery drain (shorter network life). An
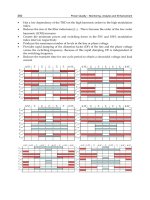
alternative approach to direct transmission is to employ relay stations as ‘intermediate’ nodes
to establish multi-hop communication links between BS and MT. Such strategies are named
as wireless multi-hop Virtual Cellular Network (VCN). This architecture consists of a central
port (CP), which is the gateway to the network, and many distributed wireless ports (WP)
which directly communicate with the mobile terminals. These WPs, often referred to as relay
nodes, are used to forward the information of the users having poor coverage to the CP as
shown in Fig. 3. The wireless multi-hop VCN will play key roles in future infrastructure-
based wireless networks owing to its considerable economical and technical advantages,
including: increase system capacity and spectral efficiency, and reduce transmission energy,
compared to other network architectures (Dau et al., 2008; Fitzek & Katz, 2006; Adachi &
Kudoh, 2007).
Fig. 3. Multi-hop VCN technology and coverage extension of a multi-hop VCN.
Cooperative relay network is an upgrade technology of multi-hop VCN systems, where relays
have to cooperate in relaying information as shown in Fig.4 for 2-hop VCN technology. One
advantage of these structures is that it is possible to unite multiple relays in the cellular
JointCooperativeDiversityandSchedulinginOFDMARelaySystem 213
~1Gbps/Base Station (BS), there are two important technical issues to address: (1) to
overcome the highly frequency-selective fading channel, and (2) to significantly reduce the
transmit power from mobile terminals.
2.1 Spectrum Efficiency Problem
In terrestrial wireless communications, the transmitted signal is reflected or diffracted by
large buildings between transmitter and receiver, creating propagation paths having
different time delays. For instant, for 1Gbps transmission, 1bit time length is equivalent to
the distance of 0.3 m (Adachi, 2008). Then, many distinct multipaths are created, where
strong inter-symbol interference (ISI) may be produced. Consequently, the challenge of 4G
realization is to transmit broadband data close to 1 Gbps with high quality over such a
severe frequency-selective fading channel. In this case, some advanced equalization
techniques are necessary to overcome the highly frequency-selective fading channel
(Adachi, 2008).
2.2 Transmit Power Problem
In fact, the peak transmit power is in proportion to “transmission rate”. Hence, for a very
high rate transmission, a prohibitively high transmit power is required if the same
communication range in distance is kept as in the present cellular systems. Ignoring the
shadowing loss and multipath fading, the energy per bit-to-AWGN (additive white
Gaussian noise) power spectrum density ratio E
b
/N
0
is given by (Adachi & Kudoh, 2007)
where P
T
is the transmit power, B is the bit rate, r
0
is the cell radius, is the path loss
exponent. We can notice from (1), for a given cell radius r
0
, as the bit rate B increases, the
transmit power should be increased in order to satisfy the required E
b
/N
0
. Therefore,
keeping the transmit power the same as in the present conventional cellular network, will
result in decreasing of coverage of the BS to r
0
’ as shown in Fig. 2.
For instant, assume that the required transmit power for 8kbps at 2GHz is 1Watt for a
communication range of r
0
=1,000m. Since the peak power is in proportion to (transmission
rate) x (f
c
2.6
)[Hata-formula] (Kitao & Ichitsubo, 2004) where f
c
is the carrier frequency, then,
the required peak transmission power for 1Gbps at 3.5GHz needs to be increased by
1Gbps/8kbps x (3.5GHz/2GHz)
2.6
= 535,561 times, that is, P
T
=536kWatt. Obviously, this
cannot be allowed. Hence, to keep the 1W power, the communication range should be
reduced by 43 times if the propagation path loss exponent is =3.5. Hence, the cell size
should be significantly reduced to r
0
’=23m and that leads to increase in the number of BS
and consequently gives rise to high infrastructure cost (Adachi, 2008). However, to extend
the coverage of BS even at high transmission rate while keeping the transmit power the
same as in the present cellular systems, fundamental change in wireless access network is
required.
Fig. 2. Decreasing the coverage of BS in the case of keeping the transmit power the same as
in the present conventional cellular network for high data rate transmission.
Without reducing the cell size, the direct transmission between widely separated BS and
mobile terminal (MT) can be extremely expensive in terms of transmitted power required
for reliable communication. Actually, the need of high-power transmissions may increase
the co-channel interferences as well as lead to faster battery drain (shorter network life). An
alternative approach to direct transmission is to employ relay stations as ‘intermediate’ nodes
to establish multi-hop communication links between BS and MT. Such strategies are named
as wireless multi-hop Virtual Cellular Network (VCN). This architecture consists of a central
port (CP), which is the gateway to the network, and many distributed wireless ports (WP)
which directly communicate with the mobile terminals. These WPs, often referred to as relay
nodes, are used to forward the information of the users having poor coverage to the CP as
shown in Fig. 3. The wireless multi-hop VCN will play key roles in future infrastructure-
based wireless networks owing to its considerable economical and technical advantages,
including: increase system capacity and spectral efficiency, and reduce transmission energy,
compared to other network architectures (Dau et al., 2008; Fitzek & Katz, 2006; Adachi &
Kudoh, 2007).
Fig. 3. Multi-hop VCN technology and coverage extension of a multi-hop VCN.
Cooperative relay network is an upgrade technology of multi-hop VCN systems, where relays
have to cooperate in relaying information as shown in Fig.4 for 2-hop VCN technology. One
advantage of these structures is that it is possible to unite multiple relays in the cellular
MobileandWirelessCommunications:Physicallayerdevelopmentandimplementation214
network as a “virtual antenna array” to forward the information cooperatively while an
appropriate combining at the destination realizes diversity gain. Therefore cooperative
relaying is regarded as a promising method to the challenging of throughput and high data
rate coverage requirements of future wireless networks as it provides flexible extension,
capacity increase to the conventional wireless systems (Adachi & Kudoh, 2007).
Fig. 4. Cooperative relay network using 2-hop VCN technology.
2.3 OFDMA - based relay in 2-hop VCN technology
OFDM modulation is a bandwidth-efficient technique to obviate inter-symbol interference
arising from multipath fading by transmitting multiple narrowband subcarriers. However,
in a multipath fading environment, these subcarriers can experience different fading levels;
thus, some of them may be completely lost due to deep fading. Cooperative relay network
technique may enhance the reliability of subcarriers through redundancy by exploiting the
spatial diversity. In fact, since cooperative relay technique provides spatial diversity gain for
each subcarrier, the total number of lost subcarriers due to deep fading may be reduced.
On the other hand, in multi-user system, Orthogonal Frequency Division Multiple Access
(OFDMA) based relay networks have recently received much renewed research interest and
recognized as enabling techniques to achieve greater coverage and capacity by exploiting
multi-user diversity and allowing efficient sharing of limited resources such as spectrum
and transmit power among multiple users (Tarasak & Lee, 2007; Tarasak & Lee, 2008;
AitFares et al., 2009 b). For instance, OFDMA is very flexible since different subcarriers to
different users depending on their channel conditions and as several users’ channels fade
differently, the scheduler offer the access to the channel to different users based on their
channel conditions to increase the system capacity.
In multi-user scheduling, the subcarriers can be allocated using private subcarrier
assignment (i.e., one user uses private multiple subcarriers at any given time) or shared
subcarrier assignment (i.e., several users use a given subcarrier). The subcarriers can be
assigned based on each user-destination’s SNR or rate maximization technique (Wong et al.,
2004). Allocating carriers based on each user’s SNR maximizes the total capacity but without
being fair to each user. An example is shown in Fig.5 using three user-destination pairs with
total number of subcarriers N
c
=12.
Fig. 5. OFDMA network architecture and Scheduling technique based on SNR assignement
approach.
Fig. 6 illustrates an example of the OFDMA transmitter structure for the system at the BS
studied in Fig.5 where the subcarrier and power allocations are carried out relying on the
feedback information from the scheduler. As shown in this example over one OFDMA
symbol, the scheduler chooses the best link (highest SNR) in each subcarrier taking into
consideration the channel information at each destination.
OFDMA technology faces several challenges to present efficiency realizations. For instance,
if many users in the same geographic area are requiring high on-demand data rates in a
finite bandwidth with low latency, a fair and efficient scheduler is required. In addition, to
carry out this scheduling, the transmitter needs the channel state information for the
different users, and the receiver need information about its assigned subcarriers and all
information exchange should be carried out with low overhead.
Fig. 6. OFDMA transmitter structure for subcarrier and power allocations at the BS.
2.4 Multi source-destination pairs in OFDMA – based relay in 2-hop VCN technology
OFDMA wireless network architecture in 2-hop VCN technology, illustrated in Fig. 5, can be
extended and applied for multi-source destination pairs, where multiple sources
communicating with their corresponding destinations utilizing same half-duplex relays as
JointCooperativeDiversityandSchedulinginOFDMARelaySystem 215
network as a “virtual antenna array” to forward the information cooperatively while an
appropriate combining at the destination realizes diversity gain. Therefore cooperative
relaying is regarded as a promising method to the challenging of throughput and high data
rate coverage requirements of future wireless networks as it provides flexible extension,
capacity increase to the conventional wireless systems (Adachi & Kudoh, 2007).
Fig. 4. Cooperative relay network using 2-hop VCN technology.
2.3 OFDMA - based relay in 2-hop VCN technology
OFDM modulation is a bandwidth-efficient technique to obviate inter-symbol interference
arising from multipath fading by transmitting multiple narrowband subcarriers. However,
in a multipath fading environment, these subcarriers can experience different fading levels;
thus, some of them may be completely lost due to deep fading. Cooperative relay network
technique may enhance the reliability of subcarriers through redundancy by exploiting the
spatial diversity. In fact, since cooperative relay technique provides spatial diversity gain for
each subcarrier, the total number of lost subcarriers due to deep fading may be reduced.
On the other hand, in multi-user system, Orthogonal Frequency Division Multiple Access
(OFDMA) based relay networks have recently received much renewed research interest and
recognized as enabling techniques to achieve greater coverage and capacity by exploiting
multi-user diversity and allowing efficient sharing of limited resources such as spectrum
and transmit power among multiple users (Tarasak & Lee, 2007; Tarasak & Lee, 2008;
AitFares et al., 2009 b). For instance, OFDMA is very flexible since different subcarriers to
different users depending on their channel conditions and as several users’ channels fade
differently, the scheduler offer the access to the channel to different users based on their
channel conditions to increase the system capacity.
In multi-user scheduling, the subcarriers can be allocated using private subcarrier
assignment (i.e., one user uses private multiple subcarriers at any given time) or shared
subcarrier assignment (i.e., several users use a given subcarrier). The subcarriers can be
assigned based on each user-destination’s SNR or rate maximization technique (Wong et al.,
2004). Allocating carriers based on each user’s SNR maximizes the total capacity but without
being fair to each user. An example is shown in Fig.5 using three user-destination pairs with
total number of subcarriers N
c
=12.
Fig. 5. OFDMA network architecture and Scheduling technique based on SNR assignement
approach.
Fig. 6 illustrates an example of the OFDMA transmitter structure for the system at the BS
studied in Fig.5 where the subcarrier and power allocations are carried out relying on the
feedback information from the scheduler. As shown in this example over one OFDMA
symbol, the scheduler chooses the best link (highest SNR) in each subcarrier taking into
consideration the channel information at each destination.
OFDMA technology faces several challenges to present efficiency realizations. For instance,
if many users in the same geographic area are requiring high on-demand data rates in a
finite bandwidth with low latency, a fair and efficient scheduler is required. In addition, to
carry out this scheduling, the transmitter needs the channel state information for the
different users, and the receiver need information about its assigned subcarriers and all
information exchange should be carried out with low overhead.
Fig. 6. OFDMA transmitter structure for subcarrier and power allocations at the BS.
2.4 Multi source-destination pairs in OFDMA – based relay in 2-hop VCN technology
OFDMA wireless network architecture in 2-hop VCN technology, illustrated in Fig. 5, can be
extended and applied for multi-source destination pairs, where multiple sources
communicating with their corresponding destinations utilizing same half-duplex relays as
MobileandWirelessCommunications:Physicallayerdevelopmentandimplementation216
shown in Fig. 7. This kind of network architecture, typically applied in ad-hoc network,
presented promising techniques to achieve greater capacity. Analyzing and evaluating the
capacity of wireless OFDMA-based relay in multi-source destination pair’s networks is one
of the most important issues. However, if the wireless nodes are using the same physical
resources (i.e., same subcarriers), the problem of evaluating the throughput becomes much
more challenging since the transmission of other sources acts as co-channel interference for
the others destinations.
In this Chapter, we are interested to study the OFDMA-based relay network in multi-source
destination pair’s system. In addition, to avoid interferences, instead of using all the
orthogonal subcarriers, according to the rate of transmission required by an MT, only the
subcarriers with highest received SNR can be allocated independently to the source-
destination links.
Fig. 7. Multi source-destination pairs via relay routes.
3. JCDS with Distributed Transmit Beamforming and fixed Cyclic Delay
Diversity
3.1 System Model
Consider a wireless system composed of M user-destination pairs. R relays are assisting the
communication link. Each source needs to communicate with its own destination with the
help of these relays. We assume the destinations are far away from sources and there are no
direct paths between source-destination pairs. Fig. 8 illustrates an example of the system
model with two source-destination pairs (M=2) using four relays (R=4). We assume that the
relays operate in duplex mode where in the first time slot, they receive the OFDMA signals
from sources that are transmitting simultaneously but with different non-overlapping sub-
channels (i.e., a set of OFDM subcarriers), while in the second slot they forward
concurrently their received signals to destinations. The channels are assumed time-invariant
over one OFDMA block and i.i.d. frequency selective Rayleigh fading with the channel
order L. The l-th
path complex-valued gains of the channels between the i-th user and the r-
th relay and between the r-th relay and the i-th
destination are denoted by h
i,r
(l) and g
r,i
(l),
respectively. Both h
i,r
(l) and g
r,i
(l) are zero mean complex Gaussian random and their
variances follow an exponential delay profile such as
.
Fig. 8. Multi source-destination pairs in OFDMA 2-hop VCN technology.
The structure of the OFDMA signal transmitted from user U
i
is depicted in Fig.9 where N
c
represents the N
c
-point (I) FFT in the OFDMA transmitters and receivers, N
ci
is the number
of subcarriers allocated to the user U
i
, where the remaining subcarriers (N
c
-N
ci
) are padded
(e.g., zero padding) and N
GI
is the guard interval (GI) length and assumed to be longer than
the maximum channel delay spread.
Fig. 9. Transmit OFDMA signal structure and subcarrier allocation scheme.
After removing GI and applying FFT transform the received signal of the p-th
subcarrier at
the r-th
relay is given by
. (2)
where S
i
(p) is a unit-energy data symbol transmitted from user U
i
(1≤i≤ M) whose subcarrier
p has been assigned by the scheduler, P
s
is the transmit power used by the user U
i
, H
i,r
(p) is
the channel gain of the subcarrier p from the i-th user to the r-th
relay and η
r
(p) is the
AWGN’s in the corresponding channels with variance
. Before forwarding the received
signals to the destination, the relays may perform some signal processing as shown in Fig.10
JointCooperativeDiversityandSchedulinginOFDMARelaySystem 217
shown in Fig. 7. This kind of network architecture, typically applied in ad-hoc network,
presented promising techniques to achieve greater capacity. Analyzing and evaluating the
capacity of wireless OFDMA-based relay in multi-source destination pair’s networks is one
of the most important issues. However, if the wireless nodes are using the same physical
resources (i.e., same subcarriers), the problem of evaluating the throughput becomes much
more challenging since the transmission of other sources acts as co-channel interference for
the others destinations.
In this Chapter, we are interested to study the OFDMA-based relay network in multi-source
destination pair’s system. In addition, to avoid interferences, instead of using all the
orthogonal subcarriers, according to the rate of transmission required by an MT, only the
subcarriers with highest received SNR can be allocated independently to the source-
destination links.
Fig. 7. Multi source-destination pairs via relay routes.
3. JCDS with Distributed Transmit Beamforming and fixed Cyclic Delay
Diversity
3.1 System Model
Consider a wireless system composed of M user-destination pairs. R relays are assisting the
communication link. Each source needs to communicate with its own destination with the
help of these relays. We assume the destinations are far away from sources and there are no
direct paths between source-destination pairs. Fig. 8 illustrates an example of the system
model with two source-destination pairs (M=2) using four relays (R=4). We assume that the
relays operate in duplex mode where in the first time slot, they receive the OFDMA signals
from sources that are transmitting simultaneously but with different non-overlapping sub-
channels (i.e., a set of OFDM subcarriers), while in the second slot they forward
concurrently their received signals to destinations. The channels are assumed time-invariant
over one OFDMA block and i.i.d. frequency selective Rayleigh fading with the channel
order L. The l-th
path complex-valued gains of the channels between the i-th user and the r-
th relay and between the r-th relay and the i-th
destination are denoted by h
i,r
(l) and g
r,i
(l),
respectively. Both h
i,r
(l) and g
r,i
(l) are zero mean complex Gaussian random and their
variances follow an exponential delay profile such as
.
Fig. 8. Multi source-destination pairs in OFDMA 2-hop VCN technology.
The structure of the OFDMA signal transmitted from user U
i
is depicted in Fig.9 where N
c
represents the N
c
-point (I) FFT in the OFDMA transmitters and receivers, N
ci
is the number
of subcarriers allocated to the user U
i
, where the remaining subcarriers (N
c
-N
ci
) are padded
(e.g., zero padding) and N
GI
is the guard interval (GI) length and assumed to be longer than
the maximum channel delay spread.
Fig. 9. Transmit OFDMA signal structure and subcarrier allocation scheme.
After removing GI and applying FFT transform the received signal of the p-th
subcarrier at
the r-th
relay is given by
. (2)
where S
i
(p) is a unit-energy data symbol transmitted from user U
i
(1≤i≤ M) whose subcarrier
p has been assigned by the scheduler, P
s
is the transmit power used by the user U
i
, H
i,r
(p) is
the channel gain of the subcarrier p from the i-th user to the r-th
relay and η
r
(p) is the
AWGN’s in the corresponding channels with variance
. Before forwarding the received
signals to the destination, the relays may perform some signal processing as shown in Fig.10
MobileandWirelessCommunications:Physicallayerdevelopmentandimplementation218
(a, b, and c), such as jointly AF and CDD proposed in (Tarasak & Lee, 2008), jointly AF and
DTB or jointly AF, DTB and fixed CDD as will be studied in the following.
Fig. 10. Relay node structure using different cooperative techniques.
In AF scheme, the relay normalizes its received signal by multiplying it with a relay gain
given by
. (3)
With channel order equal to L, the channel gain H
i,r
(p) at the p-th
subcarrier can be written
as
(4)
The output of the transmit beamforming can be expressed by
(5)
where W
TB,r
(p) represents the weight element of the p-th
subcarrier at the r-th
relay.
The received signal at the i-th
destination after performing FFT is written as
(6)
where S
Rr
(p) is the p-th subcarrier component of the OFDMA signal transmitted from the r-th
relay, G
r,i
(p) denotes the channel gain at the p-th subcarrier from the r-th
relay to the i-th
destination, calculated using (4) by replacing h
i,r
(l) by g
r,i
(l), and γ
i
(p) is the AWGN’s with
variance
.
By substituting (2) and (5) into (6), we obtain
(7)
where
(8)
(9)
(10)
(.)
*
is the conjugate and
To ensure that all relays transmit data with total energy P
r
, the transmit beamforming
weight vector should satisfy
(11)
From (7), the instantaneous SNR of the p-th subcarrier at the i-th destination can be
expressed as
where
(13)
Let define
and since
is assumed in (11), (12) can be
written as
From (14), the source destination channel capacity of the p-th subcarrier for the i-th user is
given by
where B is the total bandwidth. It can be seen from (15) that in order to maximize the
aggregate channel capacity, each destination’s SNR should be maximized at each subcarrier.
Therefore, we develop in the following section a transmit beamforming technique that
maximizes the SNR at each destination and for each subcarrier.
3.2 Derivation of the distributed transmit beamforming weight
To combat fading effects and then improve the link level performance, the distributed
spatial diversity created by the relay nodes can be effectively exploited using a transmit
diversity weight technique. To determine the transmit beamforming vector we develop the
optimal weight vector that maximizes the SNR at the destination given by (14), as
The weight optimization criterion expressed by (16) is in the form of Rayleigh quotient, and
can be derived by solving the generalized Eigen-value problem (Yi & Kim, 2007; AitFares et
al., 2009 a). Hence, for any weight vector
, we have
(17)
where
is the largest Eigen-value of
.
The equality holds if
(18)
where
. (19)
JointCooperativeDiversityandSchedulinginOFDMARelaySystem 219
(a, b, and c), such as jointly AF and CDD proposed in (Tarasak & Lee, 2008), jointly AF and
DTB or jointly AF, DTB and fixed CDD as will be studied in the following.
Fig. 10. Relay node structure using different cooperative techniques.
In AF scheme, the relay normalizes its received signal by multiplying it with a relay gain
given by
. (3)
With channel order equal to L, the channel gain H
i,r
(p) at the p-th
subcarrier can be written
as
(4)
The output of the transmit beamforming can be expressed by
(5)
where W
TB,r
(p) represents the weight element of the p-th
subcarrier at the r-th
relay.
The received signal at the i-th
destination after performing FFT is written as
(6)
where S
Rr
(p) is the p-th subcarrier component of the OFDMA signal transmitted from the r-th
relay, G
r,i
(p) denotes the channel gain at the p-th subcarrier from the r-th
relay to the i-th
destination, calculated using (4) by replacing h
i,r
(l) by g
r,i
(l), and γ
i
(p) is the AWGN’s with
variance
.
By substituting (2) and (5) into (6), we obtain
(7)
where
(8)
(9)
(10)
(.)
*
is the conjugate and
To ensure that all relays transmit data with total energy P
r
, the transmit beamforming
weight vector should satisfy
(11)
From (7), the instantaneous SNR of the p-th subcarrier at the i-th destination can be
expressed as
where
(13)
Let define
and since
is assumed in (11), (12) can be
written as
From (14), the source destination channel capacity of the p-th subcarrier for the i-th user is
given by
where B is the total bandwidth. It can be seen from (15) that in order to maximize the
aggregate channel capacity, each destination’s SNR should be maximized at each subcarrier.
Therefore, we develop in the following section a transmit beamforming technique that
maximizes the SNR at each destination and for each subcarrier.
3.2 Derivation of the distributed transmit beamforming weight
To combat fading effects and then improve the link level performance, the distributed
spatial diversity created by the relay nodes can be effectively exploited using a transmit
diversity weight technique. To determine the transmit beamforming vector we develop the
optimal weight vector that maximizes the SNR at the destination given by (14), as
The weight optimization criterion expressed by (16) is in the form of Rayleigh quotient, and
can be derived by solving the generalized Eigen-value problem (Yi & Kim, 2007; AitFares et
al., 2009 a). Hence, for any weight vector
, we have
(17)
where
is the largest Eigen-value of
.
The equality holds if
(18)
where
. (19)
MobileandWirelessCommunications:Physicallayerdevelopmentandimplementation220
By using this derived optimal transmit beamforming that maximizes the SNR at the
destination, the aggregate channel capacity is significantly enhanced while in parallel the
per-link capacity is not much improved and in particularly in slow-varying fading scenario.
To overcome this problem we applied the fixed cyclic delay diversity (CDD) approach
(Tarasak & Lee, 2007; Tarasak & Lee, 2008) in the time domain (after IFFT) at relay nodes as
shown in Fig. 10 (c) in order to create a phase rotation in frequency domain and hence the
scheduler will offer opportunity to more users to get channel access. Hence, after
performing IFFT at the r-th relay, the output of the fixed CCD block is given by
(20)
where
represents the l-th element of the IFFT of the
signal and
represents
the cyclic delay value used at the r-th relay.
is selected as a fixed cyclic delay given by
where represents the nearest integer function of x.
Subsequently by using the fixed CDD approach, the instantaneous SNR given in (14) is
expressed as
where
(23)
and
An adaptive scheduling in OFDMA-based relay network is adopted to allocate the
subcarriers to each source based on SNR channel assignment approach. This adaptive
scheduler allocates the p-th subcarrier to the i-th user destination pair with the highest SNR
such that
Two significant measured performances, highlighted in Fig.8, are studied, the aggregate
throughput and the per-link throughput. By ignoring the loss from GI, the aggregate
throughput (in bit per complex dimension) is expressed by
While the per-link throughput or average user throughput is defined by
where Г is the set of subcarriers allocated to the i-th user and M represents the number of
user-destination pairs.
It should be noticed from (26-27) that increasing the user-destination pairs increases the
aggregate throughput while the per-link throughput is reduced since the number of
allocated subcarriers for each user is largely reduced. Hence using our proposed JCDS with
adaptive scheduling based on SNR channel assignment; a trade-off between aggregate
throughput and per-link throughput is achieved and that guarantees the per-link
throughout to have at least the same QoS as in the static scheduling (SS) where all users get
an equal share of the allocated resources.
4. Computer simulation results
In this section, we compare the performance of the proposed JCDS using both DTB and
fixed CDD with different cooperative diversity techniques such as JCDS with DTB, JCDS
with AF and JCDS with fixed CDD where adaptive scheduling based on SNR channel
assignment is employed. This adaptive scheduler allocates the subcarriers to the source
whose SNR is highest as illustrated in the example shown in Fig. 5. Both techniques, JCDS-
AF and JCDS-CDD, are using equal divided transmit power at relay stations, i.e., P=P
r
/R.
While, in JCDS-DTB the relays are using DTB under constraint of (11). We evaluate the
system performance by taking the same simulation scenario presented in (Tarasak & Lee,
2007) for comparison purpose. In this scenario, two types of fading are studied, the flat
fading where the normalized rms delay spread (߬
௦
) is relatively short and equals to 0.3;
corresponding to L=3, and the frequency selective fading where the normalized rms delay
spread is relatively large and equal to 1.5; corresponding to L=15. The number N
c
of
subcarriers is equal to 256, R=20 and the average SNR at the relay and at the destination are
defined to be the same 20dB which is equivalent toߪ
ோ
ଶ
ൌߪ
ଶ
ൌͲǤͲͳǤ
Fig. 11 illustrates the cumulative distribution functions (CDF) of the aggregate throughput,
P(C
agr
<throughput), and the per-link throughput, P(C
per-link
<throughput) in short delay
spread scenario ሺ߬
௦
ൌͲǤ͵ሻusing our proposed method; i.e., JCDS with DTB and CDD for
different user-destination pairs. Aggregate and per-link throughput’s results are shown by
solid and dashed lines, respectively. A comparison of the static scheduling with R=1 (single
relay node), in which the aggregate throughput and per-link throughput are equal, is also
studied. It should be noticed that when M=1 (single source-destination pair), the aggregate
throughput is equal to the per-link throughput and the employed adaptive scheduler is
equivalent to the static scheduling. Hence, from Fig. 11, by comparing the throughput using
static scheduling and R=1 with that of our proposed method using M=1 and R=20, we can
see clearly the cooperative relay diversity gain.
Furthermore, we can observe as well the user diversity effect in both aggregate and per-link
throughputs. It is intuitively clear that when the number of users increases the aggregate
throughput is improving since the scheduler switches to the user whose link is better. In
contrast, the per-link throughput is decreasing when the number of source-destination pairs
is getting higher. Thus the QoS of each source-destination pair is severely affected due to the
reduced number of assigned subcarriers. In addition, at 1% outage per-link throughput, if
we want to maintain the per-link throughput at least equal to that of static scheduling, it is
seen that 5 users can be handled by this system.
JointCooperativeDiversityandSchedulinginOFDMARelaySystem 221
By using this derived optimal transmit beamforming that maximizes the SNR at the
destination, the aggregate channel capacity is significantly enhanced while in parallel the
per-link capacity is not much improved and in particularly in slow-varying fading scenario.
To overcome this problem we applied the fixed cyclic delay diversity (CDD) approach
(Tarasak & Lee, 2007; Tarasak & Lee, 2008) in the time domain (after IFFT) at relay nodes as
shown in Fig. 10 (c) in order to create a phase rotation in frequency domain and hence the
scheduler will offer opportunity to more users to get channel access. Hence, after
performing IFFT at the r-th relay, the output of the fixed CCD block is given by
(20)
where
represents the l-th element of the IFFT of the
signal and
represents
the cyclic delay value used at the r-th relay.
is selected as a fixed cyclic delay given by
where represents the nearest integer function of x.
Subsequently by using the fixed CDD approach, the instantaneous SNR given in (14) is
expressed as
where
(23)
and
An adaptive scheduling in OFDMA-based relay network is adopted to allocate the
subcarriers to each source based on SNR channel assignment approach. This adaptive
scheduler allocates the p-th subcarrier to the i-th user destination pair with the highest SNR
such that
Two significant measured performances, highlighted in Fig.8, are studied, the aggregate
throughput and the per-link throughput. By ignoring the loss from GI, the aggregate
throughput (in bit per complex dimension) is expressed by
While the per-link throughput or average user throughput is defined by
where Г is the set of subcarriers allocated to the i-th user and M represents the number of
user-destination pairs.
It should be noticed from (26-27) that increasing the user-destination pairs increases the
aggregate throughput while the per-link throughput is reduced since the number of
allocated subcarriers for each user is largely reduced. Hence using our proposed JCDS with
adaptive scheduling based on SNR channel assignment; a trade-off between aggregate
throughput and per-link throughput is achieved and that guarantees the per-link
throughout to have at least the same QoS as in the static scheduling (SS) where all users get
an equal share of the allocated resources.
4. Computer simulation results
In this section, we compare the performance of the proposed JCDS using both DTB and
fixed CDD with different cooperative diversity techniques such as JCDS with DTB, JCDS
with AF and JCDS with fixed CDD where adaptive scheduling based on SNR channel
assignment is employed. This adaptive scheduler allocates the subcarriers to the source
whose SNR is highest as illustrated in the example shown in Fig. 5. Both techniques, JCDS-
AF and JCDS-CDD, are using equal divided transmit power at relay stations, i.e., P=P
r
/R.
While, in JCDS-DTB the relays are using DTB under constraint of (11). We evaluate the
system performance by taking the same simulation scenario presented in (Tarasak & Lee,
2007) for comparison purpose. In this scenario, two types of fading are studied, the flat
fading where the normalized rms delay spread (߬
௦
) is relatively short and equals to 0.3;
corresponding to L=3, and the frequency selective fading where the normalized rms delay
spread is relatively large and equal to 1.5; corresponding to L=15. The number N
c
of
subcarriers is equal to 256, R=20 and the average SNR at the relay and at the destination are
defined to be the same 20dB which is equivalent toߪ
ோ
ଶ
ൌߪ
ଶ
ൌͲǤͲͳǤ
Fig. 11 illustrates the cumulative distribution functions (CDF) of the aggregate throughput,
P(C
agr
<throughput), and the per-link throughput, P(C
per-link
<throughput) in short delay
spread scenario ሺ߬
௦
ൌͲǤ͵ሻusing our proposed method; i.e., JCDS with DTB and CDD for
different user-destination pairs. Aggregate and per-link throughput’s results are shown by
solid and dashed lines, respectively. A comparison of the static scheduling with R=1 (single
relay node), in which the aggregate throughput and per-link throughput are equal, is also
studied. It should be noticed that when M=1 (single source-destination pair), the aggregate
throughput is equal to the per-link throughput and the employed adaptive scheduler is
equivalent to the static scheduling. Hence, from Fig. 11, by comparing the throughput using
static scheduling and R=1 with that of our proposed method using M=1 and R=20, we can
see clearly the cooperative relay diversity gain.
Furthermore, we can observe as well the user diversity effect in both aggregate and per-link
throughputs. It is intuitively clear that when the number of users increases the aggregate
throughput is improving since the scheduler switches to the user whose link is better. In
contrast, the per-link throughput is decreasing when the number of source-destination pairs
is getting higher. Thus the QoS of each source-destination pair is severely affected due to the
reduced number of assigned subcarriers. In addition, at 1% outage per-link throughput, if
we want to maintain the per-link throughput at least equal to that of static scheduling, it is
seen that 5 users can be handled by this system.
MobileandWirelessCommunications:Physicallayerdevelopmentandimplementation222
Fig. 11. CDF of the aggregate and per-link throughput for short delay spread (߬
௦
ൌͲǤ͵)
using JCDS with DTB and fixed CDD.
Fig. 12. 1% outage throughput comparaison for short delay spread (߬
௦
ൌͲǤ͵) using
different cooperation diversity methods.
Fig. 12 compares the 1% outage aggregate throughput and 1% outage per-link throughput,
using different cooperative diversity and scheduling approach in short delay spread
0 1 2 3 4 5 6
10
-3
10
-2
10
-1
10
0
Probability
Throughput [bps/Hz]
Per-link throughput
Aggregate throughput
Static Scheduling
M=1, , 6
M=1, , 6
1 1.5 2 2.5 3 3.5 4 4.5 5 5.5 6
0
0.5
1
1.5
2
2.5
3
3.5
4
4.5
5
Number of source-destination pairs M
1% Outage aggregate throughput [bps/Hz]
JCDS-(DTB and CDD) with R=20
JCDS-DTB with R=20
JCDS-CDD with R=20
JCDS-AF with R=20
JCDS-(DTB and CDD) with R=1 and SS
Static Scheduling with R=1
scenario in terms of the number M of source-destination pairs. Aggregate and per-link
throughput’s results are shown by solid and dashed lines, respectively. From this figure,
and for aggregate throughput curves comparison, we notice that the aggregate throughput
of all cooperative diversity techniques exceeds that of the static scheduling with R=1. In
addition, the throughput using JCDS - DTB is the largest followed by JCDS with DTB &
CDD and both of them significantly outperform the JCDS with DTB & CDD using static
scheduling with R=20. Moreover, the aggregate throughputs obtained by using JCDS-CDD
and JCDS-AF exceed that of using JCDS with DTB & CDD using static scheduling with R=20
when M>1 and M>3, respectively. However, for per-link throughput curves comparison in
the same figure, we notice that the per-link throughputs of all cooperative diversity
techniques are lower than those of the JCDS–(DTB & CDD) with R=20 and using static
scheduling. This indicates the impact of the unfair SNR assignment relative to user
throughput. In addition, the per-link throughput using JCDS-(DTB & CDD) is the largest
followed by JCDS–CDD. The JCDS–(DTB & CDD) achieves the highest throughput while
JCDS-DTB and JCDS-AF have the worst performance. By comparing aggregate and per-link
throughputs of JCDS-(DTB & CDD) with JCDS–DTB, the proposed method JCDS–(DTB &
CDD) sacrifices a small quantity of the aggregate throughput in return for significant
improvement in the per-link throughput.
Using the same propagation environment but having long normalized delay spread
(߬
௦
ൌͳǤͷ), Fig. 13 illustrates CDFs of the aggregate throughput and per-link throughput
using our proposed JCDS with DTB and CDD method for different number M of source-
destination pairs. Similar observation given in Fig.11 can be provided herein regarding the
cooperative diversity gain and user diversity gain which are positive on the aggregate
throughput and negative on the per-link throughput. However, we notice that all per-link
throughput curves exceed largely that of static scheduling with R=1. This can be explained
by the higher multipath diversity in the large delay spread scenario where more fluctuation
in frequency domain is provided and hence more users are scheduled.
JointCooperativeDiversityandSchedulinginOFDMARelaySystem 223
Fig. 11. CDF of the aggregate and per-link throughput for short delay spread (߬
௦
ൌͲǤ͵)
using JCDS with DTB and fixed CDD.
Fig. 12. 1% outage throughput comparaison for short delay spread (߬
௦
ൌͲǤ͵) using
different cooperation diversity methods.
Fig. 12 compares the 1% outage aggregate throughput and 1% outage per-link throughput,
using different cooperative diversity and scheduling approach in short delay spread
0 1 2 3 4 5 6
10
-3
10
-2
10
-1
10
0
Probability
Throughput [bps/Hz]
Per-link throughput
Aggregate throughput
Static Scheduling
M=1, , 6
M=1, , 6
1 1.5 2 2.5 3 3.5 4 4.5 5 5.5 6
0
0.5
1
1.5
2
2.5
3
3.5
4
4.5
5
Number of source-destination pairs M
1% Outage aggregate throughput [bps/Hz]
JCDS-(DTB and CDD) with R=20
JCDS-DTB with R=20
JCDS-CDD with R=20
JCDS-AF with R=20
JCDS-(DTB and CDD) with R=1 and SS
Static Scheduling with R=1
scenario in terms of the number M of source-destination pairs. Aggregate and per-link
throughput’s results are shown by solid and dashed lines, respectively. From this figure,
and for aggregate throughput curves comparison, we notice that the aggregate throughput
of all cooperative diversity techniques exceeds that of the static scheduling with R=1. In
addition, the throughput using JCDS - DTB is the largest followed by JCDS with DTB &
CDD and both of them significantly outperform the JCDS with DTB & CDD using static
scheduling with R=20. Moreover, the aggregate throughputs obtained by using JCDS-CDD
and JCDS-AF exceed that of using JCDS with DTB & CDD using static scheduling with R=20
when M>1 and M>3, respectively. However, for per-link throughput curves comparison in
the same figure, we notice that the per-link throughputs of all cooperative diversity
techniques are lower than those of the JCDS–(DTB & CDD) with R=20 and using static
scheduling. This indicates the impact of the unfair SNR assignment relative to user
throughput. In addition, the per-link throughput using JCDS-(DTB & CDD) is the largest
followed by JCDS–CDD. The JCDS–(DTB & CDD) achieves the highest throughput while
JCDS-DTB and JCDS-AF have the worst performance. By comparing aggregate and per-link
throughputs of JCDS-(DTB & CDD) with JCDS–DTB, the proposed method JCDS–(DTB &
CDD) sacrifices a small quantity of the aggregate throughput in return for significant
improvement in the per-link throughput.
Using the same propagation environment but having long normalized delay spread
(߬
௦
ൌͳǤͷ), Fig. 13 illustrates CDFs of the aggregate throughput and per-link throughput
using our proposed JCDS with DTB and CDD method for different number M of source-
destination pairs. Similar observation given in Fig.11 can be provided herein regarding the
cooperative diversity gain and user diversity gain which are positive on the aggregate
throughput and negative on the per-link throughput. However, we notice that all per-link
throughput curves exceed largely that of static scheduling with R=1. This can be explained
by the higher multipath diversity in the large delay spread scenario where more fluctuation
in frequency domain is provided and hence more users are scheduled.
MobileandWirelessCommunications:Physicallayerdevelopmentandimplementation224
Fig. 13. CDF of the aggregate and per-link throughput for long delay spread (߬
௦
ൌͳǤͷ)
using JCDS with DTB and CDD.
Fig. 14 compares the 1% outage aggregate and per-link throughputs, using different
cooperative diversity and scheduling approaches in long delay spread scenario (߬
௦
ൌͳǤͷ)
in terms of the number M of source-destination pairs. Aggregate and per-link throughput’s
results are shown by solid and dashed lines, respectively. From this figure, and for
aggregate throughput curves comparison, the gain of the aggregate throughput using all
JCDS techniques with static scheduling is smaller compared to short delay case (߬
௦
ൌͲǤ͵).
Also, the aggregate throughput of all cooperative diversity techniques exceeds that of the
static scheduling. However, for per-link throughput curves comparison in the same figure,
we notice that the per-link throughput of JCDS-(DTB& CDD) is the best followed by JCDS-
CDD and both of them outperform that of static scheduling with R=1 irrespective to the
number M of source-destination pairs. This result is due to the increase in frequency
selectivity in such long delay spread channel. Moreover, the JCDS-(DTB & CDD) achieves
highest throughput while JCDS with DTB provides the lowest throughput when M>1. When
M=2, the JCDS- (DTB & CDD) achieves the highest throughput due to the increase in path
and user diversities.
0 1 2 3 4 5 6
10
-3
10
-2
10
-1
10
0
Throughput [bps/Hz]
Probability
Per-link throughput
M=2, ,6
M=1, , 6
Aggregate throughput
Static Scheduling
Fig. 14. 1% outage throughput comparaison for long delay spread (߬
௦
ൌͳǤͷ) using
different cooperation methods.
5. Conclusion
In this Chapter, we studied the JCDS for active source/destination pairs in OFDMA-based
relay system. We investigated the performance of the JCDS technique by introducing and
developing a distributed transmit beamforming approach jointly used with cyclic delay
diversity (CDD) at the relay nodes. Combining transmit beamforming with fixed CDD
approach creates more fluctuation among subcarriers and gives more opportunity to users
to access to the channel and thus to increase considerably the diversity order and the
throughput performance. Therefore, time-varying SNR at the destination is created and
more users can be efficiently assigned by the scheduler. Simulation results show that the
system performance using our proposed JCDS improves considerably compared with the
other previously proposed cooperative diversity techniques.
6. References
Acharya, S. (2008). Worldwide mobile cellular subscribers to reach 4 billion mark late 2008,
International Telecommunication Union Statistics, 2008,
Adachi, F. & Kudoh, E. (2007). New direction of broadband wireless technology, (invited)
Wireless Communications and Mobile Computing, vol. 7, no. 8 (Special Issue on Asia-
Pacific B3G R&D Activities and Technology Innovations), pp.969-983, Oct. 2007.
1 1.5 2 2.5 3 3.5 4 4.5 5 5.5 6
0
0.5
1
1.5
2
2.5
3
3.5
4
4.5
5
Number of source-destination pairs M
1% Outage aggregate throughput [bps/Hz]
JCDS-(DTB and CDD) with R=20
JCDS-DTB with R=20
JCDS-CDD with R=20
JCDS-AF with R=20
JCDS-(DTB and CDD) with R=1 and SS
Static Scheduling with R=1
JointCooperativeDiversityandSchedulinginOFDMARelaySystem 225
Fig. 13. CDF of the aggregate and per-link throughput for long delay spread (߬
௦
ൌͳǤͷ)
using JCDS with DTB and CDD.
Fig. 14 compares the 1% outage aggregate and per-link throughputs, using different
cooperative diversity and scheduling approaches in long delay spread scenario (߬
௦
ൌͳǤͷ)
in terms of the number M of source-destination pairs. Aggregate and per-link throughput’s
results are shown by solid and dashed lines, respectively. From this figure, and for
aggregate throughput curves comparison, the gain of the aggregate throughput using all
JCDS techniques with static scheduling is smaller compared to short delay case (߬
௦
ൌͲǤ͵).
Also, the aggregate throughput of all cooperative diversity techniques exceeds that of the
static scheduling. However, for per-link throughput curves comparison in the same figure,
we notice that the per-link throughput of JCDS-(DTB& CDD) is the best followed by JCDS-
CDD and both of them outperform that of static scheduling with R=1 irrespective to the
number M of source-destination pairs. This result is due to the increase in frequency
selectivity in such long delay spread channel. Moreover, the JCDS-(DTB & CDD) achieves
highest throughput while JCDS with DTB provides the lowest throughput when M>1. When
M=2, the JCDS- (DTB & CDD) achieves the highest throughput due to the increase in path
and user diversities.
0 1 2 3 4 5 6
10
-3
10
-2
10
-1
10
0
Throughput [bps/Hz]
Probability
Per-link throughput
M=2, ,6
M=1, , 6
Aggregate throughput
Static Scheduling
Fig. 14. 1% outage throughput comparaison for long delay spread (߬
௦
ൌͳǤͷ) using
different cooperation methods.
5. Conclusion
In this Chapter, we studied the JCDS for active source/destination pairs in OFDMA-based
relay system. We investigated the performance of the JCDS technique by introducing and
developing a distributed transmit beamforming approach jointly used with cyclic delay
diversity (CDD) at the relay nodes. Combining transmit beamforming with fixed CDD
approach creates more fluctuation among subcarriers and gives more opportunity to users
to access to the channel and thus to increase considerably the diversity order and the
throughput performance. Therefore, time-varying SNR at the destination is created and
more users can be efficiently assigned by the scheduler. Simulation results show that the
system performance using our proposed JCDS improves considerably compared with the
other previously proposed cooperative diversity techniques.
6. References
Acharya, S. (2008). Worldwide mobile cellular subscribers to reach 4 billion mark late 2008,
International Telecommunication Union Statistics, 2008,
Adachi, F. & Kudoh, E. (2007). New direction of broadband wireless technology, (invited)
Wireless Communications and Mobile Computing, vol. 7, no. 8 (Special Issue on Asia-
Pacific B3G R&D Activities and Technology Innovations), pp.969-983, Oct. 2007.
1 1.5 2 2.5 3 3.5 4 4.5 5 5.5 6
0
0.5
1
1.5
2
2.5
3
3.5
4
4.5
5
Number of source-destination pairs M
1% Outage aggregate throughput [bps/Hz]
JCDS-(DTB and CDD) with R=20
JCDS-DTB with R=20
JCDS-CDD with R=20
JCDS-AF with R=20
JCDS-(DTB and CDD) with R=1 and SS
Static Scheduling with R=1
MobileandWirelessCommunications:Physicallayerdevelopmentandimplementation226
Adachi, F. (2008). Challenge for 4G wireless, GCOE Workshop on Advanced Wireless Signal
Processing and Networking Technology Tohoku University, 20-21 Aug. 2008.
/>achi.pdf.
Adinoyi, A. & Yanikomeroglu, H. (2006). Multi antenna aspects of wireless fixed relays, in
Proc. of IEEE Wireless Communications & Networking, vol.2, pp. 1021-1026, 2006.
AitFares, S.; Adachi, F & Kudoh,E. (2009). Novel Cooperative Relaying Network Scheme
with Inter-Relay Data Exchange, IEICE Transaction on Communications, vol. E92-B,
no.05, May 2009.
AitFares, S.; Adachi, F & Kudoh, E. (2009). Joint cooperative diversity and scheduling with
distributed transmit beamforming in OFDMA relay system, Submitted to Personal,
Indoor and Mobile Radio Communications Symposium 2009 (PIMRC’09), April 2009.
Bletsas et al., (2006). A simple cooperative diversity method based on network path
selection, IEEE Journal on Selected Areas in Comm., vol. 24, no. 3, pp. 659-672, 2006.
Dau, I; Kudoh, E. & Adachi, F. (2008). Multi-hop link capacity of multi-route multi-hop
MRC diversity for a virtual cellular network, IEICE Trans. Commun., vol.E91-B,
no.5, pp. 1568-1574, May, 2008.
El-Alami, L.S.; Kudoh, E. & Adachi, F. (2006). Blocking probability of a DS-CDMA multi-
hop virtual cellular network, IEICE Trans. Fundamentals, vol. E89-A, no.7, pp.1875-
1883, July 2006.
Fitzek, F. H. P. & Katz, M. D. (2006). Cooperation in wireless networks: Principles and
Applications, Springer, 2006.
Florea, A. & Yanikomeroglu, H. (2005). On the optimal number of hops in infrastructure-
based fixed relay networks, in Proc. of IEEE Globecom, vol. 6, pp. 3242- 3247, 2005.
Hammerstrom, I.; Kuhm, M. & Wittneben, A. (2004). Cooperative diversity by relay phase
rotations in block fading environments, in Proc. Fifth IEEE Workshop on SPAWC, pp.
293-297, July 2004.
Kitao, K.; Ichitsubo, S. (2004). Path loss prediction formula for microcell in 400 MHz to 8
GHz band, Electronics Letters, vol. 40, no. 11, pp. 685 – 687, May 2004.
Laneman, J. N; Tse, D. N. & Wornell, G. W. (2003). Cooperative diversity in wireless
networks: Efficient protocols and outage behavior, IEEE Trans. Inform. Theory,
2003.
Tarasak, P. & Lee, Y. H. (2007). Joint cooperative diversity and scheduling in OFDMA relay
systems, in Proc. IEEE WCNC’2007, pp. 980-984, March 2007.
Tarasak, P. & Lee, Y. H. (2008). Joint cooperative diversity and proportional fair scheduling
in OFDMA relay systems, in Proc. IEEE, VTC’2008, pp.1-5, Sept. 2008.
Wang, C.; Yuan, T. & Yang, D. (2007). Cooperative relay network configuration with spatial
multiplexing and beamforming, International Conf. on Wireless Communications,
Networking and Mobile Computing, pp.137 – 140, Sept. 2007.
Wittneben, A. et al, (2004). Joint cooperative diversity and scheduling in low mobility
wireless netwotks, in Proc. IEEE Globecom, vol. 2, pp. 780-784, Dec. 2004.
Wong, I.C.; Shen, Z.; Evans, B.L.& Andrews, J.G. (2004). Low complexity algorithm for
proportional resource allocation in OFDMA systems, in Proc. IEEE Workshop on
Signal Processing Systems, pp. 1-6, Dec. 2004.
Yi, Z. & Kim, I. (2007). Joint optimization of relay-precoders and decoders with partial
channel side information in cooperative networks,
IEEE Journal on Selected Areas in
Communications, vol. 25, no. 2, pp. 447-458, Feb. 2007.
PerformanceModellingandAnalysisofMobileWirelessNetworks 227
PerformanceModellingandAnalysisofMobileWirelessNetworks
CarmenB.Rodríguez-Estrello,GenaroHernándezValdezandFelipeA.CruzPérez
X
Performance Modelling and Analysis of
Mobile Wireless Networks
Carmen B. Rodríguez-Estrello
1
, Genaro Hernández Valdez
2
and Felipe A. Cruz Pérez
1
Electric Engineering Department, CINVESTAV-IPN
1
Electronics Department, UAM-A
2
Mexico
1. Introduction
Nowadays, mobile wireless communications are continuously experiencing a growing
demand. Therefore, communication systems must be designed and/or enhanced to increase
their capacity. In that sense, mathematical analysis must be the first step of designing or
improving a network. Thus, powerful mathematical tools which take into account most of
the involved parameters in network performance are required to analyze mobile wireless
networks.
Wireless networks could be analyzed from link level approach or from system level
approach in terms of Quality of Service (QoS). Link level analysis is related to the physical
channel characterization and involves statistics such as the probability distributions of the
channel states duration, which, in general, are not easily obtained at real cellular networks.
In contrast, system level analysis is associated with the characterization of the network’s
dynamic and involves variables such as channel holding times for successfully and forced
terminated calls which are easily obtained at real networks.
QoS in mobile wireless networks means the level of usability and reliability of a network
and its services. Consequently, QoS for mobile wireless networks are the basis of dimension
and planning. The main concern for an operator is the accessibility and continuity of the
connection. As a result, it has been widely accepted that call forced termination probability
is one of the most important QoS performance metrics in cellular networks. Forced
termination is due to two fundamental features: resource insufficiency and link unreliability.
In order to adequately model mobile cellular networks at system level, its mathematical
analysis should consider both causes of call forced termination: resource insufficiency and
wireless link unreliability. In the literature, resource insufficiency has been widely studied at
system level while link unreliability has not been included at system level analysis due to its
inclusion entails.
On the other hand, Code Division Multiple Access (CDMA) has been selected as the main
multiple access technology of several third generation cellular network standards (Dahlman
et al., 2007). CDMA-based cellular systems employ universal frequency reuse factor which
makes them interference limited. Consequently, capacity is a direct function of interference
13
MobileandWirelessCommunications:Physicallayerdevelopmentandimplementation228
generated by the users. That is, the number of available radio resources depends on the
interference. This special feature is known as “soft capacity”. Thus, to correctly asses the
performance of a CDMA system it is imperative to consider the effect of interference. The
aim of this chapter is to present the mathematical analysis of a CDMA-based system
considering link unreliability in a system level analysis, which has been traditionally
considered only at link level analysis.
2. Overview of call forced termination analysis in mobile wireless networks
One of the most important QoS metrics for the performance evaluation of present and future
mobile wireless networks is call forced termination probability. The call forced termination
probability is the probability that a call which is not initially blocked be interrupted. In
mobile wireless networks, a call is forced to terminate because of two fundamental features:
resource insufficiency and link unreliability. Moreover, in the context of packet switched
mobile communication networks, call forced termination probability is especially important
in the performance evaluation of conversational and real-time services (i.e., voice, audio,
music, videophone, videoconference etc.) (Li et al., 2004; Wong et al., 2004).
2.1 Resource insufficiency
When a mobile user moves into a different cell during the course of a call, a handoff must be
performed. If no radio resources are available in the target cell, the call is said to be forced to
terminate due to resource insufficiency. However, in a well-established cellular network and
from the call forced termination point of view, handoff failure can be usually a negligible
event (Boggia et al., 2005).
2.2 Link unreliability
Physical link is said to be unreliable if the experienced signal-to-interference ratio (SIR) is
below than a minimum required value (SIR threshold) for more than a specified period of
time (time threshold). During the course of a call, the physical link between base station and
mobile station may suffer link unreliability due to propagation impairments such as multi-
path fading, shadowing or path loss, and interference. In CDMA-based systems, link
unreliability is experimented due to the initial power allocation. The initial handoff
decisions are made for individual connections independent of the other connections or the
BS power availability. Therefore, current connections may suffer from link unreliability
(Zhao et al., 2006). Hence, the call may be abnormally terminated. In this case, the call is said
to be forced to terminate due to link unreliability. In particular, the analysis of measured
data traffic supplied by Vodafone Italy is a good example for these phenomena (Boggia et
al., 2005). However, only relatively few recent studies have addressed the effect of link
unreliability on the performance of mobile wireless communication networks (Elsharabwy
& Le-Ngoc, 2005; Zhang & Song, 2006; Zhang & Song, 2005; Zhao et al., 2006; Liu & Sule,
2004; Naraghi Pour & Chai, 2006; Kong, 2002).
Most of the work devoted to study the impact of link unreliability on system performance
has considered a link level channel model in order to study how the channel impairments
affect system performance. Gilbert Elliot and Fritchman channel models have been widely
used for this purpose. For instance, authors of (Kong, 2002) proposed a queuing system with
PerformanceModellingandAnalysisofMobileWirelessNetworks 229
generated by the users. That is, the number of available radio resources depends on the
interference. This special feature is known as “soft capacity”. Thus, to correctly asses the
performance of a CDMA system it is imperative to consider the effect of interference. The
aim of this chapter is to present the mathematical analysis of a CDMA-based system
considering link unreliability in a system level analysis, which has been traditionally
considered only at link level analysis.
2. Overview of call forced termination analysis in mobile wireless networks
One of the most important QoS metrics for the performance evaluation of present and future
mobile wireless networks is call forced termination probability. The call forced termination
probability is the probability that a call which is not initially blocked be interrupted. In
mobile wireless networks, a call is forced to terminate because of two fundamental features:
resource insufficiency and link unreliability. Moreover, in the context of packet switched
mobile communication networks, call forced termination probability is especially important
in the performance evaluation of conversational and real-time services (i.e., voice, audio,
music, videophone, videoconference etc.) (Li et al., 2004; Wong et al., 2004).
2.1 Resource insufficiency
When a mobile user moves into a different cell during the course of a call, a handoff must be
performed. If no radio resources are available in the target cell, the call is said to be forced to
terminate due to resource insufficiency. However, in a well-established cellular network and
from the call forced termination point of view, handoff failure can be usually a negligible
event (Boggia et al., 2005).
2.2 Link unreliability
Physical link is said to be unreliable if the experienced signal-to-interference ratio (SIR) is
below than a minimum required value (SIR threshold) for more than a specified period of
time (time threshold). During the course of a call, the physical link between base station and
mobile station may suffer link unreliability due to propagation impairments such as multi-
path fading, shadowing or path loss, and interference. In CDMA-based systems, link
unreliability is experimented due to the initial power allocation. The initial handoff
decisions are made for individual connections independent of the other connections or the
BS power availability. Therefore, current connections may suffer from link unreliability
(Zhao et al., 2006). Hence, the call may be abnormally terminated. In this case, the call is said
to be forced to terminate due to link unreliability. In particular, the analysis of measured
data traffic supplied by Vodafone Italy is a good example for these phenomena (Boggia et
al., 2005). However, only relatively few recent studies have addressed the effect of link
unreliability on the performance of mobile wireless communication networks (Elsharabwy
& Le-Ngoc, 2005; Zhang & Song, 2006; Zhang & Song, 2005; Zhao et al., 2006; Liu & Sule,
2004; Naraghi Pour & Chai, 2006; Kong, 2002).
Most of the work devoted to study the impact of link unreliability on system performance
has considered a link level channel model in order to study how the channel impairments
affect system performance. Gilbert Elliot and Fritchman channel models have been widely
used for this purpose. For instance, authors of (Kong, 2002) proposed a queuing system with
impaired wireless channel based on the Markov chain approach assuming that the
unreliable wireless channel can be modeled by the Gilbert–Elliott channel model. Analysis is
performed assuming that each state of the wireless channel is
a node. Then, service rate
becomes time-varying due to propagation impairments. A model to quantify the
performance of a queue with respect to such impaired wireless channel is then developed.
In a similar work (Elsharabwy & Le-Ngoc, 2005), the Gilbert-Elliot channel model is
proposed for the downlink performance evaluation of WCDMA cellular systems. In
addition, the Gilbert-Elliot channel parameters in terms of the mean fade and non-fade
durations are obtained. The proposed QoS performance metrics are based on the satisfied-
user criteria recommended by UMTS (i.e., satisfied user probability for speech services and
satisfied user probability for data services). Specifically, (Elsharabwy & Le-Ngoc, 2005),
deals with the UMTS QoS recommendation for packet based networks. Authors in
(Elsharabwy & Le-Ngoc, 2005), propose a composite performance index (called satisfied-
user probability) based on dropped-call probability and session outage percentage due to
link unreliability in wireless communication networks. This performance index is calculated
by considering a Gilbert-Elliot channel model with negative exponentially distributed state
durations. However, none of the above papers considers users’ mobility. Consequently, call
forced termination due to resource insufficiency is not addressed.
Other related papers devoted to study the impact of link unreliability on system
performance are (Zhang & Song, 2006), (Zhang & Song, 2005), which use either the Gilbert-
Elliot or Fritchman model to characterize the time-variant wireless channel. Zhang et al.
derived mathematical expressions for the probability that a call be successfully completed
considering the concurrent impacts of bad quality in the channel and the lack of radio
resources. Zhang studied the impact of Rayleigh fast-fading on various teletraffic QoS
metrics in wireless networks (i.e., channel holding time, handoff probability, handoff call
arrival rate, call blocking probability, call completion probability, and call forced
termination probability) taking into account carrier frequency, maximum Doppler frequency
and fade margin. From teletraffic point of view, system level-based modeling of link
unreliability is preferred over link level-based modeling because fewer state variables are
needed. However, mathematical models considered in (Elsharabwy & Le-Ngoc, 2005),
(Zhang & Song, 2006), (Zhang & Song, 2005), (Zhao et al., 2006), (Naraghi Pour & Chai,
2006), (Kong, 2002) are based on link level statistics which are not easily obtained by direct
measures. Contrary to the Zhang’s works, here, the effect of link unreliability is captured
through easily obtained system level quantities which allows including the effect of link
unreliability on the channel occupancy directly in the teletraffic analysis.
Only few recently published studies have addressed system level analysis considering link
unreliability for wireless networks (Liu & Sule, 2004; Rodríguez-Estrello et al., 2009). In (Liu
& Sule, 2004), a queuing model to evaluate the performance of CDMA reverse link in a
multiple cell scenario was developed. In that work, a quasi-birth-and-death process was
used to capture the variation of traffic loads in cells. Then, authors of (Liu & Sule, 2004),
obtained the stationary distribution of the system and some performance indicators, such as
the outage probability of existing calls, blocking probability of new calls, average carried
traffic in a cell, and dropping frequency of ongoing calls. Nonetheless, neither mobility of
users nor soft handoff are modeled in (Liu & Sule, 2004). Recently, a teletraffic model to
evaluate the performance of TDMA/FDMA-based cellular networks considering both
resource insufficiency and link unreliability (Rodríguez-Estrello et al., 2009) was proposed.
MobileandWirelessCommunications:Physicallayerdevelopmentandimplementation230
The effect of link unreliability is captured by an interruption Poisson process, which is
characterized by the mean time of the “unencumbered call interruption time”. This interruption
process is characterized via system level statistics, based on channel holding time, which is
easily measured at base stations (BSs).
3. System model
To capture the main features of CDMA-based cellular systems in their performance
evaluation, geometrical, users’ mobility, interference, and call interruption characteristics
are considered.
3.1 Soft handoff geometrical model
A homogeneous mobile multi-cellular system with omni-directional antennas located at the
center of cells is assumed
1
. Base Stations (BSs) are assumed to use Frequency Division
Duplexing (FDD). As in previously published related studies (Zhang & Lea, 2006; Ma et al.,
2006; Hegde & Sohraby, 2002; Piao et al., 2006; Su et al., 1996 and Kim & Sung., 1999), we
focus on the reverse link as it was found to be the link that limits system performance.
Soft handoff process is performed when a MS receives comparable pilot signal strengths
from two or more BSs. At this moment, a communication path is established between the
MS and all BSs with comparable pilot signal strengths. Consequently, two or more BSs
receive independent streams from the MS. Independent streams can be combined (macro
diversity) so that the bit stream is decoded much more reliable than if only one BS were
receiving from the MS. When a pilot signal from one BS is considerably stronger than that
from the others BSs, the MS is then served by only one BS. Then, soft handoff process can
guarantee that the MS is always linked to the BS from which it receives the strongest pilot
(Garg, 2000). Here, it is assumed that the MS can communicate with the two nearest BSs
only, and, if only propagation path losses are considered
2
, the region where the soft handoff
process is performed is the ring area near the borders of the cell. Figure 1 depicts the
geometry of the analyzed cells. Ring area is used to represent the area where the soft
handoff process is performed.
Thus, an active user in the inner area, referred to as the hard region, is assumed to be
connected only to the nearest BS; while mobiles in the outer area, referred to as the soft
region, are assumed to be in soft handoff to its two nearest BS’s only. As seen in Figure 1, it
is clear that the “nominal” coverage of the analyzed cell is increased by the soft regions of
the adjacent cells.
The ratio between the area of the hard region to the total cell area (including the overlapped
area of the soft regions) is denoted by p while p’ is the ratio between the area of the hard
region to the nominal area of the cell, which is the area of the cell without considering
overlapped areas of soft handoff regions.
1
To simplify mathematical analysis, a first approach is to consider the use of omni-
directional antennas. Nonetheless some minor modifications need to be done when
directional case is considered.
2
This consideration is acceptable under not severe conditions of shadowing.