Mobile and wireless communications physical layer development and implementation Part 14 pdf
Bạn đang xem bản rút gọn của tài liệu. Xem và tải ngay bản đầy đủ của tài liệu tại đây (734.49 KB, 20 trang )
AUniedDataandEnergyModelforWireless
CommunicationwithMovingSendersandFixedReceivers 251
A Unied Data and Energy Model for Wireless Communication with
MovingSendersandFixedReceivers
ArminVeichtlbauerandPeterDornger
X
A Unified Data and Energy Model
for Wireless Communication with
Moving Senders and Fixed Receivers
Armin Veichtlbauer and Peter Dorfinger
Salzburg Research Forschungsgesellschaft mbH
Austria
1. Introduction
In recent years, the question of energy efficiency in ICT solutions has grown to a hot topic,
both in research and in product development. Especially for applications in the field the
efficient use of the available (stored or newly generated) energy is a precondition for the
desired functionality. Energy wasting is not only a question of expenses or of impacts to the
environment, but in many cases simply precludes the proper working of a sensor/actuator
control system.
Our research group has conducted several research projects during the last years in the area
of protocol optimisation in order to increase energy efficiency of wireless communication.
First we developed an energy model to conduct simulations which describe the energy
consumption of sending a well defined amount of data over a wireless link with fixed
properties. As variable parameters of this model we used the transmission power of the
sending antenna and the packet length of the transmitted data. This model already included
a stochastic part: The loss of the transmitted packets. The packet loss probability was
evidently dependent on the sending power. So far we followed the model of the group
around J.P. Ebert and A. Wolisz (Ebert et al., 2000; Ebert et al., 2002).
We then integrated a data model to simulate the amount of newly produced data
respectively data that has remained in the sending buffer, thus we generated a unified data
and energy model. Finally we integrated a distance model to simulate the changing
distances between the sender and the receiver. As a matter of simplicity (but without
spoiling the capabilities of the model) we assumed that the receiver is fixed, and the sender
is moving (Veichtlbauer & Dorfinger, 2007).
We conducted our research work within funded research projects: Autarchic Ski (ASki), GI
Platform Salzburg and the GI Tech Lab, all of them funded by the Austrian Federal Ministry
for Transport, Innovation, and Technology, in different funding schemes. Along with the
different projects came different application scenarios, e.g. the communication of intelligent
skis (which have sensors on board to measure for instance temperature or pressure during
runs) with base stations which analyse the collected sensor data (Veichtlbauer & Dorfinger,
14
MobileandWirelessCommunications:Physicallayerdevelopmentandimplementation252
2008; Veichtlbauer & Dorfinger, 2009) or the collaboration of a swarm of flying sensors
(Dorfinger & Veichtlbauer, 2008) for weather or gas density measurements.
2. Description of the Model
Our MATLAB/Simulink based „Unified Data and Energy Model” for wireless
communication takes into account both its energy and its data balance, i.e. it calculates the
amount of successfully transmitted and lost data per time unit and contrasts these values
with the consumed energy.
2.1 Modelling Approach
The goal in our setting was to maximize the amount of successfully transmitted data in
surroundings where energy is a scarce resource. For static scenarios (constant distance
between sender and receiver) a well proven model can be found in literature: The model of
J. P. Ebert and his team. Their mathematical analysis of wireless communication is based on
the Link Budget Analysis of Zyren and Petrik (Zyren & Petrik, 1998) and the Gilbert-Elliot
Bit Error Model (Gilbert, 1960).
The basic idea of Ebert’s model is to calculate an “energy per bit” value to quantify the
needed energy for the successful transmission of one bit, and to minimize this energy by
changing the sending power. He proves that with variation of sending power and keeping
all other parameters (like packet length, distance between sender and receiver, receiver gain,
etc.) constant, such a minimum can be found: Obviously, increasing sending power leads to
higher energy consumption of the sending attempts. On the other hand decreasing sending
power leads to increasing loss probability of a transmitted packet, thus causing
retransmissions of the lost packets (Ebert & Wolisz, 1999; Ebert & Wolisz, 2000; Burns &
Ebert, 2001). Using appropriate simulations, an optimum can be found easily.
This approach can be applied for multi-hop ad-hoc networks (Matzen et al., 2003; Ebert,
2004), considering different routes and using the shortest links to save energy (the energy
per bit value is lower for shorter distances), yet the dynamics (changing distances between
nodes) are still not considered. It is possible to send packets with well calculated sending
power at any time, but all data are sent immediately after their “production” (e.g. by sensors
which measure periodically some environmental parameters).
In our scenarios we considered a moving sender and (one or more) fixed receiver(s). For a
moving sender, it is profitable to consider also the sending times: Sending at the moment of
minimal distance will optimise the energy per bit value. Thus, we integrated a distance
model into our approach. The idea is to predict the further movement and to send during
the time(s), when the sender is closest to the receiver(s).
We used a time discrete approach for our model, as the data generation is done that way by
the sensors (depending on their sampling rate). Although we use the packet length as an
input factor, we do not use packet simulations. Bit errors influence the data flows in a
statistical manner, thus our model complies with the approach of Haber et al. (Haber et al.,
2003) for fluid simulations of data streams.
2.2 Model Assumptions
The basic assumptions for our model are:
AUniedDataandEnergyModelforWireless
CommunicationwithMovingSendersandFixedReceivers 253
2008; Veichtlbauer & Dorfinger, 2009) or the collaboration of a swarm of flying sensors
(Dorfinger & Veichtlbauer, 2008) for weather or gas density measurements.
2. Description of the Model
Our MATLAB/Simulink based „Unified Data and Energy Model” for wireless
communication takes into account both its energy and its data balance, i.e. it calculates the
amount of successfully transmitted and lost data per time unit and contrasts these values
with the consumed energy.
2.1 Modelling Approach
The goal in our setting was to maximize the amount of successfully transmitted data in
surroundings where energy is a scarce resource. For static scenarios (constant distance
between sender and receiver) a well proven model can be found in literature: The model of
J. P. Ebert and his team. Their mathematical analysis of wireless communication is based on
the Link Budget Analysis of Zyren and Petrik (Zyren & Petrik, 1998) and the Gilbert-Elliot
Bit Error Model (Gilbert, 1960).
The basic idea of Ebert’s model is to calculate an “energy per bit” value to quantify the
needed energy for the successful transmission of one bit, and to minimize this energy by
changing the sending power. He proves that with variation of sending power and keeping
all other parameters (like packet length, distance between sender and receiver, receiver gain,
etc.) constant, such a minimum can be found: Obviously, increasing sending power leads to
higher energy consumption of the sending attempts. On the other hand decreasing sending
power leads to increasing loss probability of a transmitted packet, thus causing
retransmissions of the lost packets (Ebert & Wolisz, 1999; Ebert & Wolisz, 2000; Burns &
Ebert, 2001). Using appropriate simulations, an optimum can be found easily.
This approach can be applied for multi-hop ad-hoc networks (Matzen et al., 2003; Ebert,
2004), considering different routes and using the shortest links to save energy (the energy
per bit value is lower for shorter distances), yet the dynamics (changing distances between
nodes) are still not considered. It is possible to send packets with well calculated sending
power at any time, but all data are sent immediately after their “production” (e.g. by sensors
which measure periodically some environmental parameters).
In our scenarios we considered a moving sender and (one or more) fixed receiver(s). For a
moving sender, it is profitable to consider also the sending times: Sending at the moment of
minimal distance will optimise the energy per bit value. Thus, we integrated a distance
model into our approach. The idea is to predict the further movement and to send during
the time(s), when the sender is closest to the receiver(s).
We used a time discrete approach for our model, as the data generation is done that way by
the sensors (depending on their sampling rate). Although we use the packet length as an
input factor, we do not use packet simulations. Bit errors influence the data flows in a
statistical manner, thus our model complies with the approach of Haber et al. (Haber et al.,
2003) for fluid simulations of data streams.
2.2 Model Assumptions
The basic assumptions for our model are:
Energy is stored in capacitors of a defined size; the efficiency of storing energy is
dependent on the filling level of the capacitors.
A data buffer storage of a defined size is used on the sender side to store some
sensor data.
The data storage is organised as a ring buffer, thus a full storage will lead to data
loss (new data is written over old data which has not been successfully transmitted
on time).
The optimization criterion is given by amount of successfully transmitted data
(with given energy).
The adjustable parameters are: The sending power, the packet length and the
sending time(s).
Sending power and packet length are optimized according to the Ebert model. To take into
account the dynamics of the movement, we do not send immediately, but store the
produced data in the local buffer and calculate the optimal sending times according to the
distance model. Our approach is simple, but effective: We calculate whether the sender is
approaching or departing a base station. In the first case we are waiting, in the latter case we
are sending data (with some constraints, see below: sending strategy).
Additionally we integrated a sub-model for the energy production side, although being
logically independent from the optimisation strategy. The reasons for this are first the fact
that the time of energy generation has direct influence on the optimisation result and second
the complex constraints in storing energy, especially when using capacitors.
2.3 Sending Strategy
This strategy makes implicit predictions about the further movement: If the sender has been
approaching a base station during the last period, the predicted value for the further
movement in the next period is a further approach (thus, sending later will be more efficient
due to lower distances). If the sender has been departing during the last period, the
predicted value for the further movement in the next period is a further departure (thus,
sending later will be less efficient due to higher distances).
The downside of this strategy is the transmission delay of the sensor data. As we are waiting
for energy optimal conditions, we can not guarantee maximum delay values, thus this
approach is clearly not real-time capable. However in field surroundings which are
naturally unsafe (the successful transmission can not be guaranteed anyway due to the
sparse available energy) this drawback seems acceptable for us.
There are some other constraints in our sending strategy which shall ensure an efficient use
of the available energy:
Loss Threshold: If the probability of a packet loss is above a predefined threshold
(which is the case for instance if the distance between sender and receiver is too
long), we do not attempt to send.
Data Threshold: If the amount of stored data increases a threshold (which is set to
data buffer capacity minus the amount of newly produced data per time unit here,
meaning that after the next cycle data loss can be expected, if no data can be
successfully transmitted), we are sending data regardless the movement to or from
a receiving base stations.
Upper and Lower Energy Threshold: If the filling level of the energy storage
exceeds an upper energy threshold, we make a sending attempt regardless the
MobileandWirelessCommunications:Physicallayerdevelopmentandimplementation254
movement of the sender, provided that energy level after sending is not expected
to fall below a lower energy threshold. The reason for the upper threshold is that
we might not be able to store the newly produced energy in the energy storage (e.g.
capacitors), when the storage is already charged too high (see below: energy
management). The reason for the lower threshold is that sending attempts at great
distances would lead to almost emptying the storage at just one cycle tick.
Especially in scenarios with few newly produced energy (see below: simulation
scenarios) this could cause a sending inability even at energetically auspicious
situations.
Figure 1 shows the flow chart of the sending strategy:
Fig. 1. Sending strategy flow chart
2.4 Simulation Scenarios
We applied our model to several practical application scenarios:
The skiing scenario (Veichtlbauer & Dorfinger, 2007): A skier is equipped with
intelligent skis with integrated sensors and energy harvesters. The sensors collect
data in regularly intervals and store them in the local buffer. The energy harvesters
produce energy during the run, e.g. by electromagnetic induction (EnOcean, 2007).
AUniedDataandEnergyModelforWireless
CommunicationwithMovingSendersandFixedReceivers 255
movement of the sender, provided that energy level after sending is not expected
to fall below a lower energy threshold. The reason for the upper threshold is that
we might not be able to store the newly produced energy in the energy storage (e.g.
capacitors), when the storage is already charged too high (see below: energy
management). The reason for the lower threshold is that sending attempts at great
distances would lead to almost emptying the storage at just one cycle tick.
Especially in scenarios with few newly produced energy (see below: simulation
scenarios) this could cause a sending inability even at energetically auspicious
situations.
Figure 1 shows the flow chart of the sending strategy:
Fig. 1. Sending strategy flow chart
2.4 Simulation Scenarios
We applied our model to several practical application scenarios:
The skiing scenario (Veichtlbauer & Dorfinger, 2007): A skier is equipped with
intelligent skis with integrated sensors and energy harvesters. The sensors collect
data in regularly intervals and store them in the local buffer. The energy harvesters
produce energy during the run, e.g. by electromagnetic induction (EnOcean, 2007).
The energy generation is dependent on the movement (see fig.2). The energy is
used to transmit the sensor data to a single fixed receiver.
The cloud scenario (Dorfinger & Veichtlbauer, 2008): 20 Sensors are placed by an
aeroplane to perform several measurement tasks in the air. They communicate
with a grid of 16 fixed receivers on the ground, forming a 4.5 x 4.5 km square in
total. Energy is stored in capacitors with total capacity of 600 µF. They are fully
loaded at the start of their operation, i.e. they have an initial voltage of 12 V. No
new energy is generated during the operation.
In order to examine the results of our model approach in different environments, we
conducted several simulations with these scenarios. For the skiing scenario we made some
additional assumptions (see above: model assumptions):
The sender moves in different moving patterns along the fixed receiver (WLAN
base station): We used straight moves, 2 different sine curves and a combination of
sine and straight movement (see fig. 2).
Energy is generated only at the sine parts (with 4 “passes” per second). The
amount of produced energy per pass (see below: energy management) on the
sender side is constant.
For storing the energy (see below: energy management) we used 5 capacitors with
47 µF capacity each.
The amount of produced (sensor) data per pass (and thus per time unit) on the
sender side is constant.
Fig. 2. Movement pattern of skiing scenario
2.5 Energy Management
For those scenarios where new energy is produced during operation (e.g. the skiing
scenario) we assumed that the energy is provided by an energy harvester, e.g. the ECO 100
from EnOcean (EnOcean, 2007). This was motivated by our work in the project ASki where
we built a prototype for the skiing scenario with an energy harvester placed on a ski. For
those scenarios where all energy is pre-loaded (e.g. the cloud scenario) we used the same
model, just setting the amount of energy generated during operation to zero.
The energy harvester is able to provide a voltage (see fig. 3) showing periodical peaks
(“passes”). The original voltage pulse (green) is approximated by a triangle voltage (yellow),
which is assumed to be our input voltage curve. The triangle voltage is described by the
maximum input voltage and the duration of the pass. This model can be easily adapted to
work with any kind of periodical energy source.
MobileandWirelessCommunications:Physicallayerdevelopmentandimplementation256
When using capacitors, energy can only be stored provided that the voltage of the produced
energy is higher than the current voltage level in the capacitor (red). Thus, for all scenarios
where we are able to produce new energy in the field, it is beneficial to keep the energy
filling status on a lower level, as it is easier to charge the capacitors then. This can be done
by setting the upper energy threshold to a comparatively lower level. The amount of energy
which can be stored in capacitors is modelled in an extra sub-model (see below: energy
storage model).
If we do not produce new energy, but use only stored energy from external sources, this
constraint will be kept inactive by setting the upper energy threshold to the energy storing
capacity (see above: sending strategy). Hence it is possible to use the same model without
changes.
Fig. 3. Useable energy of triangle voltage
The amount of consumed energy per transferred bit is first dependent on the sending
power. Second the packet loss probability has influence, because lost packets have to be
retransmitted. The occurrence of a packet loss is dependent on the distance between sender
and receiver, the packet length (Pl) as well as on the sending power. Yet it is a stochastic
event, which has to be modelled properly (see below: loss model).
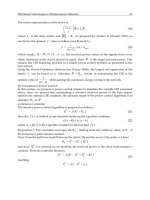
The probability of a packet loss is called packet error rate (PER). It is calculated based on the
bit error rate (BER): PER = (1-(1-BER)
Pl
). In the simulations we used a random number
AUniedDataandEnergyModelforWireless
CommunicationwithMovingSendersandFixedReceivers 257
When using capacitors, energy can only be stored provided that the voltage of the produced
energy is higher than the current voltage level in the capacitor (red). Thus, for all scenarios
where we are able to produce new energy in the field, it is beneficial to keep the energy
filling status on a lower level, as it is easier to charge the capacitors then. This can be done
by setting the upper energy threshold to a comparatively lower level. The amount of energy
which can be stored in capacitors is modelled in an extra sub-model (see below: energy
storage model).
If we do not produce new energy, but use only stored energy from external sources, this
constraint will be kept inactive by setting the upper energy threshold to the energy storing
capacity (see above: sending strategy). Hence it is possible to use the same model without
changes.
Fig. 3. Useable energy of triangle voltage
The amount of consumed energy per transferred bit is first dependent on the sending
power. Second the packet loss probability has influence, because lost packets have to be
retransmitted. The occurrence of a packet loss is dependent on the distance between sender
and receiver, the packet length (Pl) as well as on the sending power. Yet it is a stochastic
event, which has to be modelled properly (see below: loss model).
The probability of a packet loss is called packet error rate (PER). It is calculated based on the
bit error rate (BER): PER = (1-(1-BER)
Pl
). In the simulations we used a random number
based on PER to determine whether the packet has been transmitted correctly or not. If the
data is received correctly, it can be deleted from the sender’s data storage.
3. Implementation of the Model
In the following our basic model and all of its sub-components (blocks) are described in
detail. As model description language MATLAB/Simulink was used.
3.1 Basic Model
Our basic model consists of two main blocks (see fig. 4): The Energy Storage block,
where the energy generation and energy storage behaviour is modelled (see below: Energy
storage model), and the Energy Cons block (see below: Energy consumption model)
modelling the energy consumption of the WLAN sender. The model has three input
parameters:
The energy produced during the last time interval
The data produced by the sensors during the last time interval
The current distance between the WLAN sender and the base station
The main interest is to successfully transmit as many data as possible. Furthermore we want
to keep the amount of data that is overwritten in the data storage before being successfully
transmitted (which is lost then) minimal. Consequently the output parameters of our basic
model are:
The aggregate of received data over simulation time
The aggregate of overwritten (lost) data over simulation time
Fig. 4. Basic Model
MobileandWirelessCommunications:Physicallayerdevelopmentandimplementation258
3.2 Energy Storage Model
The main building block of the energy storage model (see fig.5) is a MATLAB function that
calculates the current energy in the storage. As input parameter the model gets the energy
produced during the last time interval (Ein) and the energy consumed during the last
interval (Econs). The output is the available energy for transmission (E_avail).
For energy production we use an energy harvester (EnOcean, 2007); for energy storage we
use common capacitors. The model uses the following parameters:
Total capacity of the capacitors (C)
Resistance of capacitor (Rc)
Maximum voltage of energy triangle (Ugmax)
Duration of the energy pass (dur_pass)
Minimum voltage difference between energy source and capacitor that is needed to
load the capacitors (Uckorr)
Energy per pass (Ep)
Maximum energy that can be stored in the capacitors (Estoremax)
Minimum energy in capacitors, i.e. energy that remains in capacitors and can not
be used by energy consumers (Estoremin)
Fig. 5. Energy Storage Model
3.3 Energy Consumption Model
The energy consumption model (see fig. 6) consists of 6 main blocks:
Distance model (Dist_model): Prediction of the further movement of the sender
and calculation of the sending position
AUniedDataandEnergyModelforWireless
CommunicationwithMovingSendersandFixedReceivers 259
3.2 Energy Storage Model
The main building block of the energy storage model (see fig.5) is a MATLAB function that
calculates the current energy in the storage. As input parameter the model gets the energy
produced during the last time interval (Ein) and the energy consumed during the last
interval (Econs). The output is the available energy for transmission (E_avail).
For energy production we use an energy harvester (EnOcean, 2007); for energy storage we
use common capacitors. The model uses the following parameters:
Total capacity of the capacitors (C)
Resistance of capacitor (Rc)
Maximum voltage of energy triangle (Ugmax)
Duration of the energy pass (dur_pass)
Minimum voltage difference between energy source and capacitor that is needed to
load the capacitors (Uckorr)
Energy per pass (Ep)
Maximum energy that can be stored in the capacitors (Estoremax)
Minimum energy in capacitors, i.e. energy that remains in capacitors and can not
be used by energy consumers (Estoremin)
Fig. 5. Energy Storage Model
3.3 Energy Consumption Model
The energy consumption model (see fig. 6) consists of 6 main blocks:
Distance model (Dist_model): Prediction of the further movement of the sender
and calculation of the sending position
Parameter model (ideal send param): Calculation of ideal parameters for data
transmission
Data storage (data storage): Calculation of the current filling level of the data
buffer storage
Sending decision (send data?): Decision whether to send data in the next time
slot or not
Link loss model (link loss): Determination of successfully transmitted and
corrupted data packets (which have to be retransmitted and can not be deleted
from the data storage)
Data aggregation (Aggregate): Aggregation of successfully transmitted and lost
data bits
Input signals for the energy consumption model are: The current distance (Distance), the
data produced during the last interval (data) and the available energy from the energy
storage (Eavail).
Output signals are: The consumed energy (Econs), the data successfully transmitted to the
base station (data_rec) and the data lost by overwriting them in the data storage
(data_lost).
Fig. 6. Energy Consumption Model
3.4 Distance Model
The distance model (see fig. 7) calculates whether the sender is moving towards the base
station or departing from the receiver by comparing the current distance with the distance
of the previous clock cycle and assuming that the movement continues that way also for the
upcoming cycle time. From that movement prediction the sending distance (which is then
used for the calculation of the other sending parameters) is derived.
MobileandWirelessCommunications:Physicallayerdevelopmentandimplementation260
As argued by Ebert (Ebert, 2004), it is better to overestimate the distance than to
underestimate it, because the sending power adaptation is not symmetric: If the sending
power is too low, the loss probability (and thus the energy per correct transmitted bit)
increases much faster than the energy per sent packet increases in the case when the sending
power is too high.
Consequently for a movement towards the base station the output value for the distance is
the current position, whereas for a movement departing from the base station the output
value is an estimation of the position at the end of the time interval. As it is assumed that the
movement continues the same way as in the last time interval, the estimated position is the
current position plus the movement during the last time interval.
Fig. 7. Distance Model
3.5 Parameter Model
The parameter model consists basically of a MATLAB function which calculates the ideal
sending parameters based on the Ebert model (Ebert, 2004).
As input parameters the MATLAB function receives technical parameters describing the
WLAN connection: Sender gain, receiver gain, fade margin, receiver noise, bandwidth,
sending rate, loss threshold, sending duration for 1 bit, wave length, noise, maximum packet
size without header, overhead, and a correction constant. We kept these parameters
constant in our simulations, yet they could easily be varied over time by setting appropriate
values in the MATLAB configuration file. Furthermore the distance between sender and
receiver is used as variable input parameter to the parameter model.
As output parameter we retrieve the ideal sending power (Ptxmin), the energy needed for
transmission of one bit (Ebitmin), the probability that a packet is successfully transmitted
(eta) and the ideal packet length for the transmission (Pl_ideal).
3.6 Data Storage Model
The data storage model calculates the current filling status of the data buffer storage by
subtracting the data which has been successfully transmitted in the last time interval
(rec_data) from last cycle’s filling level and adding the data which has been newly
produced during the last time interval (newdata). These two values are the input
parameters of the data storage model.
AUniedDataandEnergyModelforWireless
CommunicationwithMovingSendersandFixedReceivers 261
As argued by Ebert (Ebert, 2004), it is better to overestimate the distance than to
underestimate it, because the sending power adaptation is not symmetric: If the sending
power is too low, the loss probability (and thus the energy per correct transmitted bit)
increases much faster than the energy per sent packet increases in the case when the sending
power is too high.
Consequently for a movement towards the base station the output value for the distance is
the current position, whereas for a movement departing from the base station the output
value is an estimation of the position at the end of the time interval. As it is assumed that the
movement continues the same way as in the last time interval, the estimated position is the
current position plus the movement during the last time interval.
Fig. 7. Distance Model
3.5 Parameter Model
The parameter model consists basically of a MATLAB function which calculates the ideal
sending parameters based on the Ebert model (Ebert, 2004).
As input parameters the MATLAB function receives technical parameters describing the
WLAN connection: Sender gain, receiver gain, fade margin, receiver noise, bandwidth,
sending rate, loss threshold, sending duration for 1 bit, wave length, noise, maximum packet
size without header, overhead, and a correction constant. We kept these parameters
constant in our simulations, yet they could easily be varied over time by setting appropriate
values in the MATLAB configuration file. Furthermore the distance between sender and
receiver is used as variable input parameter to the parameter model.
As output parameter we retrieve the ideal sending power (Ptxmin), the energy needed for
transmission of one bit (Ebitmin), the probability that a packet is successfully transmitted
(eta) and the ideal packet length for the transmission (Pl_ideal).
3.6 Data Storage Model
The data storage model calculates the current filling status of the data buffer storage by
subtracting the data which has been successfully transmitted in the last time interval
(rec_data) from last cycle’s filling level and adding the data which has been newly
produced during the last time interval (newdata). These two values are the input
parameters of the data storage model.
The storage has a maximum size (datamax), and is organised as a ring buffer, i.e. exceeding
the maximum value leads to data loss by overwriting the oldest stored data with the newly
produced data. Hence the output parameters are the filling level, i.e. the amount of data
which can be transmitted in this time interval (datatosend), and the amount of
overwritten data (data lost).
3.7 Sending Decision Model
The sending decision model (see fig. 8) calculates the amount of data that are sent in the
upcoming time interval.
Fig. 8. Sending Decision Model
It consists of five sub-models; each of them determines the number of packets that could be
sent taking into account different premises:
How many packets can be transmitted if all the available energy is spent for
transmission?
How many packets can be transmitted within one time interval?
How many packets can be filled with data from the storage?
MobileandWirelessCommunications:Physicallayerdevelopmentandimplementation262
How many packets should be transmitted to allow efficient usage of the energy
storage?
How many packets should be transmitted to prevent overwriting data in the data
storage?
The model provides us with three outputs:
The consumed energy
The sent data
The number of sent packets
The number of sent packets is zero if the probability of a packet loss on the link is greater
than a given threshold (see above: sending strategy).
If we are moving away from the base station, all data in the data storage are sent, except for
the rest that does not fill a full packet with ideal packet length. Thereby we are taking into
account the maximum amount of data that can be sent with the available energy and within
one time interval. If we are moving towards the base station the same energy and time
constraints are taken into account; furthermore we pay attention to the objectives to prevent
data loss in the data storage and to allow efficient energy storage (see above: energy
management).
In the next sub-sections some details about the main building blocks, including their input
and output parameters, are given.
3.8 Packet Energy Model
The packet energy building block (see fig. 9) receives the following input signals: The
available energy (Eavail), the ideal transmission power (Ptx), and the packet length
including overhead (pl_overh).
Output variables are: The energy per packet (Epkt), and the number of packets that can be
transmitted when consuming all available energy in the energy storage (pkts).
Fig. 9. Packet Energy Model
3.9 Interval Limit Model
The interval limit building block receives the packet length including overhead as input
parameter. It calculates the number of whole packets that can be sent within one time
interval, which is also the only output parameter.
AUniedDataandEnergyModelforWireless
CommunicationwithMovingSendersandFixedReceivers 263
How many packets should be transmitted to allow efficient usage of the energy
storage?
How many packets should be transmitted to prevent overwriting data in the data
storage?
The model provides us with three outputs:
The consumed energy
The sent data
The number of sent packets
The number of sent packets is zero if the probability of a packet loss on the link is greater
than a given threshold (see above: sending strategy).
If we are moving away from the base station, all data in the data storage are sent, except for
the rest that does not fill a full packet with ideal packet length. Thereby we are taking into
account the maximum amount of data that can be sent with the available energy and within
one time interval. If we are moving towards the base station the same energy and time
constraints are taken into account; furthermore we pay attention to the objectives to prevent
data loss in the data storage and to allow efficient energy storage (see above: energy
management).
In the next sub-sections some details about the main building blocks, including their input
and output parameters, are given.
3.8 Packet Energy Model
The packet energy building block (see fig. 9) receives the following input signals: The
available energy (Eavail), the ideal transmission power (Ptx), and the packet length
including overhead (pl_overh).
Output variables are: The energy per packet (Epkt), and the number of packets that can be
transmitted when consuming all available energy in the energy storage (pkts).
Fig. 9. Packet Energy Model
3.9 Interval Limit Model
The interval limit building block receives the packet length including overhead as input
parameter. It calculates the number of whole packets that can be sent within one time
interval, which is also the only output parameter.
3.10 Data Limit Model
The data limit building block has the following input parameters: The current level of data
in the data buffer storage, and the packet length without header. It calculates the number of
packets that can be filled with data from the storage. This is the only output parameter of
the data limit model.
3.11 Energy Efficiency Model
To make energy usage more efficient (see above: sending strategy), we use the energy
efficiency model (see fig. 10).
Fig. 10. Energy Efficiency Model
If the energy in the storage is above an upper threshold (Estorehigh), we transmit
ceil(1/eta*newdata/Pl) packets, where eta is the probability that a transmission is
successful, newdata is the amount of data stored in the last interval and Pl is the ideal
packet length without header.
Thereby we have to guarantee, that the energy stored in the capacitors does not fall below a
lower threshold (Estorelow) after data transmission, i.e. we transmit the maximum
possible number of packets such that the energy consumption by the data transmission is
low enough to keep this constraint.
3.12 Data Efficiency Model
The data efficiency model (see fig. 11) is used to prevent data loss in the storage during the
time when the sender is moving towards the base station.
MobileandWirelessCommunications:Physicallayerdevelopmentandimplementation264
If the amount of data in the storage plus the amount of data received in the upcoming time
interval is expected to exceed the capacity of the storage, we transmit a number of
ceil(1/eta*newdata/Pl) packets.
Fig. 11. Data Efficiency Model
The data efficiency model receives as input parameters: The number of packets that can be
sent with all available energy (pkts_energy), the probability that a packet is successfully
transmitted (eta), the data received in the last interval (newdata), the packet length (Pl)
and a prediction of the next filling level of the data storage (next_storage). The output
parameter is the number of packets that should be transmitted (pkts).
4. Parameter Tuning
In a number of simulations we have investigated the advantages of this model approach
compared to the Ebert model and to a non-optimised episodic protocol (Veichtlbauer &
Dorfinger, 2007; Dorfinger & Veichtlbauer, 2008; Veichtlbauer & Dorfinger, 2008). With
optimal parameter settings however, some percent additional efficiency gain could be
achieved.
To investigate the influence of different settings, several studies in the skiing environment
have been performed. Thereby the setup of the main factors that influence throughput and
data loss has been studied:
Capacity of energy storage
Size of data storage
Energy threshold
Loss threshold
For the simulation with different sizes of energy and data storages we got the expected
results: The bigger the storage, the greater the number of successfully transmitted packets,
and the lower the packet loss. For the setting of the energy thresholds we got similar results
for different parameter sets. In the performed scenarios there is no strong argument for a
certain parameter set of the energy thresholds.
AUniedDataandEnergyModelforWireless
CommunicationwithMovingSendersandFixedReceivers 265
If the amount of data in the storage plus the amount of data received in the upcoming time
interval is expected to exceed the capacity of the storage, we transmit a number of
ceil(1/eta*newdata/Pl) packets.
Fig. 11. Data Efficiency Model
The data efficiency model receives as input parameters: The number of packets that can be
sent with all available energy (pkts_energy), the probability that a packet is successfully
transmitted (eta), the data received in the last interval (newdata), the packet length (Pl)
and a prediction of the next filling level of the data storage (next_storage). The output
parameter is the number of packets that should be transmitted (pkts).
4. Parameter Tuning
In a number of simulations we have investigated the advantages of this model approach
compared to the Ebert model and to a non-optimised episodic protocol (Veichtlbauer &
Dorfinger, 2007; Dorfinger & Veichtlbauer, 2008; Veichtlbauer & Dorfinger, 2008). With
optimal parameter settings however, some percent additional efficiency gain could be
achieved.
To investigate the influence of different settings, several studies in the skiing environment
have been performed. Thereby the setup of the main factors that influence throughput and
data loss has been studied:
Capacity of energy storage
Size of data storage
Energy threshold
Loss threshold
For the simulation with different sizes of energy and data storages we got the expected
results: The bigger the storage, the greater the number of successfully transmitted packets,
and the lower the packet loss. For the setting of the energy thresholds we got similar results
for different parameter sets. In the performed scenarios there is no strong argument for a
certain parameter set of the energy thresholds.
The most interesting parameter in our simulations of the skiing scenario was the loss
threshold. We conducted simulation runs with several different movements, e.g. a straight
movement (see fig. 12, table 1) and a sine movement (see fig. 13, table 2).
Table 1 shows statistical results for different values of loss threshold in the skiing scenario
with straight movement. For each value 100 simulation runs have been performed.
Loss_th mean standard dev. 95% confidence interval min max
1.0 4.373.680 22.115 [4.369.346, 4.378.014] 4.330.832 4.443.256
0.9 4.365.656 22.223 [4.361.300, 4.370.011] 4.313.576 4.444.368
0.5 4.342.520 25.479 [4.337.526, 4.347.514] 4.273.690 4.401.360
0.3 4.292.992 22.868 [4.288.509, 4.297.474] 4.241.280 4.347.520
0.1 4.136.336 19.153 [4.132.582, 4.140.897] 4.090.376 4.192.672
Table 1. Throughput for different values of loss threshold with straight movement
0 10 20 30 40 50 60 70 80 90 100
0
0.5
1
1.5
2
2.5
3
3.5
4
4.5
x 10
6
time [s]
received data [Bit]
1.0
0.9
0.5
0.3
0.1
Fig. 12. Received data for different values of loss threshold with straight movement
As it can be seen, the lower the loss threshold is set, the less data is received. A detailed
analysis has shown that it would be beneficial to use different settings for loss threshold in
the approaching phase and in the departing phase of a simulation of the skiing scenario:
During the approaching phase a loss threshold of about 0.9 would perform best. During the
departure phase transmission attempts should be performed as long as there is a possibility
to successfully transmit data packets, thus the loss threshold should be set to 1.
MobileandWirelessCommunications:Physicallayerdevelopmentandimplementation266
Table 2 shows statistical results for different values of loss threshold in the skiing scenario
with sine movement. Again, for each value 100 simulation runs have been performed.
Loss_th mean Standard dev. 95% confidence interval min max
1.0 4.357.283 22.628 [4.352.848, 4.361.718] 4.304.752 4.401.944
0.9 4.356.078 21.182 [4.351.926, 4.360.230] 4.311.872 4.400.640
0.5 4.336.494 23.374 [4.331.913, 4.341.076] 4.269.368 4.386.384
0.3 4.277.693 22.323 [4.273.317, 4.282.068] 4.215.872 4.343.960
0.1 4.118.336 21.435 [4.114.134, 4.122.537] 4.038.416 4.154.080
Table 2. Throughput for different values of loss threshold with sine movement
0 10 20 30 40 50 60 70 80 90 100
0
0.5
1
1.5
2
2.5
3
3.5
4
4.5
x 10
6
time [s]
received data [Bit]
1.0
0.9
0.5
0.3
0.1
Fig. 13. Received data for different values of loss threshold with sine movement
Also for the sine movement pattern in the skiing scenario a loss threshold of 1 performs best.
This is in contrast to our findings for the cloud scenario (Veichtlbauer & Dorfinger, 2008),
where we concluded that for pre-loaded energy sources smaller values for the loss threshold
lead to better performance.
An overall conclusion of our investigations in setting the loss threshold parameter is that it
depends very strongly on the kind of energy source how to optimise the parameter setting.
For pre-loaded energy sources with no further energy generation during the simulation a
small value for the loss threshold is advisable, whereas for energy sources that supply
energy during the run (energy harvesters) a loss threshold near to 1 should be used.
AUniedDataandEnergyModelforWireless
CommunicationwithMovingSendersandFixedReceivers 267
Table 2 shows statistical results for different values of loss threshold in the skiing scenario
with sine movement. Again, for each value 100 simulation runs have been performed.
Loss_th mean Standard dev. 95% confidence interval min max
1.0 4.357.283 22.628 [4.352.848, 4.361.718] 4.304.752 4.401.944
0.9 4.356.078 21.182 [4.351.926, 4.360.230] 4.311.872 4.400.640
0.5 4.336.494 23.374 [4.331.913, 4.341.076] 4.269.368 4.386.384
0.3 4.277.693 22.323 [4.273.317, 4.282.068] 4.215.872 4.343.960
0.1 4.118.336 21.435 [4.114.134, 4.122.537] 4.038.416 4.154.080
Table 2. Throughput for different values of loss threshold with sine movement
0 10 20 30 40 50 60 70 80 90 100
0
0.5
1
1.5
2
2.5
3
3.5
4
4.5
x 10
6
time [s]
received data [Bit]
1.0
0.9
0.5
0.3
0.1
Fig. 13. Received data for different values of loss threshold with sine movement
Also for the sine movement pattern in the skiing scenario a loss threshold of 1 performs best.
This is in contrast to our findings for the cloud scenario (Veichtlbauer & Dorfinger, 2008),
where we concluded that for pre-loaded energy sources smaller values for the loss threshold
lead to better performance.
An overall conclusion of our investigations in setting the loss threshold parameter is that it
depends very strongly on the kind of energy source how to optimise the parameter setting.
For pre-loaded energy sources with no further energy generation during the simulation a
small value for the loss threshold is advisable, whereas for energy sources that supply
energy during the run (energy harvesters) a loss threshold near to 1 should be used.
5. Conclusion
As a result of our simulations we can see a remarkable improvement (Veichtlbauer &
Dorfinger, 2007; Dorfinger & Veichtlbauer, 2008) of the use of energy compared with the
underlying Ebert model (Ebert, 2004). Yet the efficiency gain is very much dependent on the
applied scenario. Especially in scenarios where energy is produced regularly during the
operation of the communication system, the gain is only a few percent.
However, energy efficiency is a much more critical issue in scenarios where no or only
sporadic energy production is possible. Our model has been developed for mobile scenarios
with sparse energy. Here the strengths of our approach come into effect, as we have proved
in the mentioned examples.
6. Future Work
Obviously, energy is consumed not only by (sending and receiving) antennas, but also in
other parts of embedded systems (especially microcontrollers/microprocessors) – yet our
focus was set on the communication aspects, and we disregarded all other energy
consumers. Furthermore, we just touched on the topic of energy generation. Basically, we
assumed that energy is either stored (in capacitors or batteries) or produced live according
to the movement pattern of the sender. In both areas very interesting future research topics
can be defined.
We are especially interested in the question of the “distribution of intelligence” in the
network (i.e. should calculations be performed locally and their results be transmitted to a
data base, or should just the raw data be transmitted and the calculation be performed
centrally?). We consider that this topic has the potential for several years of research in
future research projects. We have already made some effort in the application domain of
ICT support for dynamic evacuation.
The challenge is to decentralise the intelligence of an evacuation support system for
emergency cases (fire or gas in a building) in order to provide situational and personalised
information for evacuees without overloading the network nodes. Besides energy aspects (in
case of a breakdown of the regular power supply) one has to face real-time, safety and
security aspects. Thus policies determining which data have to be transmitted when and
where have to be defined (Hofmann et al., 2009).
Another research challenge is to define standards for open sensor/actuator systems for
building automation. Our goal is the prototypical realisation of a generic in-house
communication infrastructure providing a multi-user/multi-application approach, i.e. every
registered user has access to sensor data (if allowed; also a billing system is possible here)
and to applications that perform control tasks (e.g. remote heating/cooling). Similar
solutions can be thought of also for traffic control. For instance a driver could access traffic
data and plan/modify the route of the journey according to the collected sensor data.
7. References
Burns, B.; and Ebert, J. P. (2001) Power Consumption, Throughput and Packet Error
Measurement of IEEE 802.11 WLAN Interface2. TKN Technical Report TKN-01-007,
Berlin, August 2001.
MobileandWirelessCommunications:Physicallayerdevelopmentandimplementation268
Dorfinger, P.; and Veichtlbauer, A. (2008) Simulation of Energy Efficient Communication
from Flying Sensors to a Grid of Base Stations on the Ground. Proceedings of the 15th
International Conference on Telecommunications (ICT 2008), St. Petersburg, June 2008
Ebert, J. P.; and Wolisz, A. (1999) Power Saving in Wireless LANs: Analysing the RF
Transmission Power and MAC Retransmission Trade-Off. ITG Fachbericht 157, pp
187- 192, Munich, October 1999.
Ebert, J. P.; Trammel, B.; Wiederhold, E.; and Wolisz, A. (2000) Energy-efficient Power
Control Approach for WLANs. Journal of Communications and Networks (JCN),
September 2000.
Ebert, J. P.; and Wolisz, A. (2000) Combined Tuning of RF Power and Medium Access
Control for WLANs. Journal of Mobile Networks & Applications, vol. 6, no 5, pp 417-
426, Berlin, September 2000.
Ebert, J. P.; Aier, S.; Kofahl, G.; Becker, A.; Burns B.; and Wolisz, A. (2002) Measurement and
Simulation of the Energy Consumption of WLAN Interface. TKN Technical Report
TKN-02-010, Berlin, June 2002.
Ebert, J. P. (2004) Energies-efficient Communication in Ad Hoc Wireless Local Area
Networks. Dissertation, TU Berlin
EnOcean GmbH (2007): Energy harvester ECO 100. Internet Document, May 2007
Gilbert, E. N. (1960) Capacity of a burst-noise channel. Bell Systems Technical Journal, 39:1253–
1265, September 1960
Haber, P.; Bergholz, G.; Hofmann, U.; Miloucheva, I. (2003) Time and Rate Continuous
Multiclass Fluid Simulation Model for Inter-domain traffic flow simulation.
Proceedings of the first international workshop on Inter-domain performance and
simulation (IPS 2003), Salzburg, Februar 2003
Hofmann, U.; Miloucheva, I.; and Veichtlbauer, A. (2009) Dynamic Evacuation Architecture
using Context-Aware Policy Management. International Journal of Computer Science
and Applications, Year 2009: Volume VI Issue II - Special Issue on Networking Mobile
Virtual Knowledge, Feb. 2009
Matzen, B.; Ebert, J. P.; and Karl, H. (2003) Electromagnetic emission reduction for radio
communication networks by using a multi hop ad hoc approach. TKN Technical
Report TKN-03-004, Berlin, February 2003.
Veichtlbauer, A.; and Dorfinger, P. (2007) Modeling of Energy Efficient Wireless
Communication. Proceedings of the 2007 International Conference on Software,
Telecommunications and Computer Networks (SoftCom 2007), September 2007
Veichtlbauer, A.; and Dorfinger, P. (2008) Energy Efficient Communication in a Skiing
Environment. Proceedings of the 7th International Conference Communications 2008
(COMM 2008), Bukarest, June 2008
Veichtlbauer, A.; and Dorfinger, P. (2009) Modeling and Simulation of Energy Efficient
Communication in a Skiing Environment. MTA Review Vol. XIX, No. 1, pp. 55-76,
March 2009
Zyren, J.; and Petrik, A. (1998) Tutorial on Basic Link Budget Analysis. Application Note
AN9804
, Harris Semiconductor, April 1998.
Towards Performance Enhancement of Short Range
Wireless Communications in Reliability - and Delay-Critical Applications 269
X
Towards Performance Enhancement of Short
Range Wireless Communications in Reliability-
and Delay-Critical Applications
Yang Liu and Ye Liu
Department of Computer Science, University of Vaasa
PL 700, 65101 Vaasa, Finland
Email:
1. Introduction
More and more applications demand highly reliable and low latency short range wireless
communications nowadays, one extreme example of which is the wireless communication
used in RoboCup Small Size League (SSL) robots (Liu et al, 2007). RoboCup is the world’s
top level international robotics competition held every year, and SSL is for a team of
multiple fast-moving robots under a dynamic environment to autonomously play soccer
game against another team. Due to the highly dynamic nature of the competition, the
requirements and constraints for the wireless communication are extremely tight. The
challenge is that wireless communication is involved in the control loop and therefore the
reliability and propagation delay are vital factors which directly affect the team
performance. Beside, various interferences with known and unknown frequency /
transmission power usually present at the competition site, which is hazardous environment
to achieve reliable and low latency performance for wireless communication. This study
investigates the performance strengths and weaknesses of various short range wireless
communications e.g. RadioMetrix, IEEE 802.11a/b, IEEE 802.15.4, DECT, Linx, etc, whi
ch
are commonly used nowadays in different RoboCup SSL wireless communication
implementations. Unfortunately most of these commercial solutions are not able to provide
satisfactory performance to such kind of reliability- and delay-critical applications especially
under interferences. In the case study, a typical commercial short range wireless
communication module which has weak immunity to interference has been tested and its
performance has been evaluated with test bed. An adaptive error correction and frequency
hopping scheme (Liu, 2008) has been proposed to improve its immunity
to interference and
therefore enhance the wireless communication performance for reliability and delay-critical
applications. Such scheme can be easily adopted to similar applications using short range
wireless communications.
15
MobileandWirelessCommunications:Physicallayerdevelopmentandimplementation270
2. Communication System Design and Testing
2.1 Choosing wireless technologies
Many different wireless technologies have been considered for use in the robots. The main
ones are: RadioMetrix 433 MHz and 869 MHz RF, IEEE 802.11a/b, IEEE 802.15.4, DECT,
Linx, etc. While making decision which technology to choose, we also need to keep in mind
about RoboCup’s rules and regulations and also compliance with regulations of the country
hosting the competition. Before the competition all teams should notify the local organizing
committee of the wireless communication technology, power and frequency. To avoid direct
interference, each team should be able to select between at least two carrier frequency bands
before the match.
After experienced unsatisfied performance from the RF modules, the prospective choices are
from IEEE 802.11a/b, IEEE 802.15.4, DECT and Linx. Among these wireless technologies,
IEEE 802.11a/b is based on CSMA/CA and therefore considered not to be optimum
solution for real-time applications. According to Tse et al (2005), the performance of IEEE
802.15.4 drops significantly where there are many 802.11 terminals connected to access
points, which is the case at the competition site, and therefore this is not considered as
optimum solution either. Both DECT and Linx are designed to support voice transmission
capability and optimized for real-time performance, so the communication system for the
new generation robot design will use these two and choose the one which will perform
better during the competition, according to the opponent team’s radio to be used.
2.2 Designing the test bed
The purpose of this testing is to observe and study wireless communication performance of
Linx modules such as round trip delay, bit error, packet error, RSSI (Received Signal
Strength Indication), and how they are affected by interference. A test bed has been built to
carry out the tests and collect data to a PC. Both wireless transmitter and receiver modules
are connected to an ARM7 microcontroller UART port. The packets which have been
transmitted over wireless link are compared by ARM7 with the packages that have been
received. The testing data are sent to PC for further processing. The timer feature is used to
record the transmission time per each byte, and the result are also read by the
microprocessor and sent to PC. Linx HP3 RF modules also provide a RSSI function which is
connected to ADC so that a digital RSSI value can be read to indicate each byte’s signal
strength. The test bed simulates a full-duplex wireless transmission. Linx transmitter A will
send data through channel A to Linx receiver B. Transmitter B will send what receiver B
received through channel B to receiver A. In such way, we could measure the time delay for
the round trip, RSSI for both channel A and B, error rate of the data, etc.
Much attention has been put to design PCB carefully following the standard industrial
practices and choosing high quality components.
For testing purposes a test bed has been designed and implemented which will be able to
work with both DECT and Linx modules. Here we present briefly some board design issues
with some theoretical background when needed. The testing board is made of two parts: the
mother board and the daughter board for LCD display and buttons, which will be mounted
on top of the mother board.
The board can support both serial communication (through its DB9 female connector) and
Ethernet connection (using RJ-45 XPort jack). Serial connection is left for downwards